Embed Size (px)
Citation preview
FIRE SAFETY IN BUILDINGSFIRE SAFETY IN BUILDINGS
Dr. A.K. GuptaDr. A.K. GuptaScientistScientist
Central Building Research InstituteCentral Building Research InstituteROORKEE- 247 667ROORKEE- 247 667
What is Fire ?
FIRE is a process of combustion characterized by the evolution of Heat, Light, and Smoke.
SMOKE is the cloud of finely dispersed solid matter like soot. Gray colour is due to the presence of water vapours.
What is Building ?What is Building ?
Any structure that includes foundation, plinth, Any structure that includes foundation, plinth, walls, floors, roofs, chimneys, plumbing and walls, floors, roofs, chimneys, plumbing and building services intended to enclose any land building services intended to enclose any land or space is called a Buildingor space is called a Building
Building is dynamic systemBuilding is dynamic system Contents change with timeContents change with time
What we provide today becomes obsolete What we provide today becomes obsolete tomorrow. tomorrow. Hence,Hence, Safety requirements need regular Safety requirements need regular attentionattention
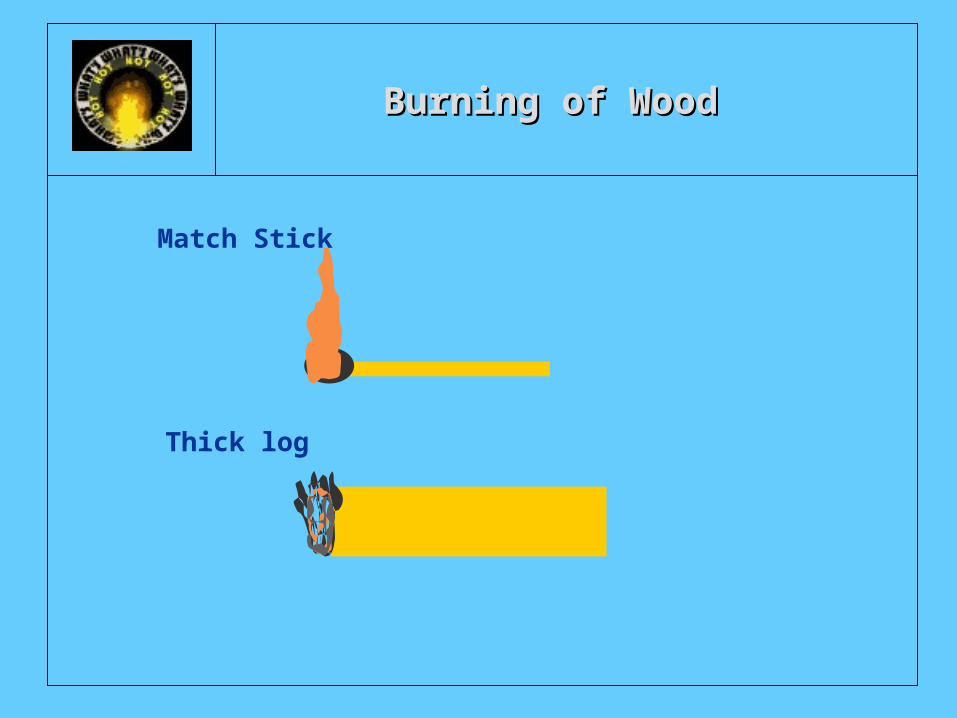
Burning of Wood Burning of Wood
Match Stick
Thick log
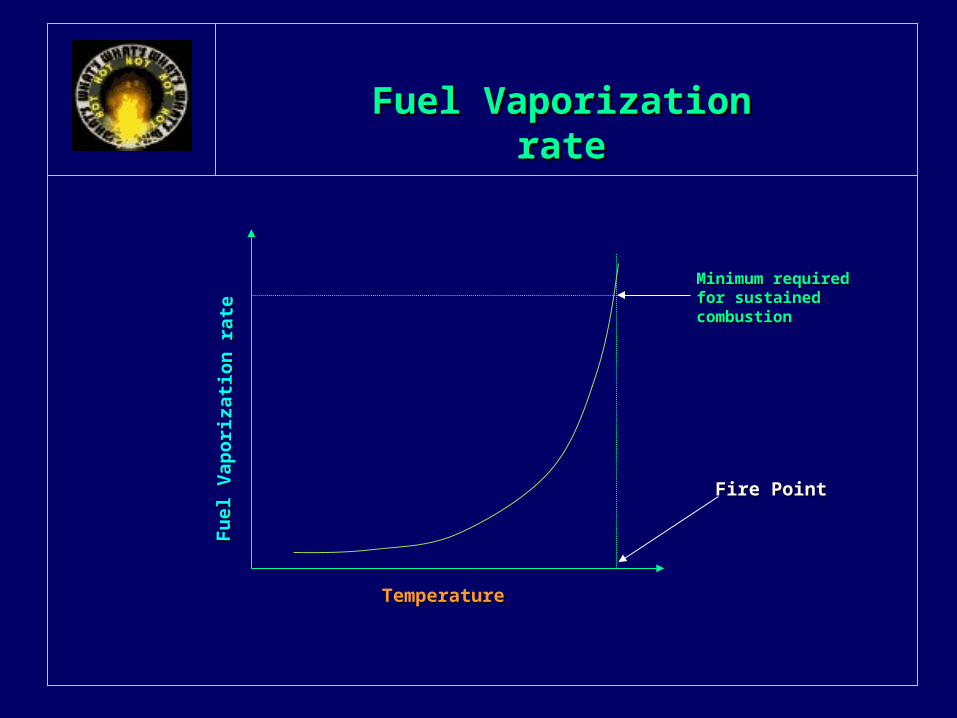
TemperatureTemperature
Fuel
Vap
ori z
ati o
n ra
teFu
el V
apor
i zat
i on
r ate
Fire PointFire Point
Minimum required for Minimum required for sustained combustionsustained combustion
Fuel Vaporization rateFuel Vaporization rate
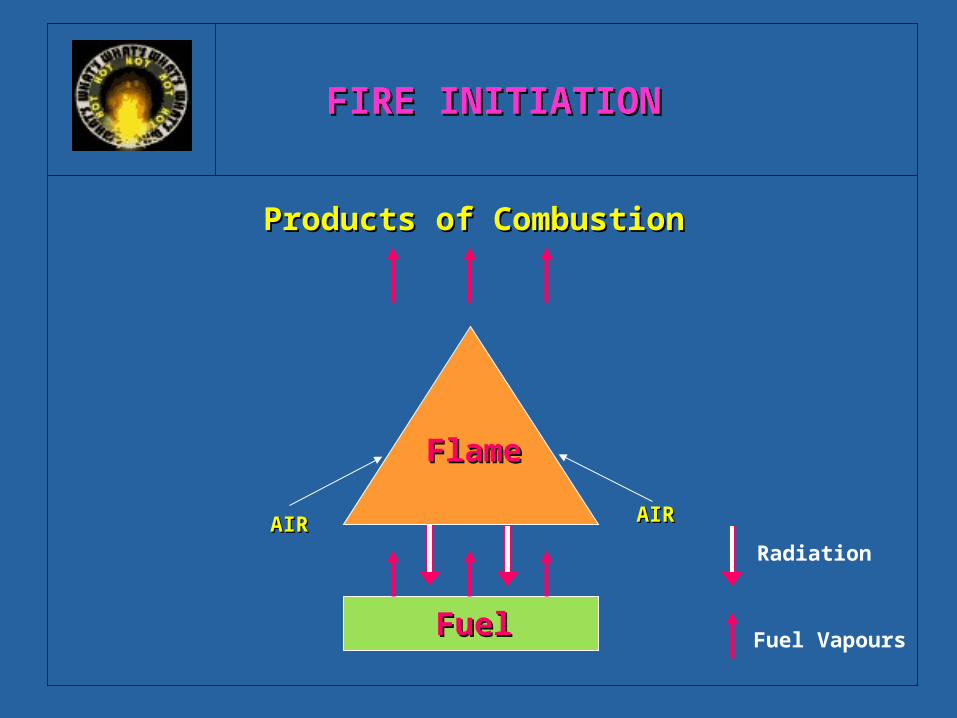
FIRE INITIATIONFIRE INITIATION
FuelFuel
FlameFlame
Products of CombustionProducts of Combustion
Radiation
Fuel Vapours
AIRAIR AIRAIR
Products of CombustionProducts of Combustion
SMOKE LIGHT (INFRA-RED) FLAME HEAT Pressure
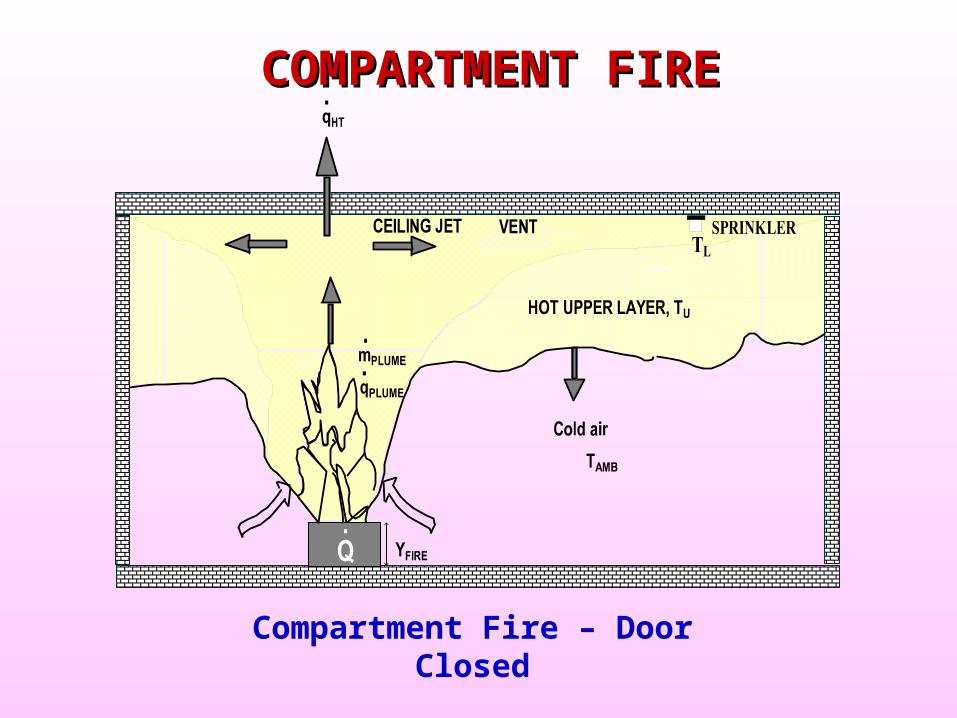
COMPARTMENT FIRECOMPARTMENT FIRE
Compartment Fire – Door Closed
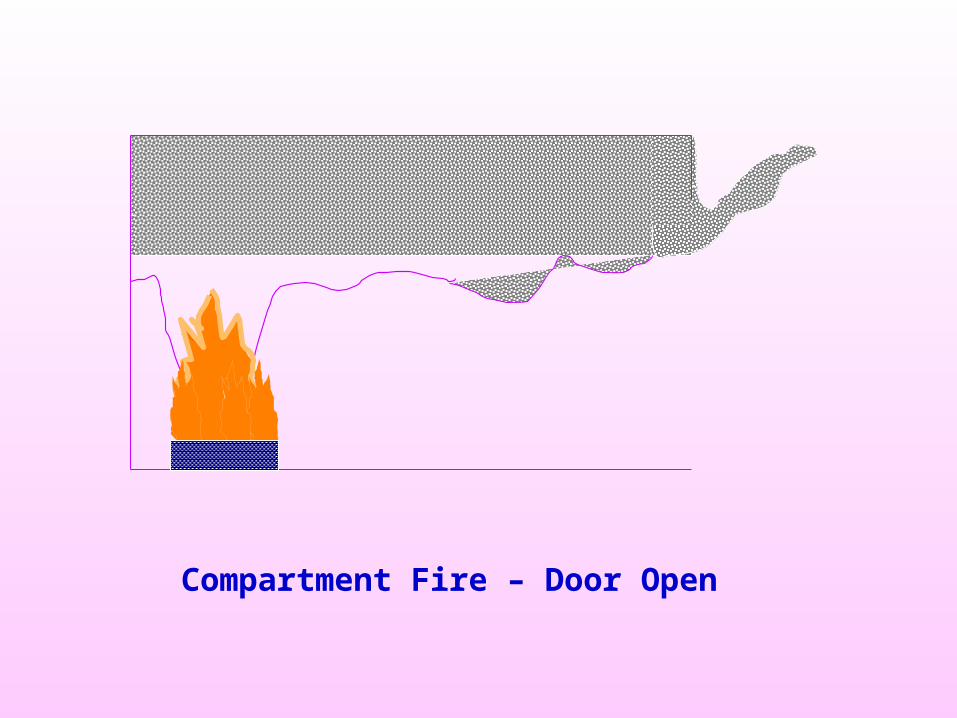
Compartment Fire – Door Open
1
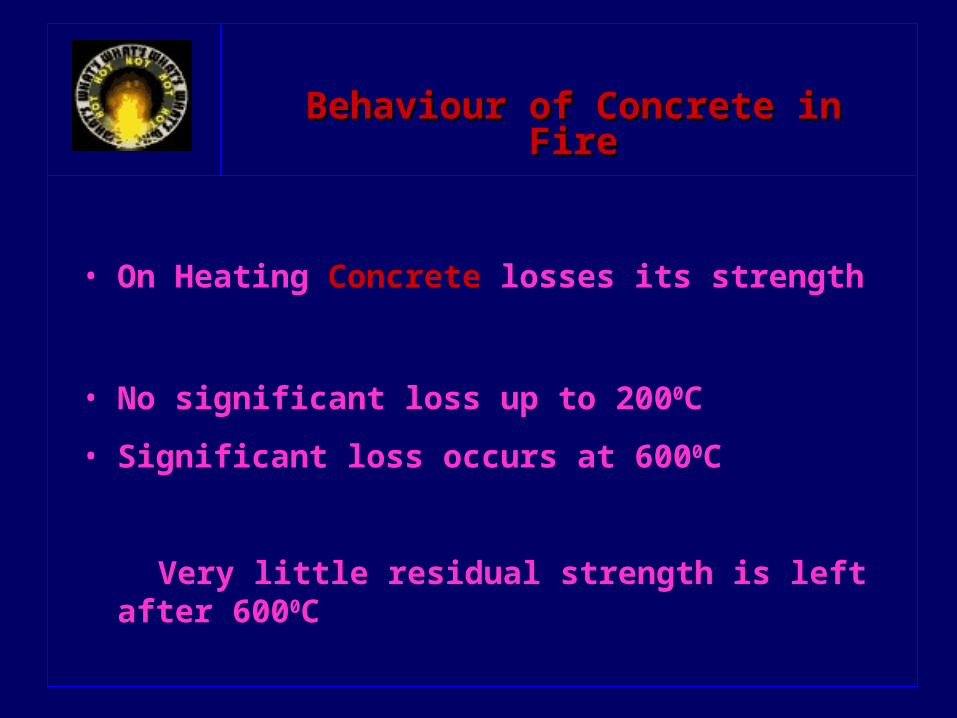
Behaviour of Concrete in FireBehaviour of Concrete in Fire
• On Heating Concrete losses its strength
• No significant loss up to 2000C
• Significant loss occurs at 6000C
Very little residual strength is left after 6000C
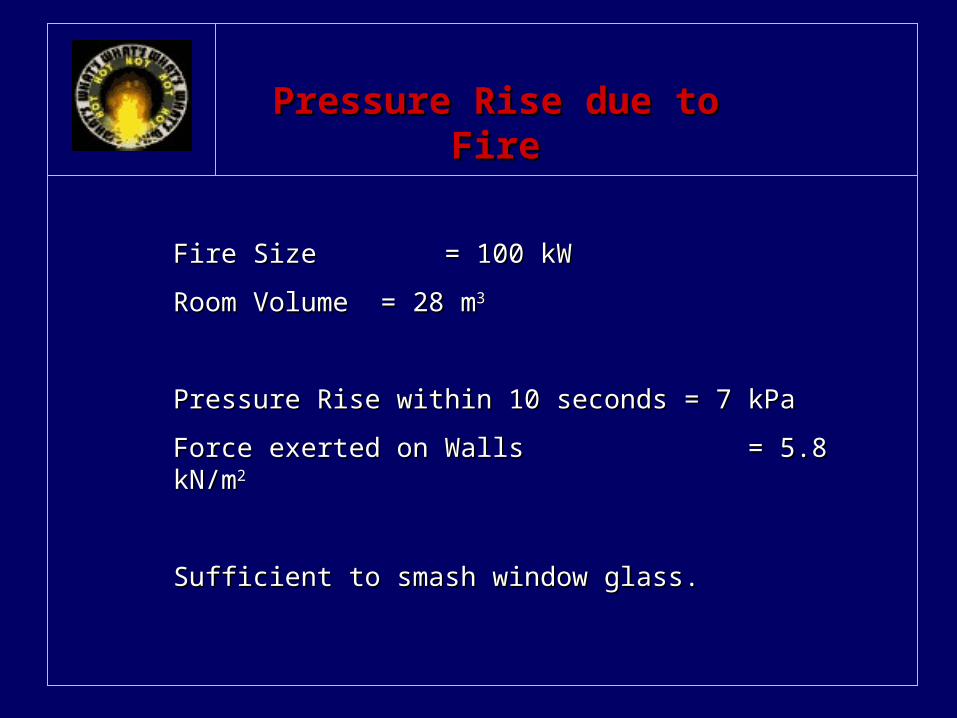
Pressure Rise due to FirePressure Rise due to Fire
Fire Size = 100 kWFire Size = 100 kWRoom Volume = 28 mRoom Volume = 28 m33
Pressure Rise within 10 seconds = 7 kPaPressure Rise within 10 seconds = 7 kPaForce exerted on Walls = 5.8 kN/mForce exerted on Walls = 5.8 kN/m22
Sufficient to smash window glass.Sufficient to smash window glass.
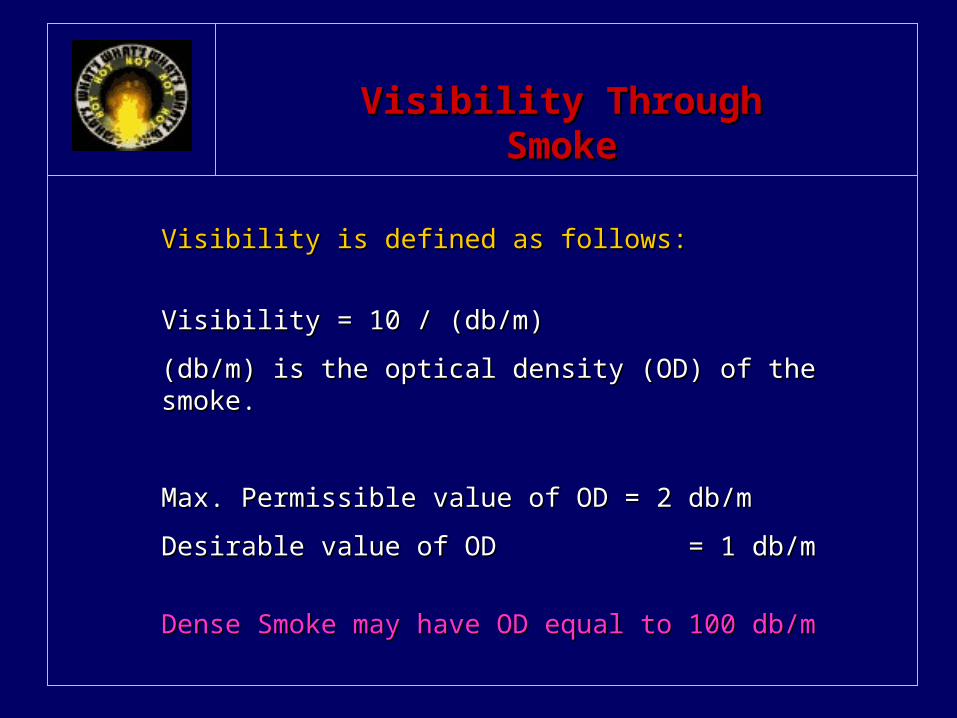
Visibility Through SmokeVisibility Through Smoke
Visibility is defined as follows:Visibility is defined as follows:
Visibility = 10 / (db/m)Visibility = 10 / (db/m)(db/m) is the optical density (OD) of the smoke.(db/m) is the optical density (OD) of the smoke.
Max. Permissible value of OD = 2 db/mMax. Permissible value of OD = 2 db/mDesirable value of OD = 1 db/mDesirable value of OD = 1 db/m
Dense Smoke may have OD equal to 100 db/mDense Smoke may have OD equal to 100 db/m
Descendance of the Descendance of the Hot Gas Layer Hot Gas Layer
Clause 3.4.12.3, Page 24 of NBC states Clause 3.4.12.3, Page 24 of NBC states
Smoke Venting Facilities shall be adequate to Smoke Venting Facilities shall be adequate to prevent dangerous accumulation of smoke during prevent dangerous accumulation of smoke during the period of time necessary to evacuate the area the period of time necessary to evacuate the area served.served.
A minimum of 12 air changes per hour has been A minimum of 12 air changes per hour has been recommended.recommended.
FIRE SAFETY COMPRISES FIRE SAFETY COMPRISES OF: OF:
1.1. Life SafetyLife Safety2.2. Fire ProtectionFire Protection
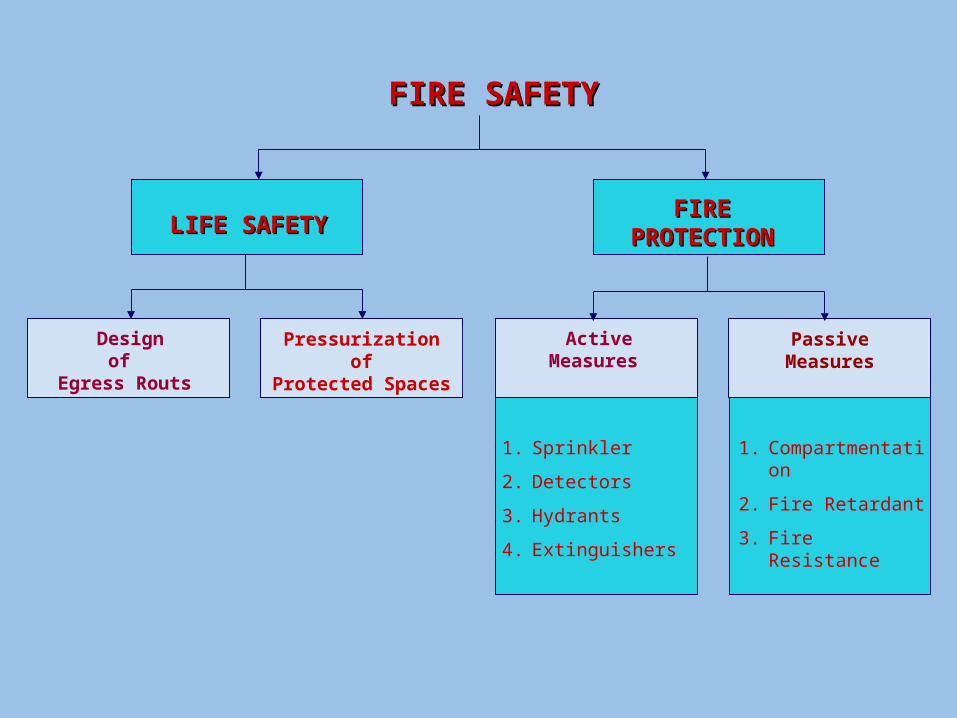
FIRE SAFETYFIRE SAFETY
LIFE SAFETYLIFE SAFETY FIRE FIRE PROTECTIONPROTECTION
Design of
Egress Routs
Pressurization of
Protected Spaces
Active Measures
Passive Measures
1. Sprinkler
2. Detectors
3. Hydrants
4. Extinguishers
1. Compartmentation
2. Fire Retardant
3. Fire Resistance
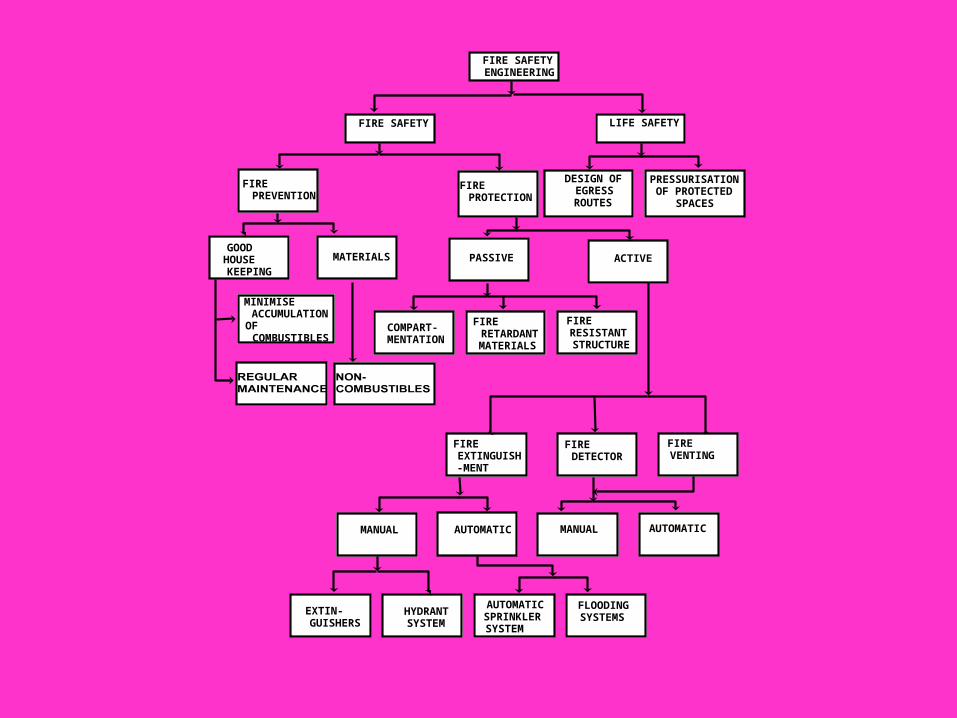
FIRE SAFETY ENGINEERING
LIFE SAFETY
DESIGN OF EGRESS ROUTES
PRESSURISATION OF PROTECTED
SPACES
FIRE SAFETY
FIRE PREVENTION
FIRE PROTECTION
PASSIVEGOOD HOUSE KEEPING
MATERIALS ACTIVE
FIRERESISTANTSTRUCTURE
MINIMISE ACCUMULATION OF COMBUSTIBLES
COMPART-MENTATION
FIRE RETARDANTMATERIALS
FIREVENTING
FIRE EXTINGUISH-MENT
FIRE DETECTOR
MANUAL AUTOMATIC MANUAL AUTOMATIC
EXTIN-GUISHERS
HYDRANTSYSTEM
AUTOMATICSPRINKLER SYSTEM
FLOODING SYSTEMS
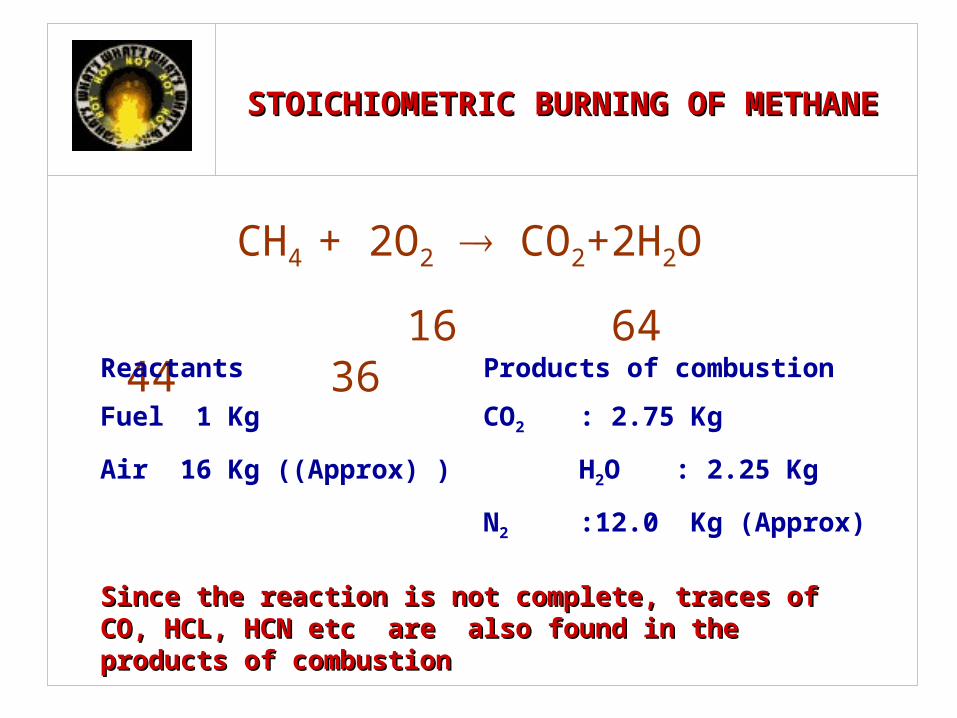
STOICHIOMETRIC BURNING OF METHANESTOICHIOMETRIC BURNING OF METHANE
CH4 + 2O2 CO2+2H2O
16 64 44 36
Since the reaction is not complete, traces of CO, HCL, HCN Since the reaction is not complete, traces of CO, HCL, HCN etc are also found in the products of combustion etc are also found in the products of combustion
Reactants Products of combustion
Fuel 1 Kg CO2 : 2.75 Kg
Air 16 Kg ((Approx) ) H2O : 2.25 Kg
N2 :12.0 Kg (Approx)
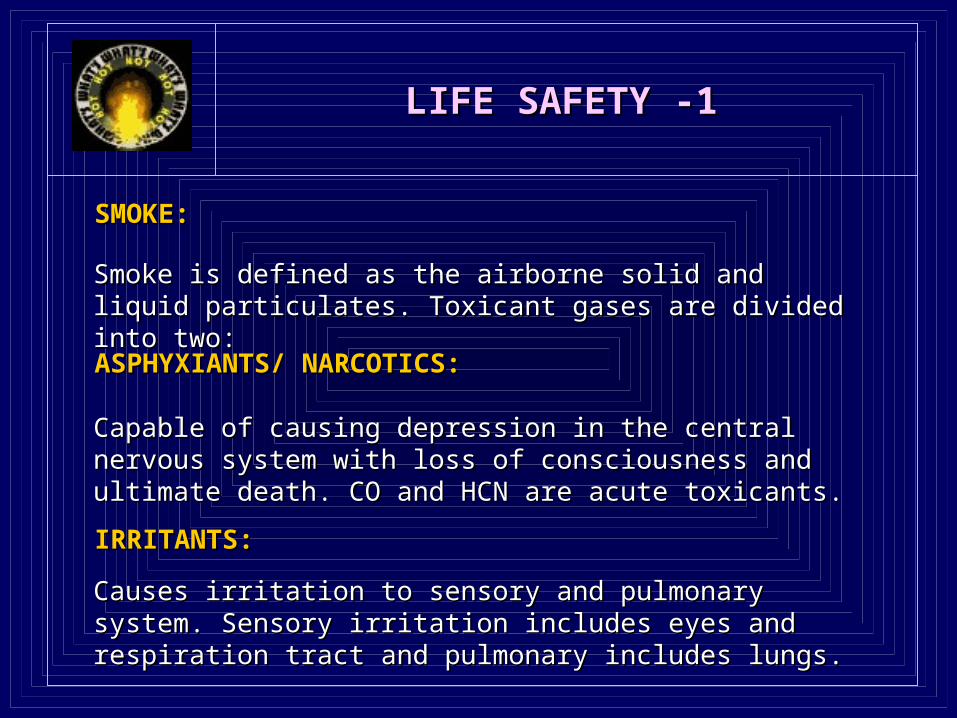
LIFE SAFETY -1LIFE SAFETY -1
SMOKE:SMOKE:
IRRITANTS:IRRITANTS:
ASPHYXIANTS/ NARCOTICS:ASPHYXIANTS/ NARCOTICS:
Smoke is defined as the airborne solid and liquid Smoke is defined as the airborne solid and liquid particulates. Toxicant gases are divided into two: particulates. Toxicant gases are divided into two:
Capable of causing depression in the central nervous Capable of causing depression in the central nervous system with loss of consciousness and ultimate death. system with loss of consciousness and ultimate death. CO and HCN are acute toxicants.CO and HCN are acute toxicants.
Causes irritation to sensory and pulmonary system. Causes irritation to sensory and pulmonary system. Sensory irritation includes eyes and respiration tract and Sensory irritation includes eyes and respiration tract and pulmonary includes lungs.pulmonary includes lungs.
LIFE SAFETY -2LIFE SAFETY -2
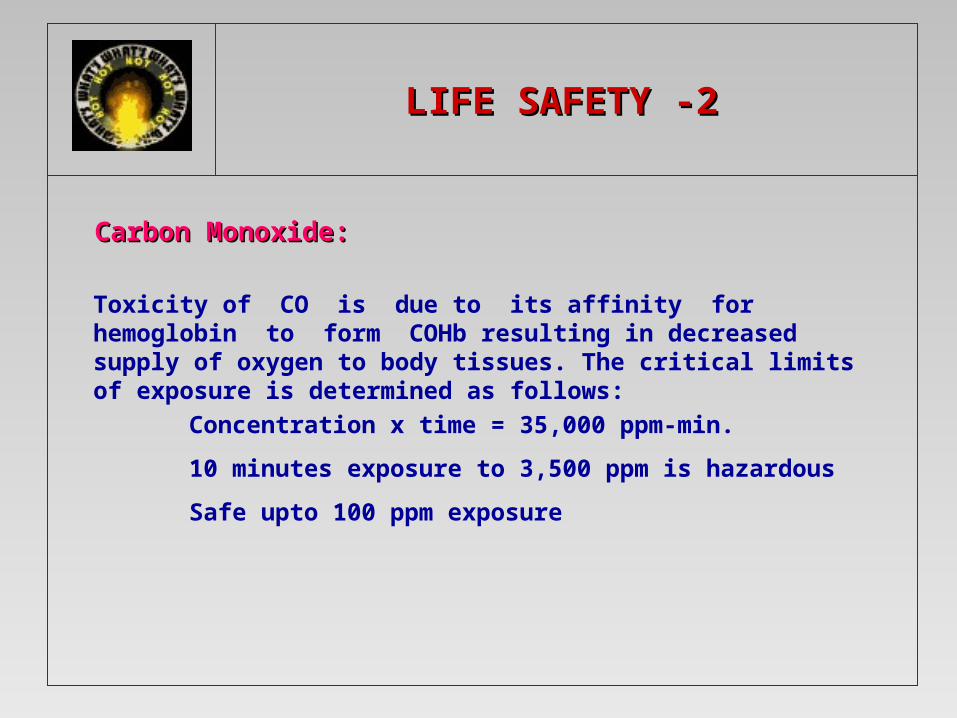
Carbon Monoxide: Carbon Monoxide:
Toxicity of CO is due to its affinity for hemoglobin to form COHb resulting in decreased supply of oxygen to body tissues. The critical limits of exposure is determined as follows:
Concentration x time = 35,000 ppm-min.
10 minutes exposure to 3,500 ppm is hazardous
Safe upto 100 ppm exposure
LIFE SAFETY -3LIFE SAFETY -3
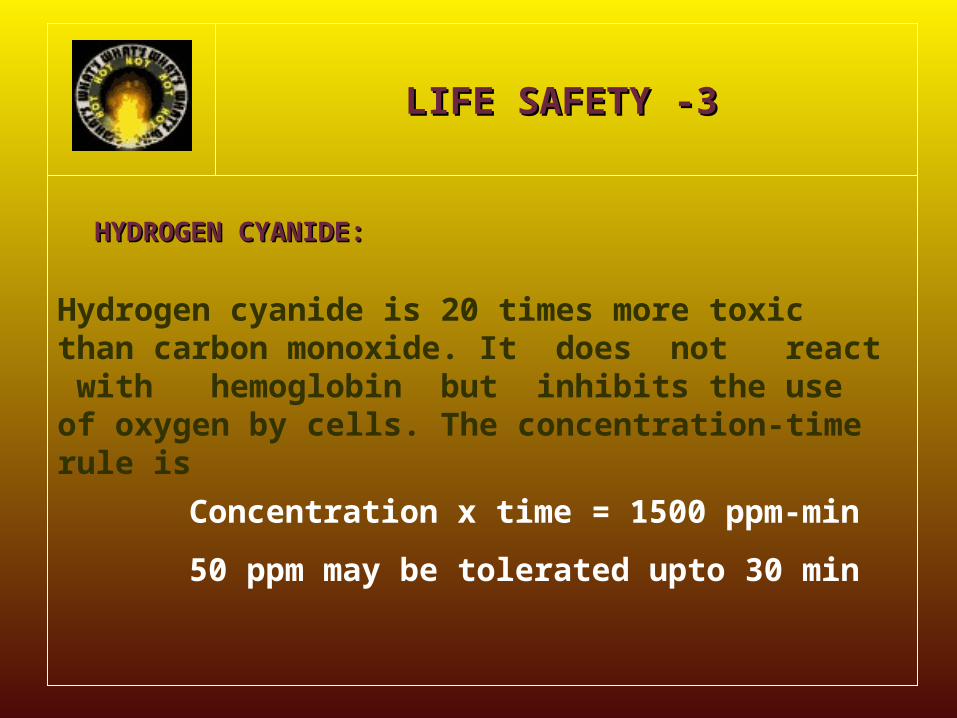
HYDROGEN CYANIDE:HYDROGEN CYANIDE:
Hydrogen cyanide is 20 times more toxic than carbon monoxide. It does not react with hemoglobin but inhibits the use of oxygen by cells. The concentration-time rule is
Concentration x time = 1500 ppm-min
50 ppm may be tolerated upto 30 min
LIFE SAFETY -4LIFE SAFETY -4
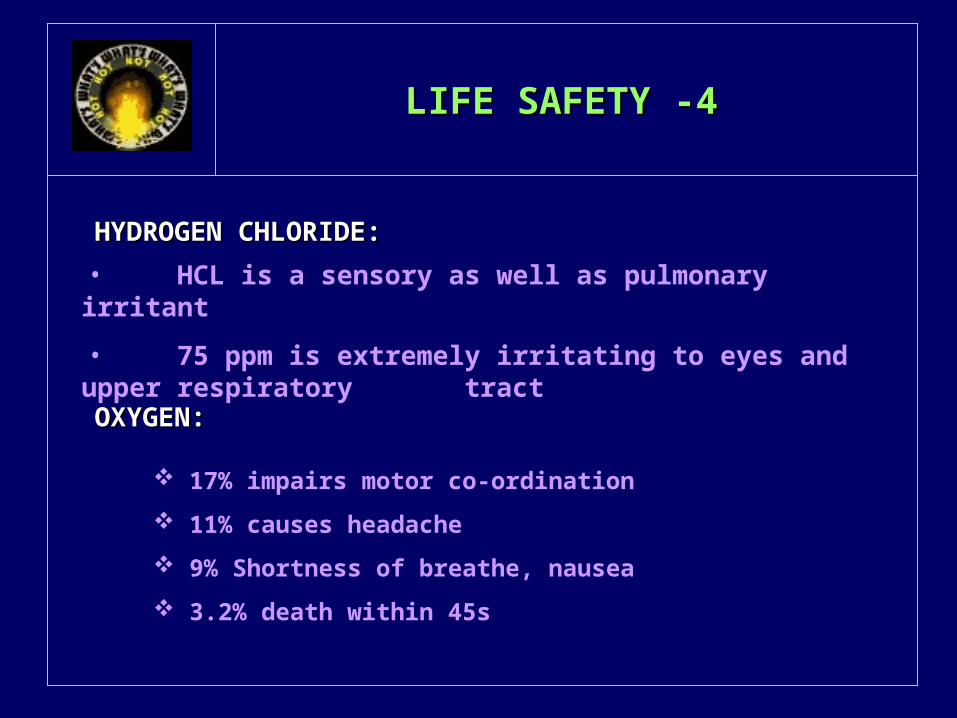
HYDROGEN CHLORIDE:HYDROGEN CHLORIDE:• HCL is a sensory as well as pulmonary irritant
• 75 ppm is extremely irritating to eyes and upper respiratory tract
17% impairs motor co-ordination 11% causes headache 9% Shortness of breathe, nausea 3.2% death within 45s
OXYGEN:OXYGEN:
LIFE SAFETY -5LIFE SAFETY -5
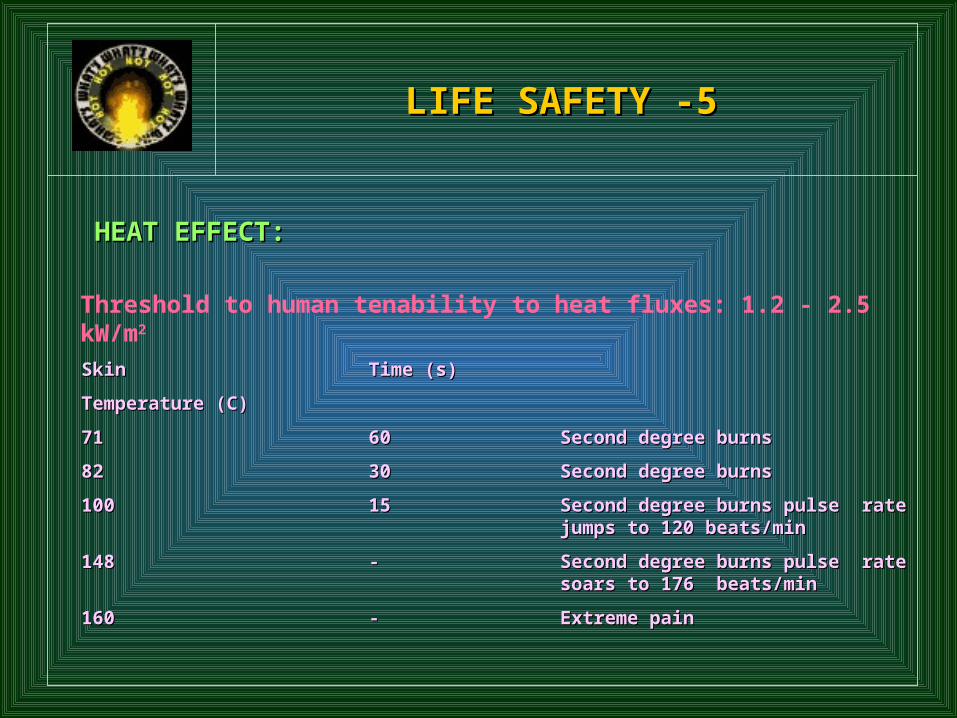
HEAT EFFECT:HEAT EFFECT:
Threshold to human tenability to heat fluxes: 1.2 - 2.5 kW/m2
SkinSkin Time (s)Time (s)
Temperature (C)Temperature (C)
7171 6060 Second degree burnsSecond degree burns
8282 3030 Second degree burnsSecond degree burns
100100 15 15 Second degree burns pulse rate Second degree burns pulse rate jumps to 120 beats/minjumps to 120 beats/min
148148 -- Second degree burns pulse rate Second degree burns pulse rate soars to 176 beats/minsoars to 176 beats/min
160160 -- Extreme painExtreme pain
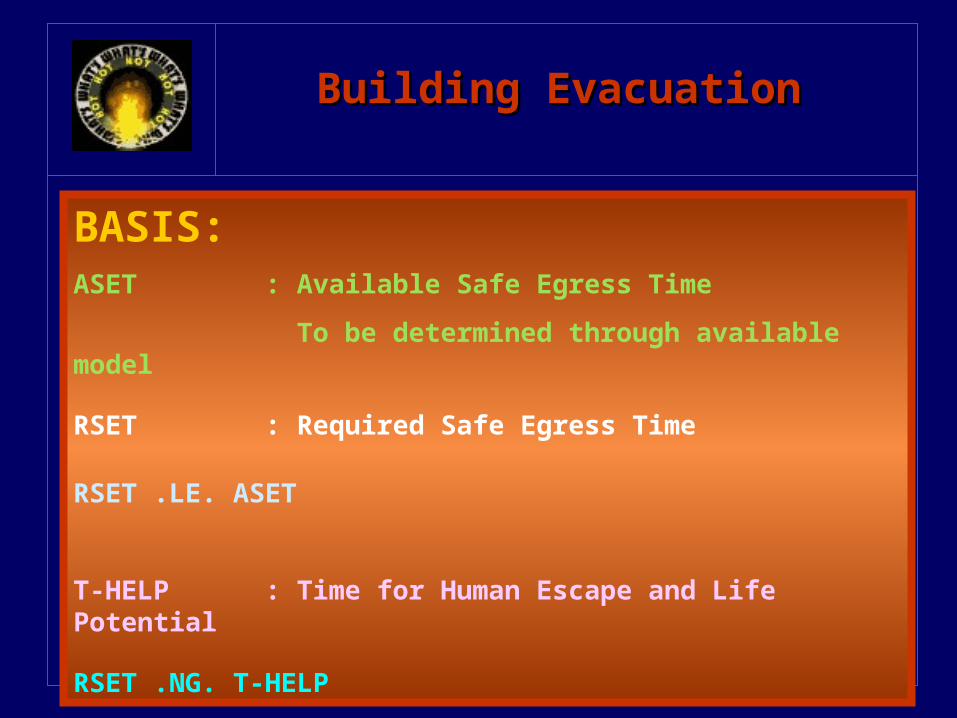
Building EvacuationBuilding Evacuation
BASIS:ASET : Available Safe Egress Time
To be determined through available model
RSET : Required Safe Egress Time
RSET .LE. ASET
T-HELP : Time for Human Escape and Life Potential
RSET .NG. T-HELP
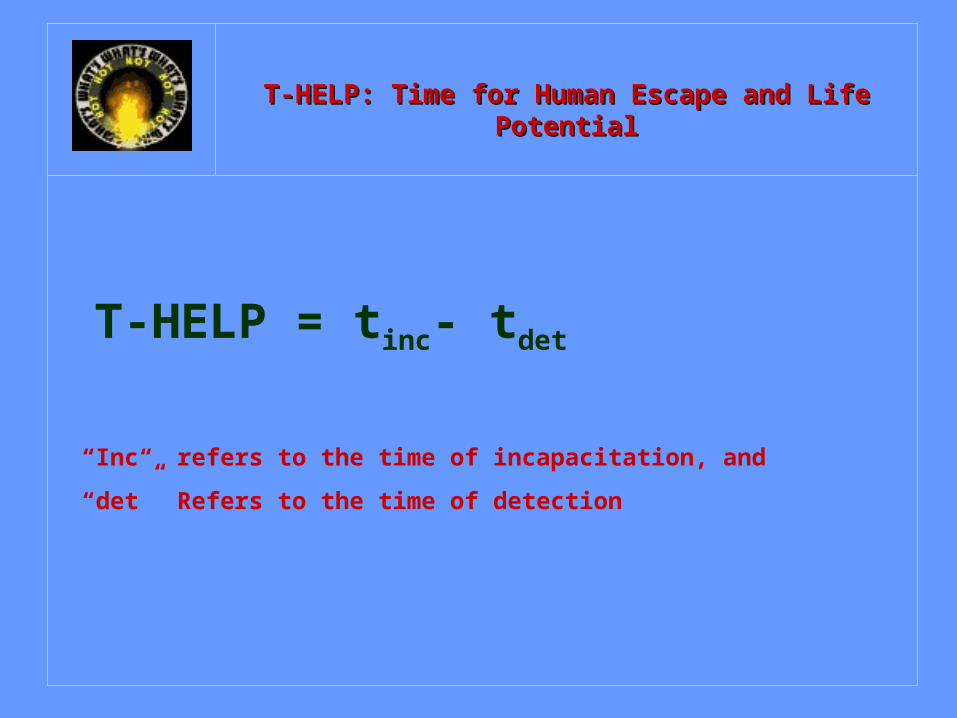
T-HELP: Time for Human Escape and Life PotentialT-HELP: Time for Human Escape and Life Potential
T-HELP = tinc- tdet
“Inc“ refers to the time of incapacitation, and
“det” Refers to the time of detection
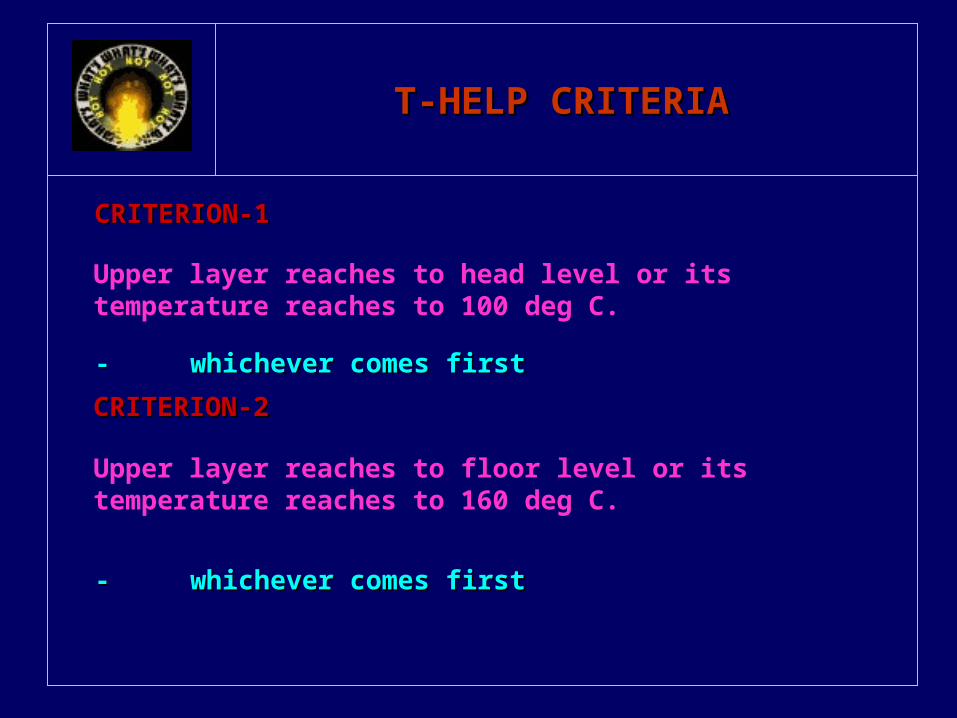
T-HELP CRITERIAT-HELP CRITERIA
CRITERION-1CRITERION-1
-- whichever comes firstwhichever comes first
-- whichever comes firstwhichever comes first
Upper layer reaches to head level or its temperature reaches to 100 deg C.
Upper layer reaches to floor level or its temperature reaches to 160 deg C.
CRITERION-2CRITERION-2
Fire Fire ProtectionProtection
ROOM TEMPERATUREROOM TEMPERATURE
Onset of Hazardous condition Onset of flash Over Structure Collapse
Determination of Room Temperature is important for:Determination of Room Temperature is important for:
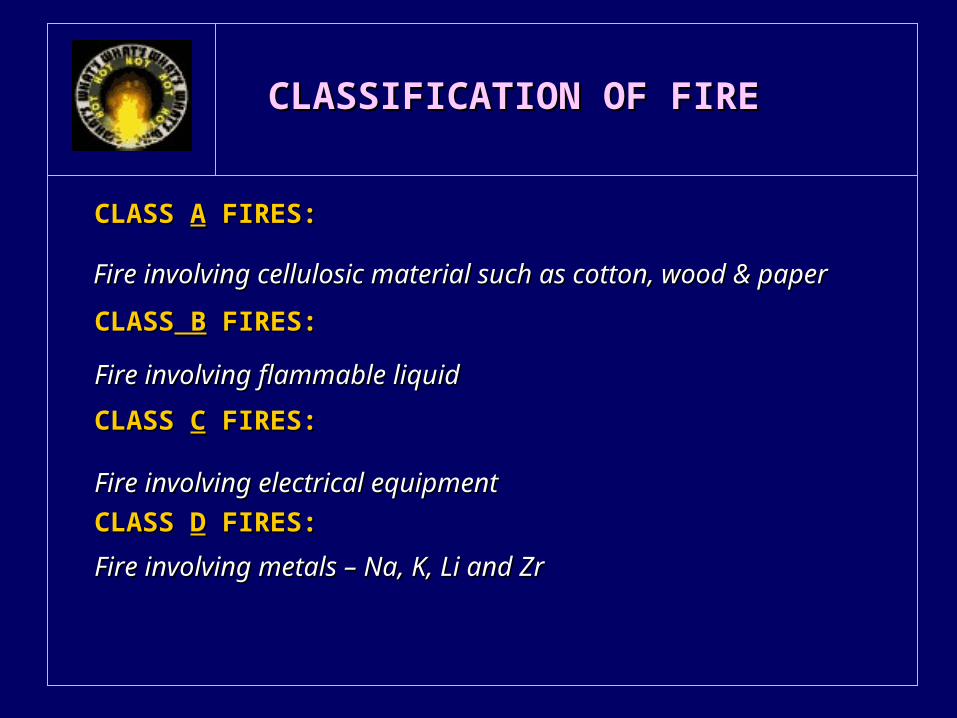
CLASSIFICATION OF FIRECLASSIFICATION OF FIRE
CLASS CLASS AA FIRES: FIRES:
CLASS CLASS CC FIRES: FIRES:
CLASSCLASS B B FIRES: FIRES:Fire involving cellulosic material such as cotton, wood & Fire involving cellulosic material such as cotton, wood & paperpaper
Fire involving flammable liquidFire involving flammable liquid
Fire involving electrical equipmentFire involving electrical equipmentCLASS CLASS DD FIRES: FIRES:Fire involving metals – Na, K, Li and ZrFire involving metals – Na, K, Li and Zr
Light Hazard –Light Hazard –Occupancies Include::Occupancies Include::
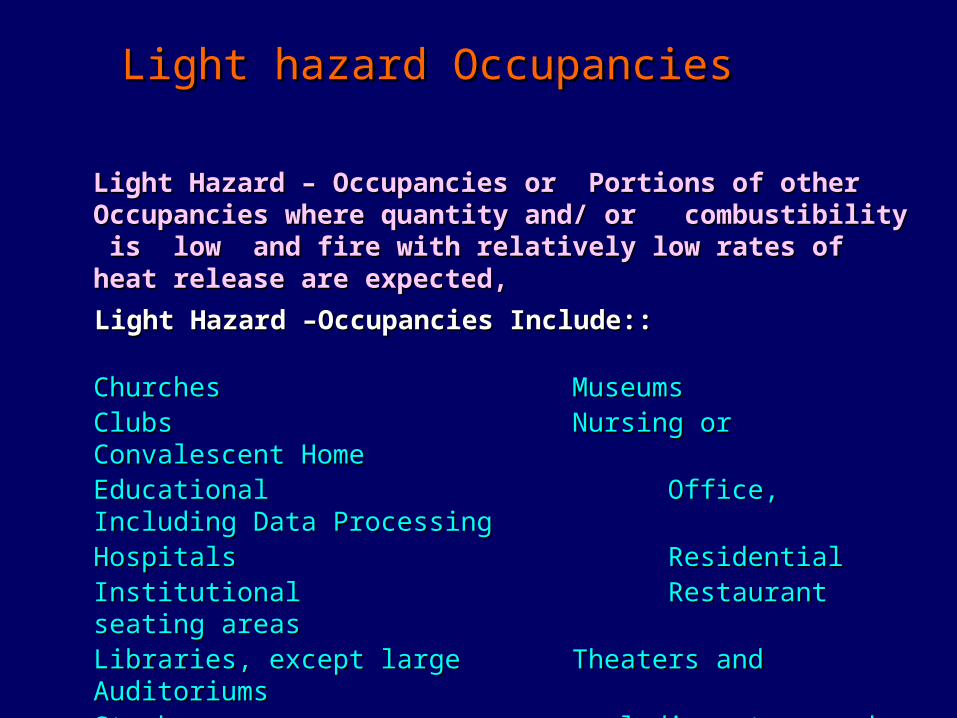
Light Hazard – Occupancies or Portions of other Light Hazard – Occupancies or Portions of other Occupancies where quantity and/ or combustibility Occupancies where quantity and/ or combustibility is low and fire with relatively low rates of heat is low and fire with relatively low rates of heat release are expected,release are expected,
ChurchesChurches MuseumsMuseumsClubsClubs Nursing or Convalescent HomeNursing or Convalescent HomeEducational Educational Office, Including Data ProcessingOffice, Including Data ProcessingHospitals Hospitals ResidentialResidentialInstitutionalInstitutional Restaurant seating areasRestaurant seating areasLibraries, except largeLibraries, except large Theaters and Theaters and Auditoriums Auditoriums Stack rooms Stack rooms excluding stage and excluding stage and prosceniumsprosceniums
Light hazard OccupanciesLight hazard Occupancies
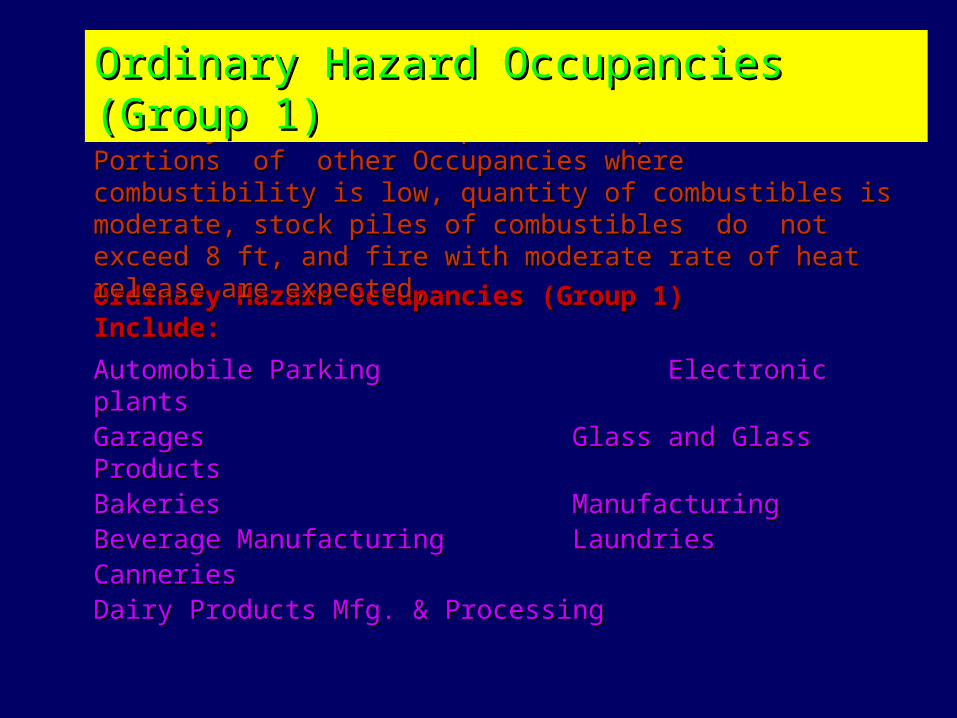
Ordinary Hazard Occupancies (Group 1) Ordinary Hazard Occupancies (Group 1) Include:Include:
Ordinary Hazard (Group 1) – Occupancies or Portions of Ordinary Hazard (Group 1) – Occupancies or Portions of other Occupancies where combustibility is low, quantity of other Occupancies where combustibility is low, quantity of combustibles is moderate, stock piles of combustibles do combustibles is moderate, stock piles of combustibles do not exceed 8 ft, and fire with moderate rate of heat release not exceed 8 ft, and fire with moderate rate of heat release are expected,are expected,
Automobile ParkingAutomobile Parking Electronic plantsElectronic plantsGaragesGarages Glass and Glass Glass and Glass ProductsProductsBakeriesBakeries ManufacturingManufacturingBeverage Manufacturing Beverage Manufacturing LaundriesLaundriesCanneriesCanneriesDairy Products Mfg. & ProcessingDairy Products Mfg. & Processing
Ordinary Hazard Occupancies (Group Ordinary Hazard Occupancies (Group 1)1)
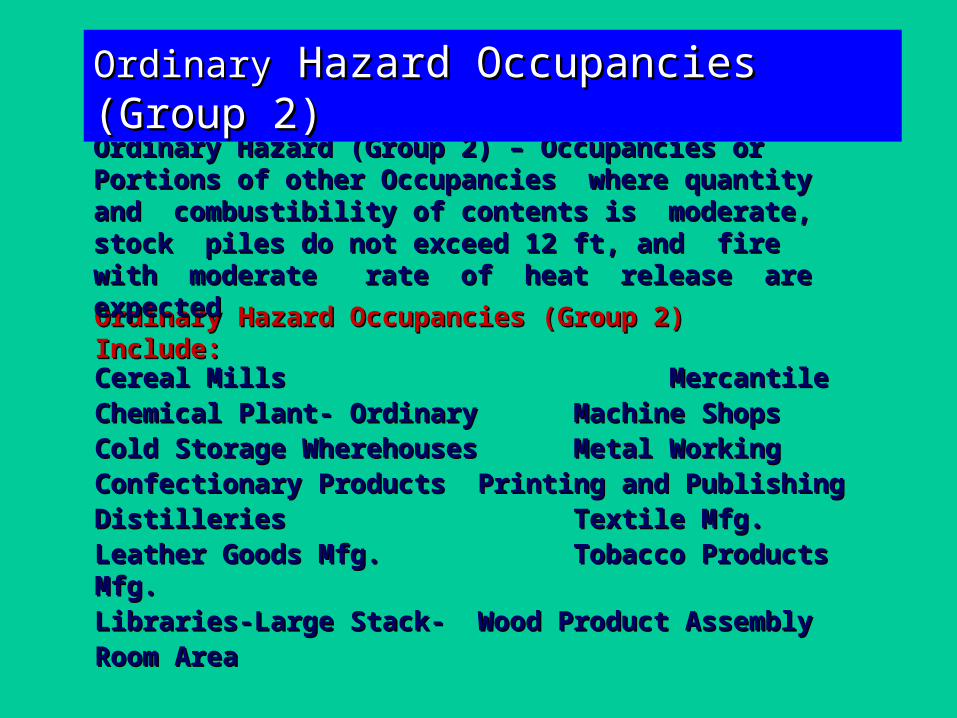
Ordinary Hazard Ordinary Hazard Occupancies (Occupancies (Group 2) Group 2) Include:Include:
Ordinary Hazard (Group 2) – Occupancies or Ordinary Hazard (Group 2) – Occupancies or Portions of other Occupancies where quantity and Portions of other Occupancies where quantity and combustibility of contents is moderate, stock combustibility of contents is moderate, stock piles do not exceed 12 ft, and fire with moderate piles do not exceed 12 ft, and fire with moderate rate of heat release are expected rate of heat release are expected
Cereal MillsCereal Mills MercantileMercantileChemical Plant- Ordinary Chemical Plant- Ordinary Machine Shops Machine Shops Cold Storage Wherehouses Cold Storage Wherehouses Metal Working Metal Working Confectionary ProductsConfectionary Products Printing and PublishingPrinting and PublishingDistilleriesDistilleries Textile Mfg.Textile Mfg.Leather Goods Mfg.Leather Goods Mfg. Tobacco Products Tobacco Products Mfg.Mfg.Libraries-Large Stack-Libraries-Large Stack- Wood Product AssemblyWood Product AssemblyRoom AreaRoom Area
OrdinaryOrdinary Hazard Occupancies (Group Hazard Occupancies (Group 2)2)
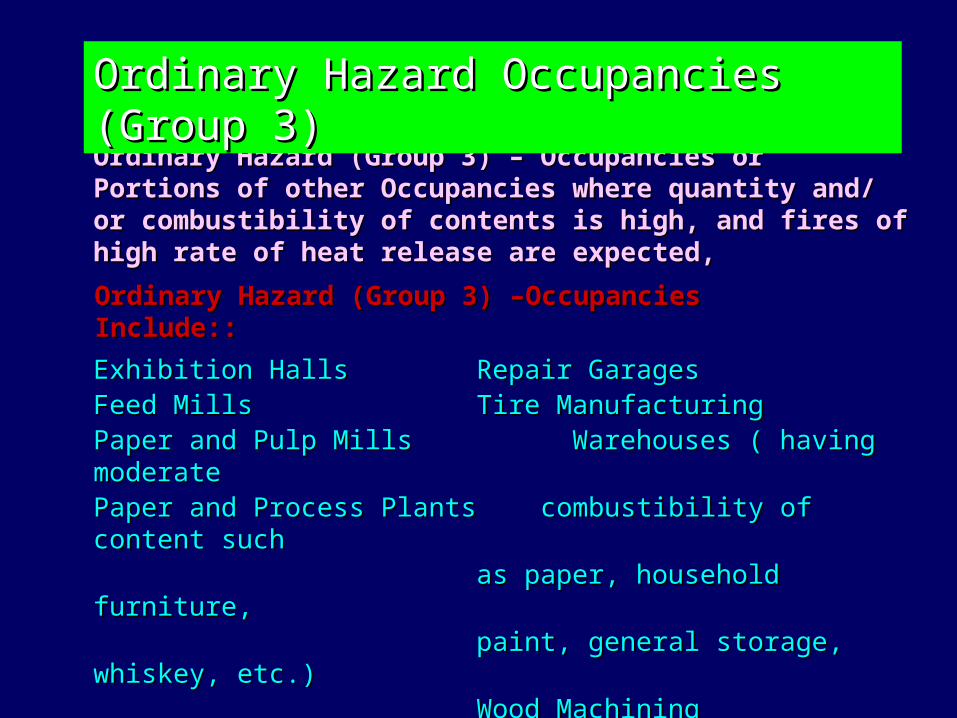
Ordinary Hazard (Group 3) –Ordinary Hazard (Group 3) –Occupancies Include::Occupancies Include::
Ordinary Hazard (Group 3) – Occupancies or Portions Ordinary Hazard (Group 3) – Occupancies or Portions of other Occupancies where quantity and/ or of other Occupancies where quantity and/ or combustibility of contents is high, and fires of high combustibility of contents is high, and fires of high rate of heat release are expected,rate of heat release are expected,
Exhibition HallsExhibition Halls Repair Garages Repair GaragesFeed MillsFeed Mills Tire Manufacturing Tire Manufacturing Paper and Pulp Mills Paper and Pulp Mills Warehouses ( having Warehouses ( having moderatemoderatePaper and Process Plants combustibility of content suchPaper and Process Plants combustibility of content such
as paper, household furniture, as paper, household furniture, paint, general storage, whiskey, paint, general storage, whiskey,
etc.)etc.) Wood MachiningWood Machining
Ordinary Hazard Occupancies (Group Ordinary Hazard Occupancies (Group 3)3)
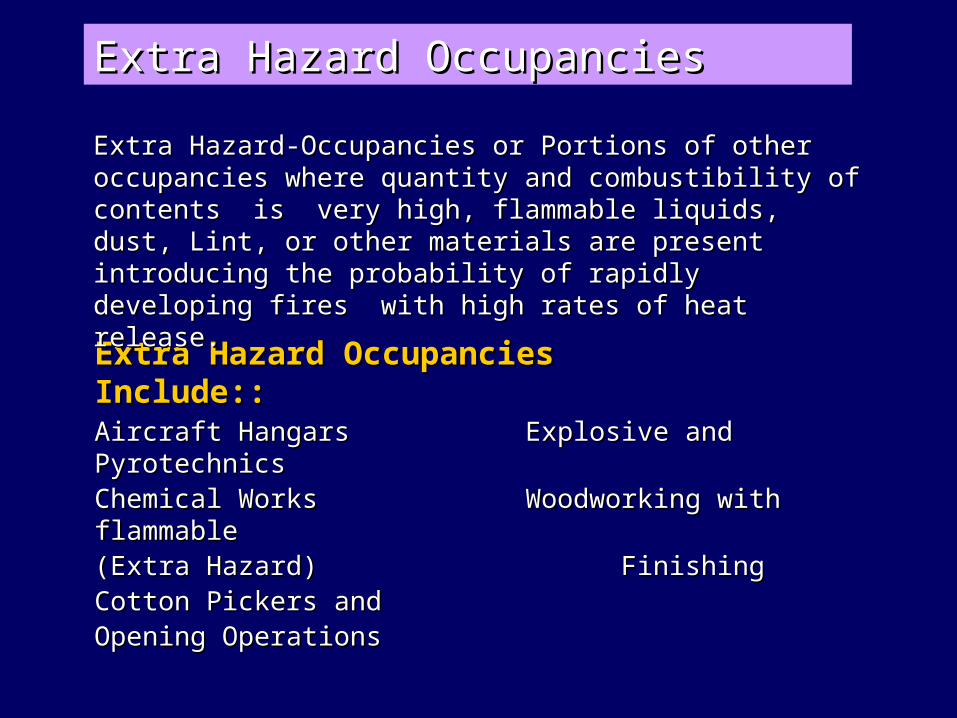
Extra Hazard Occupancies Include::Extra Hazard Occupancies Include::
Extra Hazard-Occupancies or Portions of other Extra Hazard-Occupancies or Portions of other occupancies where quantity and combustibility of occupancies where quantity and combustibility of contents is very high, flammable liquids, dust, Lint, or contents is very high, flammable liquids, dust, Lint, or other materials are present introducing the probability of other materials are present introducing the probability of rapidly developing fires with high rates of heat release.rapidly developing fires with high rates of heat release.
Aircraft HangarsAircraft Hangars Explosive and Pyrotechnics Explosive and PyrotechnicsChemical WorksChemical Works Woodworking with Woodworking with flammableflammable(Extra Hazard)(Extra Hazard) Finishing FinishingCotton Pickers andCotton Pickers andOpening OperationsOpening Operations
Extra Hazard OccupanciesExtra Hazard Occupancies
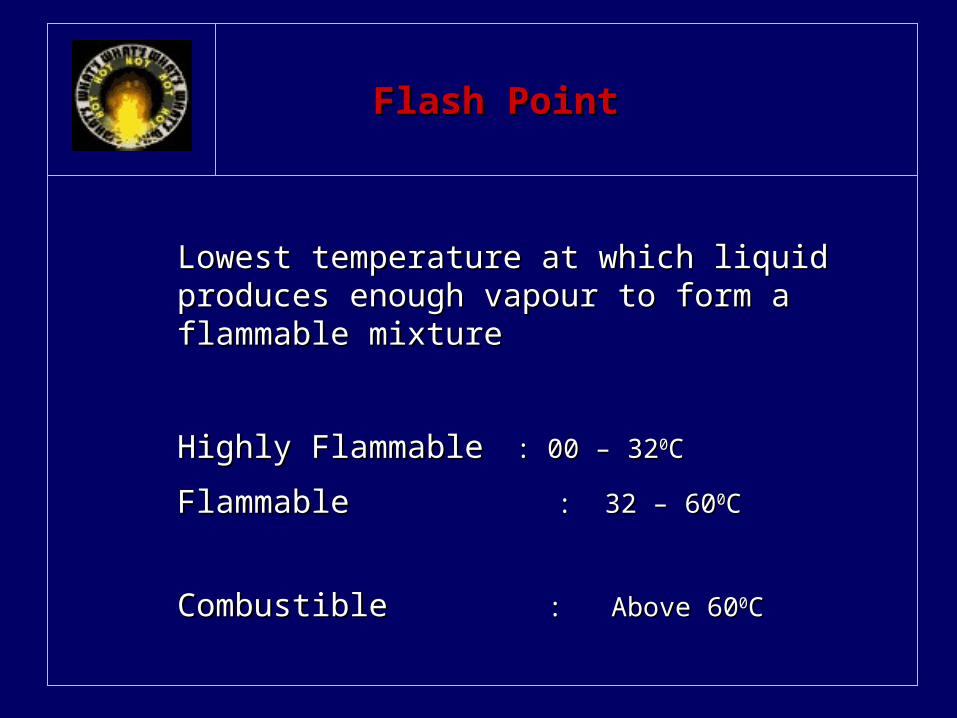
Flash PointFlash Point
Lowest temperature at which liquid Lowest temperature at which liquid produces enough vapour to form a produces enough vapour to form a flammable mixtureflammable mixture
Highly FlammableHighly Flammable : 00 – 32 : 00 – 3200CCFlammableFlammable : 32 – 60 : 32 – 6000CC
CombustibleCombustible : Above 60 : Above 6000C C
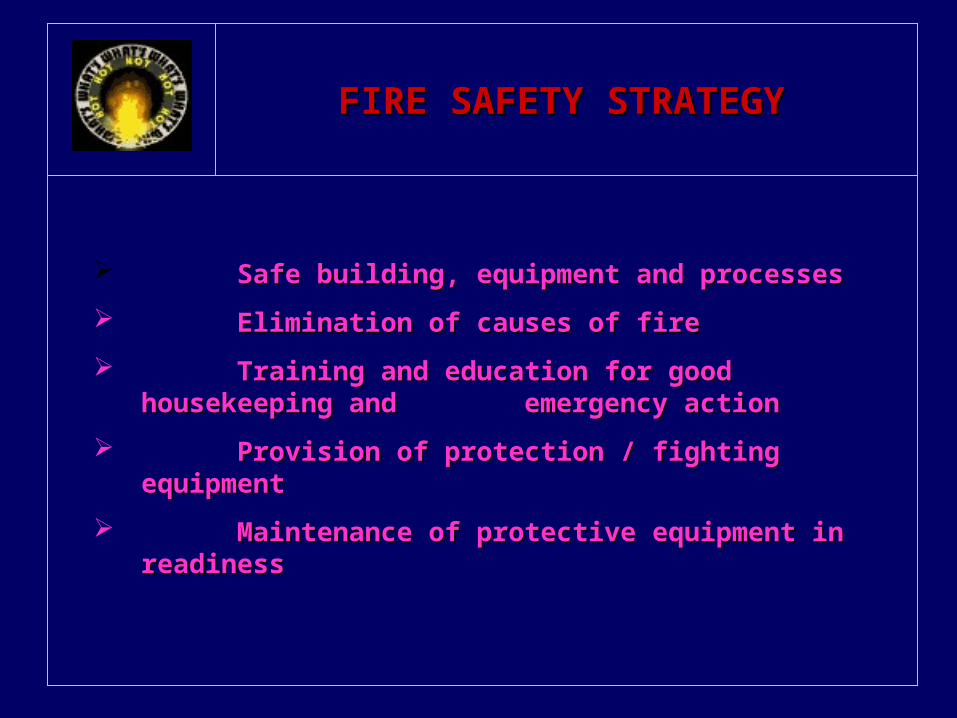
FIRE SAFETY STRATEGYFIRE SAFETY STRATEGY
Safe building, equipment and processesSafe building, equipment and processes Elimination of causes of fireElimination of causes of fire Training and education for good housekeeping Training and education for good housekeeping
and and emergency actionemergency action Provision of protection / fighting equipmentProvision of protection / fighting equipment Maintenance of protective equipment in Maintenance of protective equipment in
readinessreadiness
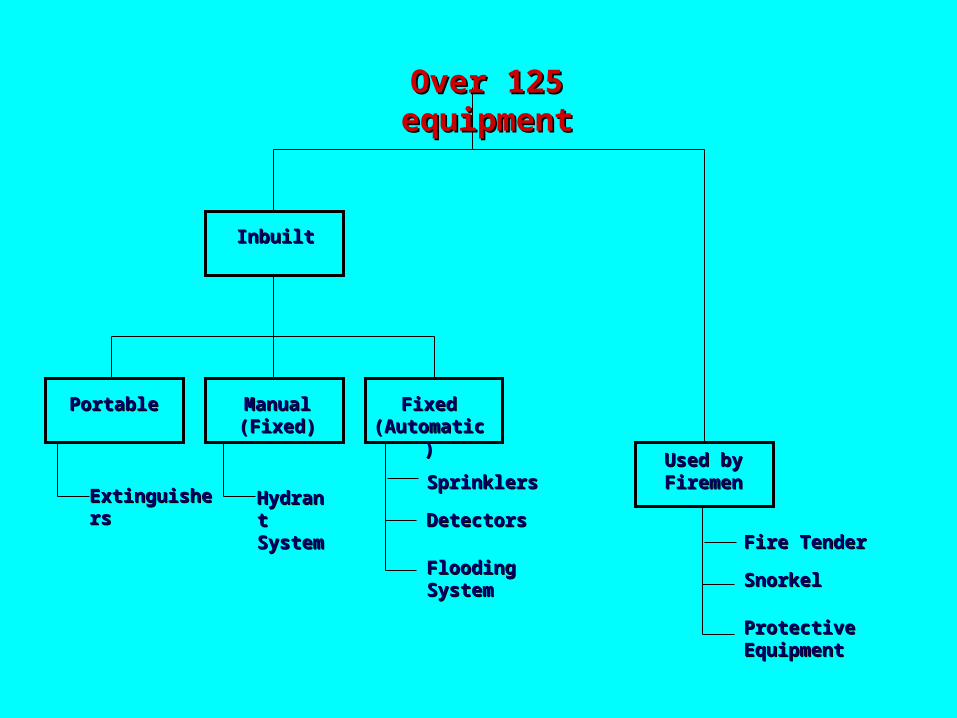
Over 125 equipmentOver 125 equipment
InbuiltInbuilt
PortablePortable Manual Manual (Fixed)(Fixed)
Fixed Fixed (Automatic)(Automatic)
Used by Used by FiremenFiremen
ExtinguishersExtinguishers Hydrant Hydrant SystemSystem
SprinklersSprinklers
DetectorsDetectors
Flooding Flooding SystemSystem
Fire TenderFire Tender
SnorkelSnorkel
Protective Protective EquipmentEquipment

Automatic Sprinkler SystemAutomatic Sprinkler System`
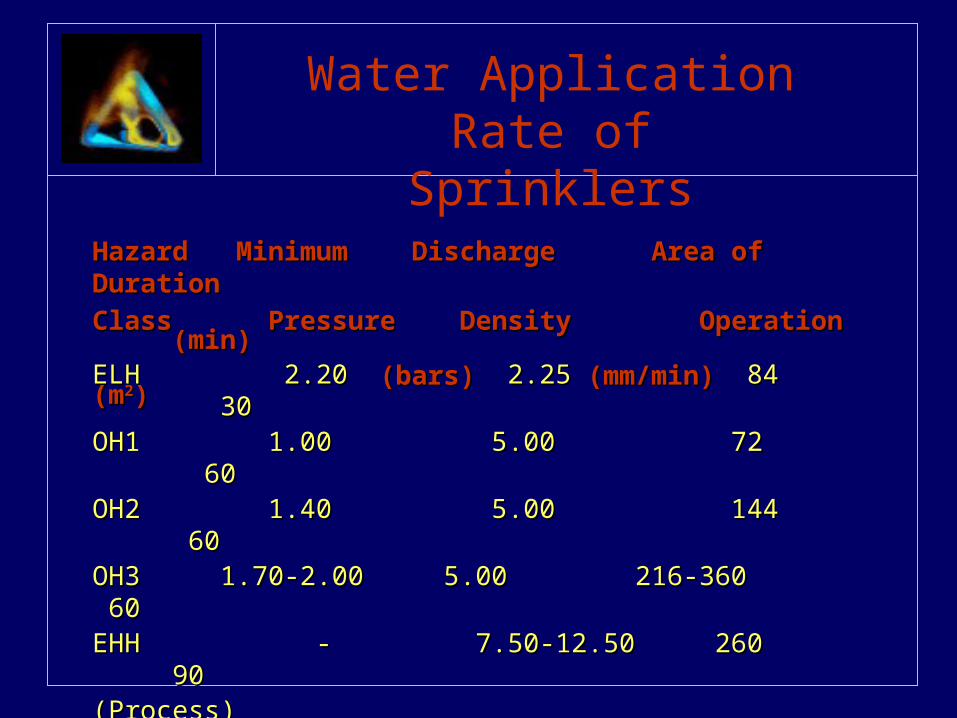
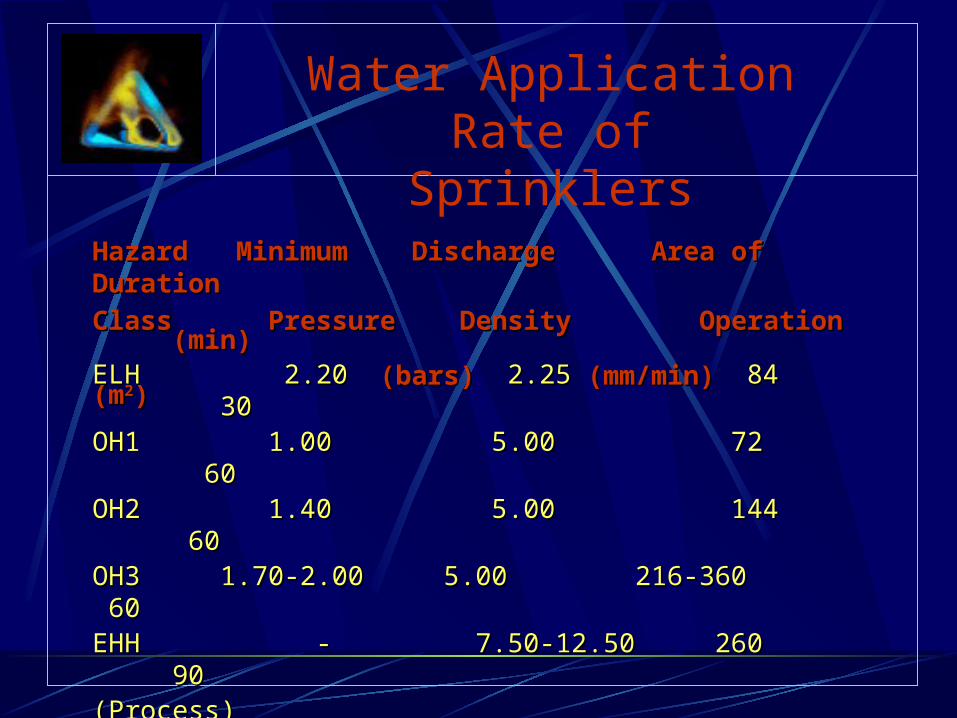
Water Application Rate of Sprinklers
Hazard Minimum Discharge Area of DurationHazard Minimum Discharge Area of DurationClass Pressure Density Operation (min)Class Pressure Density Operation (min) (bars) (mm/min) (m(bars) (mm/min) (m22))
ELH 2.20 2.25 84 30ELH 2.20 2.25 84 30OH1 1.00 5.00 72 60OH1 1.00 5.00 72 60OH2 1.40 5.00 144 60OH2 1.40 5.00 144 60OH3 1.70-2.00 5.00 216-360 60OH3 1.70-2.00 5.00 216-360 60EHH - 7.50-12.50 260 90EHH - 7.50-12.50 260 90(Process) (Process) EHH - 7.50-17.50 260 90EHH - 7.50-17.50 260 90(Storage)(Storage)
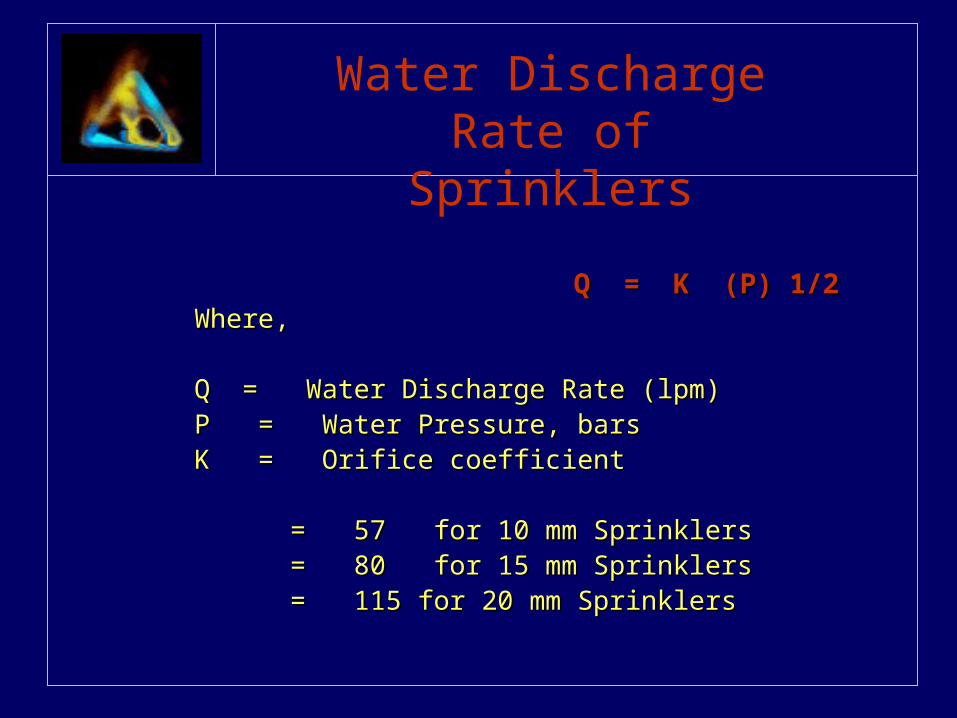
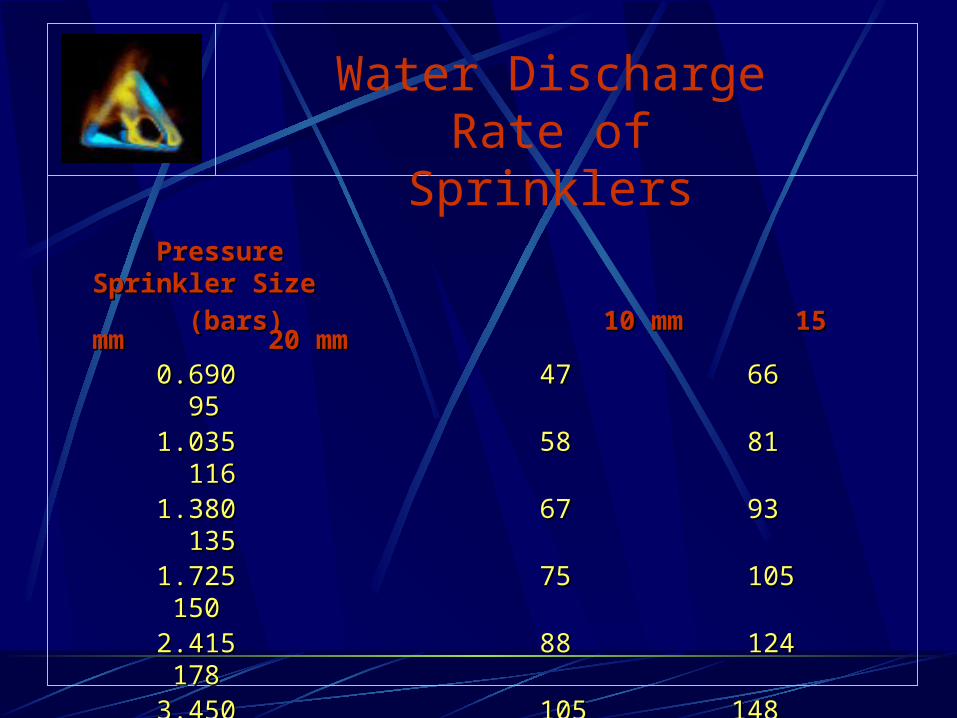
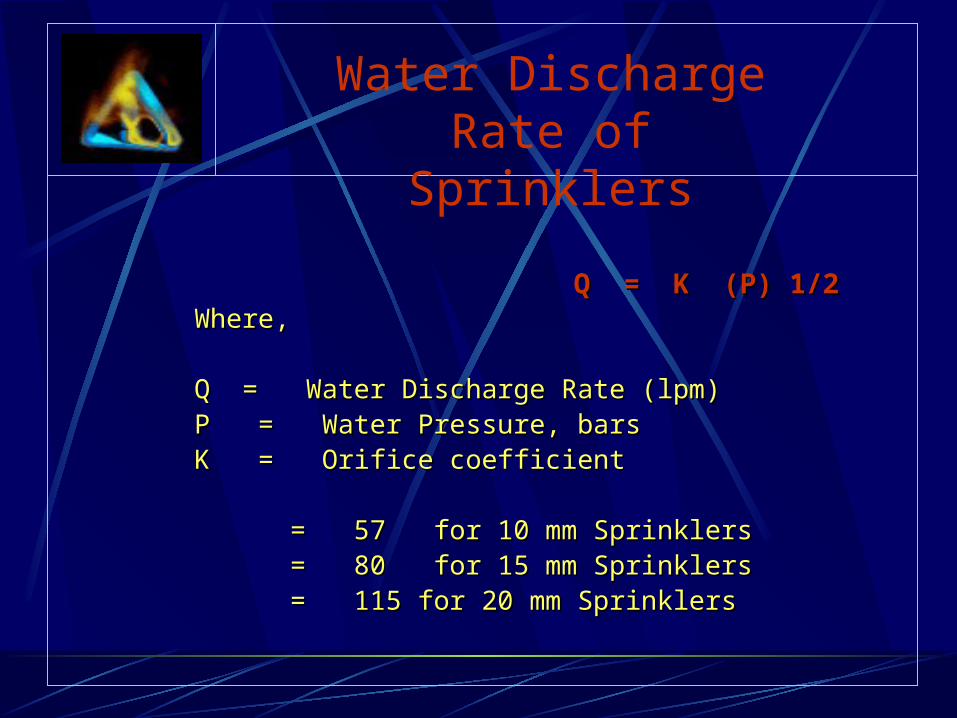
Water Discharge Rate of Sprinklers
Q = K (P) 1/2Q = K (P) 1/2Where,Where,
Q = Water Discharge Rate (lpm)Q = Water Discharge Rate (lpm)P = Water Pressure, barsP = Water Pressure, barsK = Orifice coefficientK = Orifice coefficient
= 57 for 10 mm Sprinklers= 57 for 10 mm Sprinklers = 80 for 15 mm Sprinklers= 80 for 15 mm Sprinklers = 115 for 20 mm Sprinklers= 115 for 20 mm Sprinklers
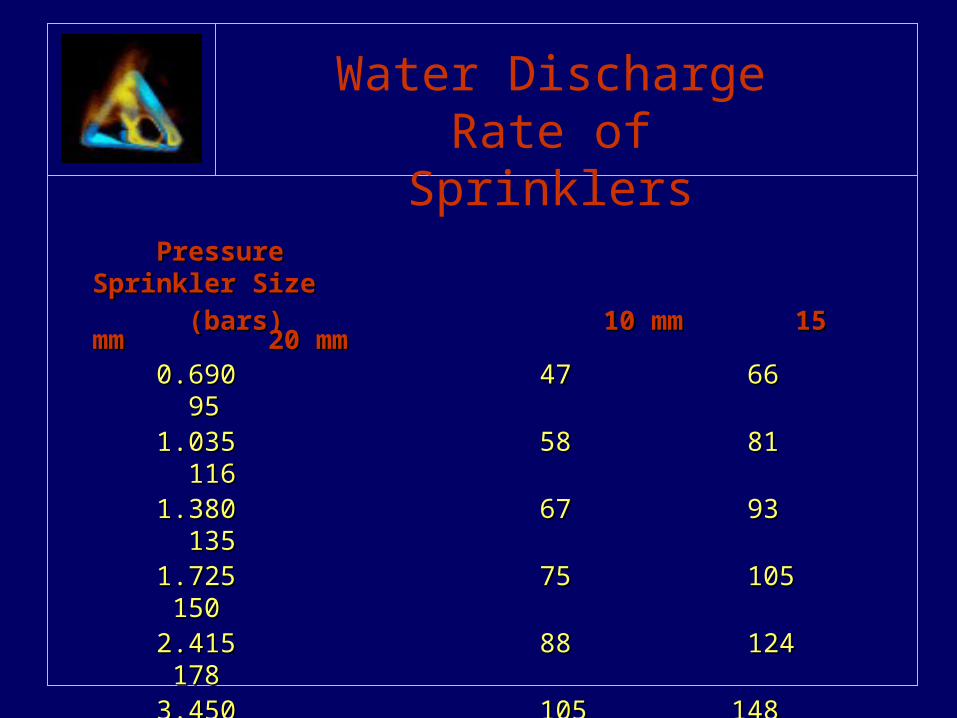
Water Discharge Rate of Sprinklers
Pressure Sprinkler SizePressure Sprinkler Size (bars) 10 mm 15 mm 20 mm(bars) 10 mm 15 mm 20 mm
0.690 47 66 950.690 47 66 95 1.035 58 81 1161.035 58 81 116 1.380 67 93 1351.380 67 93 135 1.725 75 105 1501.725 75 105 150 2.415 88 124 1782.415 88 124 178 3.450 105 148 2123.450 105 148 212 5.175 129 182 2615.175 129 182 261 6.900 149 210 3026.900 149 210 302
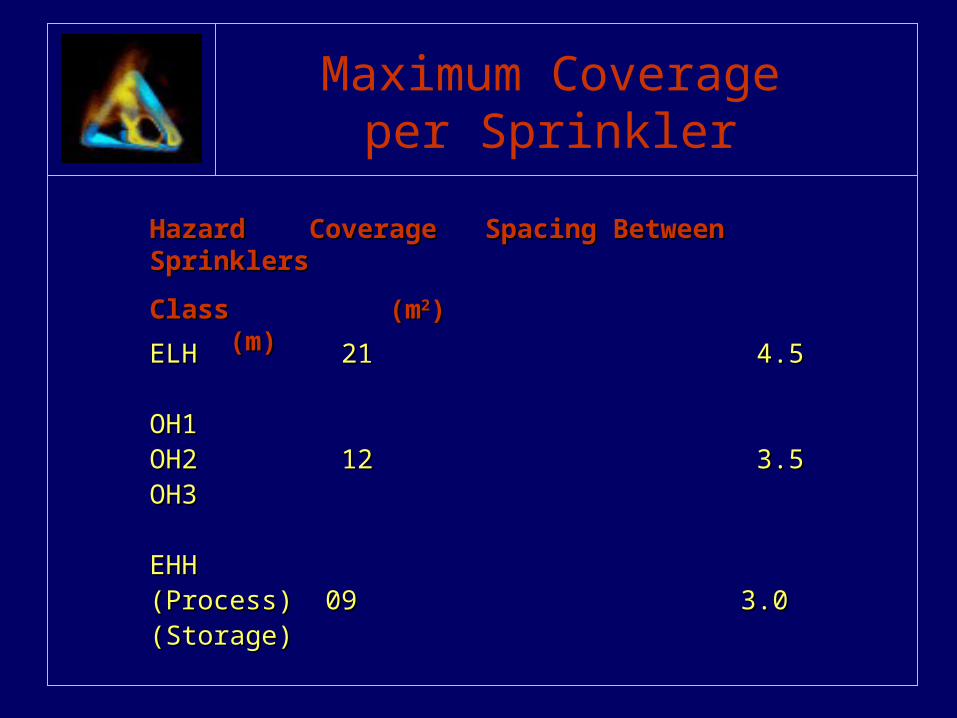
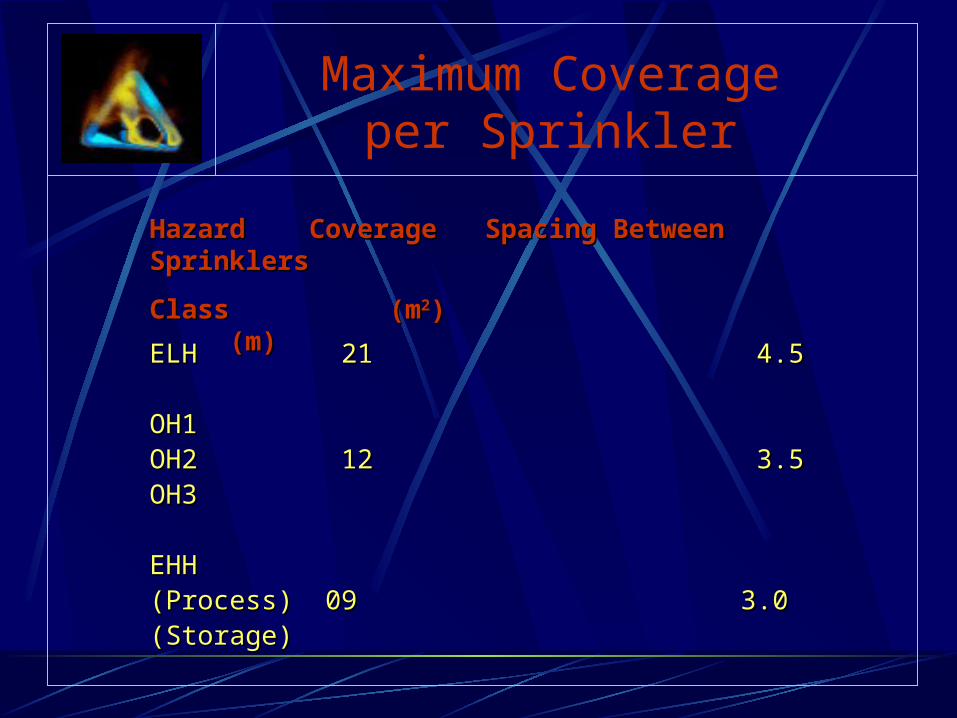
Maximum Coverage per Sprinkler
Hazard Coverage Spacing Between SprinklersHazard Coverage Spacing Between Sprinklers
Class (mClass (m22) (m)) (m)
ELH 21 4.5 ELH 21 4.5
OH1 OH1 OH2 12 3.5OH2 12 3.5OH3OH3
EHH EHH (Process) 09 3.0 (Process) 09 3.0 (Storage)(Storage)
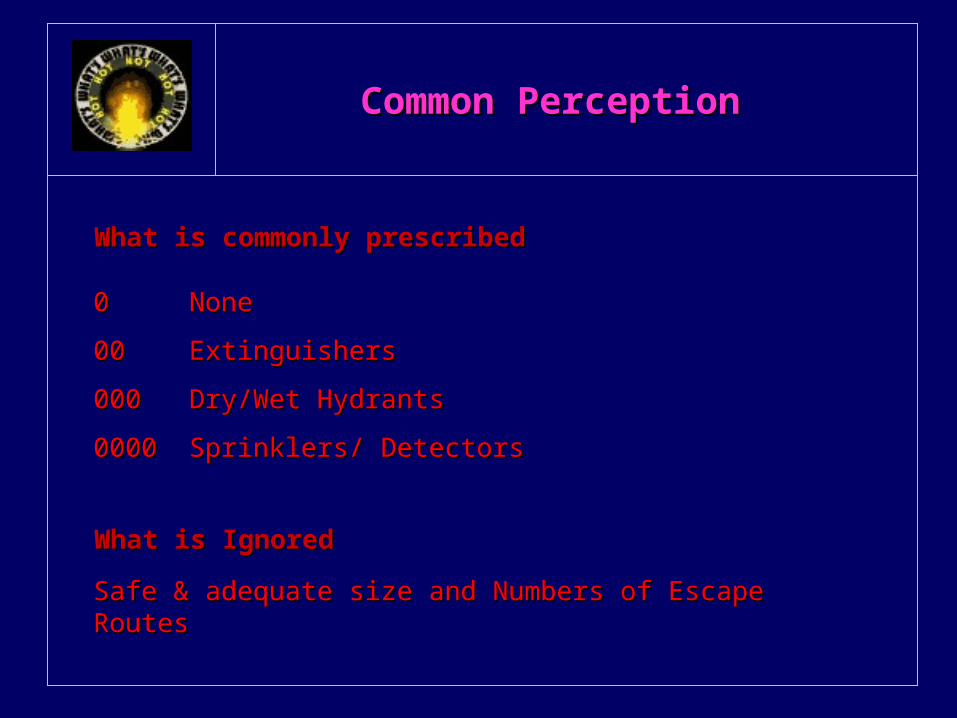
Common PerceptionCommon Perception
What is IgnoredWhat is Ignored
What is commonly prescribedWhat is commonly prescribed
00 NoneNone0000 Extinguishers Extinguishers 000000 Dry/Wet HydrantsDry/Wet Hydrants00000000 Sprinklers/ DetectorsSprinklers/ Detectors
Safe & adequate size and Numbers of Escape Safe & adequate size and Numbers of Escape RoutesRoutes
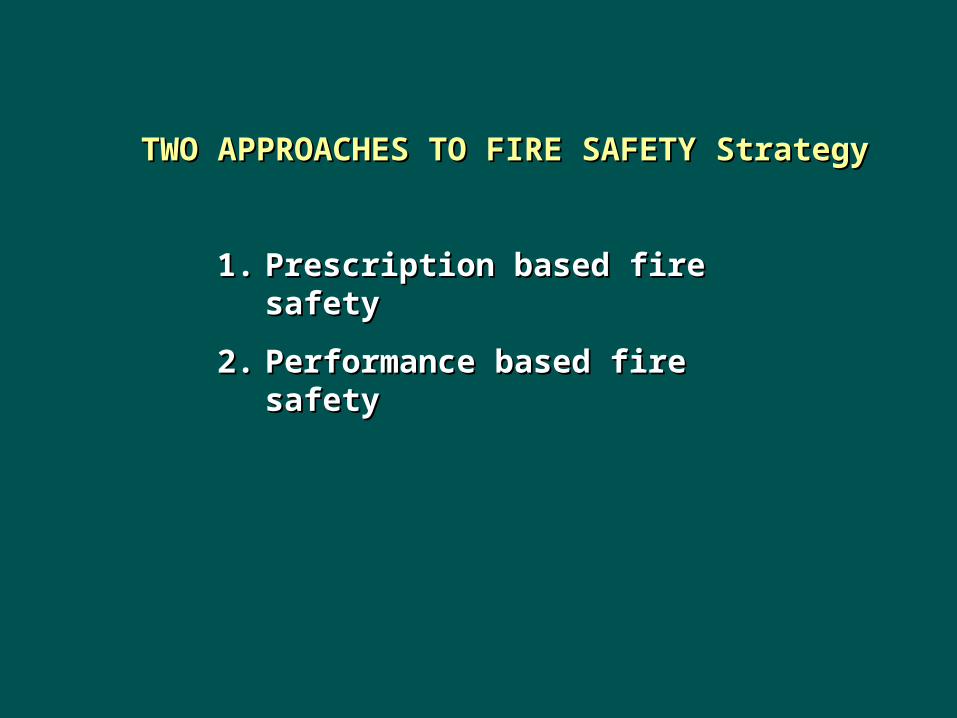
TWO APPROACHES TO FIRE SAFETY TWO APPROACHES TO FIRE SAFETY Strategy Strategy
1.1. Prescription based fire safetyPrescription based fire safety2.2. Performance based fire safetyPerformance based fire safety
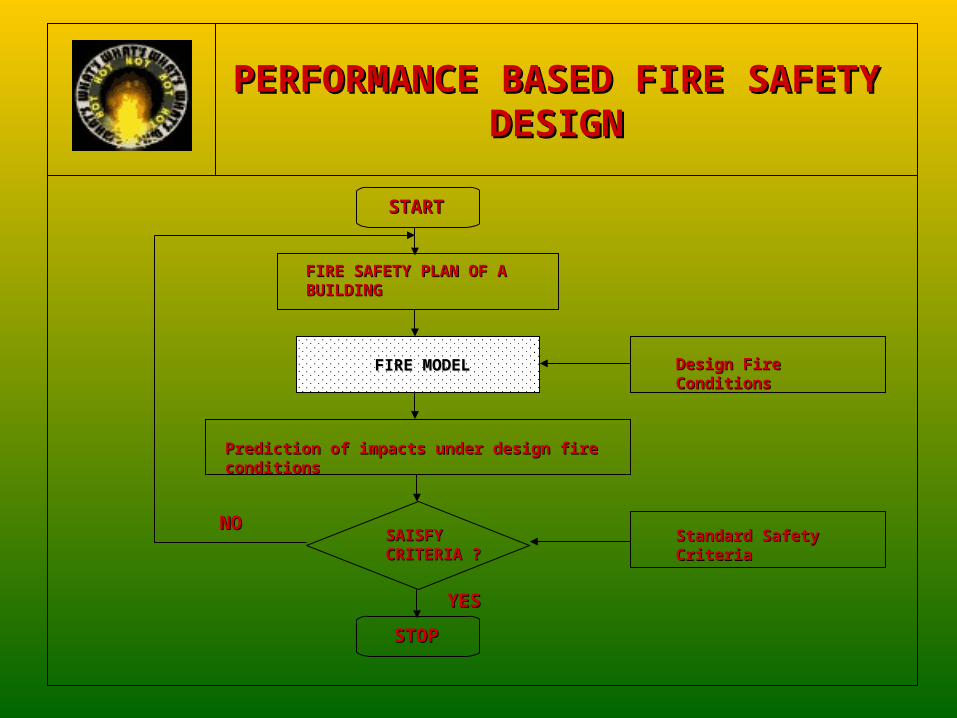
PERFORMANCE BASED FIRE SAFETY PERFORMANCE BASED FIRE SAFETY DESIGNDESIGN
STARTSTART
STOPSTOP
FIRE SAFETY PLAN OF A FIRE SAFETY PLAN OF A BUILDINGBUILDING
FIRE MODELFIRE MODEL
Prediction of impacts under design fire conditionsPrediction of impacts under design fire conditions
SAISFY SAISFY CRITERIA ?CRITERIA ?
YESYES
NONO
Design Fire ConditionsDesign Fire Conditions
Standard Safety CriteriaStandard Safety Criteria

What is a Model?What is a Model?
Physically of mentally contrived emulation of ‘reality’ suggested by what understanding we have of the phenomenon
MODEL POTENTIAL
A Model must have capacity or ‘potential to be valuable
A model is valuable depends upon the case and how the model is employed
A model which has the potential to be valuable may not be valuable in a given case because it may be inappropriate for that case.
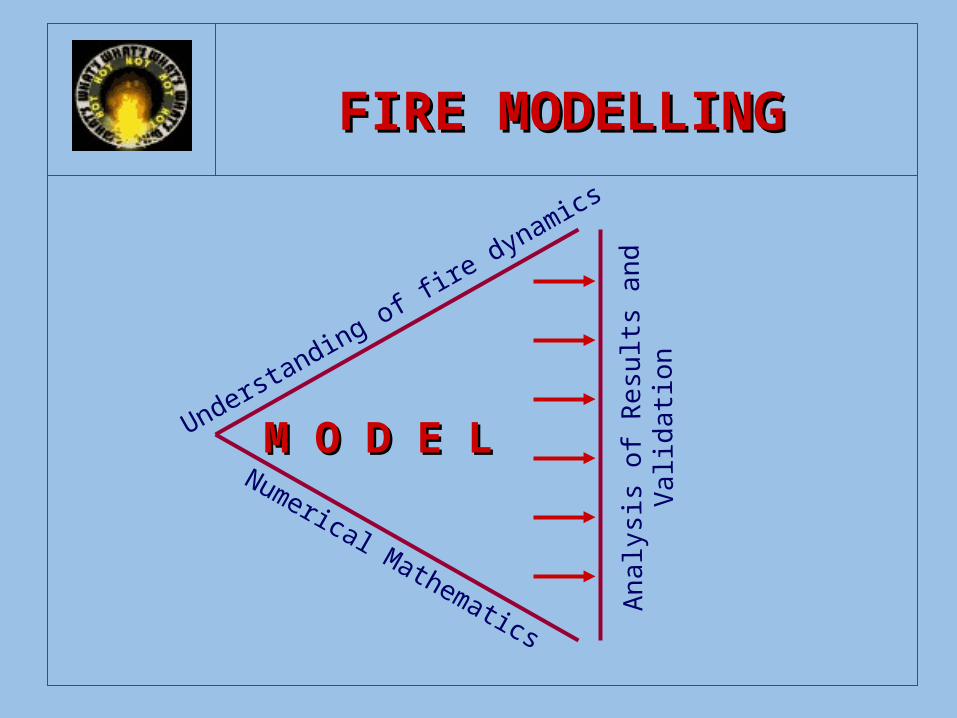
FIRE MODELLINGFIRE MODELLING
M O D E LM O D E LUnderstanding of fir
e dynamics
Numerical Mathematics Ana
lysi
s of
Res
ults
and
Val
idat
ion
200
400
600
800
200 400 600 800 1000
1200Time(S)
Tem
pera
ture
(C)
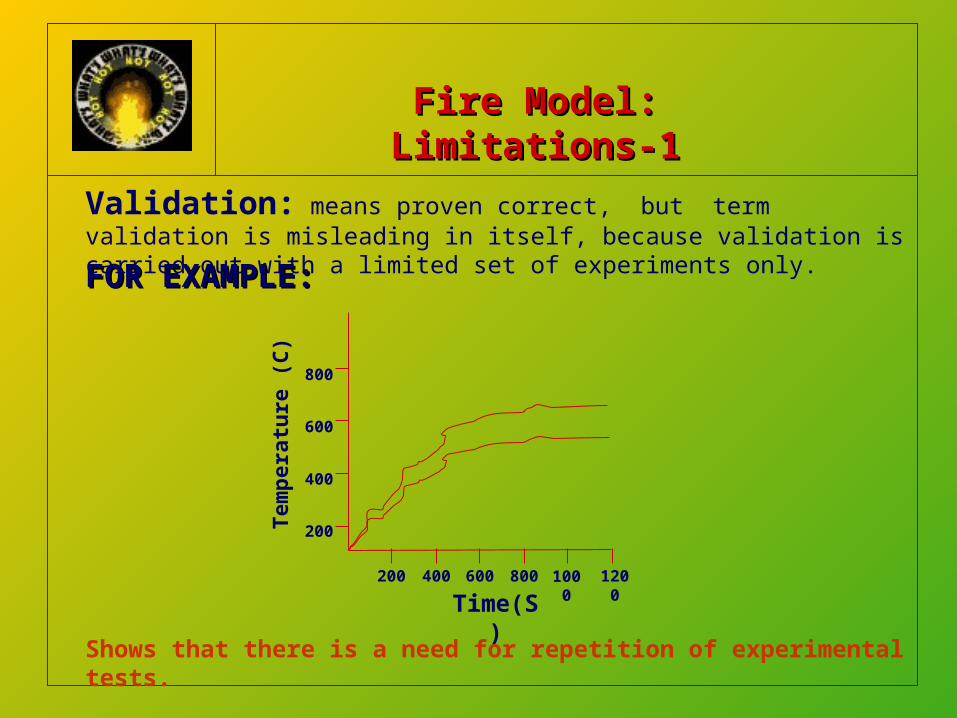
Fire Model: Limitations-1Fire Model: Limitations-1
Validation: means proven correct, but term validation is misleading in itself, because validation is carried out with a limited set of experiments only.
Shows that there is a need for repetition of experimental tests.
FOR EXAMPLE:FOR EXAMPLE:
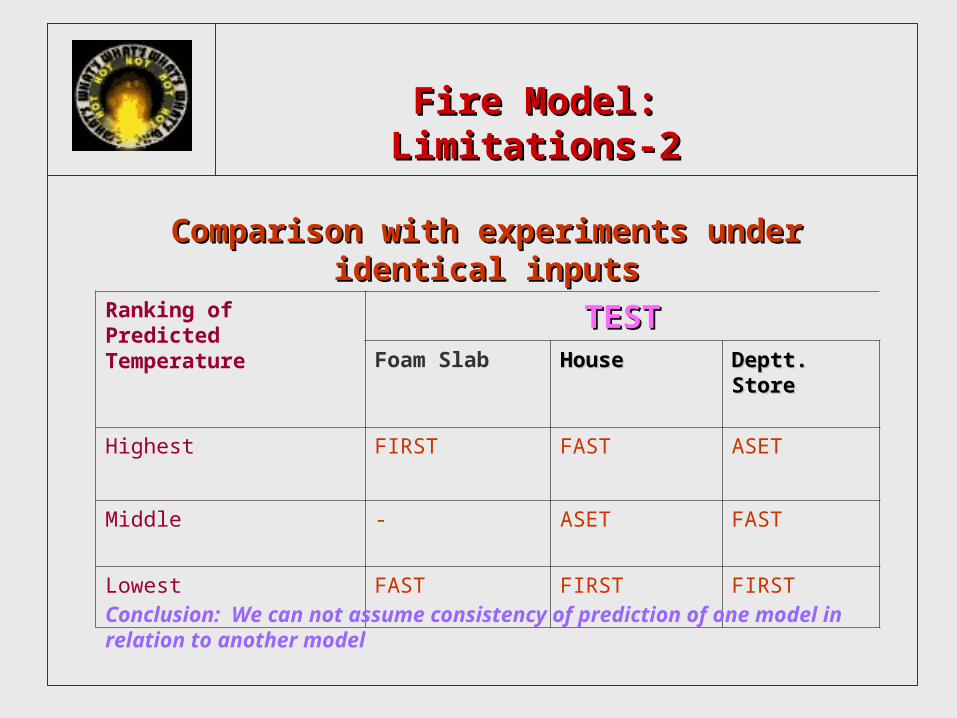
Fire Model: Limitations-2Fire Model: Limitations-2
Ranking of Predicted Temperature TESTTEST
Foam Slab HouseHouse Deptt. StoreDeptt. Store
Highest FIRST FAST ASET
Middle - ASET FAST
Lowest FAST FIRST FIRST
Comparison with experiments under identical inputsComparison with experiments under identical inputs
Conclusion: We can not assume consistency of prediction of one model in relation to another model
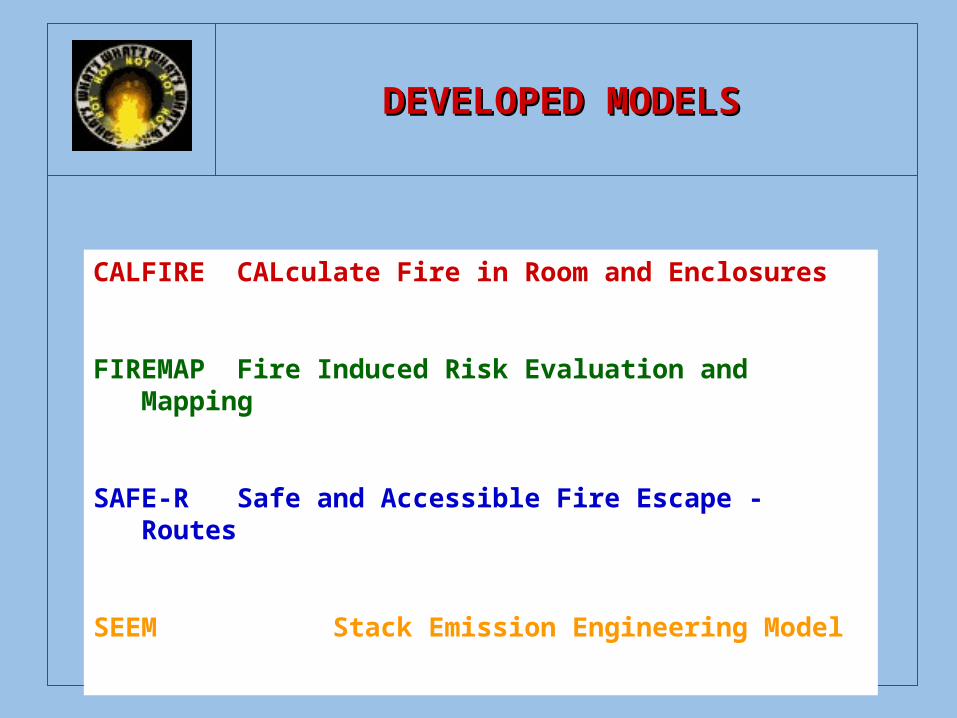
DEVELOPED MODELSDEVELOPED MODELS
CALFIRE CALculate Fire in Room and Enclosures
FIREMAP Fire Induced Risk Evaluation and Mapping
SAFE-R Safe and Accessible Fire Escape - Routes
SEEM Stack Emission Engineering Model
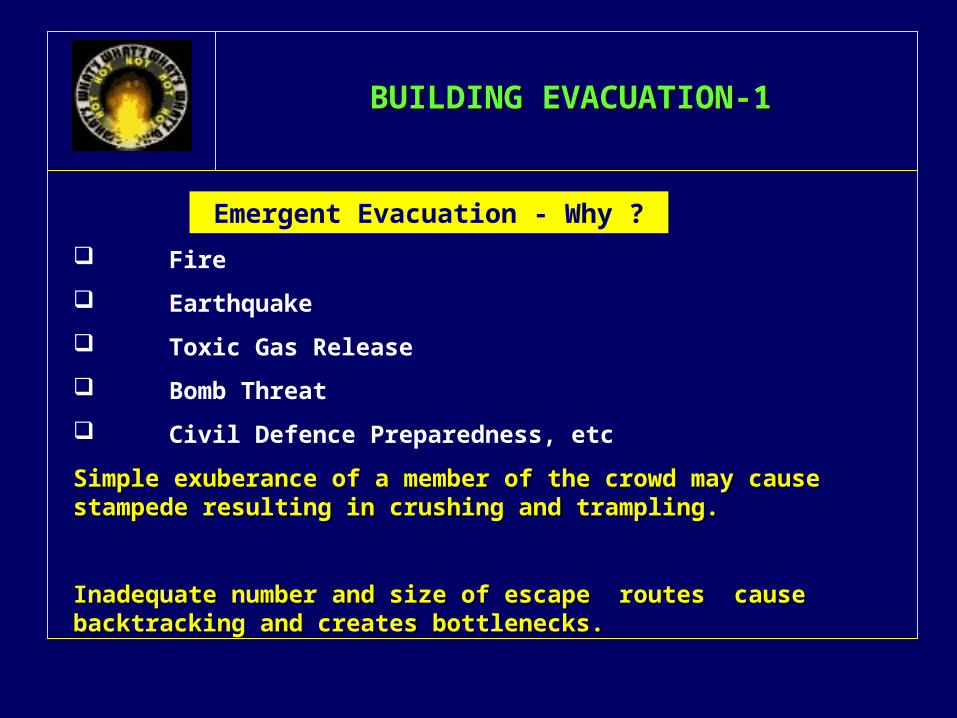
BUILDING EVACUATION-1BUILDING EVACUATION-1
Emergent Evacuation - Why ? Fire Earthquake Toxic Gas Release Bomb Threat Civil Defence Preparedness, etc
Simple exuberance of a member of the crowdSimple exuberance of a member of the crowd may cause stampede may cause stampede resulting in crushing and trampling.resulting in crushing and trampling.
Inadequate number and size of escape routes cause backtracking and Inadequate number and size of escape routes cause backtracking and creates bottlenecks.creates bottlenecks.
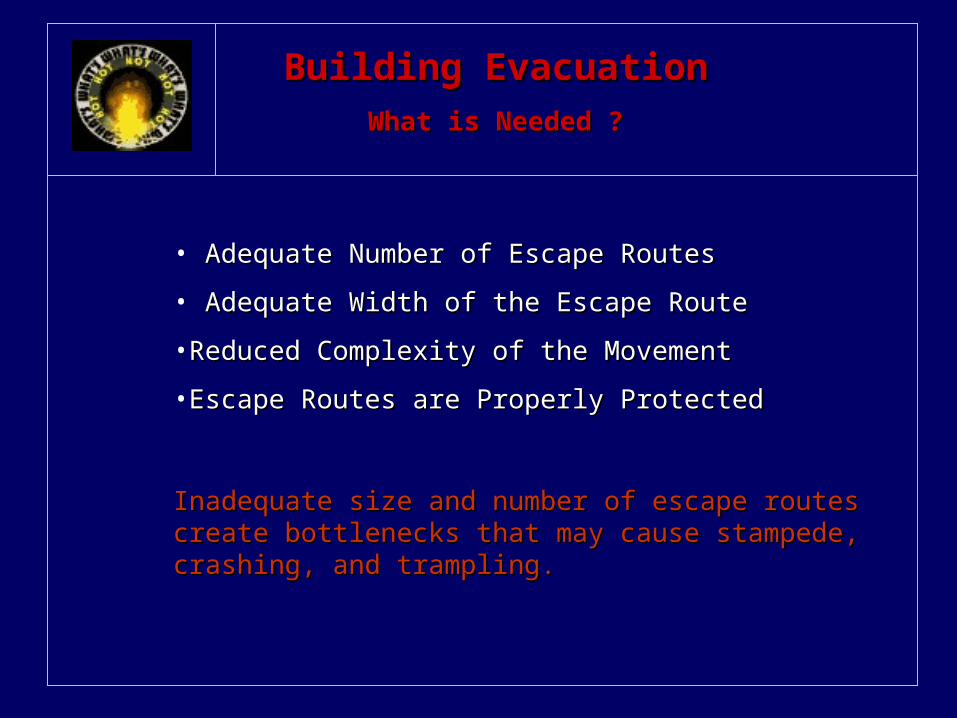
Building EvacuationBuilding EvacuationWhat is Needed ?What is Needed ?
• Adequate Number of Escape RoutesAdequate Number of Escape Routes• Adequate Width of the Escape RouteAdequate Width of the Escape Route•Reduced Complexity of the MovementReduced Complexity of the Movement•Escape Routes are Properly ProtectedEscape Routes are Properly Protected
Inadequate size and number of escape routes Inadequate size and number of escape routes create bottlenecks that may cause stampede, create bottlenecks that may cause stampede, crashing, and trampling.crashing, and trampling.
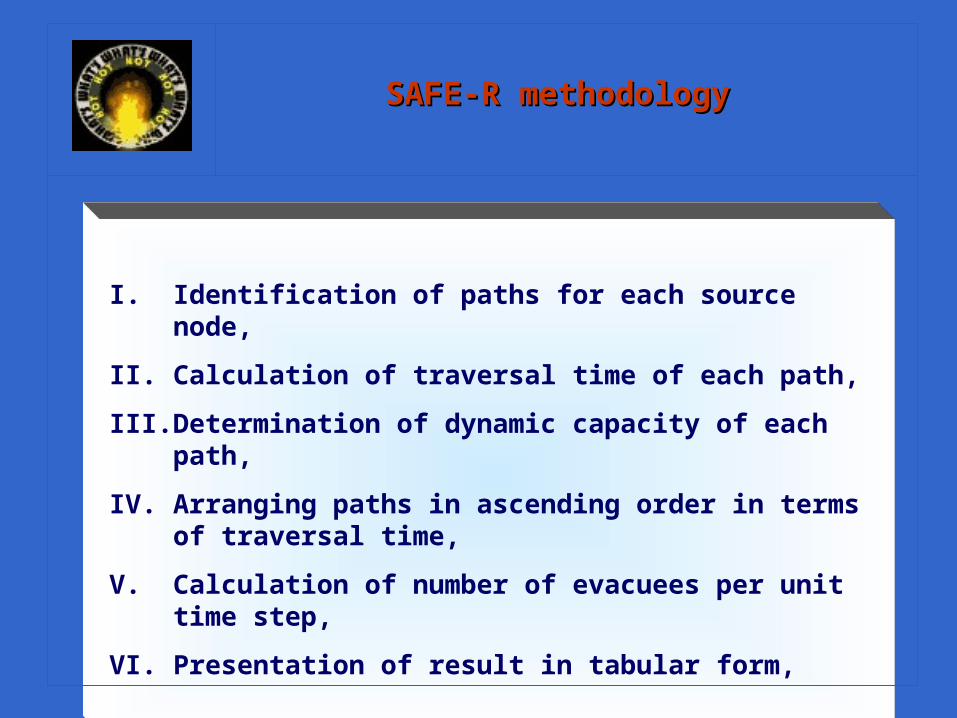
I. Identification of paths for each source node,
II. Calculation of traversal time of each path,
III. Determination of dynamic capacity of each path,
IV. Arranging paths in ascending order in terms of traversal time,
V. Calculation of number of evacuees per unit time step,
VI. Presentation of result in tabular form,
SAFE-R methodologySAFE-R methodology
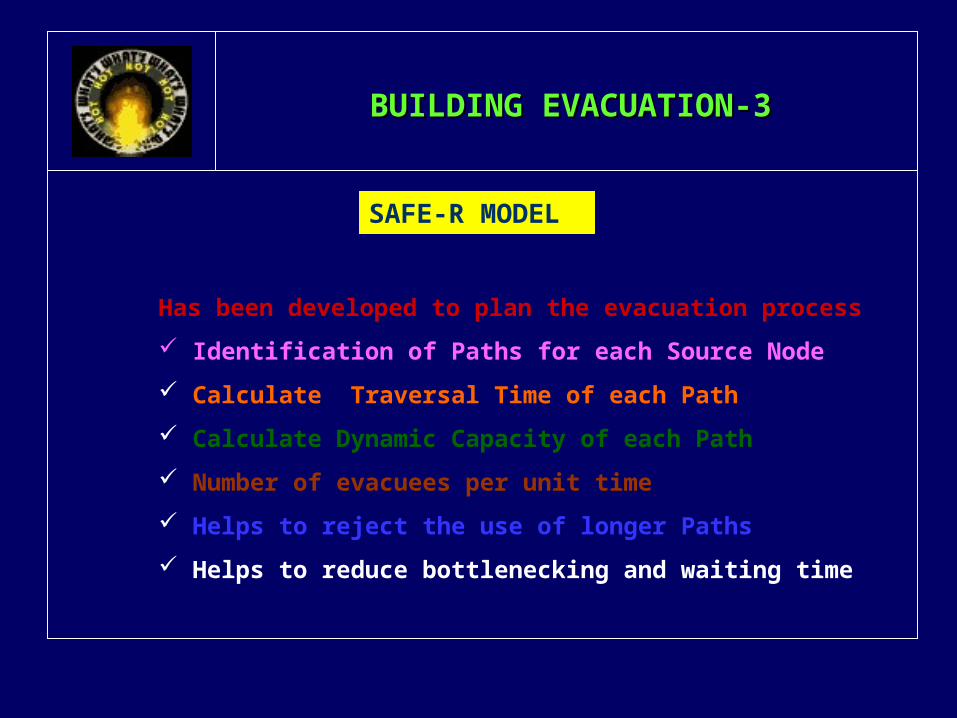
BUILDING EVACUATION-3BUILDING EVACUATION-3
SAFE-R MODEL
Has been developed to plan the evacuation process Identification of Paths for each Source Node Calculate Traversal Time of each Path Calculate Dynamic Capacity of each Path Number of evacuees per unit time Helps to reject the use of longer Paths Helps to reduce bottlenecking and waiting time
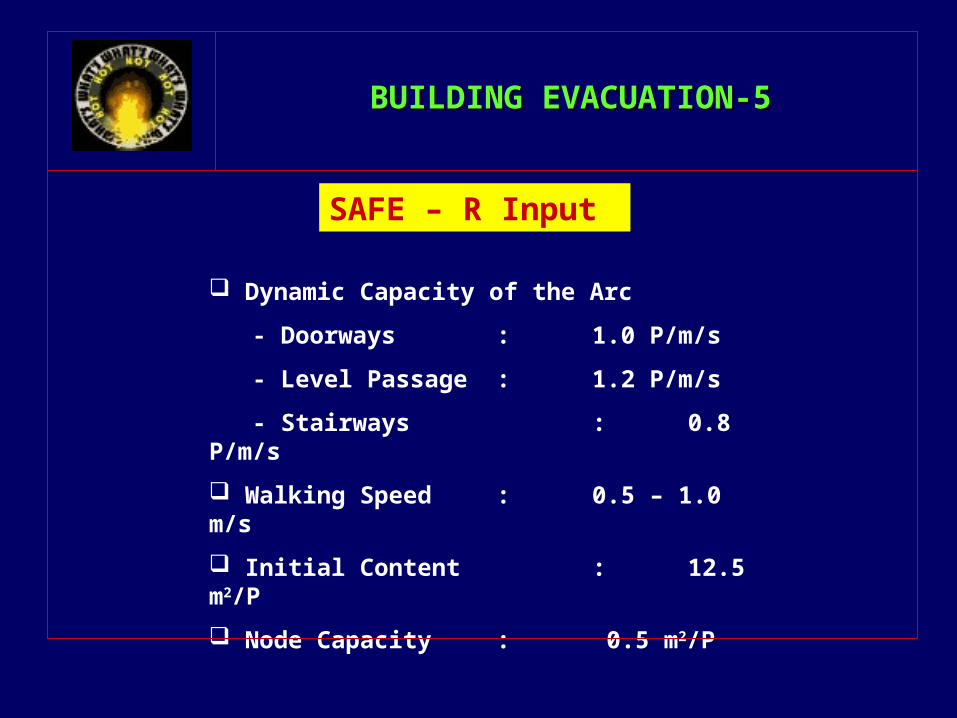
BUILDING EVACUATION-5BUILDING EVACUATION-5
SAFE – R Input
Dynamic Capacity of the Arc
- Doorways : 1.0 P/m/s
- Level Passage : 1.2 P/m/s
- Stairways : 0.8 P/m/s Walking Speed : 0.5 – 1.0 m/s Initial Content : 12.5 m2/P Node Capacity : 0.5 m2/P
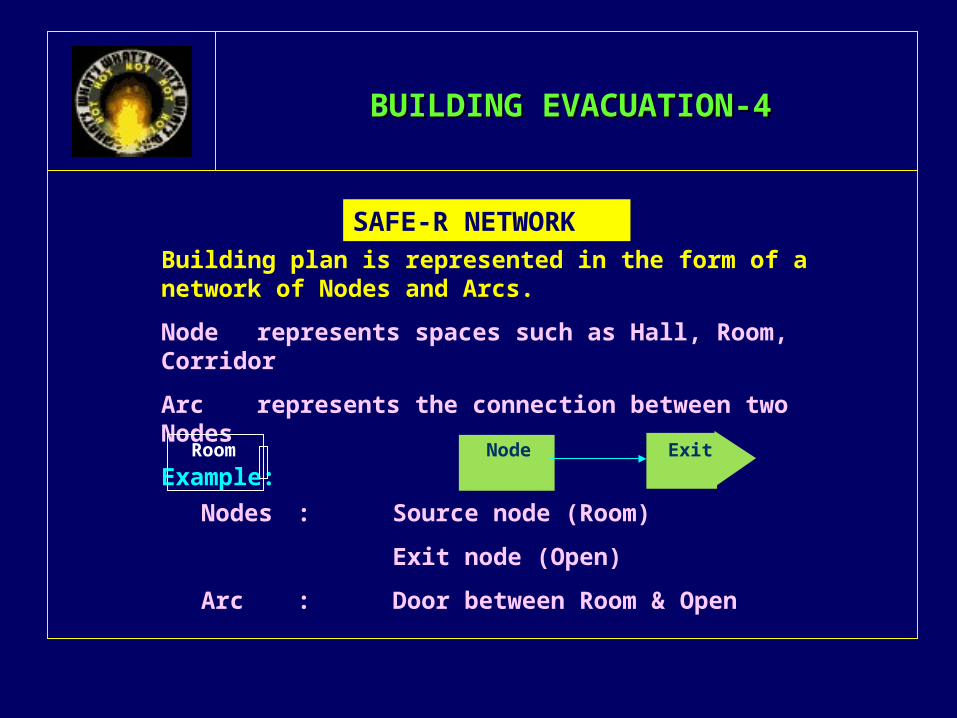
BUILDING EVACUATION-4BUILDING EVACUATION-4
SAFE-R NETWORKBuilding plan is represented in the form of a network of Nodes and Arcs.
Node represents spaces such as Hall, Room, Corridor
Arc represents the connection between two Nodes
Example:Room Node Exit
Nodes : Source node (Room)
Exit node (Open)
Arc : Door between Room & Open
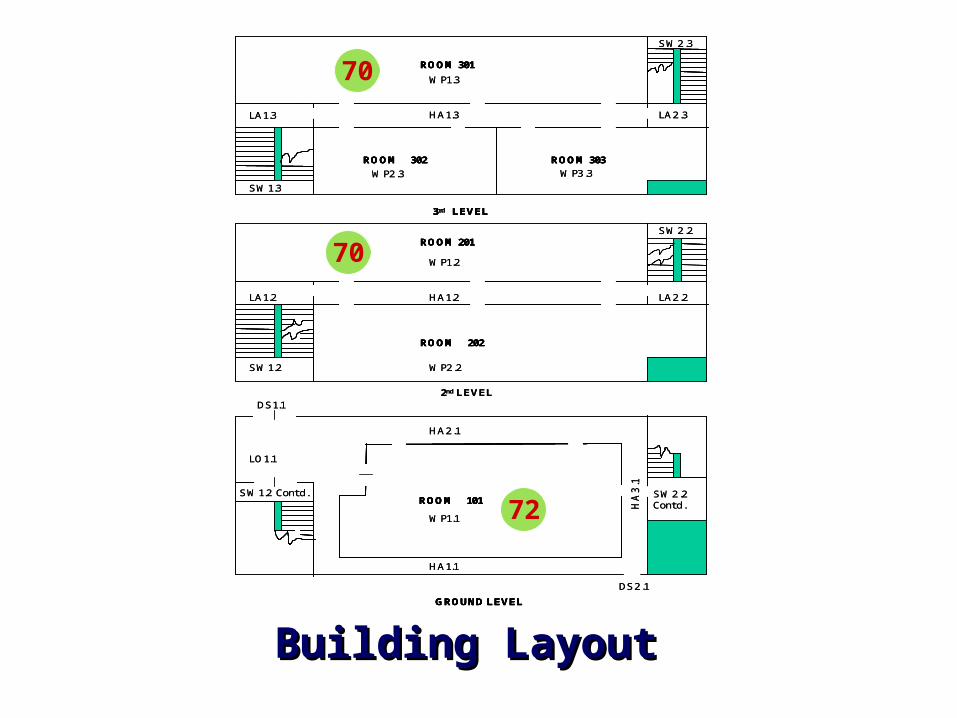
Building LayoutBuilding Layout
70
70
72
ROOM 301
ROOM 302 ROOM 303
ROOM 201
ROOM 202
ROOM 101
GROUND LEVEL
2nd LEVEL
3 LEVEL
ROOM 301
ROOM 302 ROOM 303
ROOM 201
ROOM 202
ROOM 101
GROUND LEVEL
3rd LEVEL
WP1.3
HA1.3LA1.3 LA2.3
WP2.3 WP3.3
SW2.3
WP1.2
LA1.2 HA1.2 LA2.2
WP2.2
SW2.2
SW1.2
HA2.1
LO1.1
HA1.1
WP1.1
SW1.2 Contd. SW2.2 Contd.HA
3.1
DS2.1
DS1.1
SW1.3
ROOM 301
ROOM 302 ROOM 303
ROOM 201
ROOM 202
ROOM 101
GROUND LEVEL
2nd LEVEL
3 LEVEL
ROOM 301
ROOM 302 ROOM 303
ROOM 201
ROOM 202
ROOM 101
GROUND LEVEL
3rd LEVEL
WP1.3
HA1.3LA1.3 LA2.3
WP2.3 WP3.3
SW2.3
WP1.2
LA1.2 HA1.2 LA2.2
WP2.2
SW2.2
SW1.2
HA2.1
LO1.1
HA1.1
WP1.1
SW1.2 Contd. SW2.2 Contd.HA
3.1
DS2.1
DS1.1
SW1.3
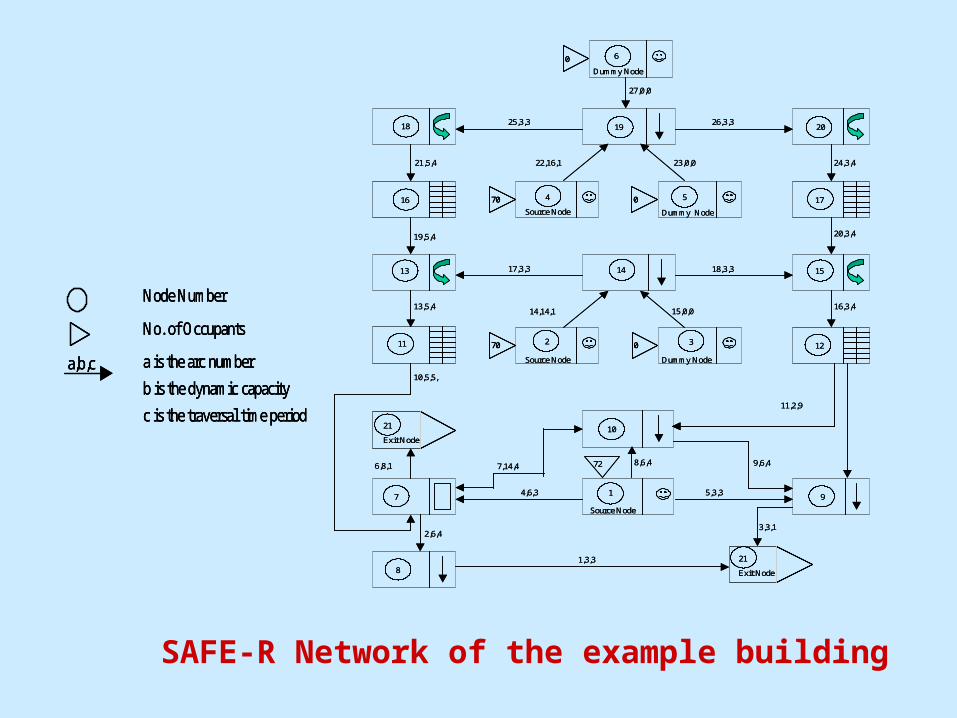
SAFE-R Network of the example building
a,b,c
Node Number
No. of Occupants
a is the arc numberb is the dynamic capacityc is the traversal time period
a,b,c
Node Number
No. of Occupants
a is the arc numberb is the dynamic capacityc is the traversal time period
a,b,c
Node Number
No. of Occupants
a is the arc numberb is the dynamic capacityc is the traversal time period
0
70 0
070
6
19
72
18
16 174 5
20
13 15
11 122 3
14
1
10
7 9
8
21
Exit Node
21
Exit Node
1,3,3
2,6,4
6,8,1
10,5,5,
13,5,4
19,5,4
21,5,4
25,3,3 26,3,3
18,3,317,3,3
22,16,1 23,0,0
27,0,0
24,3,4
20,3,4
16,3,4
11,2,9
14,14,1 15,0,0
9,6,48,6,4
5,3,34,6,3
7,14,4
3,3,1
Source Node
Source Node Dummy Node
Dummy Node
Dummy Node
Source Node
00
7070 00
007070
6
19
72
18
16 174 5
20
13 15
11 122 3
14
1
10
7 9
8
21
Exit Node
21
Exit Node
1,3,3
2,6,4
6,8,1
10,5,5,
13,5,4
19,5,4
21,5,4
25,3,3 26,3,3
18,3,317,3,3
22,16,1 23,0,0
27,0,0
24,3,4
20,3,4
16,3,4
11,2,9
14,14,1 15,0,0
9,6,48,6,4
5,3,34,6,3
7,14,4
3,3,1
Source Node
Source Node Dummy Node
Dummy Node
Dummy Node
Source Node
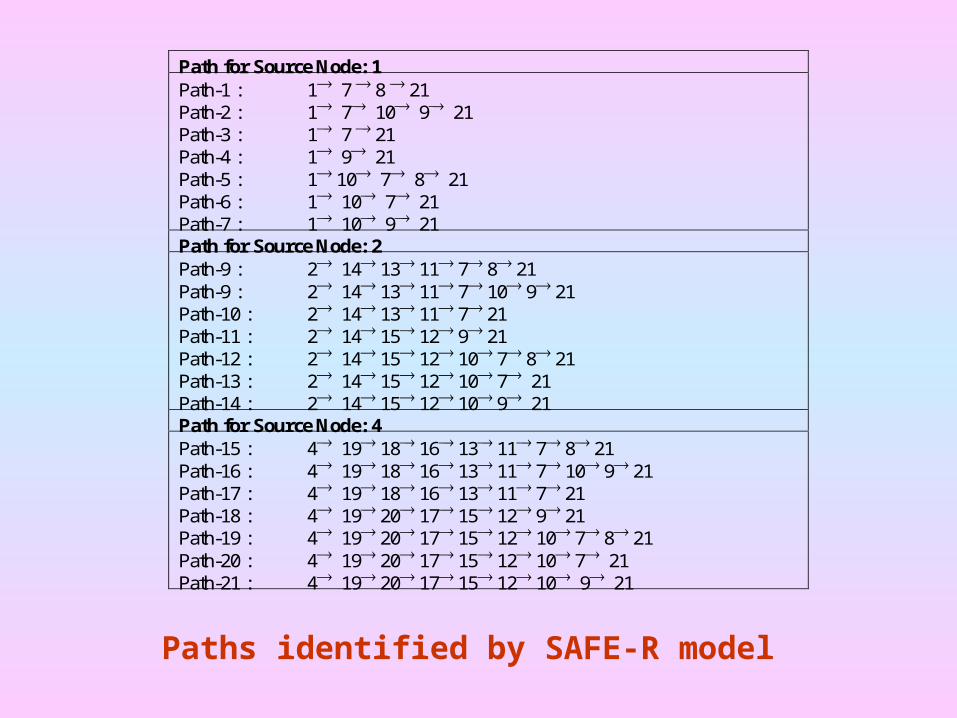
Paths identified by SAFE-R model
Path for Source Node: 1 Path-1 : 1 7 8 21 Path-2 : 1 7 10 9 21 Path-3 : 1 7 21 Path-4 : 1 9 21 Path-5 : 1 10 7 8 21 Path-6 : 1 10 7 21 Path-7 : 1 10 9 21 Path for Source Node: 2 Path-9 : 2 14 13 11 7 8 21 Path-9 : 2 14 13 11 7 10 9 21 Path-10 : 2 14 13 11 7 21 Path-11 : 2 14 15 12 9 21 Path-12 : 2 14 15 12 10 7 8 21 Path-13 : 2 14 15 12 10 7 21 Path-14 : 2 14 15 12 10 9 21 Path for Source Node: 4 Path-15 : 4 19 18 16 13 11 7 8 21 Path-16 : 4 19 18 16 13 11 7 10 9 21 Path-17 : 4 19 18 16 13 11 7 21 Path-18 : 4 19 20 17 15 12 9 21 Path-19 : 4 19 20 17 15 12 10 7 8 21 Path-20 : 4 19 20 17 15 12 10 7 21 Path-21 : 4 19 20 17 15 12 10 9 21
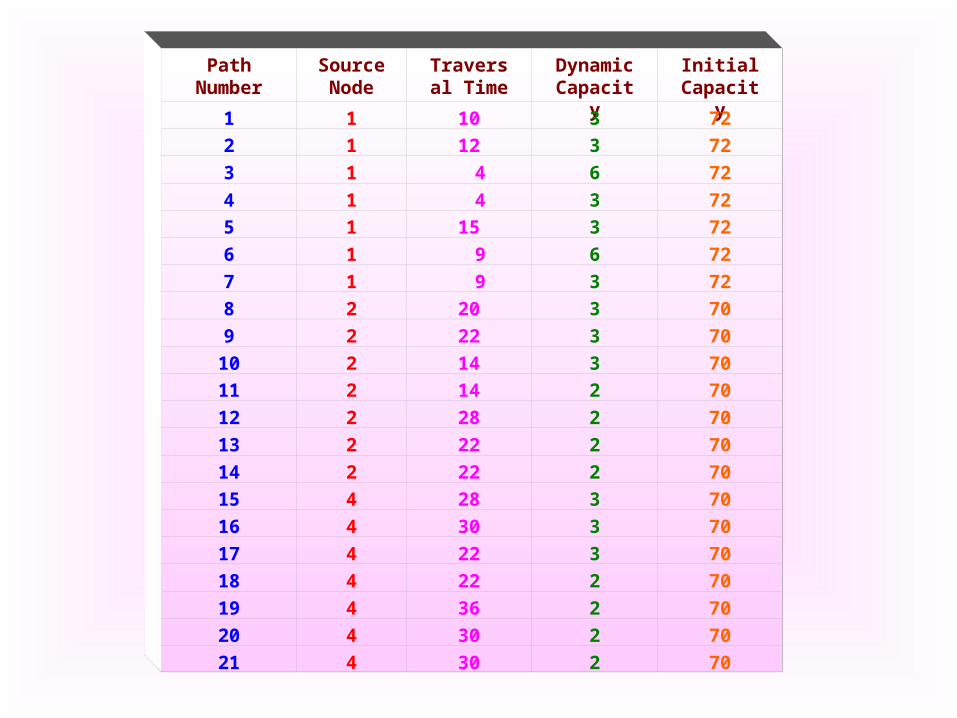
Path Number
Source Node
Traversal Time
Dynamic Capacity
Initial Capacity
1 1 10 3 722 1 12 3 723 1 4 6 724 1 4 3 725 1 15 3 726 1 9 6 727 1 9 3 728 2 20 3 709 2 22 3 70
10 2 14 3 7011 2 14 2 7012 2 28 2 7013 2 22 2 7014 2 22 2 7015 4 28 3 7016 4 30 3 7017 4 22 3 7018 4 22 2 7019 4 36 2 7020 4 30 2 7021 4 30 2 70
Source Node
Initial Content
Path Utilized % of people flowing
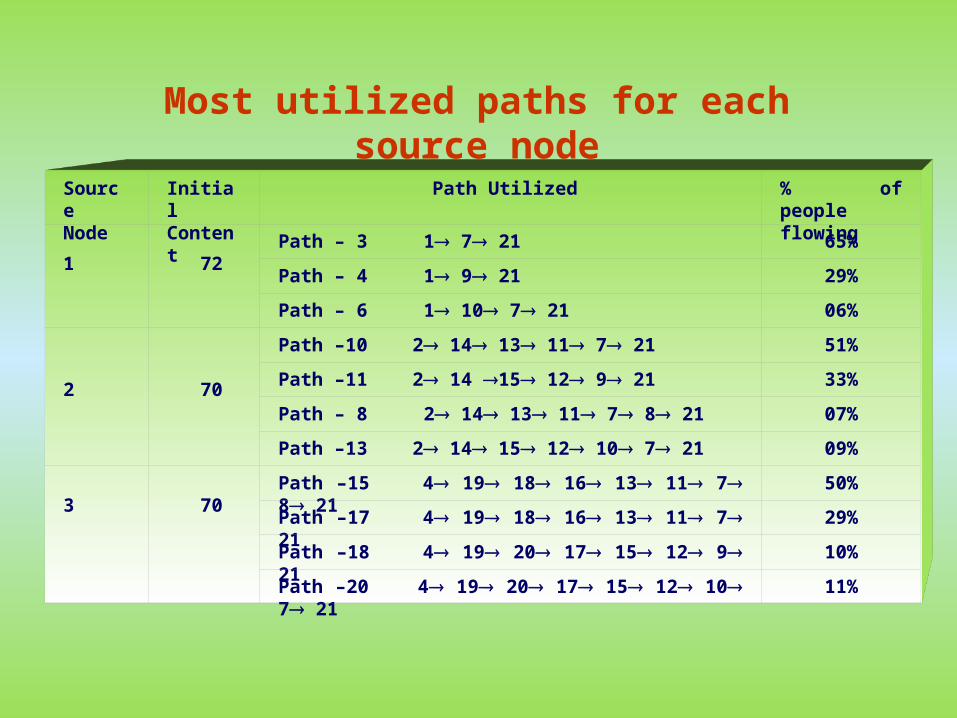
1
72
Path – 3 1 7 21 65%
Path – 4 1 9 21 29%
Path – 6 1 10 7 21 06%
2
70
Path –10 2 14 13 11 7 21 51%
Path –11 2 14 15 12 9 21 33%
Path – 8 2 14 13 11 7 8 21 07%
Path –13 2 14 15 12 10 7 21 09%
3
70
Path –15 4 19 18 16 13 11 7 8 21 50%
Path –17 4 19 18 16 13 11 7 21 29%
Path –18 4 19 20 17 15 12 9 21 10%
Path –20 4 19 20 17 15 12 10 7 21 11%
Most utilized paths for each source node
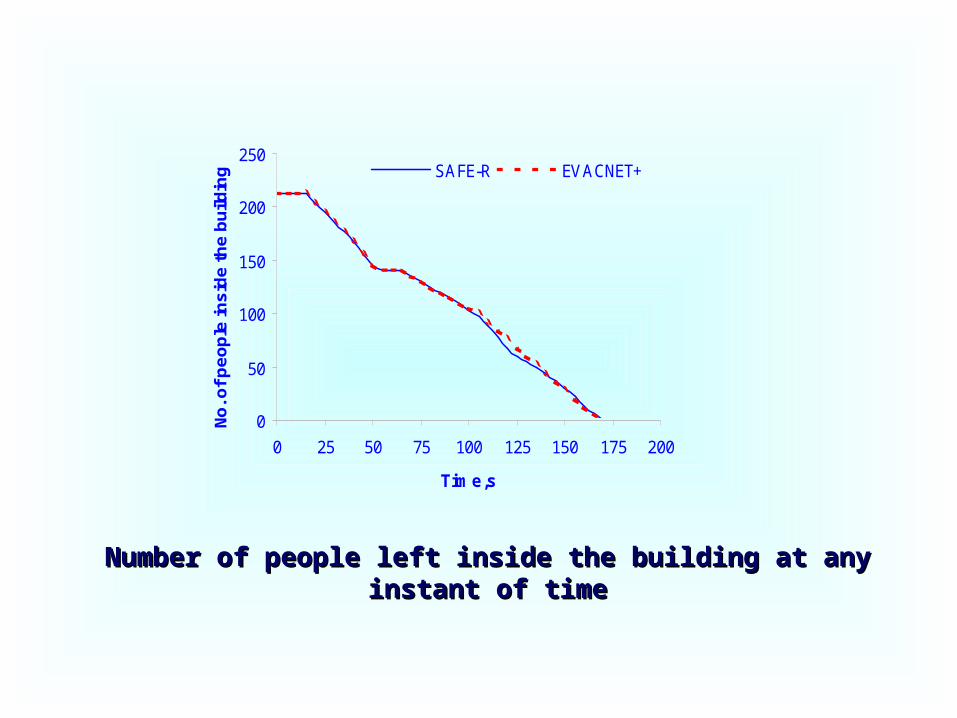
Number of people left inside the building at any instant of timeNumber of people left inside the building at any instant of time
0
50
100
150
200
250
0 25 50 75 100 125 150 175 200
Time,s
No. o
f peo
ple
insi
de th
e bu
ildin
g SAFE-R EVACNET+
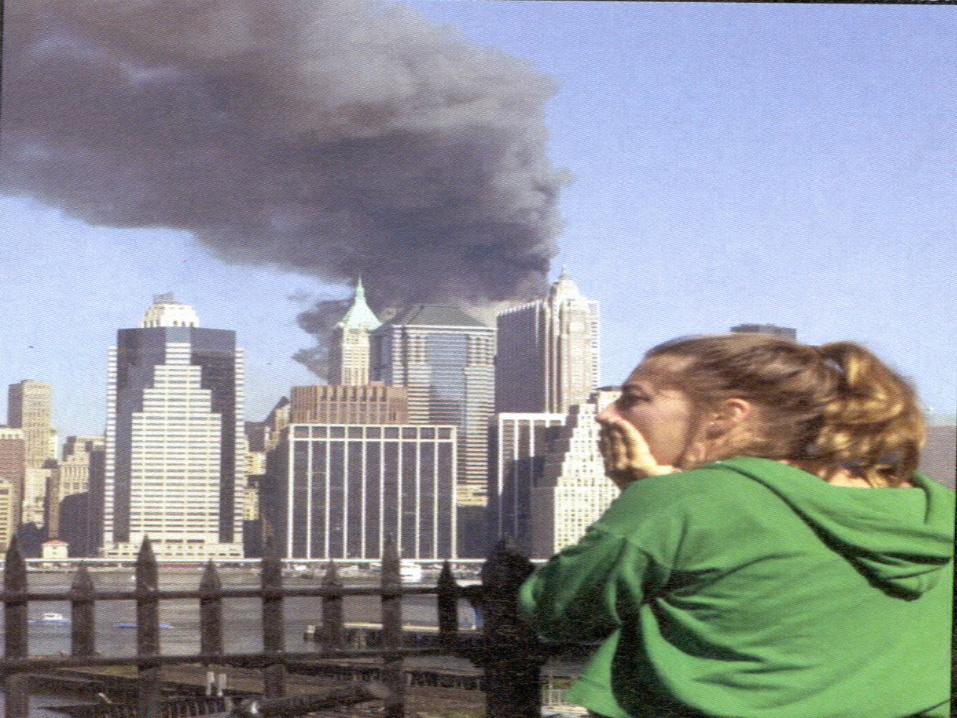
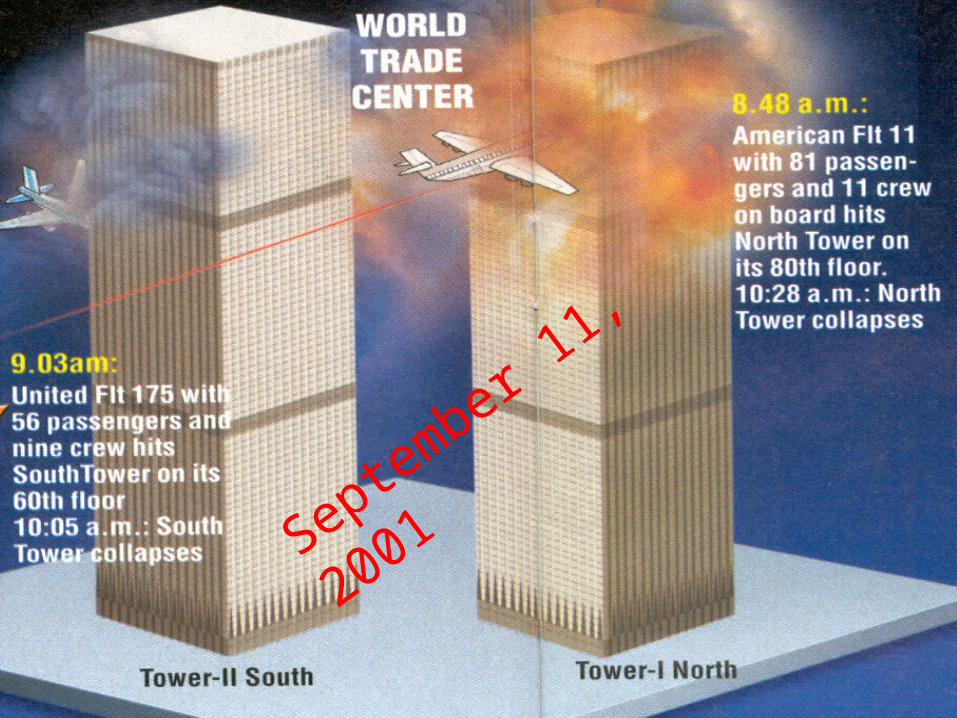
September 11,
2001
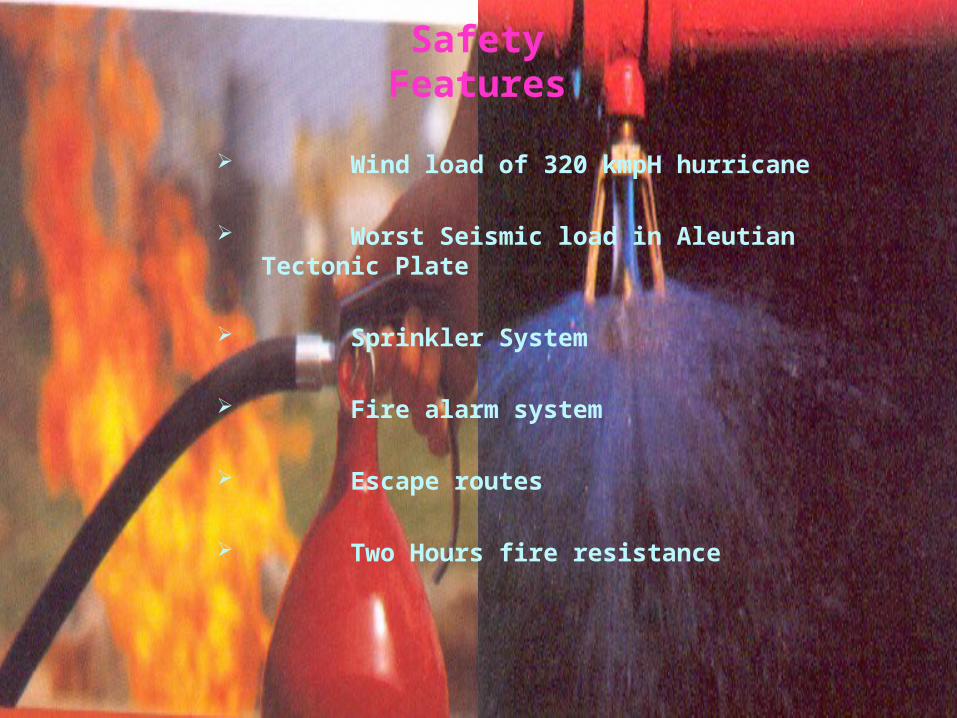
Safety Features
Wind load of 320 kmpH hurricane
Worst Seismic load in Aleutian Tectonic Plate
Sprinkler System
Fire alarm system
Escape routes
Two Hours fire resistance

Fuel Load : 90,000 lit.
Fuel Density : 0.8 kg/lit.
Fuel Mass : 72,000 kg
Heat of Comb : 44 MJ/kg
Fire Load : 3.168 x 10⁶ MJ
Fire Duration : 1 hr
Heat release rate : 880 MW
Equivalent to 2 NAPS or 2 Super TPPs.
Fire Load
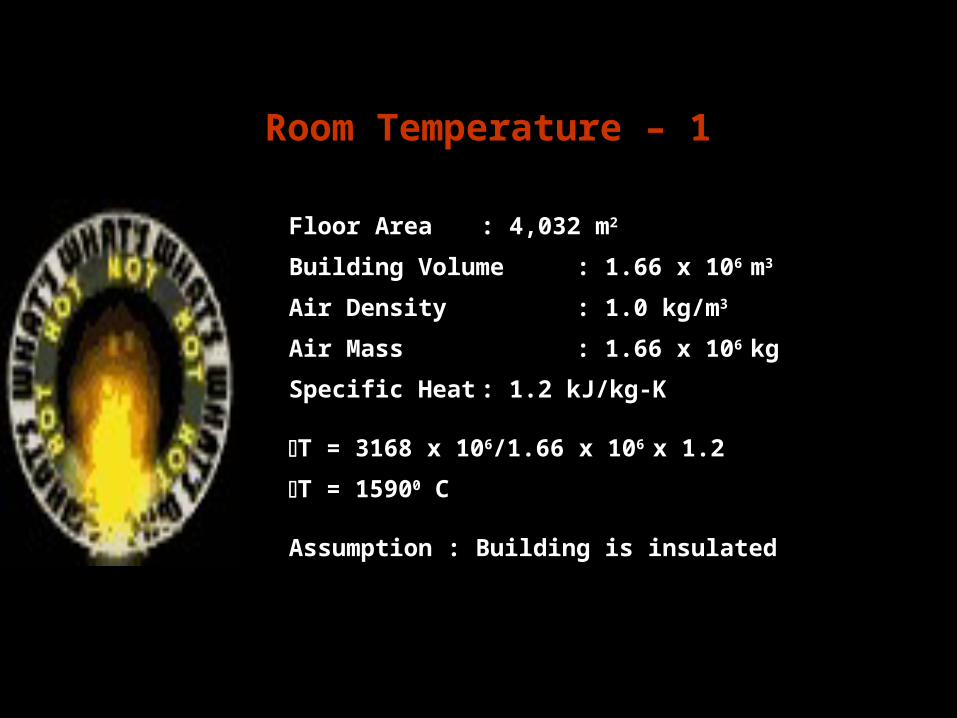
Floor Area : 4,032 m2
Building Volume : 1.66 x 10⁶ m3
Air Density : 1.0 kg/m3
Air Mass : 1.66 x 10⁶ kgSpecific Heat : 1.2 kJ/kg-K
T = 3168 x 106/1.66 x 106 x 1.2T = 15900 C
Assumption : Building is insulated
Room Temperature – 1
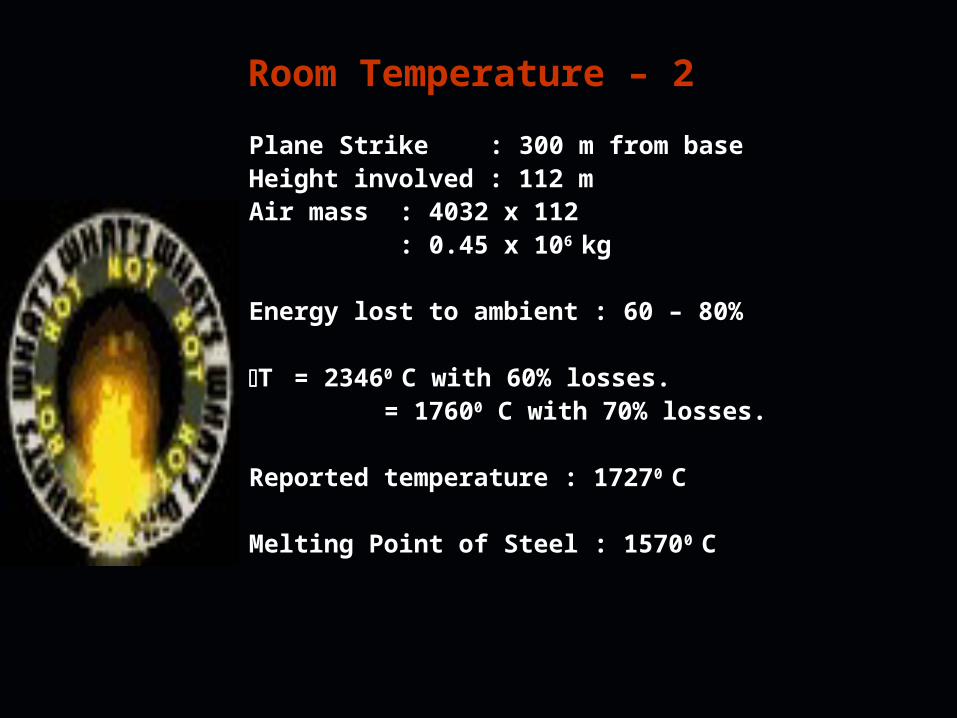
Room Temperature – 2Plane Strike : 300 m from baseHeight involved : 112 mAir mass : 4032 x 112
: 0.45 x 10⁶ kg
Energy lost to ambient : 60 – 80%
T = 23460 C with 60% losses. = 17600 C with 70% losses.
Reported temperature : 17270 C
Melting Point of Steel : 15700 C
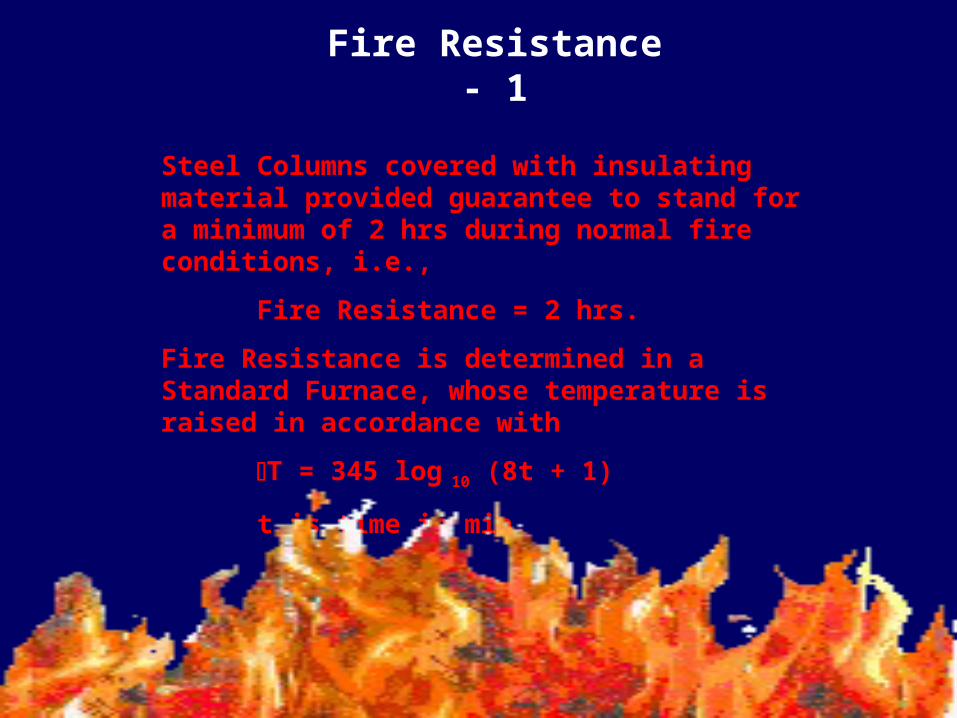
Fire Resistance - 1
Steel Columns covered with insulating material provided guarantee to stand for a minimum of 2 hrs during normal fire conditions, i.e.,
Fire Resistance = 2 hrs.
Fire Resistance is determined in a Standard Furnace, whose temperature is raised in accordance with
T = 345 log 10 (8t + 1)
t is time in min.
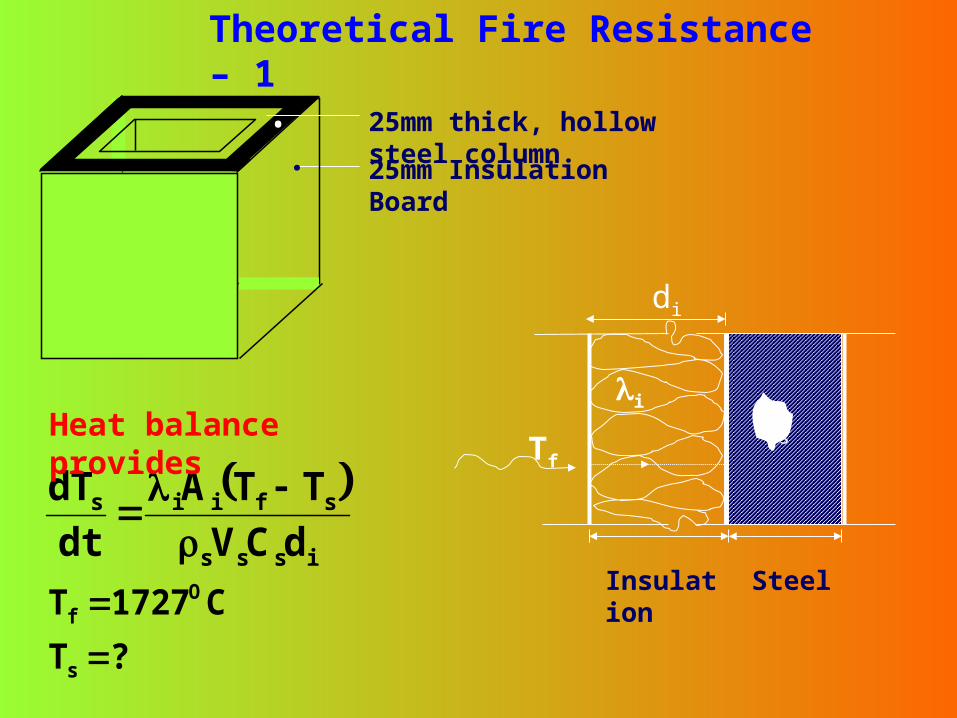
Theoretical Fire Resistance – 1
25mm Insulation Board.. 25mm thick, hollow steel column
SteelInsulation
i
Tf
di
Ts
isss
sfiis
dCVTTA
dtdT
?TC 1727T
s
Of
Heat balance provides
0
200
400
600
800
1000
1200
1400
1600
1800
2000
Time, S
Tem
pera
ture
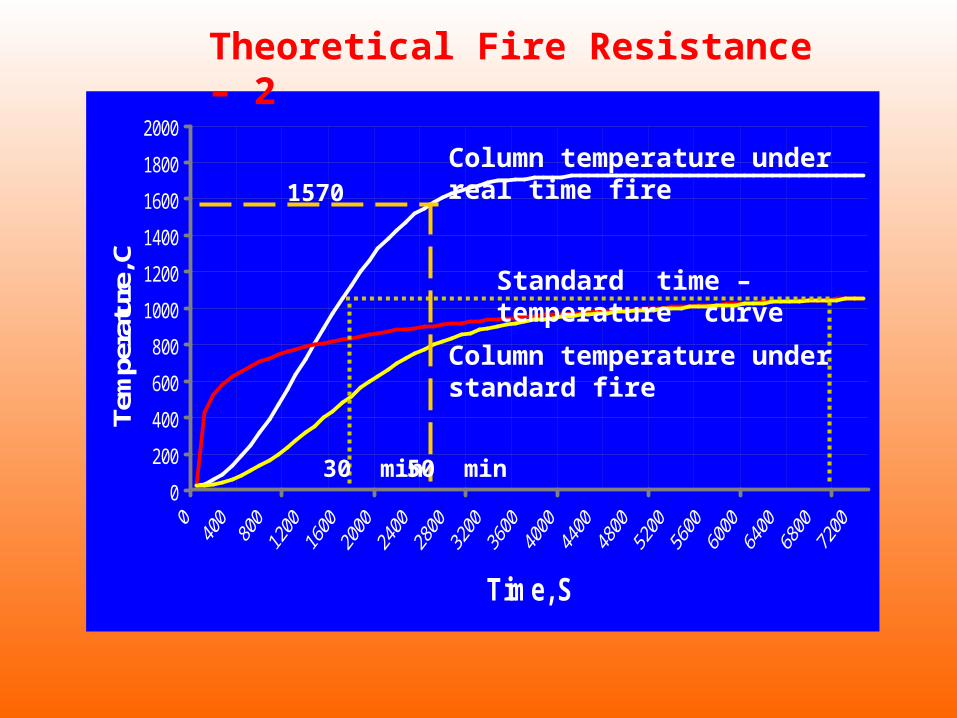
, CColumn temperature under real time fire
Standard time – temperature curve
30 min 50 min
1570
Theoretical Fire Resistance – 2
Column temperature under standard fire
0
200
400
600
800
1000
1200
Time, S
Tem
pera
ture
, C
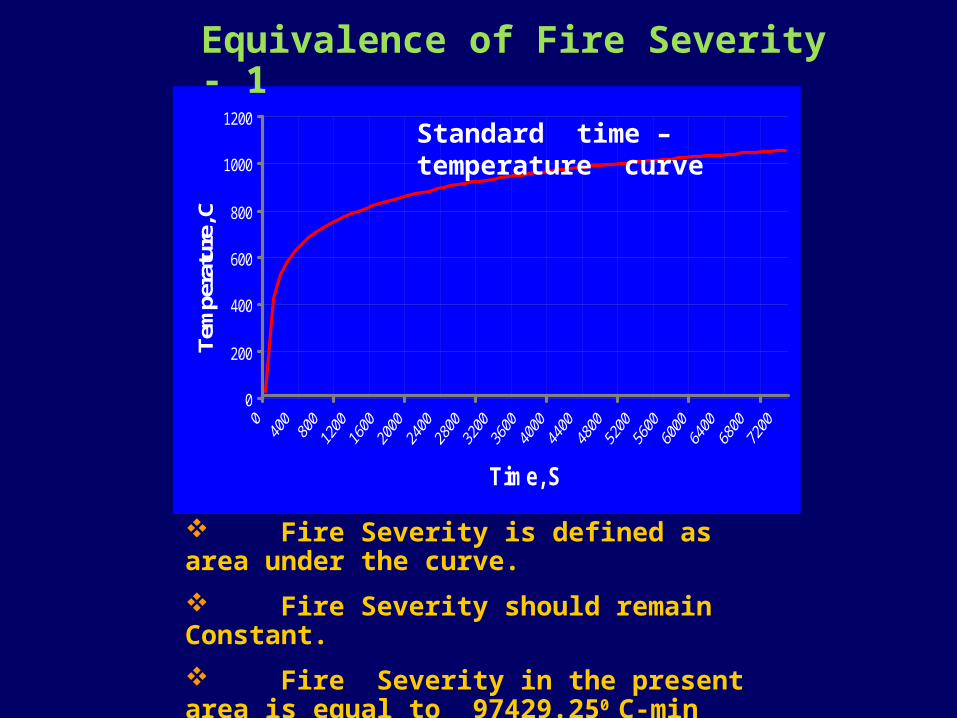
Fire Severity is defined as area under the curve. Fire Severity should remain Constant. Fire Severity in the present area is equal to 97429.250 C-min
Equivalence of Fire Severity - 1
Standard time – temperature curve
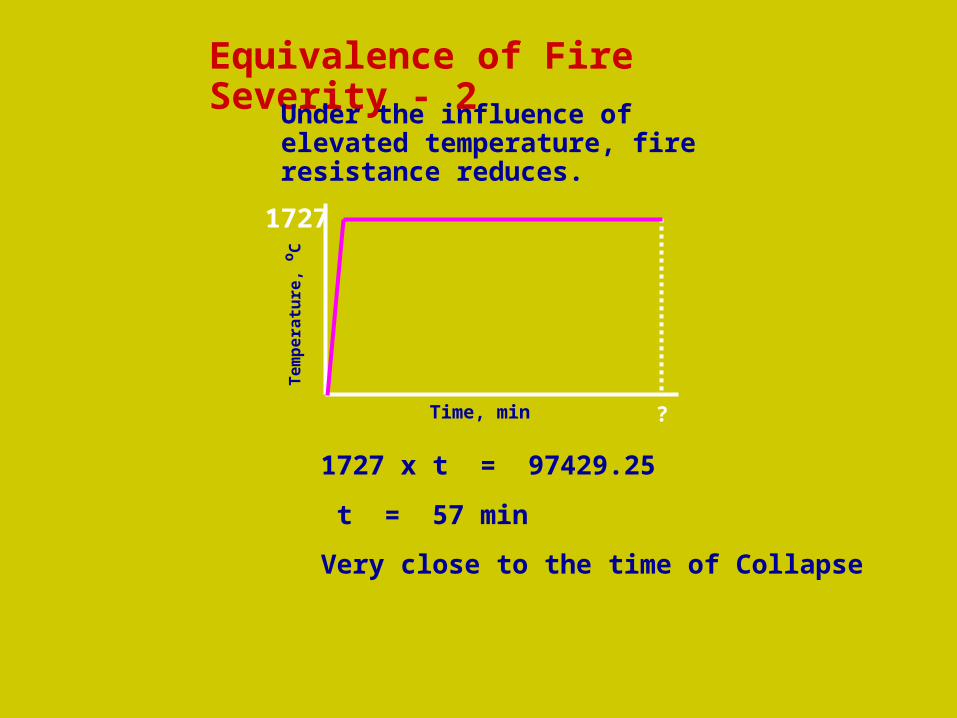
1727 x t = 97429.25
t = 57 min
Very close to the time of Collapse
Equivalence of Fire Severity - 2Under the influence of elevated temperature,
fire resistance reduces.
Tem
pera
ture
, oC
Time, min
1727
?
CALFIRE Example
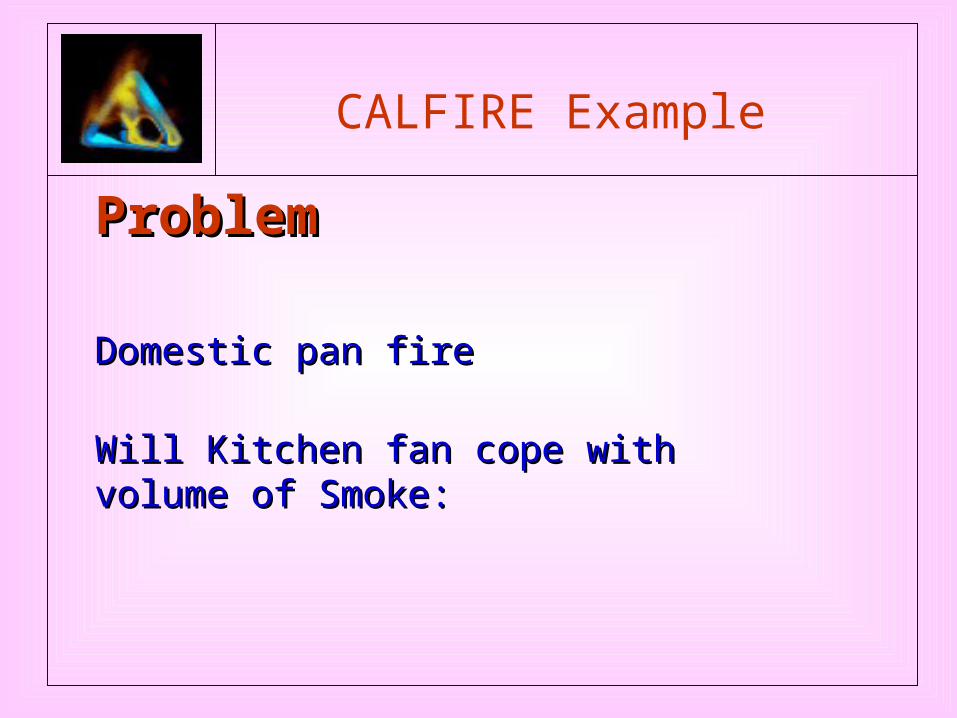
ProblemProblem
Domestic pan fireDomestic pan fire
Will Kitchen fan cope with volume of Will Kitchen fan cope with volume of Smoke:Smoke:
VENT/ FAN SIZE
Information on the proper size of VENT or for deciding suitable specification of an extractor FAN is required to check the descent of the hot gas layer below a certain level.
CALFIRE Example
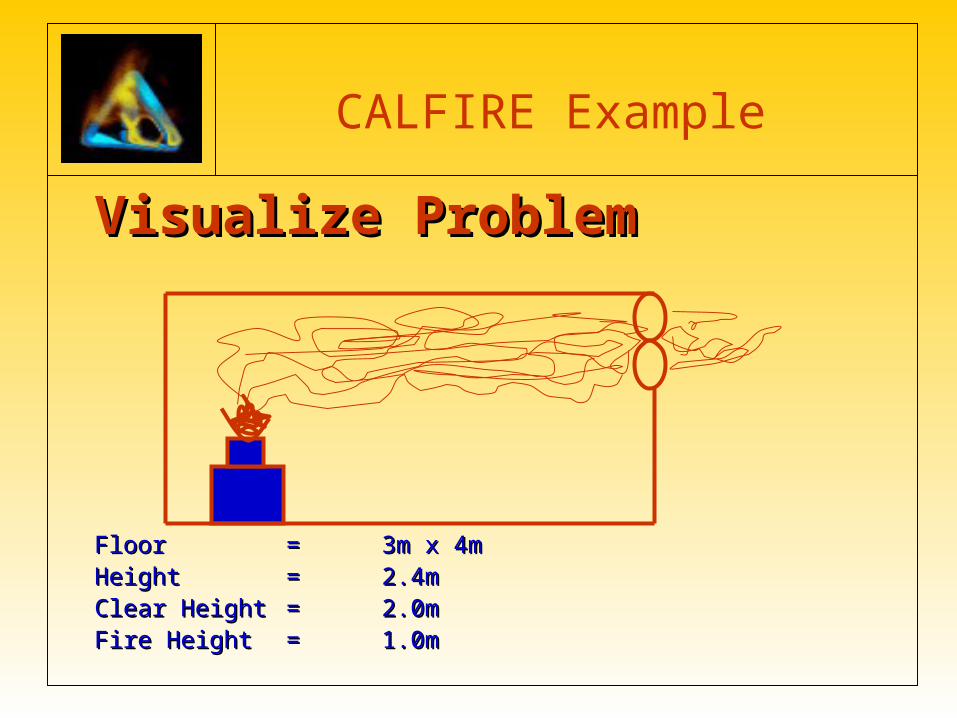
Visualize ProblemVisualize Problem
FloorFloor == 3m x 4m3m x 4mHeightHeight == 2.4m2.4mClear HeightClear Height == 2.0m2.0mFire HeightFire Height == 1.0m1.0m
CALFIRE Example
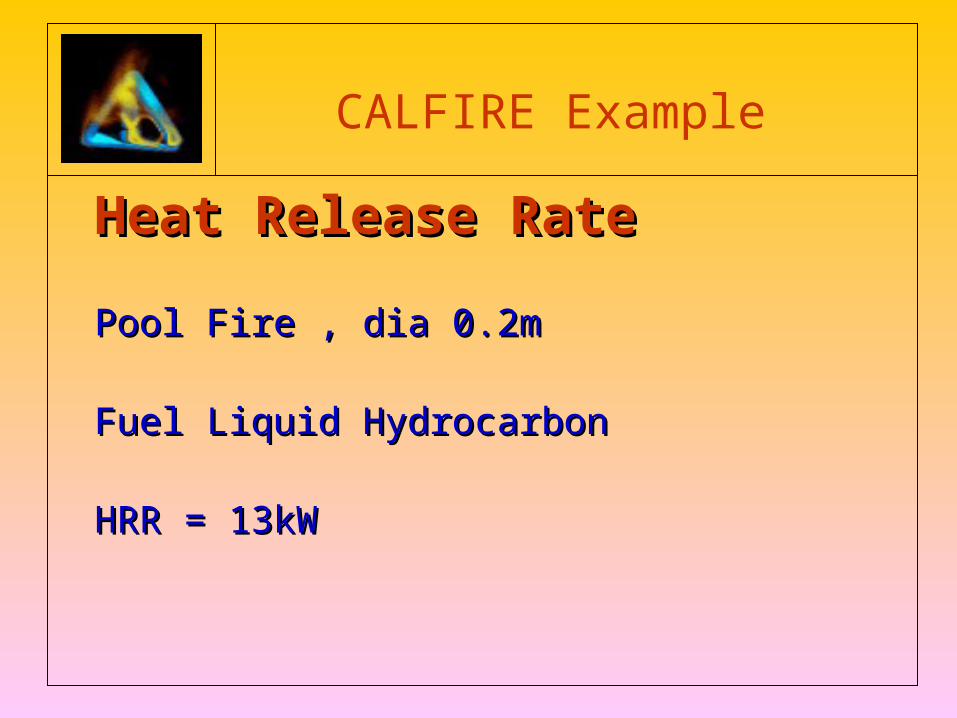
Heat Release RateHeat Release RatePool Fire , dia 0.2mPool Fire , dia 0.2m
Fuel Liquid Hydrocarbon Fuel Liquid Hydrocarbon
HRR = 13kWHRR = 13kW
CALFIRE Example
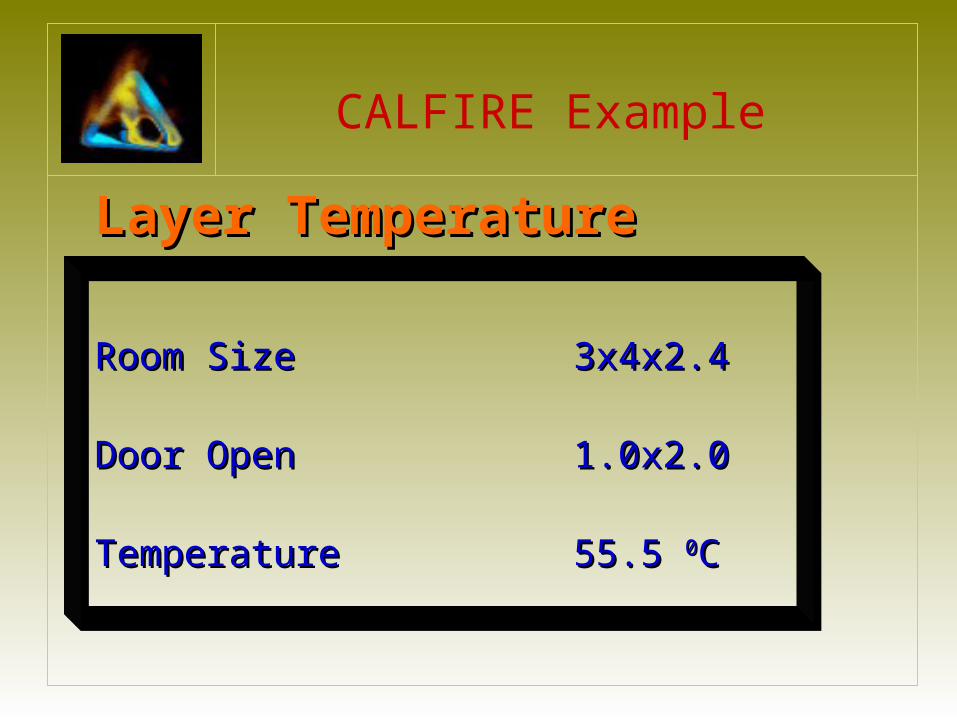
Layer TemperatureLayer Temperature
Room SizeRoom Size 3x4x2.43x4x2.4
Door OpenDoor Open 1.0x2.01.0x2.0
TemperatureTemperature 55.5 55.5 00CC
CALFIRE Example
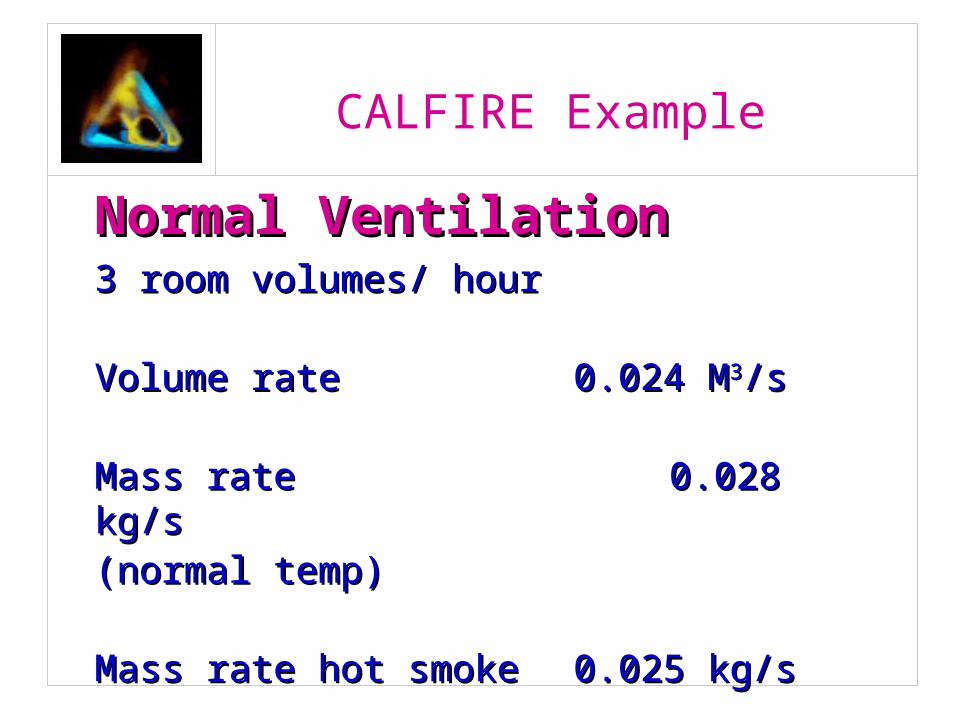
Normal VentilationNormal Ventilation3 room volumes/ hour3 room volumes/ hour
Volume rateVolume rate 0.024 M0.024 M33/s/s
Mass rateMass rate 0.028 kg/s0.028 kg/s(normal temp)(normal temp)
Mass rate hot smokeMass rate hot smoke 0.025 kg/s0.025 kg/s
CALFIRE Example
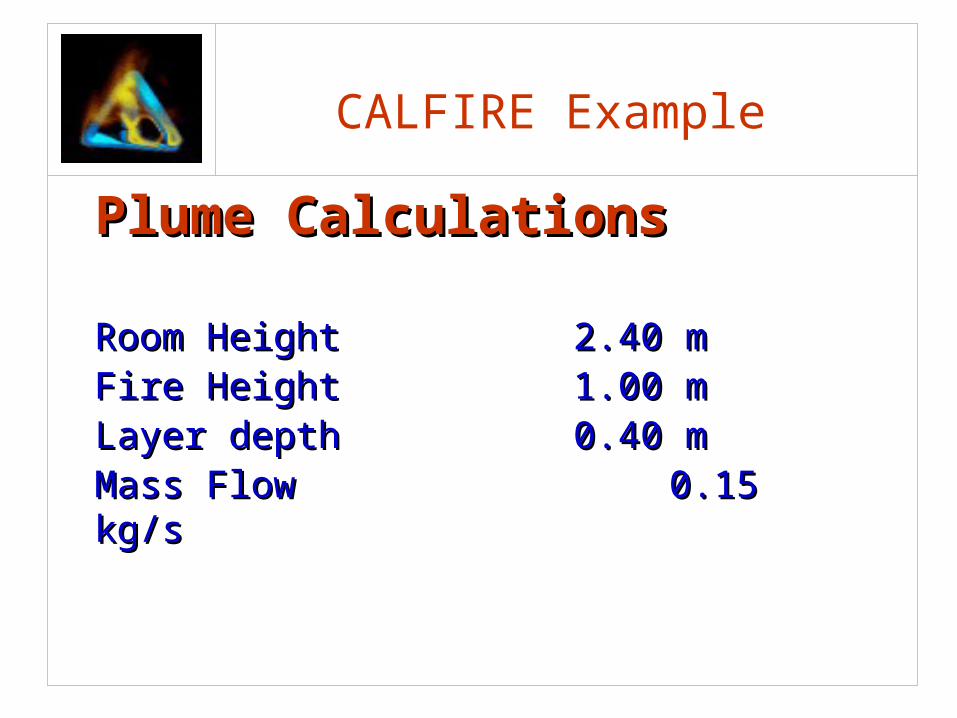
Plume CalculationsPlume Calculations
Room HeightRoom Height 2.40 m2.40 mFire HeightFire Height 1.00 m1.00 mLayer depthLayer depth 0.40 m0.40 mMass FlowMass Flow 0.15 kg/s0.15 kg/s
CALFIRE Example
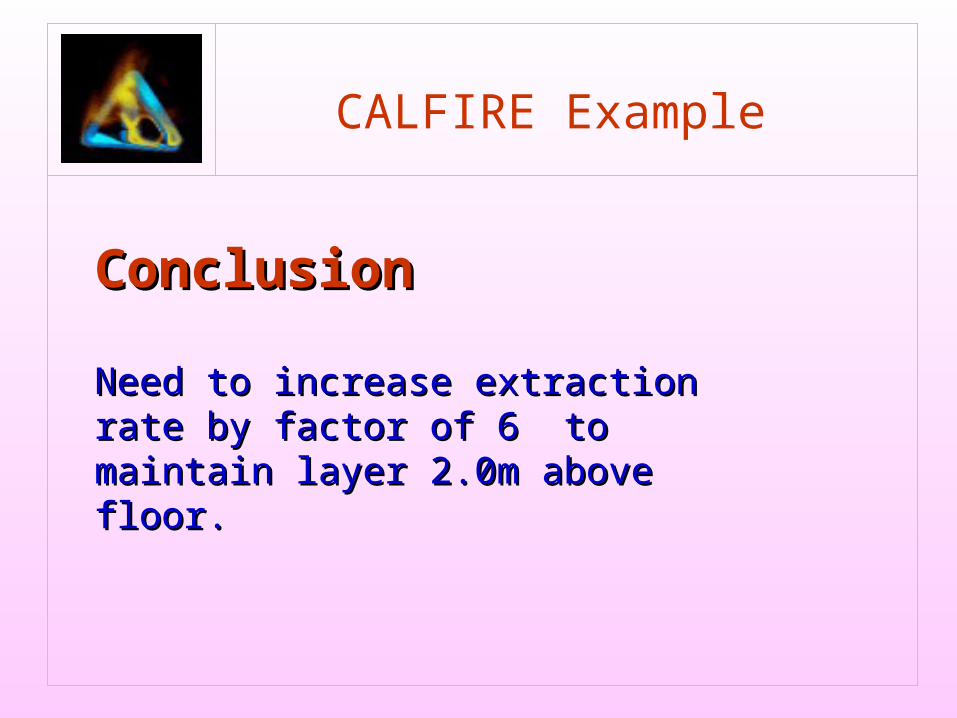
ConclusionConclusion
Need to increase extraction rate by Need to increase extraction rate by factor of 6 to maintain layer 2.0m factor of 6 to maintain layer 2.0m above floor.above floor.

Thank You
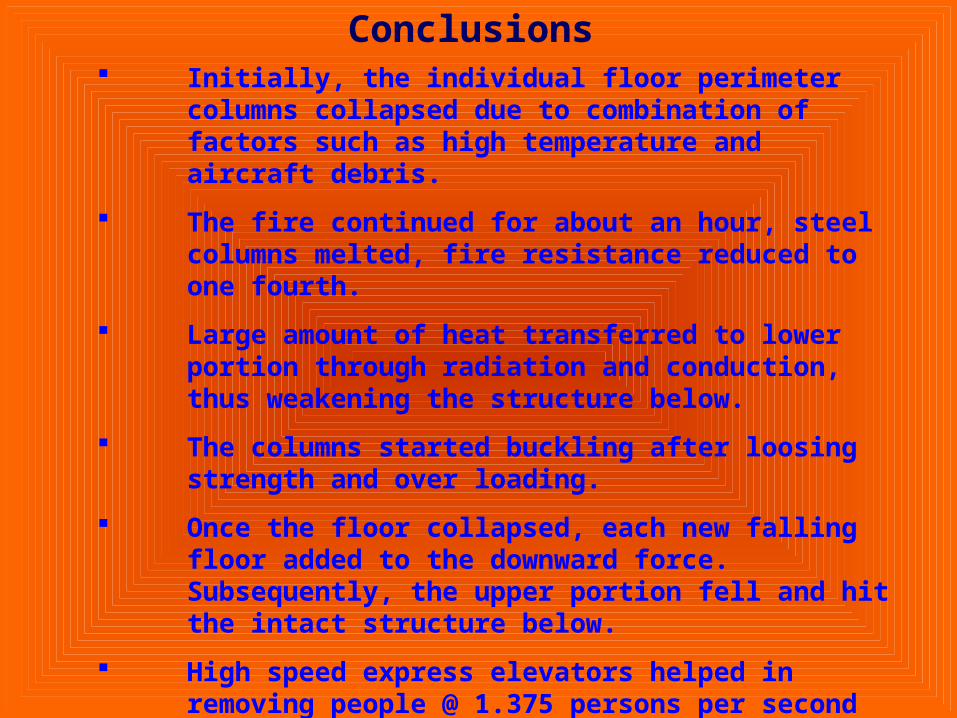
Conclusions Initially, the individual floor perimeter columns collapsed due to
combination of factors such as high temperature and aircraft debris. The fire continued for about an hour, steel columns melted, fire
resistance reduced to one fourth. Large amount of heat transferred to lower portion through radiation
and conduction, thus weakening the structure below. The columns started buckling after loosing strength and over
loading. Once the floor collapsed, each new falling floor added to the
downward force. Subsequently, the upper portion fell and hit the intact structure below.
High speed express elevators helped in removing people @ 1.375 persons per second per elevator, i.e. 4,950 persons per hour per elevator.
Had the impact zone been lower, the structure may have fallen like a tree.
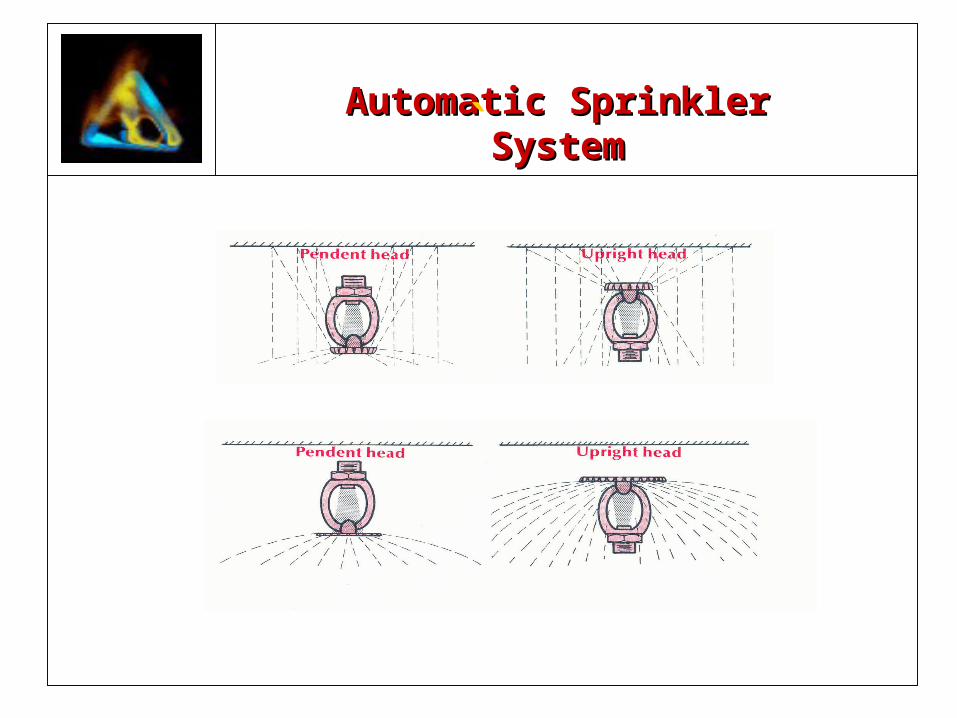
Automatic Sprinkler SystemAutomatic Sprinkler System`
Water Application Rate of Sprinklers
Hazard Minimum Discharge Area of DurationHazard Minimum Discharge Area of DurationClass Pressure Density Operation (min)Class Pressure Density Operation (min) (bars) (mm/min) (m(bars) (mm/min) (m22))
ELH 2.20 2.25 84 30ELH 2.20 2.25 84 30OH1 1.00 5.00 72 60OH1 1.00 5.00 72 60OH2 1.40 5.00 144 60OH2 1.40 5.00 144 60OH3 1.70-2.00 5.00 216-360 60OH3 1.70-2.00 5.00 216-360 60EHH - 7.50-12.50 260 90EHH - 7.50-12.50 260 90(Process) (Process) EHH - 7.50-17.50 260 90EHH - 7.50-17.50 260 90(Storage)(Storage)
Water Discharge Rate of Sprinklers
Pressure Sprinkler SizePressure Sprinkler Size (bars) 10 mm 15 mm 20 mm(bars) 10 mm 15 mm 20 mm
0.690 47 66 950.690 47 66 95 1.035 58 81 1161.035 58 81 116 1.380 67 93 1351.380 67 93 135 1.725 75 105 1501.725 75 105 150 2.415 88 124 1782.415 88 124 178 3.450 105 148 2123.450 105 148 212 5.175 129 182 2615.175 129 182 261 6.900 149 210 3026.900 149 210 302
Water Discharge Rate of Sprinklers
Q = K (P) 1/2Q = K (P) 1/2Where,Where,
Q = Water Discharge Rate (lpm)Q = Water Discharge Rate (lpm)P = Water Pressure, barsP = Water Pressure, barsK = Orifice coefficientK = Orifice coefficient
= 57 for 10 mm Sprinklers= 57 for 10 mm Sprinklers = 80 for 15 mm Sprinklers= 80 for 15 mm Sprinklers = 115 for 20 mm Sprinklers= 115 for 20 mm Sprinklers
Maximum Coverage per Sprinkler
Hazard Coverage Spacing Between SprinklersHazard Coverage Spacing Between Sprinklers
Class (mClass (m22) (m)) (m)
ELH 21 4.5 ELH 21 4.5
OH1 OH1 OH2 12 3.5OH2 12 3.5OH3OH3
EHH EHH (Process) 09 3.0 (Process) 09 3.0 (Storage)(Storage)