Embed Size (px)
Citation preview
Financial Health of the Sector & Related Developments
The HEFCE Annual Meeting
Professor Madeleine Atkins
Chief Executive
26 October 2017

Four themes dominating the HE Landscape
• Brexit
• Industrial Strategy andSkills
• Social mobility & the Student Interest
• Finance and Funding

Brexit: common themes
Concerns:
• Global talent and mobility
• Research and innovation networks/collaborations
• Finance and funding
• Regulations and standards
• Rights of EU staff members
Opportunity:
• Review existing/future research and innovation programmes within the EU
• Identify new partnerships and development opportunities outside the EU
• New international strategy for research and innovation: government; institution; researcher

Industrial Strategy and Skills
• White Paper and Budget
• National skills initiatives
• Devo in England
• UKRI and OfS joint agendas
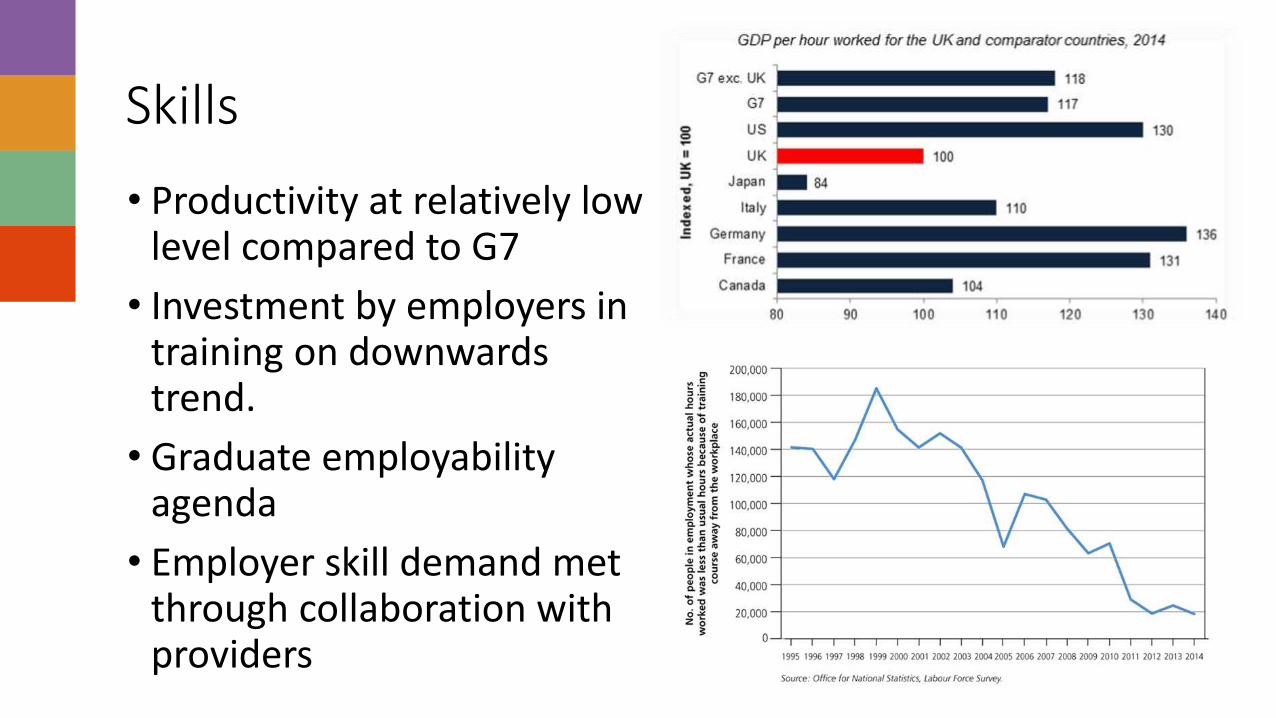
Skills
• Productivity at relatively low level compared to G7
• Investment by employers in training on downwards trend.
• Graduate employability agenda
• Employer skill demand met through collaboration with providers

Social Mobility & the Student Interest
• Defining ‘students’
• End to end thinking
• Routes and choices
• Careers advice and information
• Potential of linked databases

Finance and Funding
• Student recruitment
• Financial forecasts
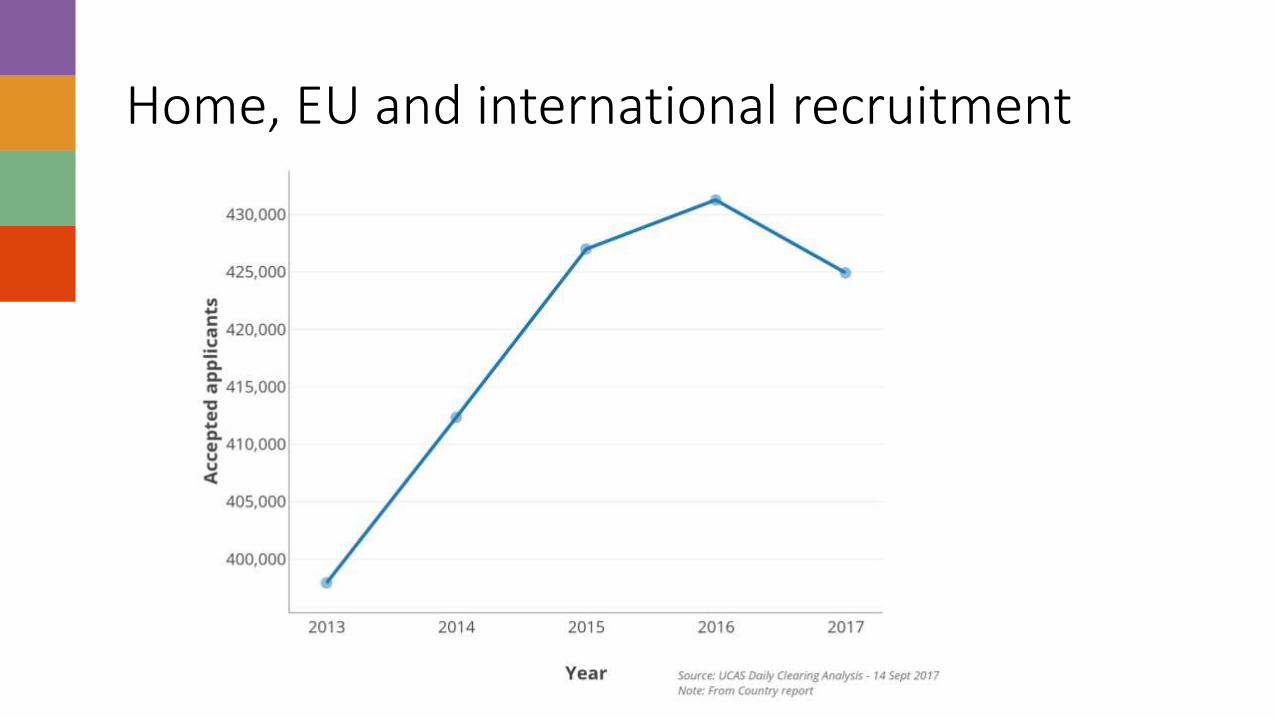
Home, EU and international recruitment
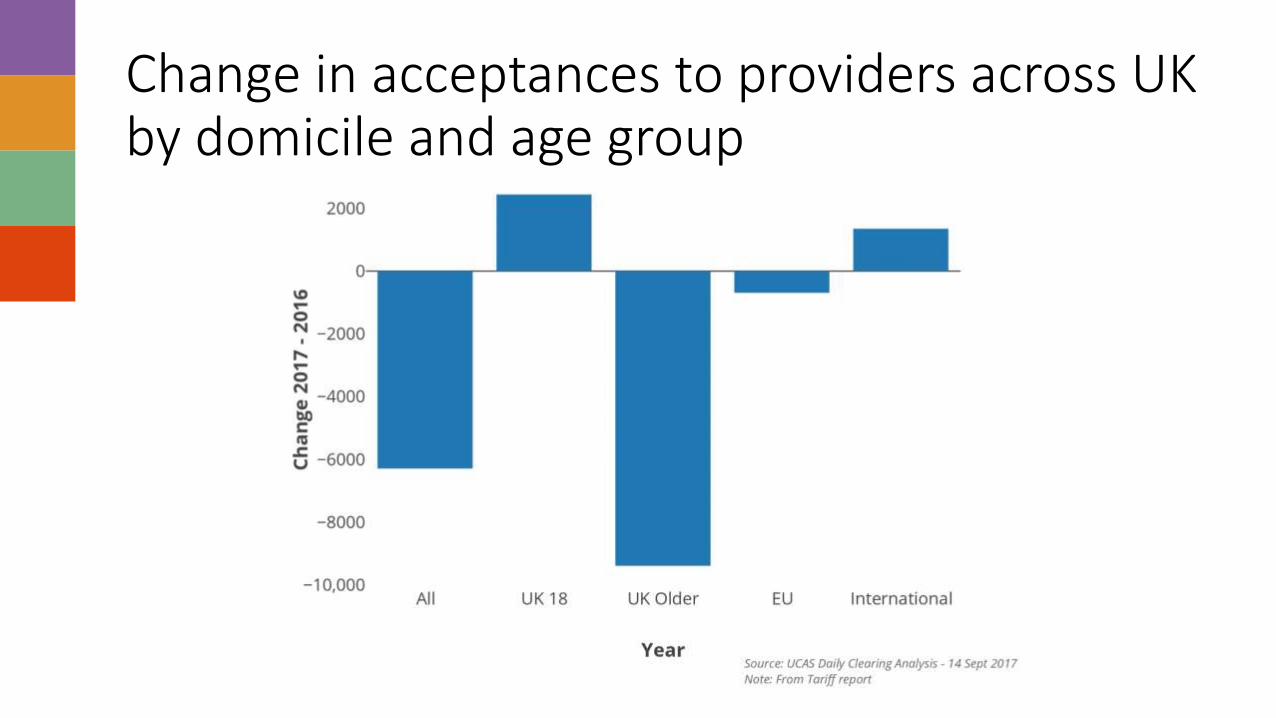
Change in acceptances to providers across UK by domicile and age group
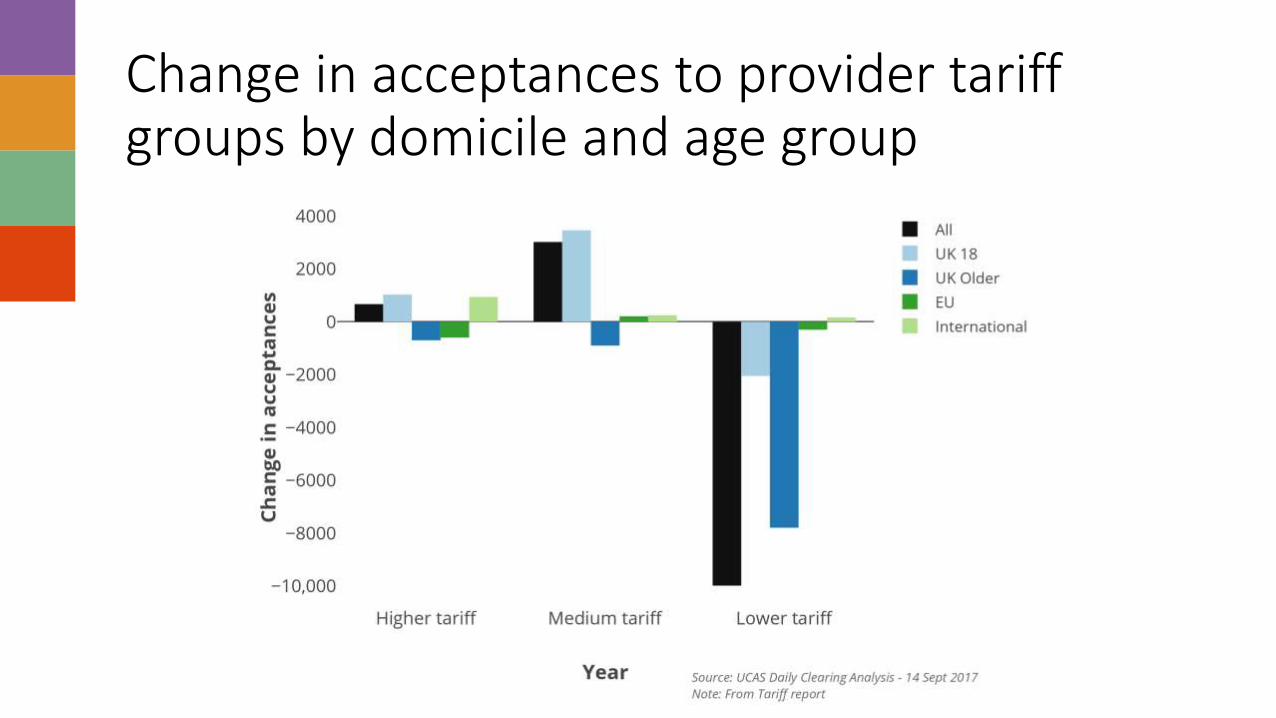
Change in acceptances to provider tariff groups by domicile and age group
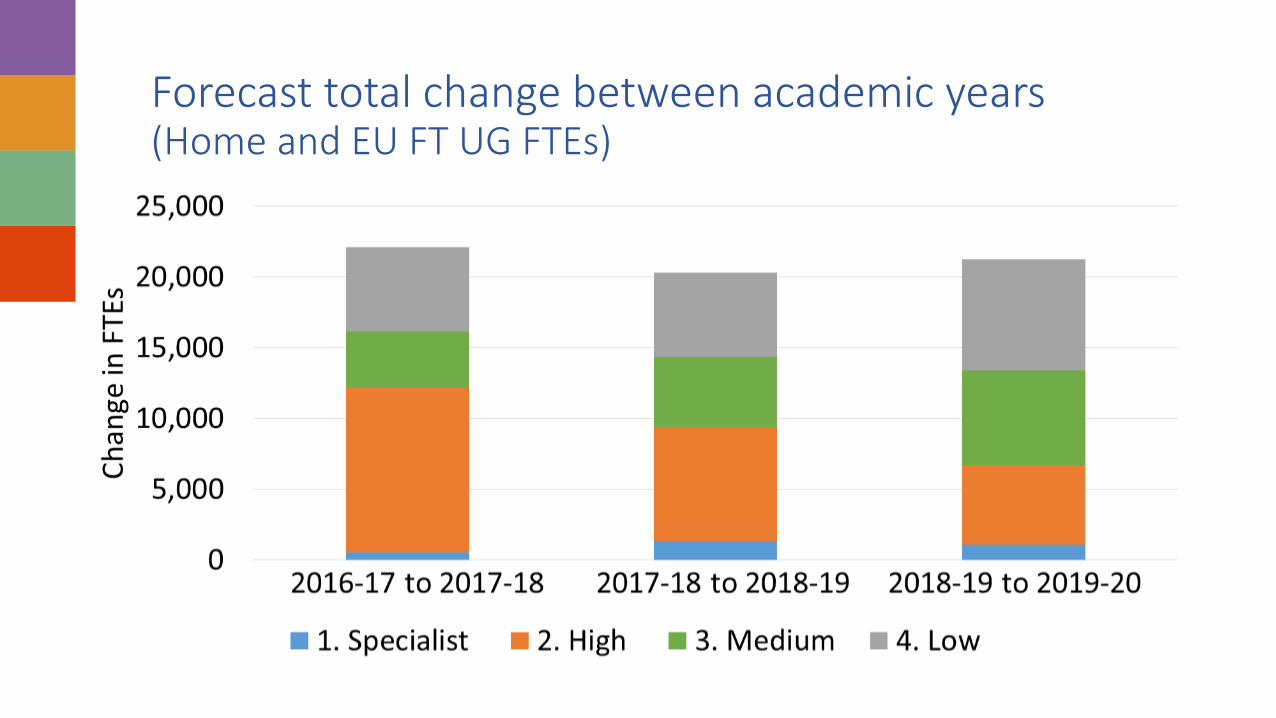
Forecast total change between academic years (Home and EU FT UG FTEs)

Forecast total change 2016-17 to 2019-20(Home and EU FT UG FTEs)
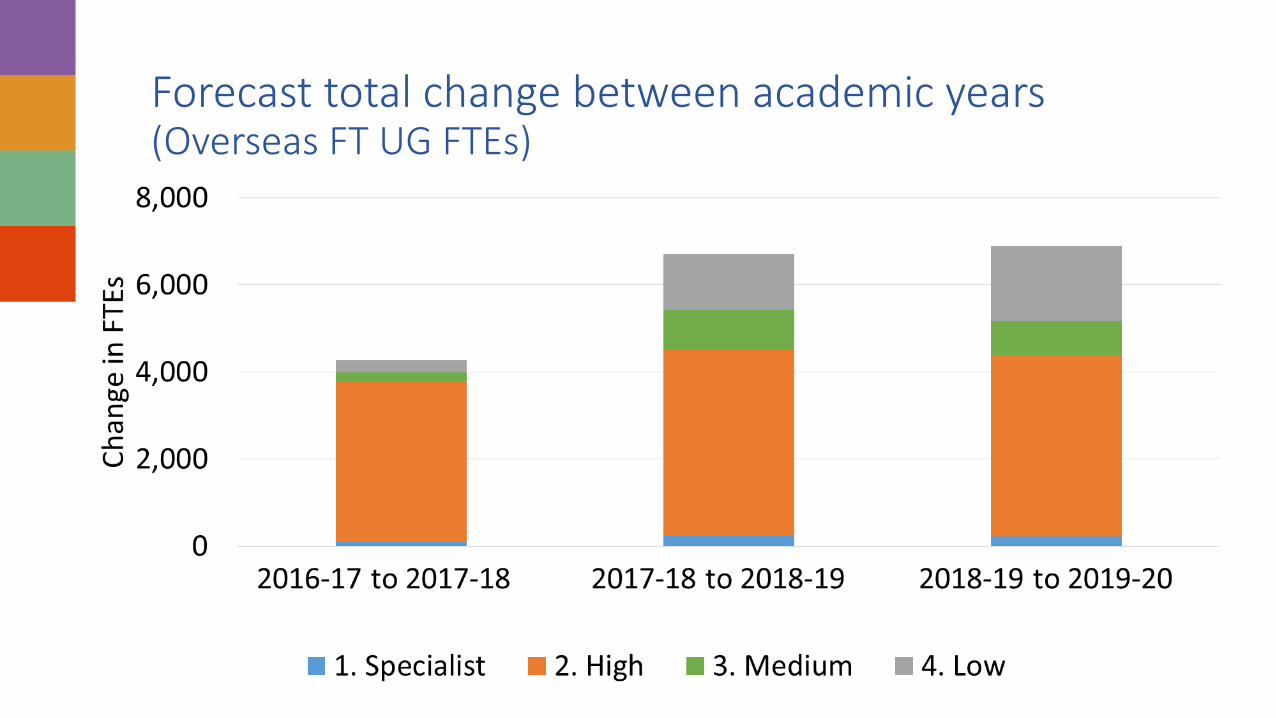
Forecast total change between academic years (Overseas FT UG FTEs)

Forecast total change 2016-17 to 2019-20(Overseas FT UG FTEs)
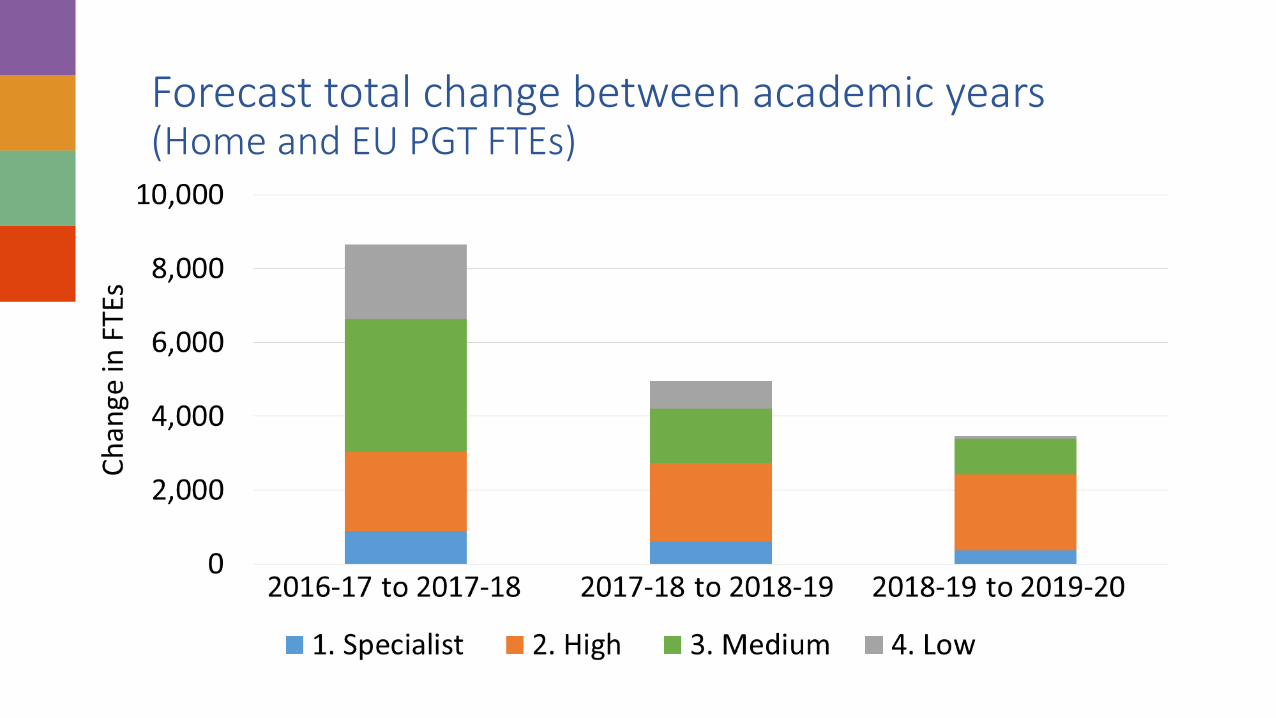
Forecast total change between academic years (Home and EU PGT FTEs)

Forecast total change between academic years (Overseas PGT FTEs)
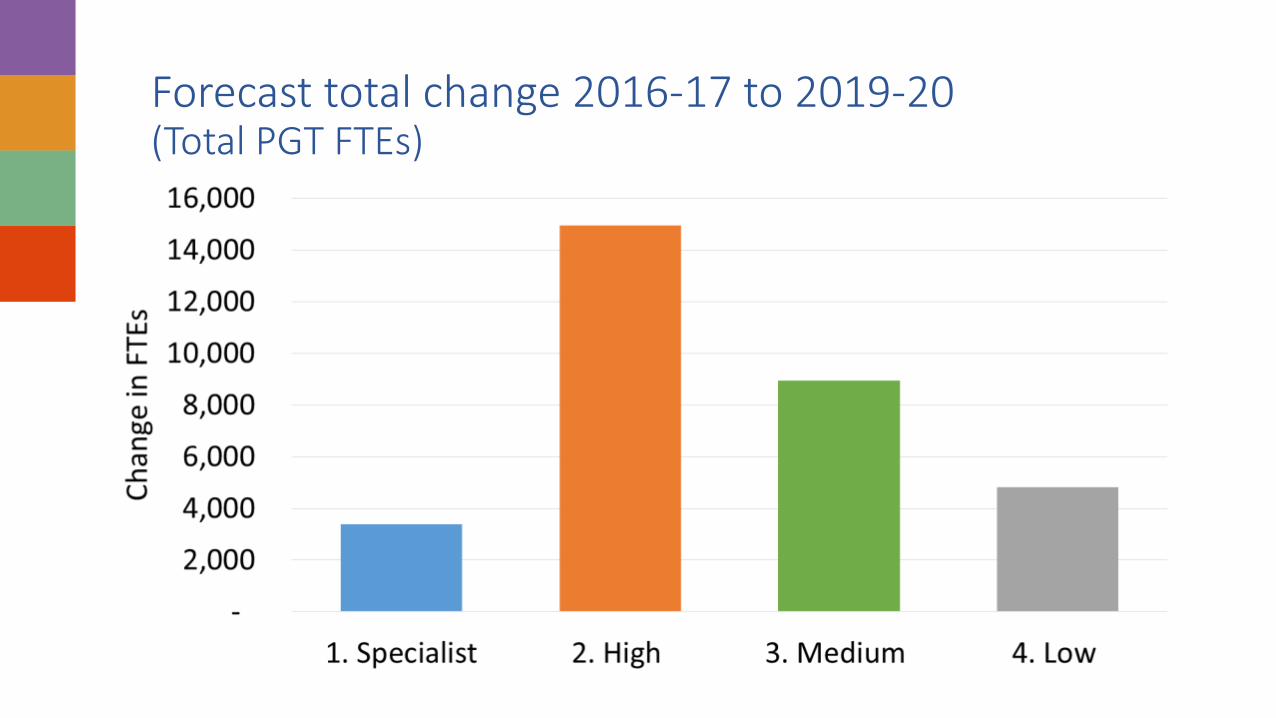
Forecast total change 2016-17 to 2019-20(Total PGT FTEs)
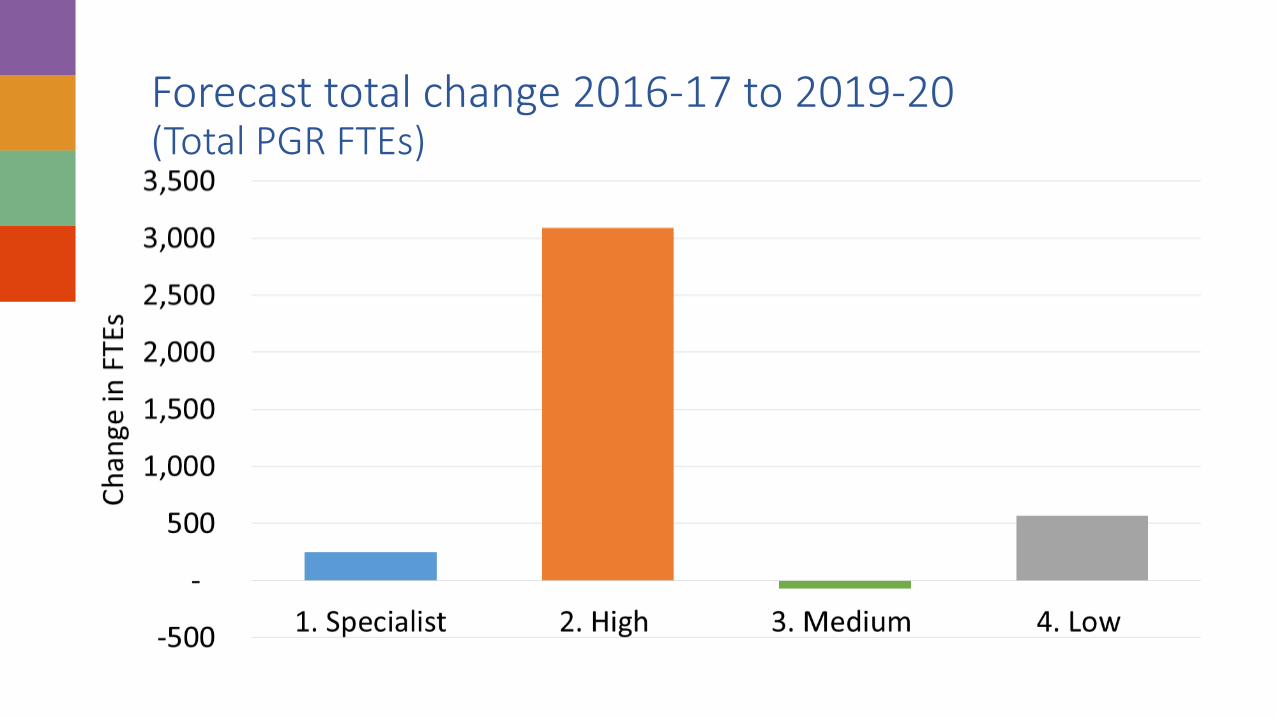
Forecast total change 2016-17 to 2019-20(Total PGR FTEs)

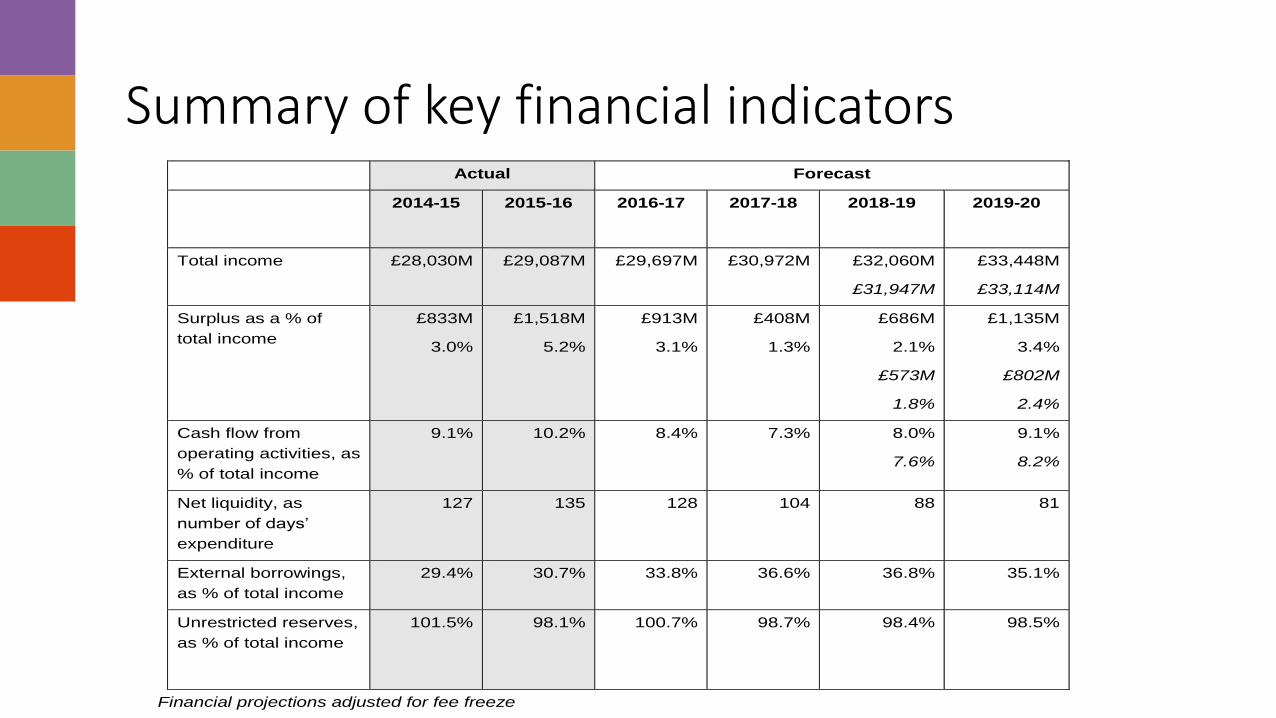
Summary of key financial indicators Actual Forecast
2014-15
2015-16 2016-17 2017-18 2018-19 2019-20
Total income
£28,030M £29,087M £29,697M £30,972M £32,060M
£31,947M
£33,448M
£33,114M
Surplus as a % of
total income
£833M
3.0%
£1,518M
5.2%
£913M
3.1%
£408M
1.3%
£686M
2.1%
£573M
1.8%
£1,135M
3.4%
£802M
2.4%
Cash flow from
operating activities, as
% of total income
9.1% 10.2% 8.4% 7.3% 8.0%
7.6%
9.1%
8.2%
Net liquidity, as
number of days’
expenditure
127 135 128 104 88 81
External borrowings,
as % of total income
29.4% 30.7% 33.8% 36.6% 36.8% 35.1%
Unrestricted reserves,
as % of total income
101.5% 98.1% 100.7% 98.7% 98.4% 98.5%
Financial projections adjusted for fee freeze
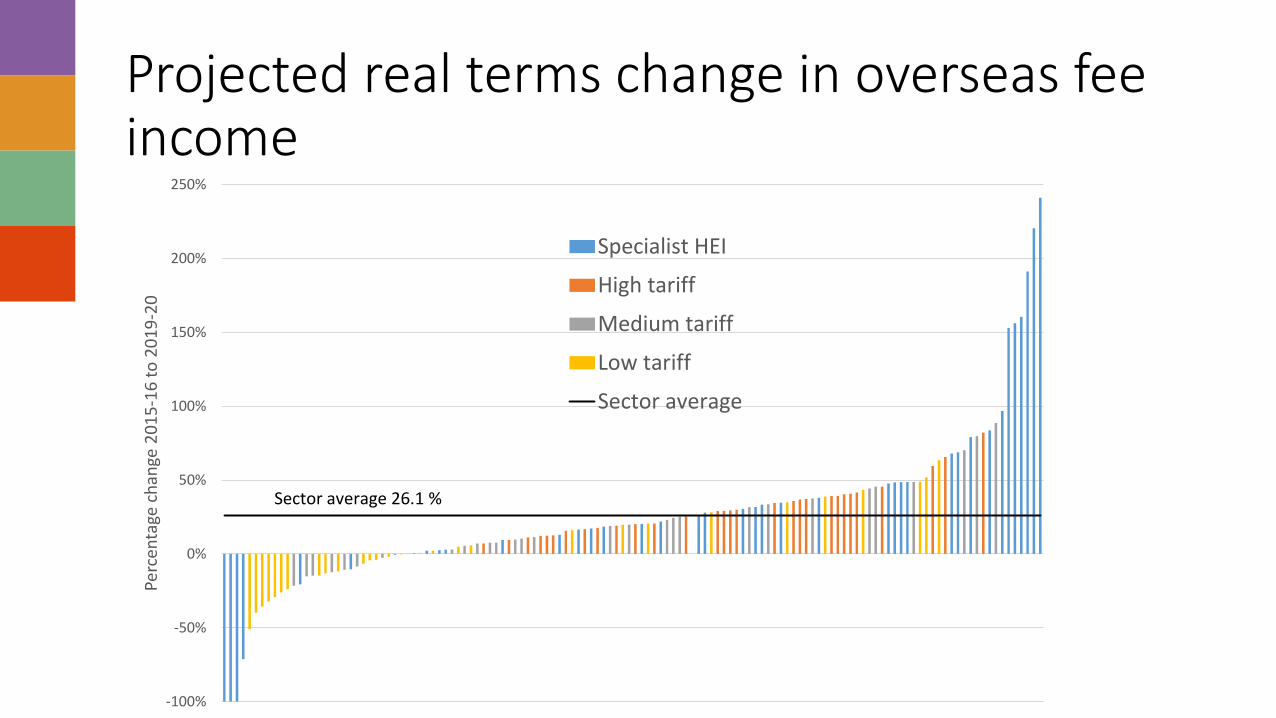
Projected real terms change in overseas fee income
-100%
-50%
0%
50%
100%
150%
200%
250%
Perc
enta
ge c
han
ge 2
01
5-1
6 t
o 2
01
9-2
0
Specialist HEI
High tariff
Medium tariff
Low tariff
Sector average
Sector average 26.1 %
Summary of key financial indicators Actual Forecast
2014-15
2015-16 2016-17 2017-18 2018-19 2019-20
Total income
£28,030M £29,087M £29,697M £30,972M £32,060M
£31,947M
£33,448M
£33,114M
Surplus as a % of
total income
£833M
3.0%
£1,518M
5.2%
£913M
3.1%
£408M
1.3%
£686M
2.1%
£573M
1.8%
£1,135M
3.4%
£802M
2.4%
Cash flow from
operating activities, as
% of total income
9.1% 10.2% 8.4% 7.3% 8.0%
7.6%
9.1%
8.2%
Net liquidity, as
number of days’
expenditure
127 135 128 104 88 81
External borrowings,
as % of total income
29.4% 30.7% 33.8% 36.6% 36.8% 35.1%
Unrestricted reserves,
as % of total income
101.5% 98.1% 100.7% 98.7% 98.4% 98.5%
Financial projections adjusted for fee freeze

Forecasts v. actual (Home and EU UG FT FTEs)
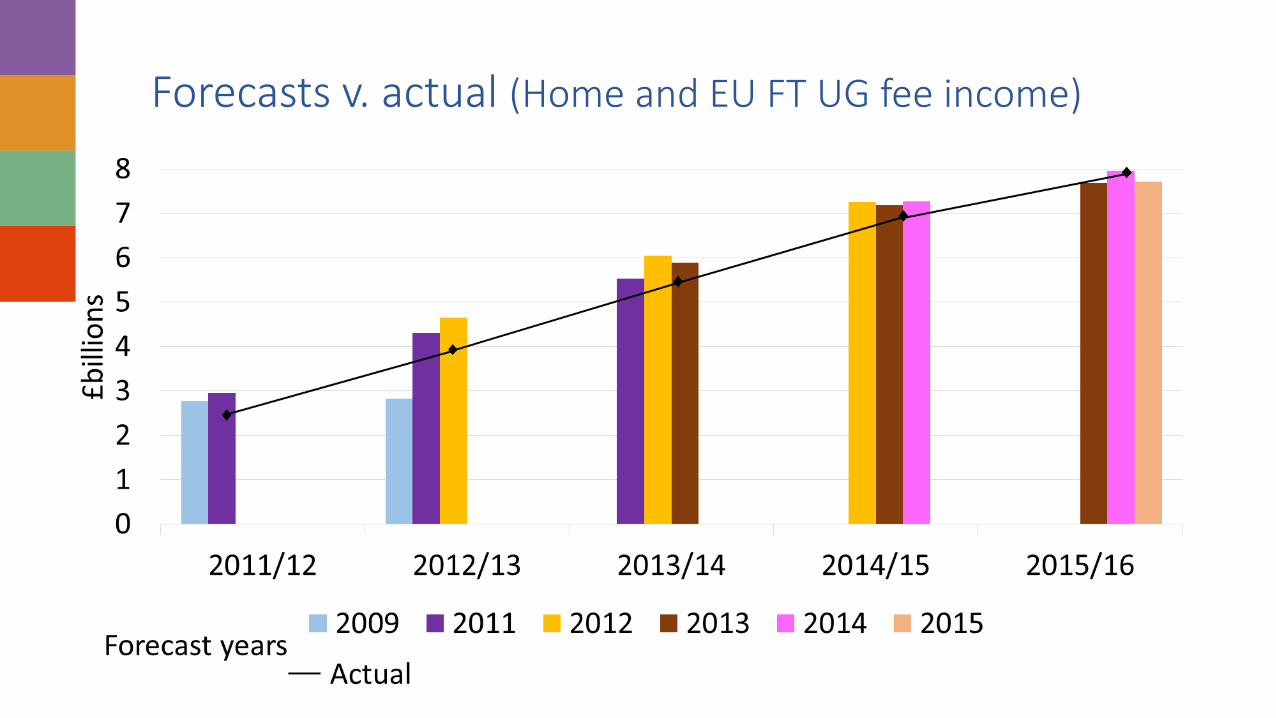
Forecasts v. actual (Home and EU FT UG fee income)

Forecasts v. actual (Overseas UG FT FTEs)
Actual

Forecasts v. actual (Total PGT FTEs)
Actual
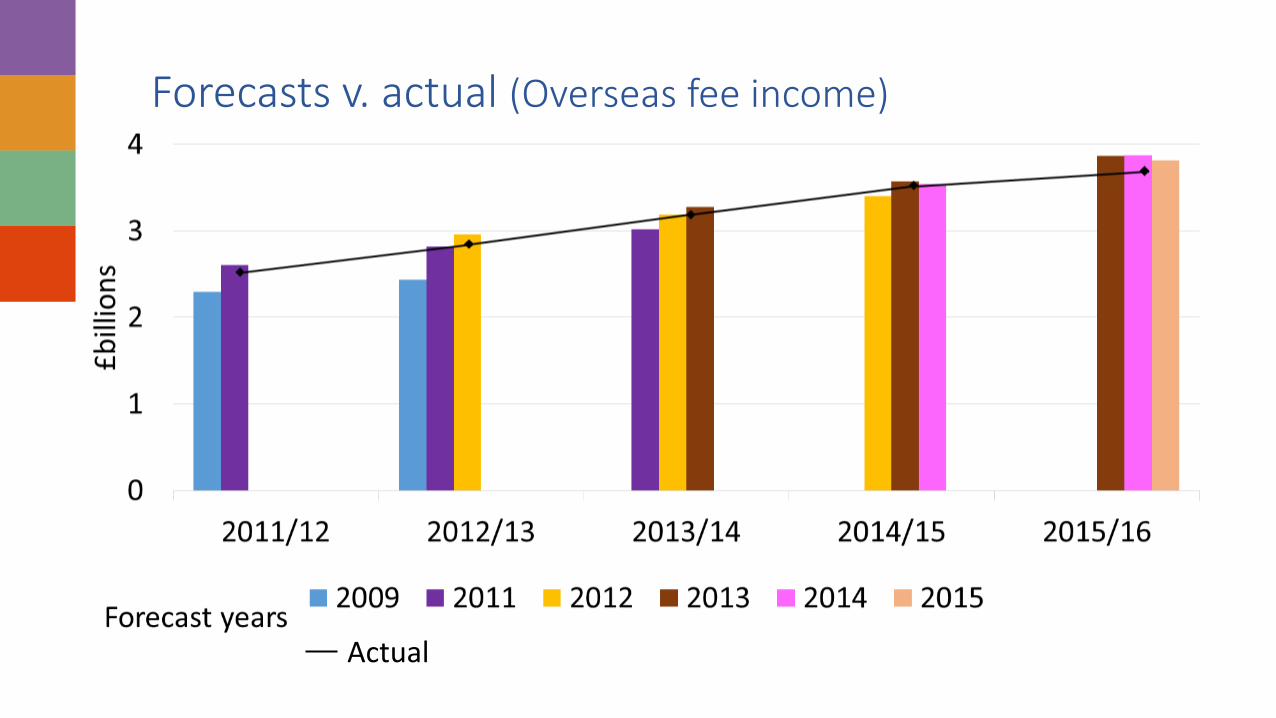
Forecasts v. actual (Overseas fee income)
Actual

Forecasts v. actual (Total income)

Capital expenditure by funding type
-
1,000
2,000
3,000
4,000
5,000
6,000
2014-15 2015-16 2016-17 2017-18 2018-19 2019-20
£ M
illio
ns
Receipts from sale offixed assets
Capital grants receipts
New loans
Net capital to befinanced from internalcash

Net funds/debt
-
2,000
4,000
6,000
8,000
10,000
12,000
14,000
31/07/15 31/07/16 31/07/17 31/07/18 31/07/19 31/07/20
£ M
illio
ns
Net liquidity (actual) Net liquidity (forecast) Borrowing (actual) Borrowing (forecast)
Position as at 31/07/17 is an unaudited year end projection