Embed Size (px)
Citation preview

Mohammad Ali Jinnah University
COURSE NAME
MANAGERIAL POLICY
SUBMITTED TO
COMPANY NAME
PAKISTAN STATE OIL
PREPARED BY
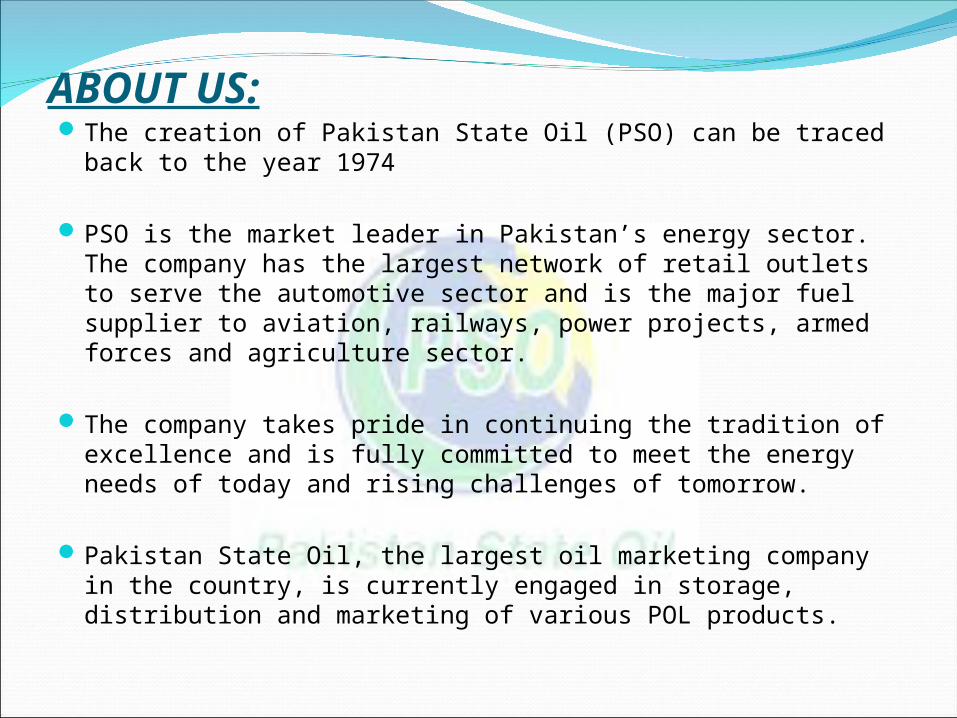
ABOUT US:The creation of Pakistan State Oil (PSO) can be traced back to
the year 1974
PSO is the market leader in Pakistan’s energy sector. The company has the largest network of retail outlets to serve the automotive sector and is the major fuel supplier to aviation, railways, power projects, armed forces and agriculture sector.
The company takes pride in continuing the tradition of excellence and is fully committed to meet the energy needs of today and rising challenges of tomorrow.
Pakistan State Oil, the largest oil marketing company in the country, is currently engaged in storage, distribution and marketing of various POL products.
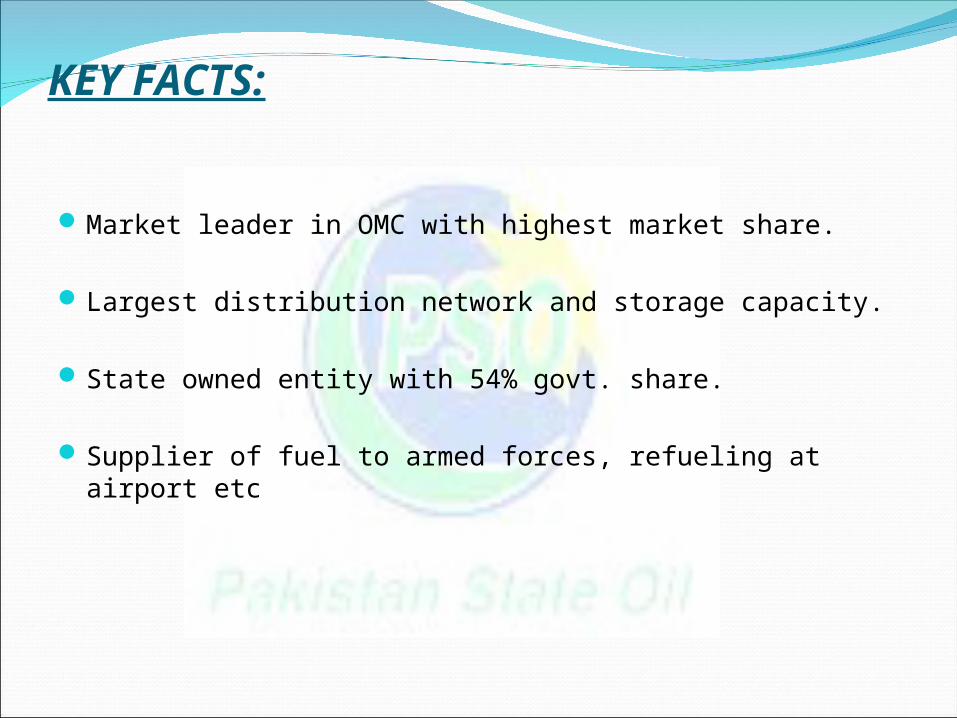
KEY FACTS:
Market leader in OMC with highest market share.
Largest distribution network and storage capacity.
State owned entity with 54% govt. share.
Supplier of fuel to armed forces, refueling at airport etc

Vision Statement
To excel in delivering value to customers as an innovative and dynamic energy company that gets to the future first.
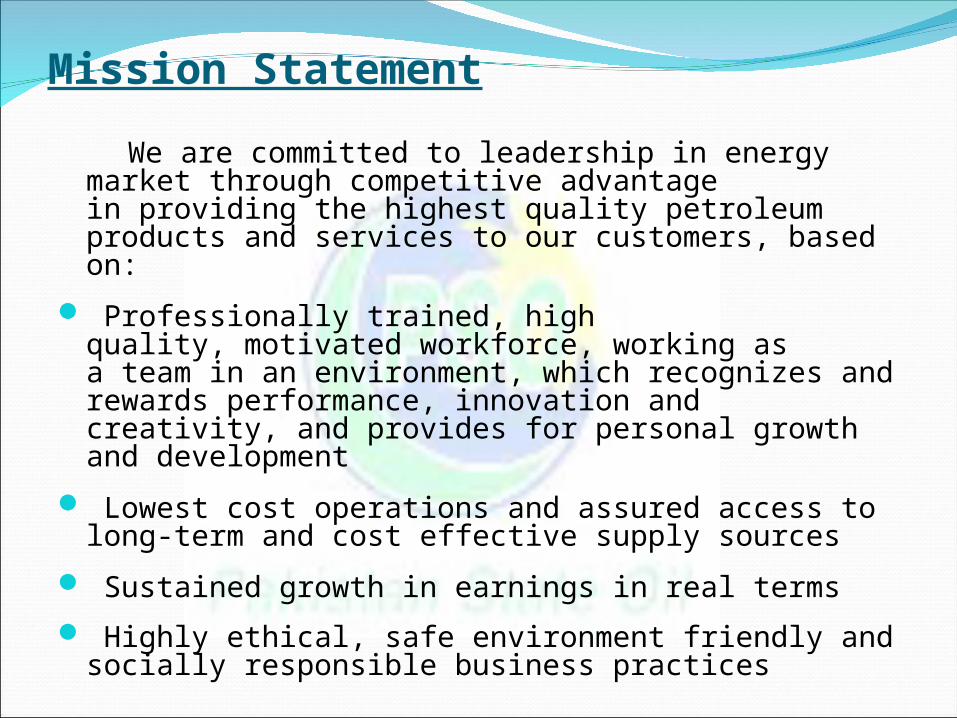
Mission Statement
We are committed to leadership in energy market through competitive advantage in providing the highest quality petroleum products and services to our customers, based on:
Professionally trained, high quality, motivated workforce, working as a team in an environment, which recognizes and rewards performance, innovation and creativity, and provides for personal growth and development
Lowest cost operations and assured access to long-term and cost effective supply sources
Sustained growth in earnings in real terms
Highly ethical, safe environment friendly and socially responsible business practices
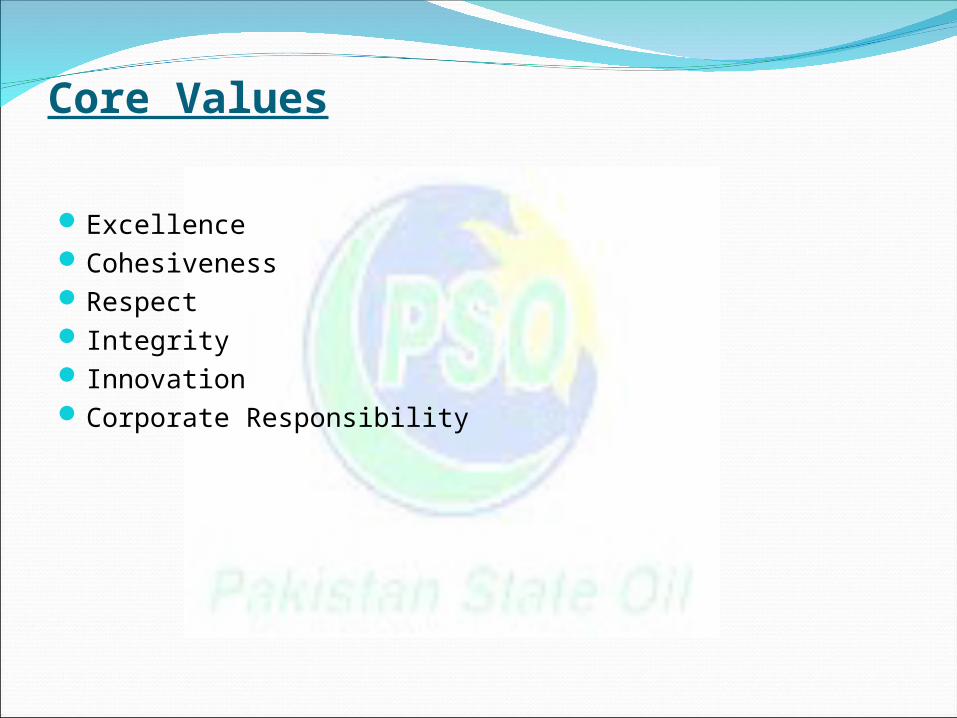
Core Values
Excellence CohesivenessRespect Integrity InnovationCorporate Responsibility

Board of DirectorSohail Wajahat H. Siddiqui ChairmanMr. Naeem Yahya Mir Managing DirectorMuhammad Azam
MemberMalik Naseem Hussain Lawbar MemberShabbir Ahmed MemberOsman Saifullah Khan MemberHammayun Jogezai MemberAbid Qaiyum Suleri MemberWazir A. Khoja Member
Products
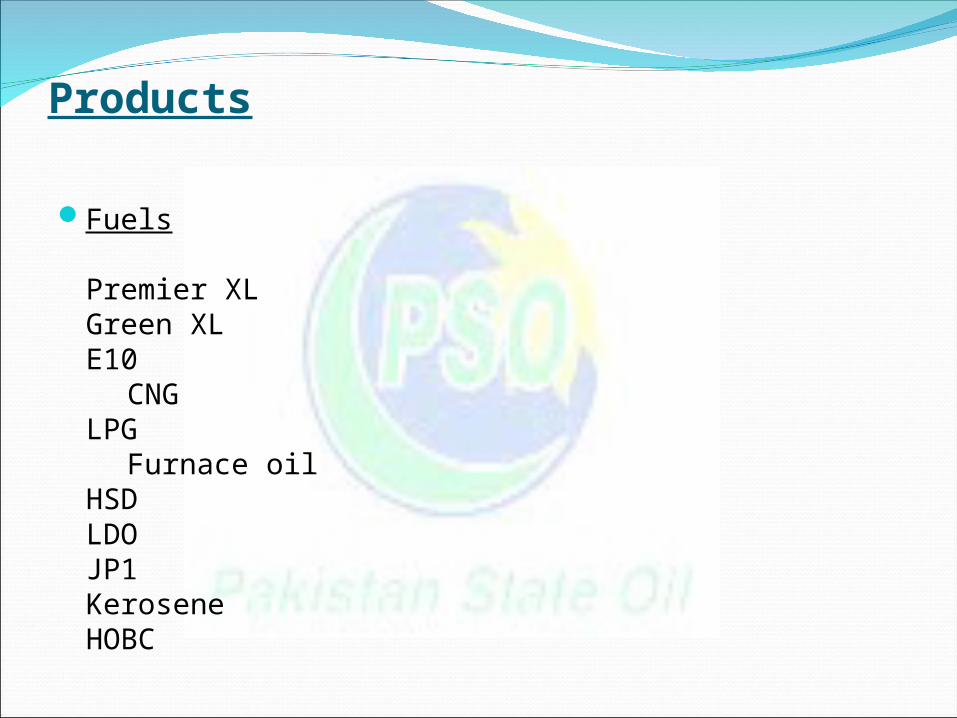
Fuels
Premier XLGreen XLE10
CNGLPG
Furnace oilHSDLDOJP1KeroseneHOBC
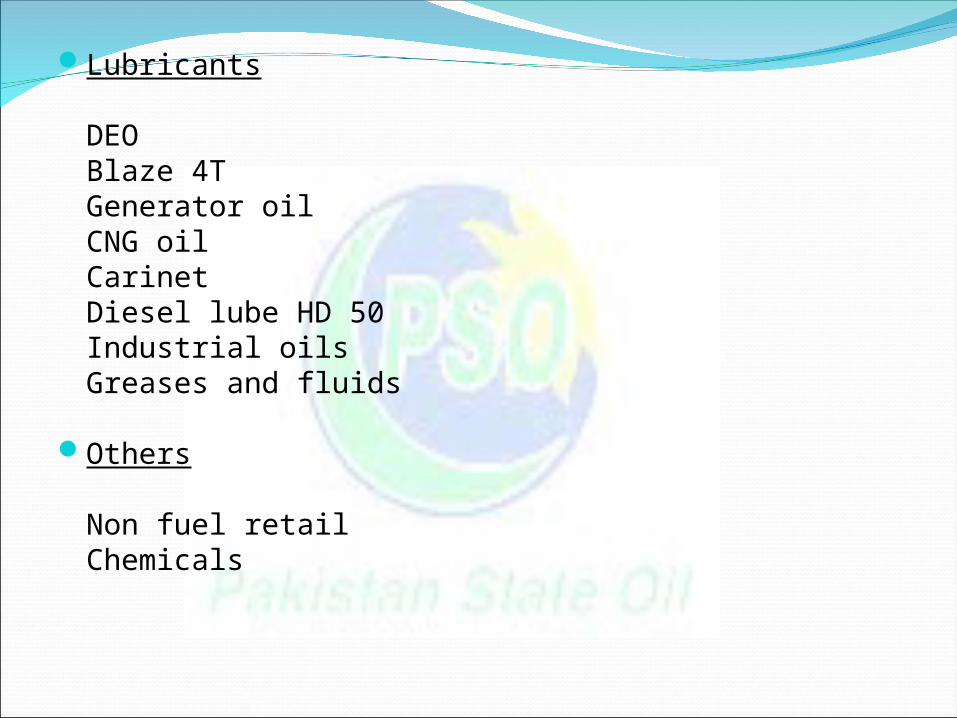
Lubricants
DEOBlaze 4TGenerator oilCNG oilCarinetDiesel lube HD 50Industrial oilsGreases and fluids
Others
Non fuel retailChemicals
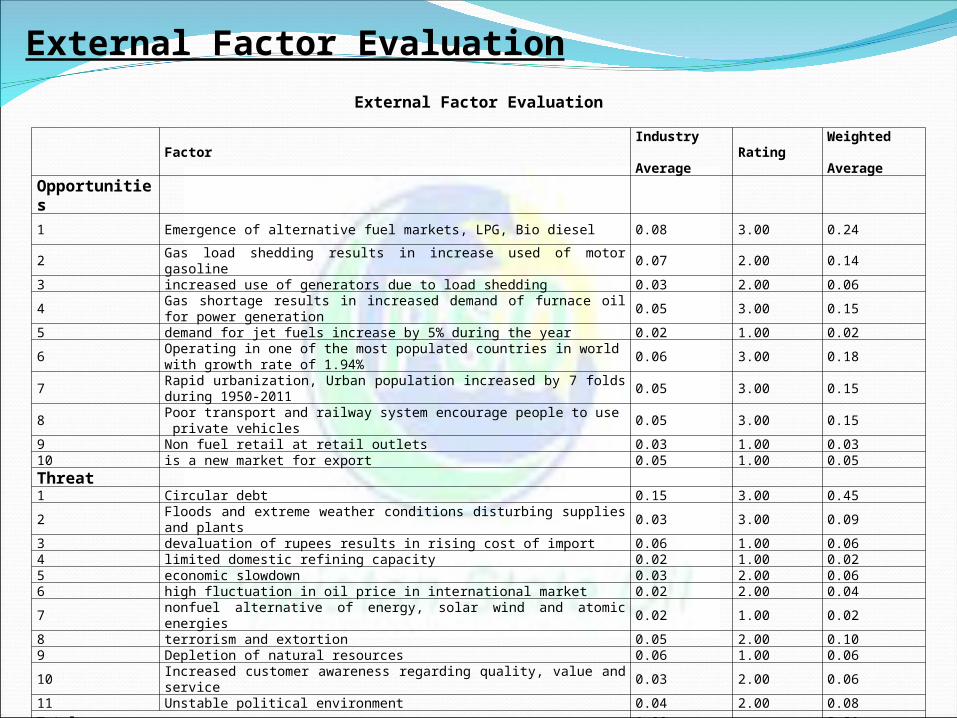
External Factor Evaluation
External Factor Evaluation
FactorIndustry Average
RatingWeighted Average
Opportunities
1 Emergence of alternative fuel markets, LPG, Bio diesel 0.08 3.00 0.24
2 Gas load shedding results in increase used of motor gasoline 0.07 2.00 0.14
3 increased use of generators due to load shedding 0.03 2.00 0.06
4 Gas shortage results in increased demand of furnace oil for power generation 0.05 3.00 0.15
5 demand for jet fuels increase by 5% during the year 0.02 1.00 0.02
6 Operating in one of the most populated countries in world with growth rate of 1.94% 0.06 3.00 0.18
7 Rapid urbanization, Urban population increased by 7 folds during 1950-2011 0.05 3.00 0.15
8 Poor transport and railway system encourage people to use private vehicles 0.05 3.00 0.15
9 Non fuel retail at retail outlets 0.03 1.00 0.0310 is a new market for export 0.05 1.00 0.05
Threat1 Circular debt 0.15 3.00 0.45
2 Floods and extreme weather conditions disturbing supplies and plants 0.03 3.00 0.09
3 devaluation of rupees results in rising cost of import 0.06 1.00 0.064 limited domestic refining capacity 0.02 1.00 0.025 economic slowdown 0.03 2.00 0.066 high fluctuation in oil price in international market 0.02 2.00 0.04
7 nonfuel alternative of energy, solar wind and atomic energies 0.02 1.00 0.02
8 terrorism and extortion 0.05 2.00 0.109 Depletion of natural resources 0.06 1.00 0.06
10 Increased customer awareness regarding quality, value and service 0.03 2.00 0.06
11 Unstable political environment 0.04 2.00 0.08
Total 1.00 2.21
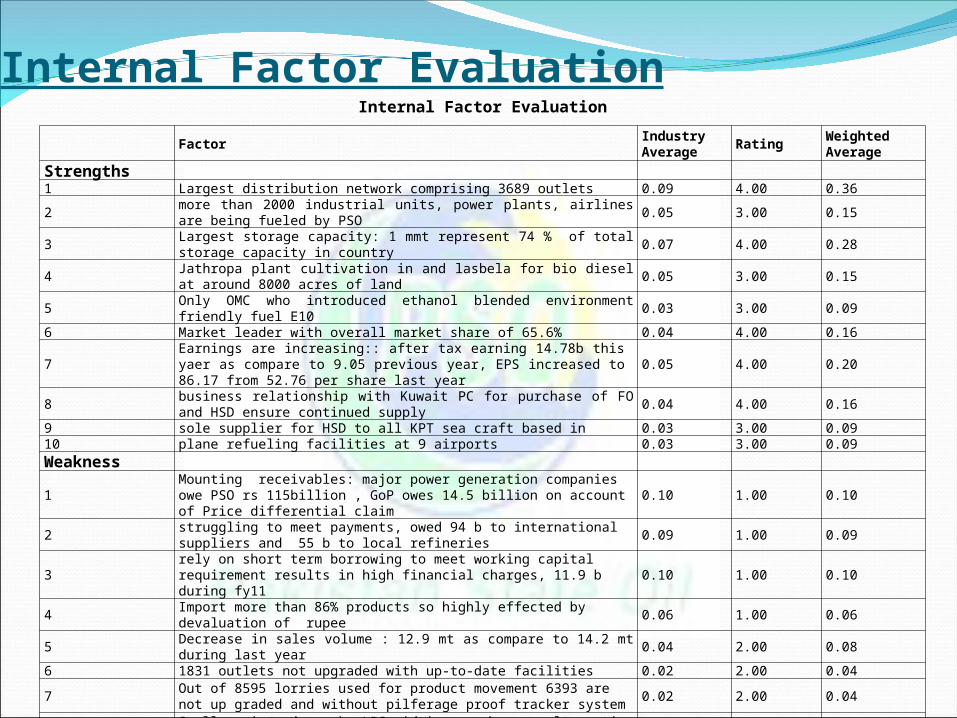
Internal Factor EvaluationInternal Factor Evaluation
FactorIndustryAverage
RatingWeightedAverage
Strengths1 Largest distribution network comprising 3689 outlets 0.09 4.00 0.36
2 more than 2000 industrial units, power plants, airlines are being fueled by PSO 0.05 3.00 0.15
3 Largest storage capacity: 1 mmt represent 74 % of total storage capacity in country 0.07 4.00 0.28
4 Jathropa plant cultivation in and lasbela for bio diesel at around 8000 acres of land 0.05 3.00 0.15
5 Only OMC who introduced ethanol blended environment friendly fuel E10 0.03 3.00 0.09
6 Market leader with overall market share of 65.6% 0.04 4.00 0.16
7Earnings are increasing:: after tax earning 14.78b this yaer as compare to 9.05 previous year, EPS increased to 86.17 from 52.76 per share last year
0.05 4.00 0.20
8business relationship with Kuwait PC for purchase of FO and HSD ensure continued supply
0.04 4.00 0.16
9 sole supplier for HSD to all KPT sea craft based in 0.03 3.00 0.0910 plane refueling facilities at 9 airports 0.03 3.00 0.09
Weakness
1Mounting receivables: major power generation companies owe PSO rs 115billion , GoP owes 14.5 billion on account of Price differential claim
0.10 1.00 0.10
2struggling to meet payments, owed 94 b to international suppliers and 55 b to local refineries
0.09 1.00 0.09
3rely on short term borrowing to meet working capital requirement results in high financial charges, 11.9 b during fy11
0.10 1.00 0.10
4 Import more than 86% products so highly effected by devaluation of rupee 0.06 1.00 0.06
5 Decrease in sales volume : 12.9 mt as compare to 14.2 mt during last year 0.04 2.00 0.08
6 1831 outlets not upgraded with up-to-date facilities 0.02 2.00 0.04
7Out of 8595 lorries used for product movement 6393 are not up graded and without pilferage proof tracker system
0.02 2.00 0.04
8 Small market share in LPG which emerging as alternative fuel 0.02 2.00 0.04
9 Market share in black oil sector declined from 88.3% in FY10 to 78.2 in FY11 0.02 2.00 0.04
10 low brand equity 0.05 1.00 0.05
Total 1.00 2.37
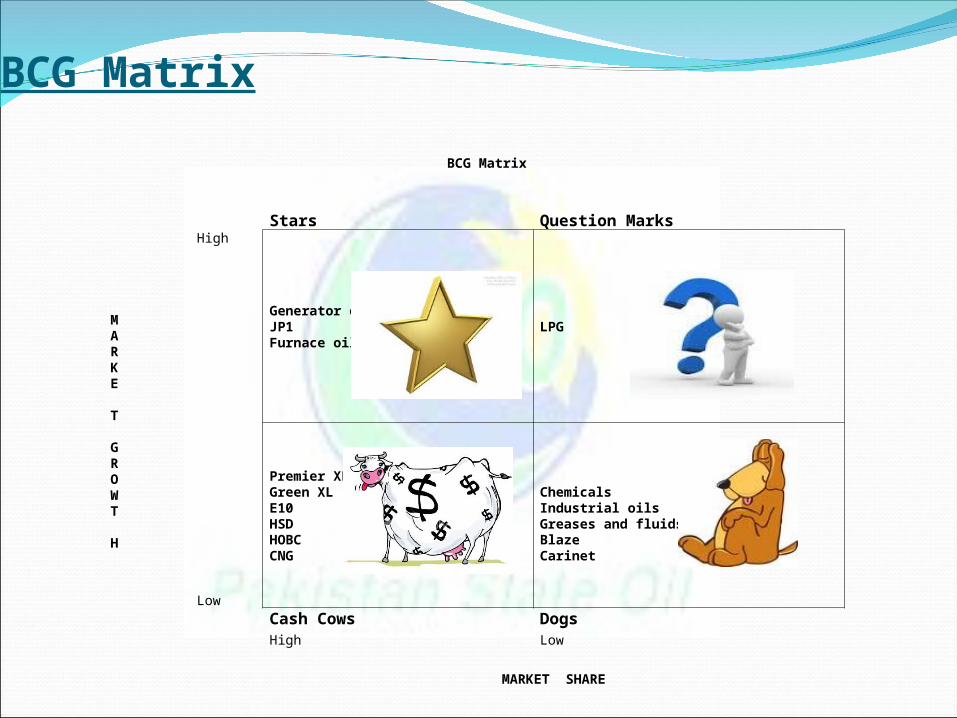
BCG Matrix
BCG Matrix
Stars Question Marks
MARKE T
High
Generator oilJP1Furnace oil
LPG
GROWT H
Low
Premier XLGreen XLE10HSDHOBCCNG
ChemicalsIndustrial oilsGreases and fluidsBlazeCarinet
Cash Cows DogsHigh Low
MARKET SHARE

IE MATRIX
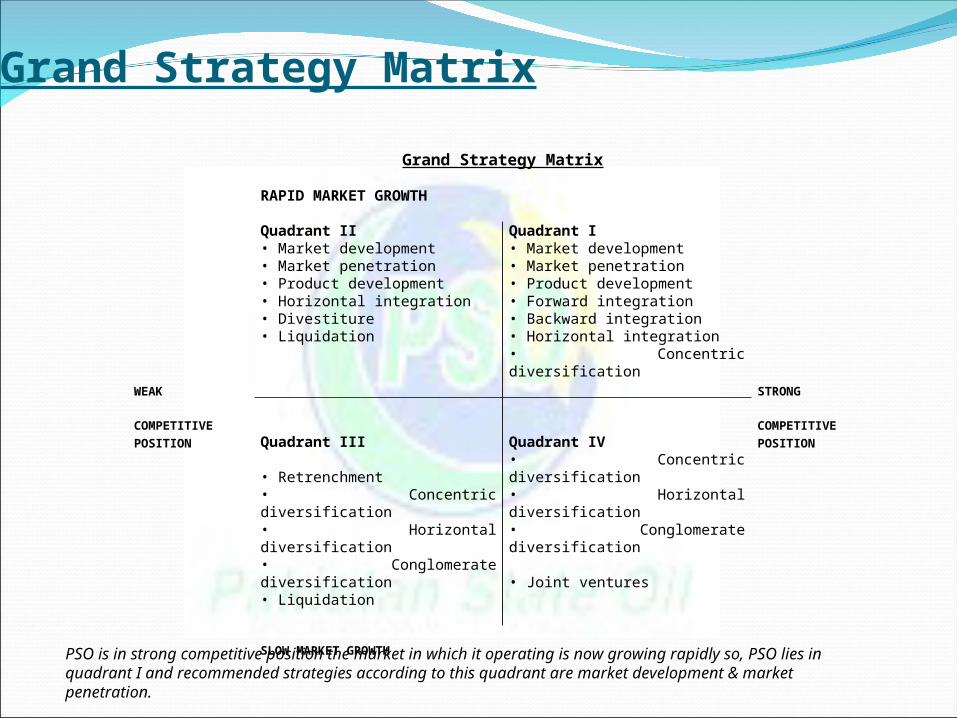
Grand Strategy Matrix
Grand Strategy Matrix
RAPID MARKET GROWTH
Quadrant II Quadrant I• Market development • Market development• Market penetration • Market penetration• Product development • Product development• Horizontal integration • Forward integration• Divestiture • Backward integration• Liquidation • Horizontal integration • Concentric diversification
WEAK STRONG
COMPETITIVE COMPETITIVE
POSITION Quadrant III Quadrant IV POSITION
• Retrenchment • Concentric diversification• Concentric diversification • Horizontal diversification• Horizontal diversification • Conglomerate diversification• Conglomerate diversification • Joint ventures• Liquidation
SLOW MARKET GROWTH
PSO is in strong competitive position the market in which it operating is now growing rapidly so, PSO lies in quadrant I and recommended strategies according to this quadrant are market development & market penetration.
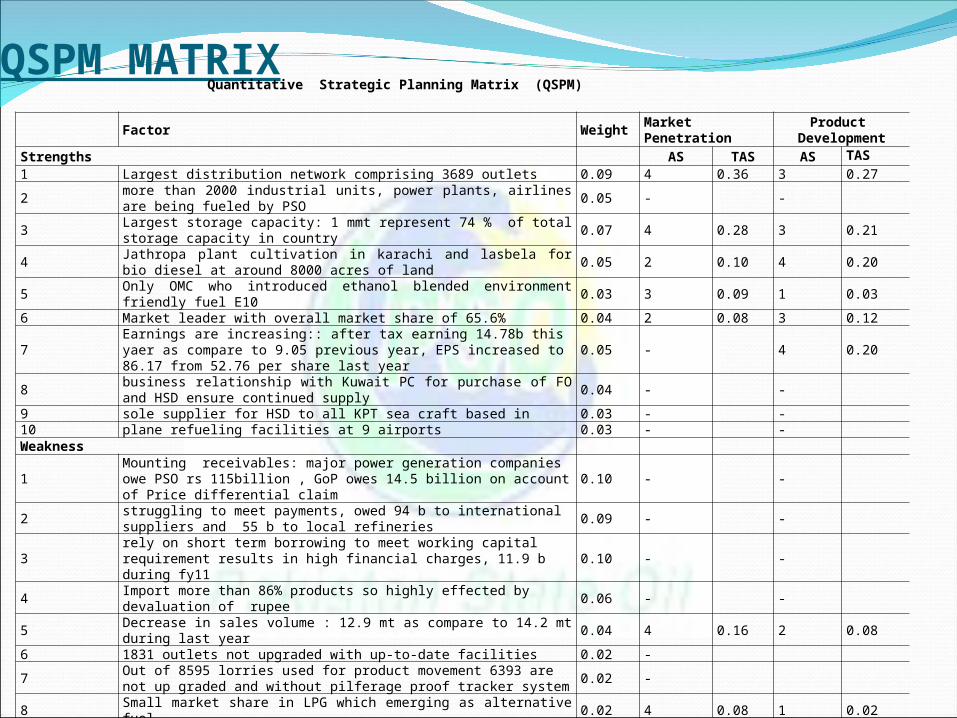
QSPM MATRIXQuantitative Strategic Planning Matrix (QSPM)
Factor Weight Market Penetration Product Development
Strengths AS TAS AS TAS
1 Largest distribution network comprising 3689 outlets 0.09 4 0.36 3 0.27
2 more than 2000 industrial units, power plants, airlines are being fueled by PSO 0.05 - -
3 Largest storage capacity: 1 mmt represent 74 % of total storage capacity in country 0.07 4 0.28 3 0.21
4Jathropa plant cultivation in karachi and lasbela for bio diesel at around 8000 acres of land
0.05 2 0.10 4 0.20
5 Only OMC who introduced ethanol blended environment friendly fuel E10 0.03 3 0.09 1 0.03
6 Market leader with overall market share of 65.6% 0.04 2 0.08 3 0.12
7Earnings are increasing:: after tax earning 14.78b this yaer as compare to 9.05 previous year, EPS increased to 86.17 from 52.76 per share last year
0.05 - 4 0.20
8business relationship with Kuwait PC for purchase of FO and HSD ensure continued supply
0.04 - -
9 sole supplier for HSD to all KPT sea craft based in 0.03 - -10 plane refueling facilities at 9 airports 0.03 - -Weakness
1Mounting receivables: major power generation companies owe PSO rs 115billion , GoP owes 14.5 billion on account of Price differential claim
0.10 - -
2struggling to meet payments, owed 94 b to international suppliers and 55 b to local refineries
0.09 - -
3rely on short term borrowing to meet working capital requirement results in high financial charges, 11.9 b during fy11
0.10 - -
4 Import more than 86% products so highly effected by devaluation of rupee 0.06 - -
5 Decrease in sales volume : 12.9 mt as compare to 14.2 mt during last year 0.04 4 0.16 2 0.08
6 1831 outlets not upgraded with up-to-date facilities 0.02 -
7Out of 8595 lorries used for product movement 6393 are not up graded and without pilferage proof tracker system
0.02 -
8 Small market share in LPG which emerging as alternative fuel 0.02 4 0.08 1 0.02
9 Market share in black oil sector declined from 88.3% in FY10 to 78.2 in FY11 0.02 4 0.08 1 0.02
10 low brand equity 0.05 4 0.20 2 0.101.00

Opportunities
1 Emergence of alternative fuel markets, LPG, Bio diesel 0.08 2 0.16 3 0.24
2 Gas load shedding results in increase used of motor gasoline 0.07 - -
3 increased use of generators due to load shedding 0.03 3 0.09 1 0.03
4 Gas shortage results in increased demand of furnace oil for power generation 0.05 - -
5 demand for jet fuels increase by 5% during the year 0.02 - -
6 Operating in one of the most populated countries in world with growth rate of 1.94% 0.06 4 0.24 2 0.12
7 Rapid urbanization, Urban population increased by 7 folds during 1950-2011 0.05 4 0.20 2 0.10
8Poor transport and railway system encourage people to use private vehicles
0.05 - -
9 Non fuel retail at retail outlets 0.03 - -
10 is a new market for export 0.05 - -
Threat
1 Circular debt 0.15 - -
2 Floods and extreme weather conditions disturbing supplies and plants 0.03 - -
3 devaluation of rupees results in rising cost of import 0.06 1 0.06 4 0.24
4 limited domestic refining capacity 0.02 - -
5 economic slowdown 0.03 1 0.03 3 0.09
6 high fluctuation in oil price in international market 0.02 - -
7 nonfuel alternative of energy, solar wind and atomic energies 0.02 - -
8 terrorism and extortion 0.05 - -
9 Depletion of natural resources 0.06 - -
10 Increased customer awareness regarding quality, value and service 0.03 2 0.06 4 0.12
11 Unstable political environment 0.04 - -
Total 1.00 2.27 2.19
Factor Weight Market PenetrationProduct
Development
AS TAS AS TAS
ImplementationPSO has to effectively communicate its objective and policies to
its employees and to allocate resources according to strategy.
Considering present market situation and PSO status, intensive strategies seems better to pursue for PSO. PSO can pursue both market penetration and product development strategies but according to QSPM score it would be better for PSO to pursue market penetration strategy. For market penetration PSO has to increase its marketing efforts to increase market share
PSO has to increase the advertising expenditure, offer sales promotion, improve its touch points, increase the standard of its service at its outlet, train the staff to make a better impact on consumer for increased their behavioral loyalty, increase its equity by increasing its awareness among consumer and to establish points of differences that distinguish it from rivals.
Evaluation
To operate in highly volatile environment PSO constantly needs to evaluate changes in both internal and external factors and choose strategies.
Performance measurement should be made regularly to check the strategy is working or not and to take corrective measurement if needed.
Timely evaluation is necessary for PSO to avoid future problen and remain a market leader.
Conclusion
This report gives us an opportunity to understand PSO more closely. It helps us understanding its structure, products, areas of operation, vision and mission, its values and history. .We examines different external and internal factors that is responding to changing environment
Strategic management is complex but interesting subject, through this report we learn what are different factors that effect organizations, how important is external environment and how constantly changing factors provide opportunities and pose threats. How internal factors are important and what factors can be weaknesses or strengths for organizations, what internal factors has to be considered when formulating strategies and which factors has to give more importance.
Formulating strategies help us understanding different strategies, when they should be used, what conditions are where one strategy is preferred over others, how to formulate alternative strategies and how to choose the best one. Choosing one strategy for PSO will be difficult but we try our best to be as logical as possible.