Embed Size (px)
Citation preview

Team HandSimDroid Peter Foldes
Anar Huseynov
Justin Killian
Ishwinder Singh

Agenda
• Project Overview
• Accomplishments
• TSP Process
• Risk Management
• Quality Assurance
• CMMI Assessment
• System Architecture
• Going Forward
2
Agenda
• Project Overview
• Accomplishments
• TSP Process
• Risk Management
• Quality Assurance
• CMMI Assessment
• System Architecture
• Going Forward
3

Team HandSimDroid
4
Team Lead Process/Quality Manager
Development/ Support Manager
Planning Manager
Mentors
TSP Coach
Clients

Additional Resources
• Subject Matter Experts
▫ Eduardo – WBS & Estimation
▫ Tony – Architecture Review
▫ Phil – Architecture Review
• Team member
▫ Sergey
5

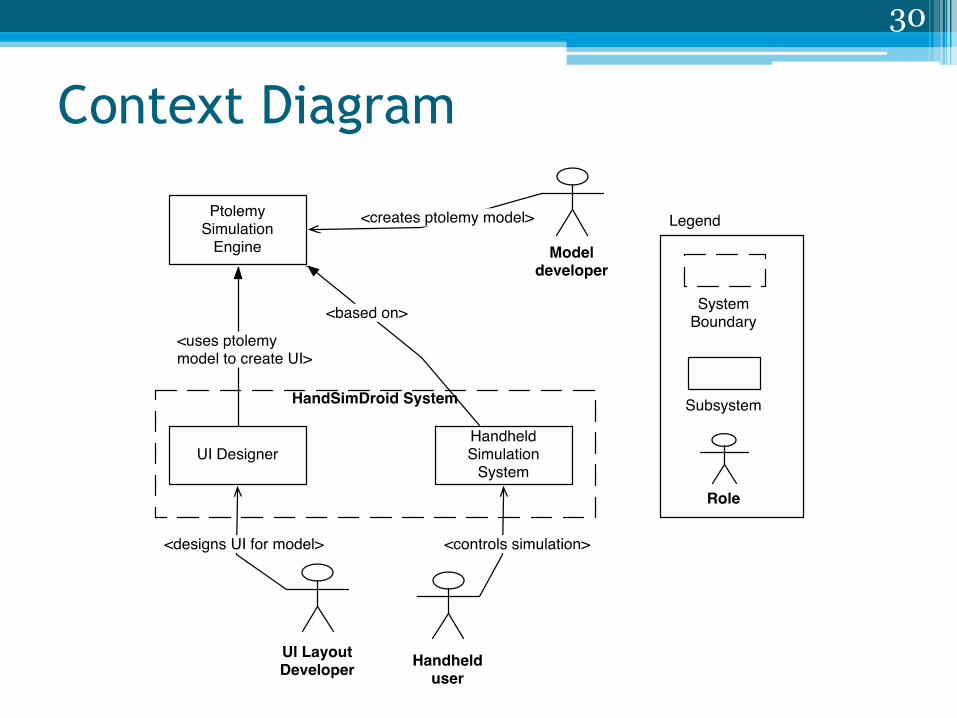
Context
• Bosch Research & Technology Center (Client)
• Bosch uses an open-source tool called Ptolemy to model and simulate embedded software
• Our project is to create an Android application that can run simulations of Ptolemy models on handheld devices.
6

Context Diagram
7

Project Goals
8
• Show simulations running on the handheld
• Enable UI customization by model and per user
• Create demos that showcase usefulness of functionality to engineers

Business Drivers
• Act as a proof of concept for ASCET tool
▫ Inspire innovation at Bosch
• Improve operations & reduce cost of calibration
▫ Running simulation on the handheld on the go
▫ Customize UI for different purposes & users
• Freely extend open source software
9

Agenda
• Project Overview
• Accomplishment
• TSP Process
• Risk Management
• Quality Assurance
• CMMI Assessment
• System Architecture
• Going Forward
10

Accomplishments Software Requirement Specification
Learned, implemented, & tailored TSP
CMMI informal assessment
Quality Plan & Fagan inspection
ACDM activities & Go decision
Architectural certainty
Two experiments & Android evaluation
WBS, Implementation Plan w/ staged releases
Development environment setup
11

Agenda
• Project Overview
• Accomplishments
• TSP Process
• Risk Management
• Quality Assurance
• CMMI Assessment
• System Architecture
• Going Forward
12
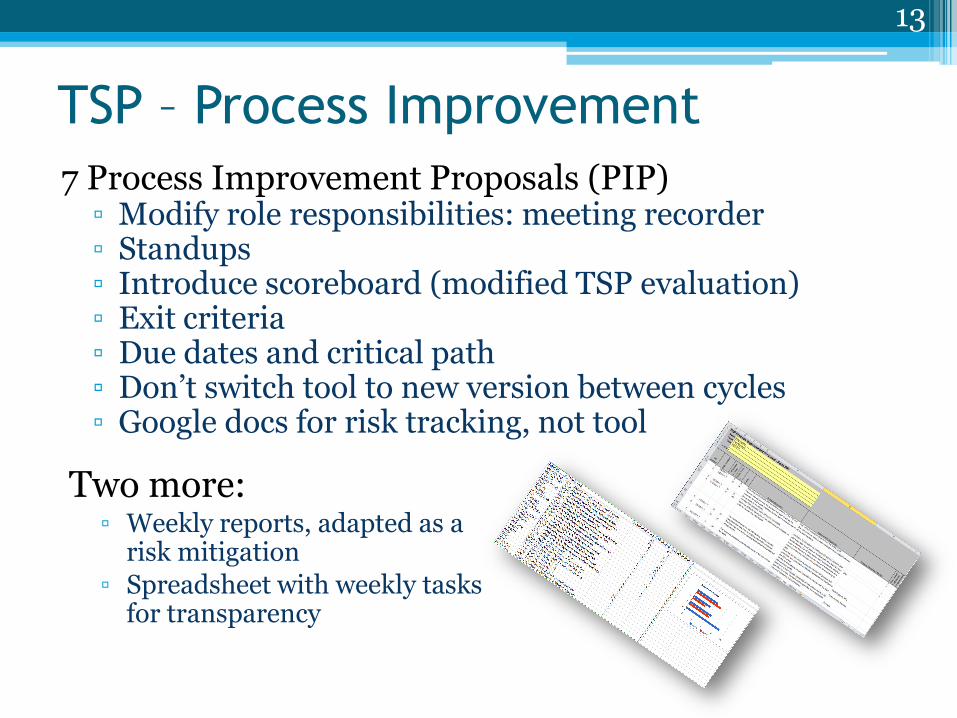
TSP – Process Improvement
7 Process Improvement Proposals (PIP) ▫ Modify role responsibilities: meeting recorder ▫ Standups ▫ Introduce scoreboard (modified TSP evaluation) ▫ Exit criteria ▫ Due dates and critical path ▫ Don’t switch tool to new version between cycles ▫ Google docs for risk tracking, not tool
13
Two more: ▫ Weekly reports, adapted as a
risk mitigation
▫ Spreadsheet with weekly tasks for transparency

TSP – Earned Value
14
0
20
4
0
60
8
0
100
1/19
/20
11
1/2
6/2
011
2/2
/20
11
2/9
/20
11
2/1
6/2
011
2/2
3/2
011
3/2
/20
11
3/9
/20
11
3/1
6/2
011
3/2
3/2
011
3/3
0/2
011
4/6
/20
11
4/1
3/2
011
4/2
0/2
011
4/2
7/2
011
5/4
/20
11
Earned Value
Ideal EV
Actual EV
Arch. Doc. & 13 hour weeks
SRS
MOSP

TSP – Effort Distribution
15
42%
33%
6%
5%
5%
3% 3% 3%
Effort by Assembly
Meeting
Architecture
Planning
Training
MOSP
Risk
Quality
EOSP

TSP – Meeting Break-down
16
35%
31%
24%
10% 0%
Meetings
Team
Client
Launch
Mentor
Standup

TSP – Scoreboard
17
Added Scoreboard questions

TSP – Scoreboard
18
Comments for the different roles

TSP – The Tool
19
• Pros ▫ Goal driven cycles ▫ Task list ▫ Time keeping (LOGT) ▫ Process improvement (PIP) ▫ Exit criteria for tasks
• Cons ▫ Scheduling ▫ No ordering ▫ Performance ▫ Dependencies ▫ Not extendable ▫ Weekly tracking
• Features not tried ▫ Quality sheets (SUMP, SUMQ, LOGD) ▫ Process Inventory

TSP - Lessons Learned
• Clear exit criteria is extremely important
• Even subjective viewpoints, such as team morale, are measurable
• Tools can increase performance significantly
• Stand-ups: Do we need them or not?
20

Agenda
• Project Overview
• Accomplishments
• TSP Process
• Risk Management
• Quality Assurance
• CMMI Assessment
• System Architecture
• Going Forward
21

Managing Risks – Top 5 # Condition Consequence P I
9 Even with critical path, resource leveling, and deadlines, scheduled tasks are not being completed at the appropriate time
we might not implement all "high“ and "medium“ requirements defined in the SRS
VL CA
16 Some team member's Ptolemy domain knowledge is lacking
some members might not be able to contribute to the architecture enough or understand it
VL CA
17 We do not have an estimate of the development effort
we might not be able to meet all the requirements with in our available time for development in summer
VL CA
10 Not every team member is actively involved in the architectural design and decision-making
we might not have a common understanding about how the final solution will be built
VL CR
14 We don't have an implementation plan ready
we might start the summer semester slow and wasteful
VL CR
22
P – Probability VL – Very Likely I – Impact CA – Catastrophic CR – Critical
Very Likely > Likely > Unlikely Catastrophic > Critical > Marginal > Negligible

Agenda
• Project Overview
• Accomplishments
• TSP Process
• Risk Management
• Quality Assurance
• CMMI Assessment
• System Architecture
• Going Forward
23

Quality Assurance
• In preparation for Summer:
▫ Coding Standards
▫ Quality Guidelines
▫ Review Checklists
▫ Structure for Design and Code Reviews
• Tools for Spring/Summer:
▫ FindBugs – static analysis on Ptolemy
▫ Lattix – dependency analysis on Ptolemy
▫ Bugzilla – bug reporting & tracking
▫ Hudson/Team City – continuous integration
24

Quality Assurance - Fagan Inspection
25
Schnabel C R U M CM
Peter 49 0 49 0 0
Anar 33 18 15 49 1617
Ishwinder 17 11 6 64 1088
SUM 29 70 2705
N 93.27
St. Dev. 17.96
Number of defects found
Estimated total number of defects

Agenda
• Project Overview
• Accomplishments
• TSP Process
• Risk Management
• Quality Assurance
• CMMI Assessment
• System Architecture
• Going Forward
26

CMMI Assessment
• Results ▫ Communication has been the biggest issue,
particularly where artifacts of each type should be stored
▫ Carve time out to actively re-evaluate metrics being collected
▫ Define better exit criteria on tasks know what others are doing know what's expected from you know when you've taken too long and need help
• Reflection ▫ Insightful (even as team members), but time
consuming (~12-14 engineer hours)
27

Agenda
• Project Overview
• Accomplishments
• TSP Process
• Risk Management
• Quality Assurance
• CMMI Assessment
• System Architecture
• Going Forward
28

System Architecture – ACDM Approach
• Ranking quality attributes by difficulty helped in justifying and prioritizing experiments
• Steps help guide the process (pre and post conditions)
• Objective measure for go/no-go decision
• List of outstanding issues
• Didn’t apply it to the fullest
▫ TSP and ACDM was hard to implement at the same time
• Added too many roles next to TSP
29
Context Diagram
30

Quality Attributes QA Priority Difficulty Scenario
Performance High Difficult Latency between capturing sensor data from a source and processing it on server is no more than 2 seconds per source Latency between completion of the data processing on the server and piping it into a sink is no more than 2 seconds per sink
Extensibility High Difficult A new graphical actor or source sensor is incorporated in UI designer and operational in the Android application within 2 person/weeks
Reliability High Difficult In case of network issues, simulation errors or runtime exceptions, system must display error message, reset to default state and log the error and gracefully end simulation on the client and server.
Usability Medium Challenging The UI of a model looks conceptually the same as it was shown in the desktop preview.
31

Constraints
• Technical Constraints
▫ Must work within confines of Ptolemy architecture
▫ Must run on Android
▫ Must run on handhelds
• Business Constraints
▫ Must not use GPL code
▫ Must use Ptolemy simulation engine
▫ Only have 4 engineers
▫ Must follow the fixed schedule
32

Dynamic Perspective – Initialization* 33
Ptolemy Model Loaded and Initialized
* Mixed with physical perspective
Sources & Sinks must run on handheld Performance:
Heavy Processing on Server

Dynamic Perspective - Running Simulation* 34
* Mixed with physical perspective
1
2
3
4 5
6
Performance: Queues to handle concurrency
& manage latency
Reliability: Last Will & Testament
7
8
Performance: Mean arrival rate
to the queue
Reliability: Ping / Echo

Experiments
• Experiment 1
▫ Push live sound from server to client
▫ Check if Ptolemy engine works on client
▫ Check if it’s possible to dynamically replace actors
▫ Measure latency
• Experiment 2
▫ Analyze impact on latency when number of sources, the length of the queues and number of sources/sinks change
▫ Two-way communication
35

Experiment 2 Results
• Latency highly depends on mean arrival of tokens to queues ▫ Length of period between
sending the batch
▫ Number of tokens per period
▫ Must be user configurable (i.e. using a slider)
▫ Queues can be unstable if generation rate is not managed
• Knowledge of queuing theory helped in communicating the problems ▫ The concept has not been yet
fully applied
36

Experiment 2 Results Cont.
37

Analysis of Queues 38
Size of queue Rate of token
generation
Can turn into unstable queue
Decision: User configurable parameters
Decision: Queue stability monitoring
system
Dynamic Perspective mixed with Physical

FSP Model
• Deadlock in initial design • Did not consider all timeouts and exception handling
• Client/Server process • Focused on error handling
▫ Time out ▫ Deadlock ▫ Exception propagations
• Very useful for our project ▫ Multi threaded environment ▫ Queues that can cause starvation and deadlocks ▫ Modeling of communication protocol ▫ Complex exception handling ▫ Hard to test and debug client/server processes
39

UI Designer Static Perspective 40
Currently Actors depend directly on Desktop Java [Lattix]
Extensibility: Abstract Factory - Easy to add new Actor for Android
Usability – one to one mapping from preview to the UI

Agenda
• Project Overview
• Accomplishments
• TSP Process
• Risk Management
• Quality Assurance
• CMMI Assessment
• System Architecture
• Going Forward
41
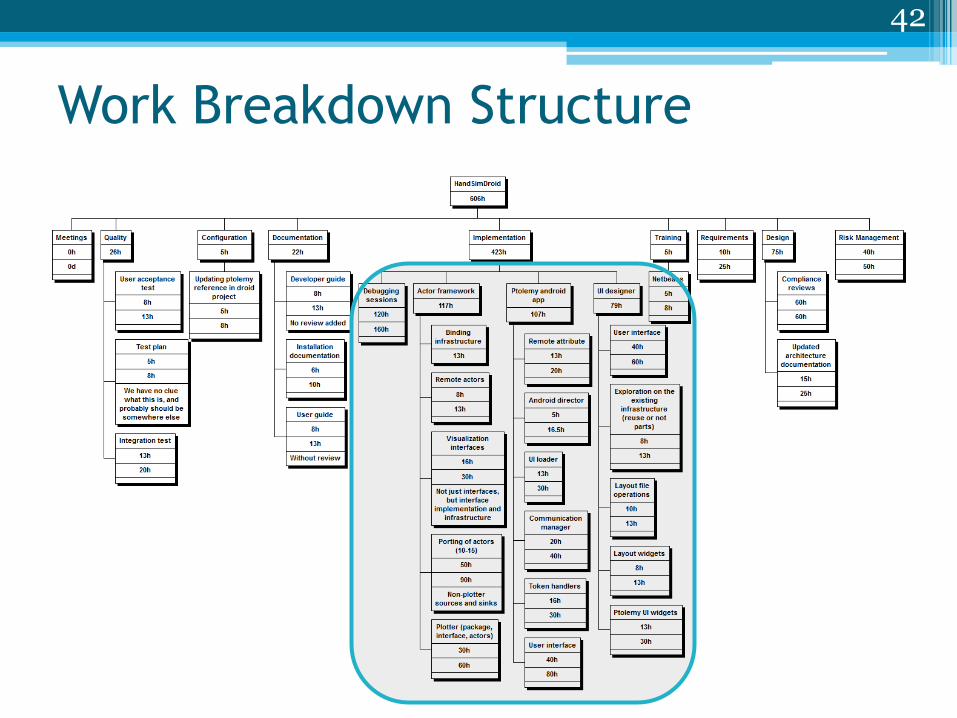
Work Breakdown Structure
42

WBS – Implementation
43

Release Schedule
44
2011 Spring (720 hours) 2011 Summer (2304 hours)
Feb. March April May June July Aug.
Detailed Design
SRS Tool Setup
Design Proposals
Training
R1 6/3
R2 6/18
R4 7/12
System &
Acceptance
Testing
Implementation
High level Design
Experiments
EOSP EOSP
R3 7/4
Most Likely Dates
Implementation
Plan

Release Schedule
45
• Release #1
▫ End-to-end simulation
• Release #2
▫ Graphical actors on Android
• Release #3
▫ Customizable User Interface
• Release #4
▫ User and developer guides
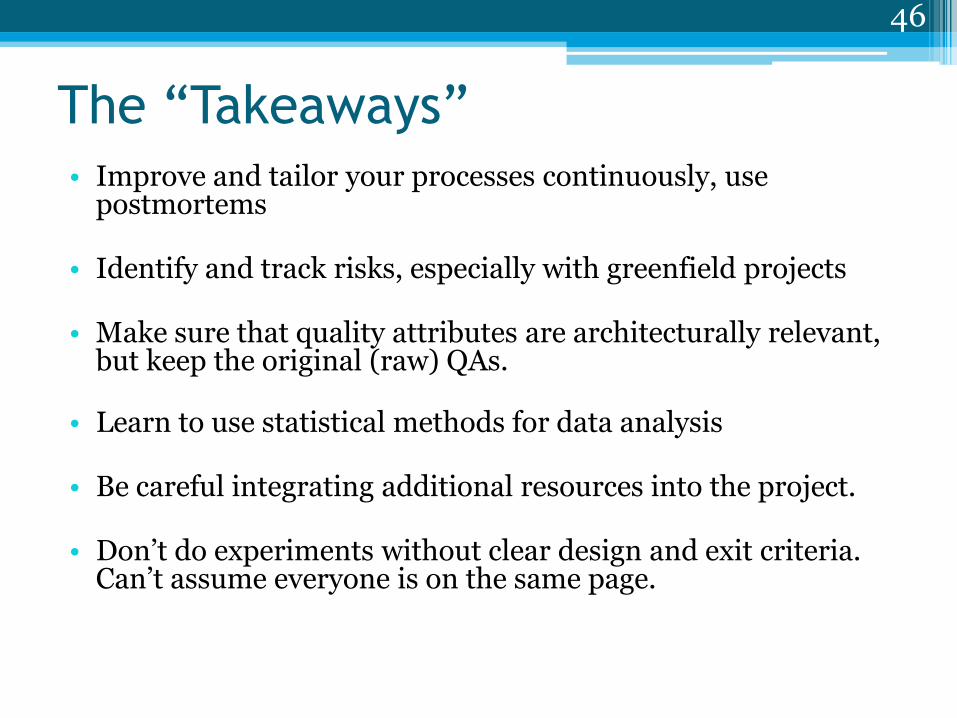
The “Takeaways”
46
• Improve and tailor your processes continuously, use postmortems
• Identify and track risks, especially with greenfield projects
• Make sure that quality attributes are architecturally relevant, but keep the original (raw) QAs.
• Learn to use statistical methods for data analysis
• Be careful integrating additional resources into the project.
• Don’t do experiments without clear design and exit criteria.
Can’t assume everyone is on the same page.

Questions?
47

The “Takeaways” - Tools
48
Tool name Evaluation
Findbugs • Static analysis tool • Helped point to true positive faults in the Ptolemy core code • Decided to use it for our project too.
Lattix • Static dependency analysis • Showed a possible violation of dependencies in the Ptolemy
architecture. • Could simulate adding a new package and verify the
feasibility of our modification • Berkeley team removed the violation for the next version
WBS Pro • Work breakdown structure creation tool • Helped to create and manage the WBS and estimations • Provides a highly customizable interface • Decided to keep using it
Understand • Static dependency analysis • It was hard to track relations and was too complex to be
useful in the short term

Backups
49

Implementation Plan
• Defines development environment ▫ Server and individual hardware and software setups
• Defines strategies and techniques used during
implementation ▫ Development ▫ Testing ▫ Continuous integration ▫ Working hours and common times ▫ Techniques that we want to try
• Defines major tasks, WBS, releases, and release
functionalities
• Lists hardware and software inventory used, including vendors, model numbers, and versions.
50

Managing Risks – Lessons learned
51
• Pros
▫ Drove experiments and architecture
▫ Shows when risk mitigation itself turns into a risk
▫ Awareness of possible problems
▫ Helped identify lack of domain knowledge (training and quiz)
• Cons
▫ SEI method takes a lot of time
▫ Reluctance to report team or personnel risks individually, SRE worked better

TSP – Lessons Learned
52
Lesson learned Rationale
Clear exit criteria is important
Realized the importance when we couldn’t decide what the end result is for one of the experiments
Even subjective viewpoints are measurable
Adapted scoreboards to measure the teams morale and overall contributions. It was recreated once as scoreboard became stale
Tools can help increase performance significantly
Even with all the troubles coming from the tool, it provided a good medium to measure time spent and define tasks
Standups: Do we need them or not?
Worked during Fall (Scrum), varied during Spring as tasks were more decoupled. Common times and design meetings were enough.

CMMI Assessment
• What?
▫ Performed an informal CMMI assessment
▫ Targeted level 2 & 3 process areas of staged model
• Why?
▫ Wanted to learn how to conduct individual interviews
▫ Wanted to identify process improvement areas
53

TSP - Weekly Form
54

TSP – Cycle Goals
55
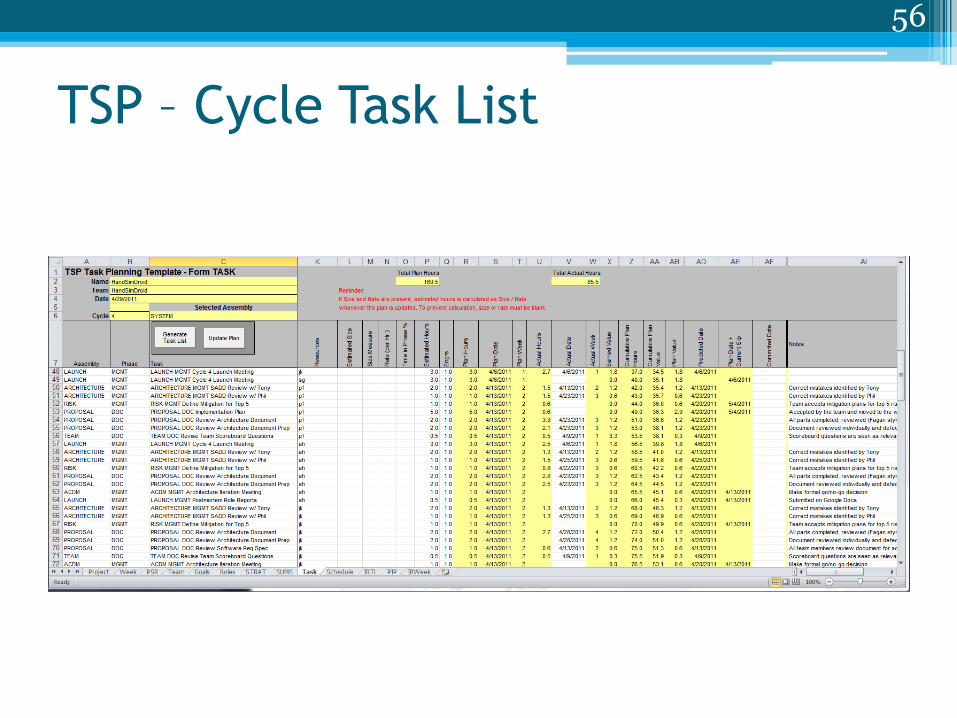
TSP – Cycle Task List
56
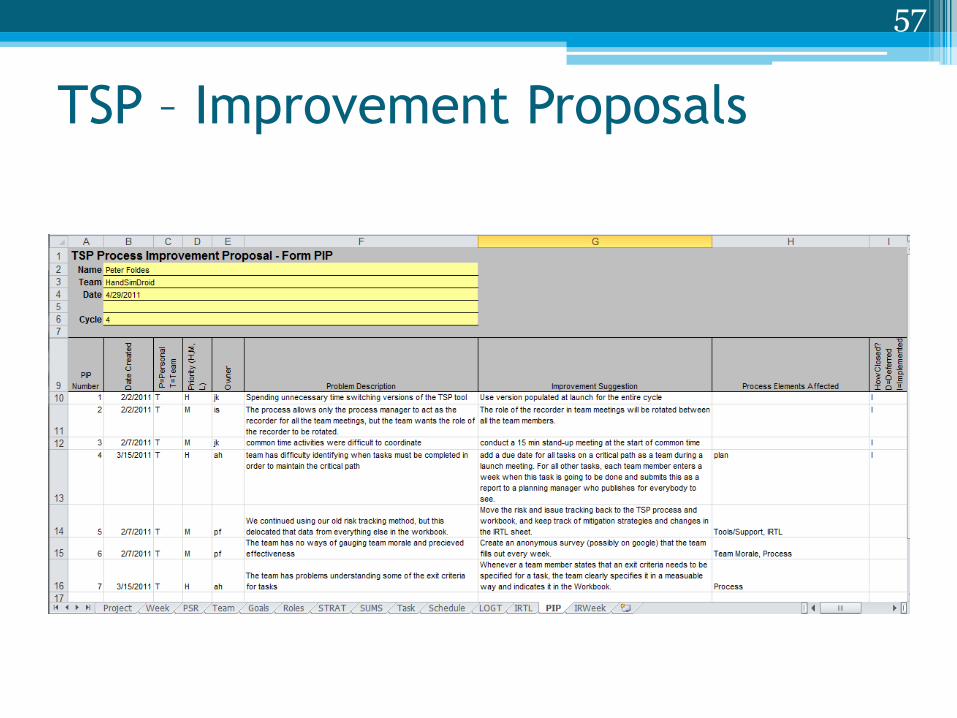
TSP – Improvement Proposals
57

TSP – Task Transparency
58

Managing Risks
59
Approximately 25 risks identified
Tracking top 5 risks
Mitigated many technical risks, and a few process risks
Made some concerns transparent to the team.
Switched from tracking in Google Docs to TSP Tool and back to Google Docs.

Managing Risks – Identified & Analyzed
60

Managing Risks – Exposure & Multi-Voting
61

Managing Risks – Mitigation Strategies
62

Ptolemy Desktop Application
Model
Output
63

Quality Assurance - Fagan Inspection
64
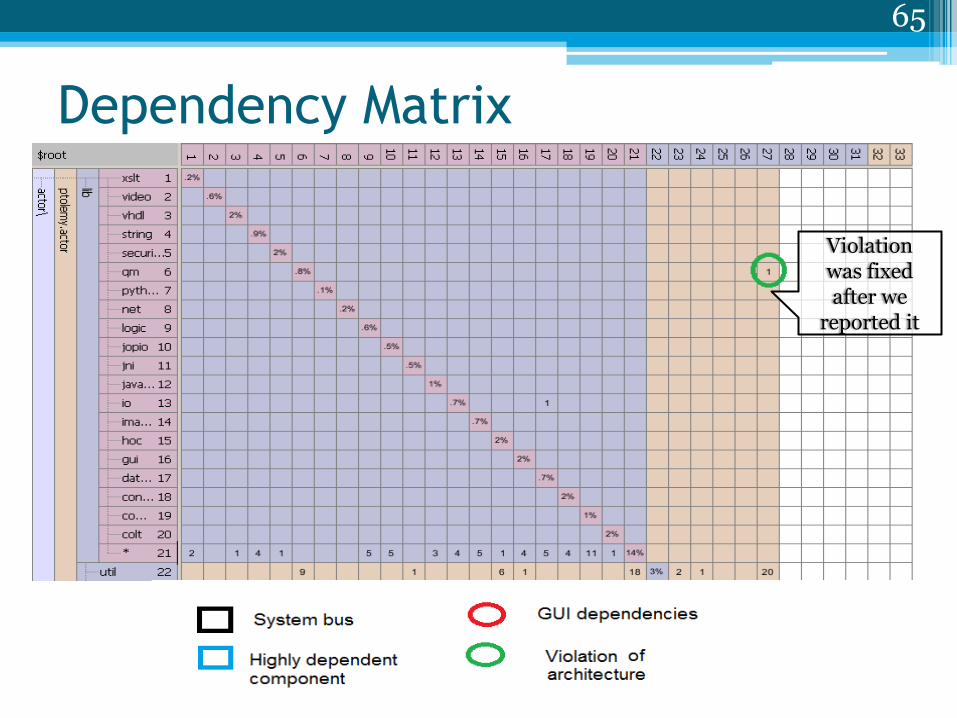
Dependency Matrix
65
Violation was fixed after we
reported it

High Priority, 30 Medium Priority,
25
Low Priority, 5
High Priority
Medium Priority
Low Priority
Priority Requirement Document
66

CMMI Assessment
• Distribute a weekly email with statistics to force people to look at them
• Have an established process where in progress and stabilized artifacts go
• Document type of estimation bias
• Establish baseline level of quality that is acceptable
• Establish standard set of practices for artifact review
67

Scoreboard Questions • Before
• Team Spirit • Overall effectiveness • Rewarding Experience • Team Productivity • Process quality • Is TSP working for us? • Satisfaction with what we are
learning
• After
• How much do you enjoy the project?
• Has your work in the past week interested you?
• Do you feel that the project is on track?
• Do you feel that your personal goals align with the team goals?
• Was help available from other team members when you need it?
• How well was each role performed (w/ comment)?
• Does the team, including yourself, contribute equally? ▫ Please explain, with role
names, your rating from the previous question
68

Workload Considerations
69
• Kept track of changing assignments
• Estimated overall effect on the plan based on # of people affected and approximated weight.

Ptolemy Architecture – Pipe-and-Filter
Entities (actors or filters), links, and the pipe‐and-filter architecture within Ptolemy. The entities are linked and can only communicate through existing links connected with relations
70
Element Responsibility
Entity Entities are the filters in the supported pipe-and-filter architecture. They are responsible for computation within the system. An entity can contain any number of ports.
Port Port is a point of connection for the entity. It can serve both as output and input, and knows if there’s a token waiting for processing.
Relation The relation is responsible to keep track of links. It controls the creation and termination of links
Token An encapsulation of a data message. Token serves to identify the message type, size and data boundaries
Link A link defines an association between an entity's port and a relation.
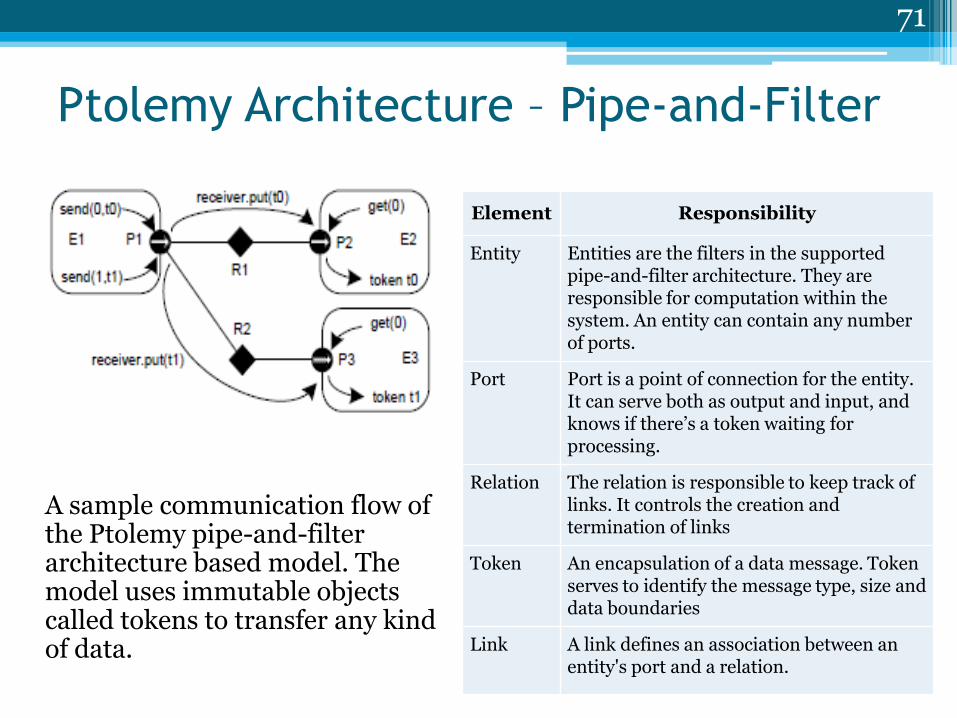
Ptolemy Architecture – Pipe-and-Filter
A sample communication flow of the Ptolemy pipe-and-filter architecture based model. The model uses immutable objects called tokens to transfer any kind of data.
71
Element Responsibility
Entity Entities are the filters in the supported pipe-and-filter architecture. They are responsible for computation within the system. An entity can contain any number of ports.
Port Port is a point of connection for the entity. It can serve both as output and input, and knows if there’s a token waiting for processing.
Relation The relation is responsible to keep track of links. It controls the creation and termination of links
Token An encapsulation of a data message. Token serves to identify the message type, size and data boundaries
Link A link defines an association between an entity's port and a relation.

Simulation Static View
72

Physical Perspective
73

Independent Layer Static View
UI Package
Android JavaSE
createInstance(Modules[] modules)static Injector getInjector()T getInstance(Class<T> type)
PlatformInjector
configureAndroidUIModule
Container
ContainerImpl
AndroidContainer JavaSEContainer
<<bind>>
configureJavaSEUIModule
<<bind>><<bind>>
<<bind>><<bind>>
mainMain
<<bind>>
<<bind>><<bind>>
T getInstance(Class<T> type)Injector
<<bind>>
74

Token Handler
75

ACDM List of Outstanding Issues • Reliability - how do we address that?
▫ Action: 2, 3 ▫ Comments: Address time out, runtime exceptions and deadlocks. Look at unstable queues
• We didn’t look at how Ptolemy implemented Corba or other communication protocols. This might be more elegant. ▫ Receivers ▫ Ports ▫ Action: 3
• We didn’t look at the attribute widget. ▫ SharedAttribute might be a problem. ▫ Action: 2, 3 ▫ Comments: If SharedAttribute is used on both client and server. We need to synchronize values each
time, it changes. Possibly pausing simulation in between. • Experiment 2 results are not captured and analyzed
▫ Action: 2 ▫ Comments: Capture the data and plot the latency
• Plotter might be painful using the platform ind. layer ▫ Action: 3 ▫ Comments: in worst case we reimplement it for Android
• We did not consider the case of server supporting multiple clients ▫ Action: 2, 3 ▫ Comments: Decide how to assign different topic names to different clients and kill simulation
instances once client disconnects (last will and testament feature should help)
76

Quality Attributes
77

Quality Attributes
78
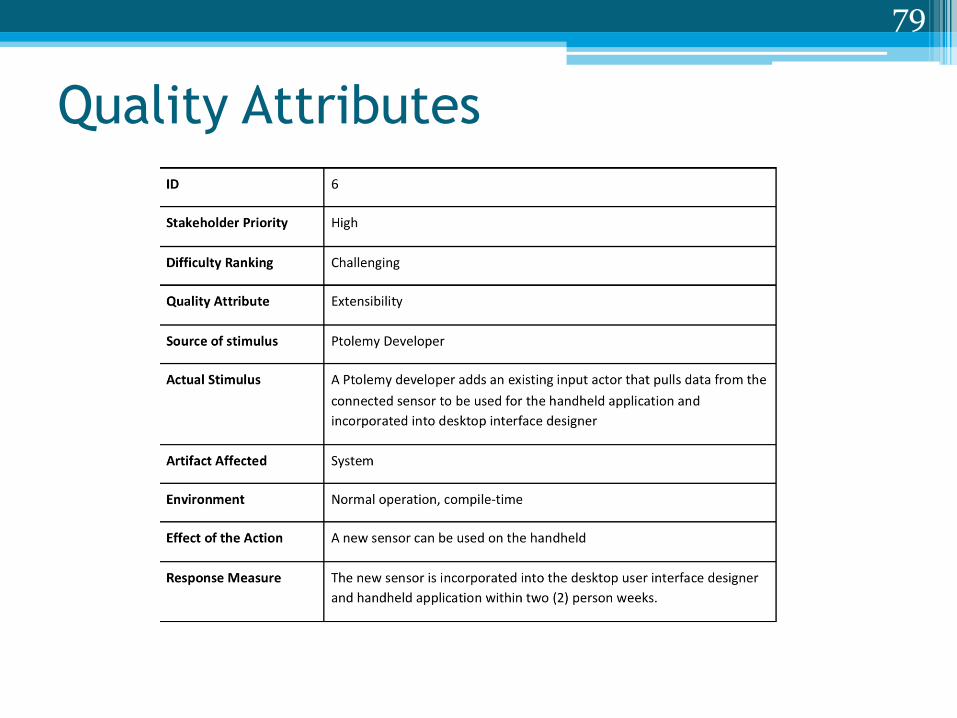
Quality Attributes
79

Quality Attributes
80

Quality Attributes
81

Quality Attributes
82
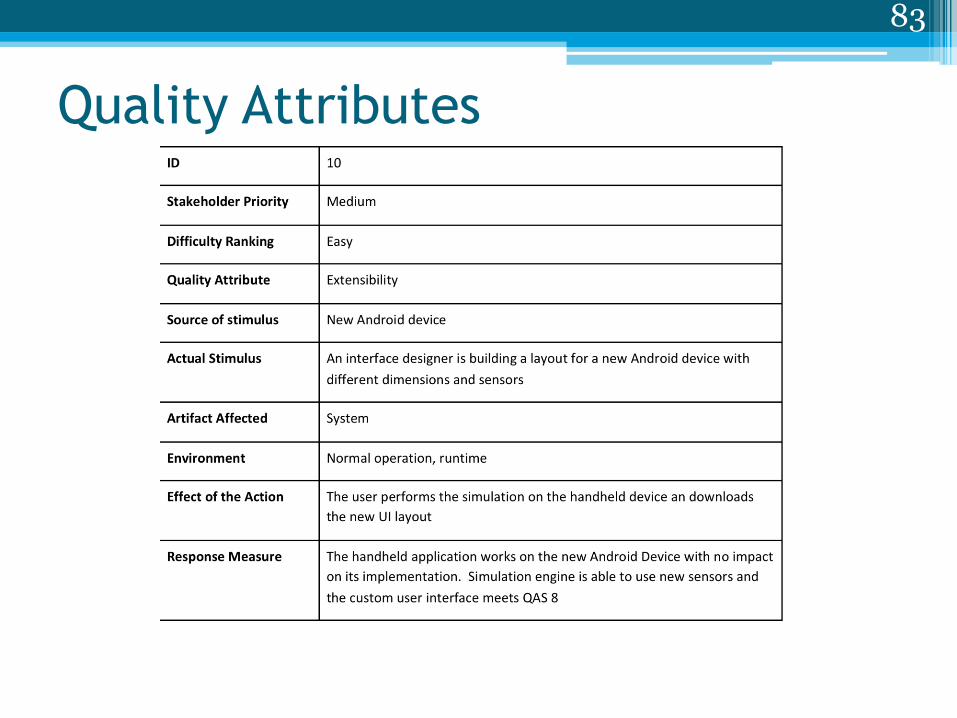
Quality Attributes
83

Quality Attributes
84

Quality Attributes
85

Quality Attributes
86
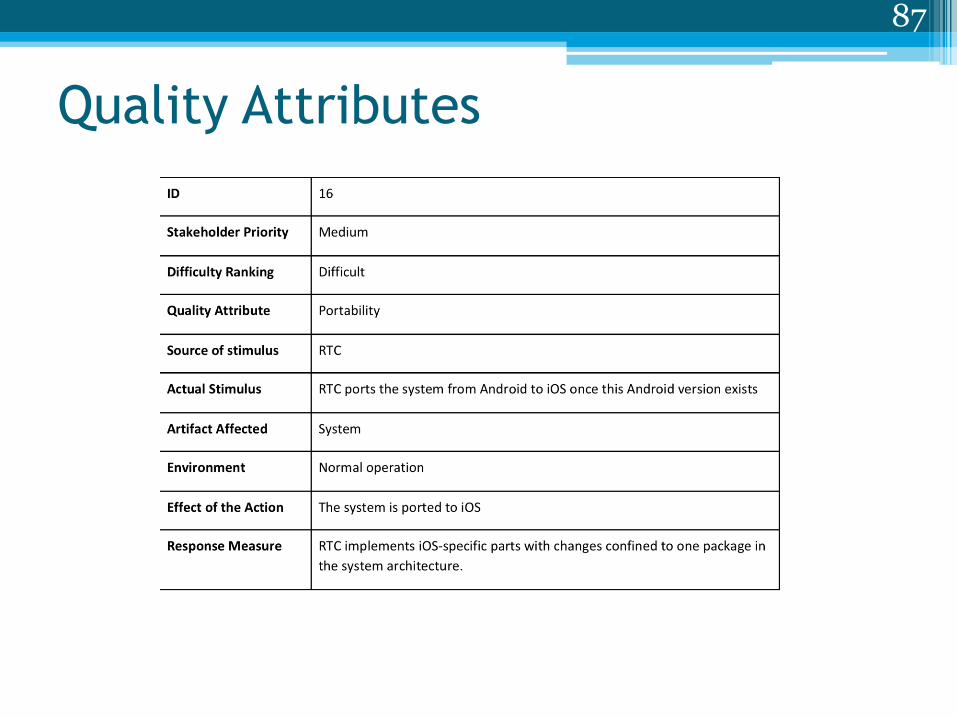
Quality Attributes
87

Quality Attributes
88

Quality Attributes
89

Quality Attributes
90

Other Experiments
• Complete port of Ptolemy
• Code Generation
• TCP/IP protocol communication
• Netbeans UI Designer
91

Alternatives
• Simulation Engine ▫ Code Generation ▫ Compile Ptolemy on Android
• UI Designer
▫ Eclipse ▫ Built-in tool ▫ Netbeans
• Communication Interface ▫ TCP/IP ▫ MQTT ▫ XMPP
92

Estimation Metrics
93
Under Right On Over
Count 33.000 2.000 59.000
Average % 62.701 39.711
Std Dev 70.255