Embed Size (px)
Citation preview
DANS is an institute of KNAW and NWO
Data Archiving and Networked ServicesData Archiving and Networked Services
Drowning in information – the need of macroscopes for
research funding
Andrea Scharnhorst
PLANNING, PREDICTION, SCENARIOSUsing Simulations and Maps2015 Annual EA Conference
11–12 May 2015

Andrea Scharnhorst – “science located”
•Head of Research&Innovation at DANS and scientific coordinator of the Computational Humanities programme at the eHumanities group of the Royal Netherlands Academy of Arts and Sciences (KNAW) – DANS=Data Archiving and Networked Services Institute (DANS)
Analyzing the dynamics of information and knowledge landscapes

Visual analytics of science
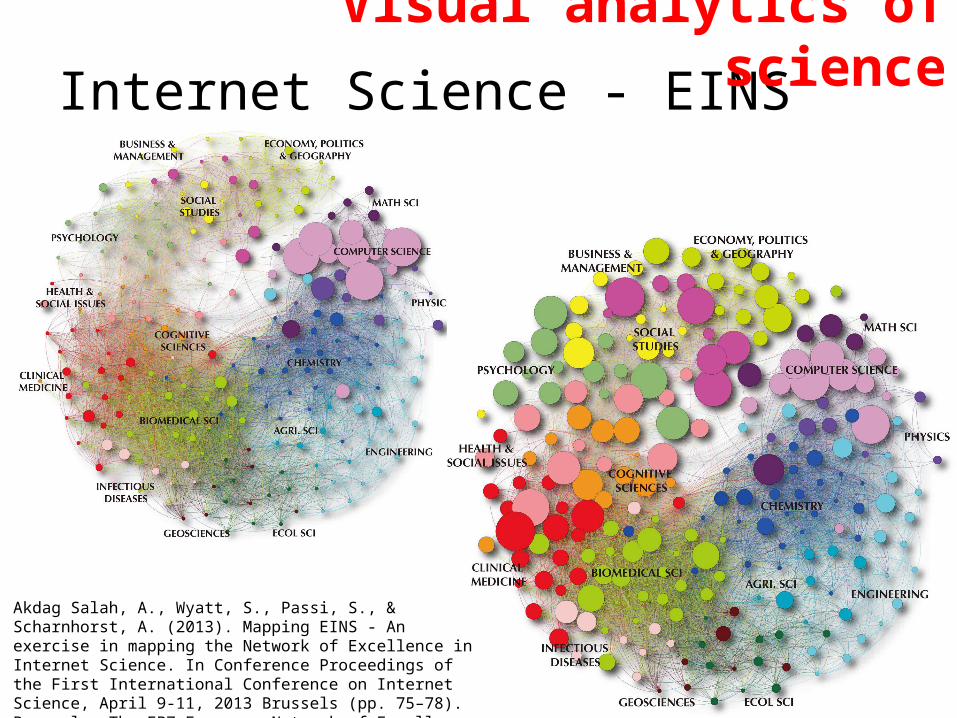
Internet Science - EINS
Akdag Salah, A., Wyatt, S., Passi, S., & Scharnhorst, A. (2013). Mapping EINS - An exercise in mapping the Network of Excellence in Internet Science. In Conference Proceedings of the First International Conference on Internet Science, April 9-11, 2013 Brussels (pp. 75–78). Brussels: The FP7 European Network of Excellence in Internet Science. Retrieved from http://arxiv.org/abs/1304.5753
Visual analytics of science

Ref: Linda Reijnhoudt, Michael J. Stamper, Katy Börner, Chris Baars, and Andrea Scharnhorst (2012) NARCIS: Network of Experts and Knowledge Organizations in the Netherlands. Poster presented at the Third annual VIVO conference, August 22 - 24, 2012 Florida, USA, http://vivoweb.org/conference2012
Visual analytics of science

Impact EV
Impact of SSH projects in FP6, FP7 and beyond
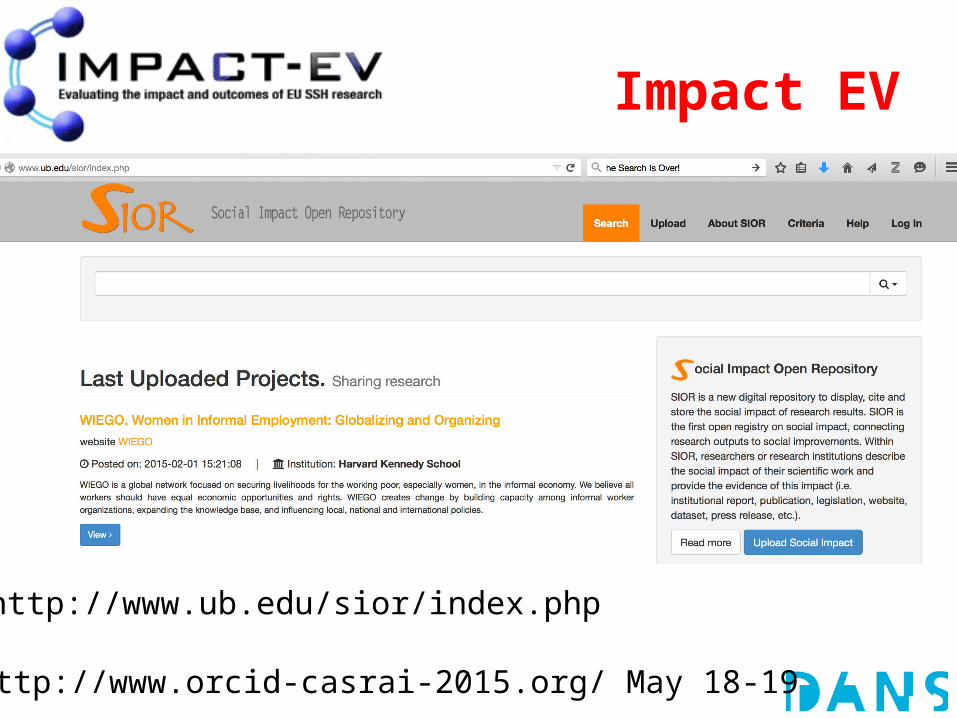
Impact EV
http://www.ub.edu/sior/index.php
http://www.orcid-casrai-2015.org/ May 18-19
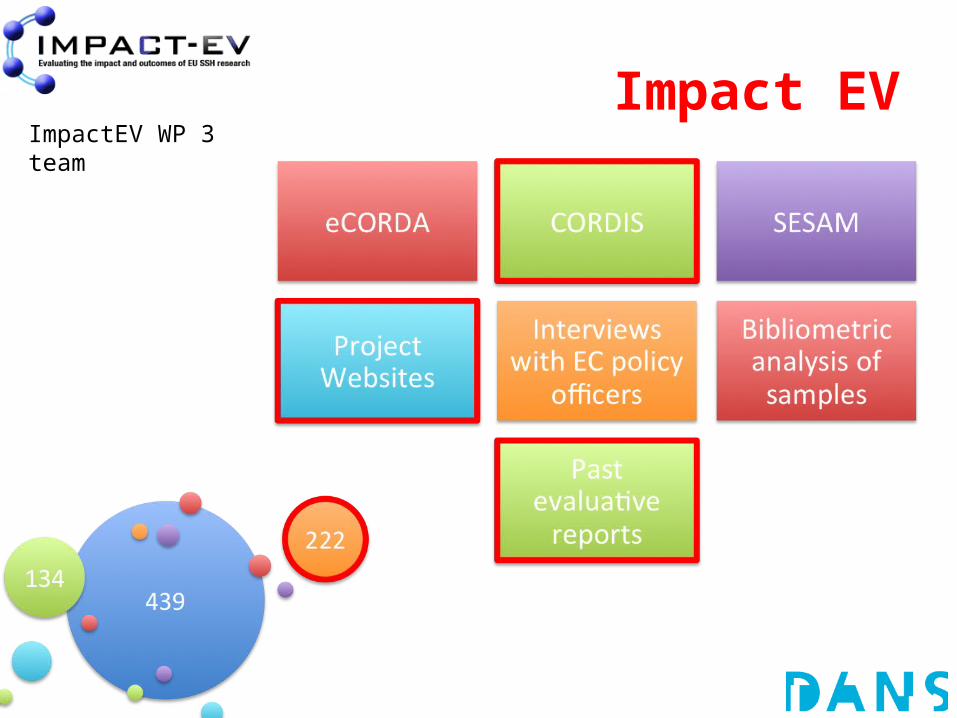
Impact EVImpactEV WP 3 team

Data sourceBaseline statistics projects
https://open-data.europa.eu/en/data/dataset/cordisfp6projects https://open-data.europa.eu/en/data/dataset/cordisfp7projectswebsites of SSH projects
Project information
Contractor information
Henk van den Berg

Baseline statistics Henk van den Berg

Baseline statistics Henk van den Berg

Baseline statistics
Linda Reijnhoudt

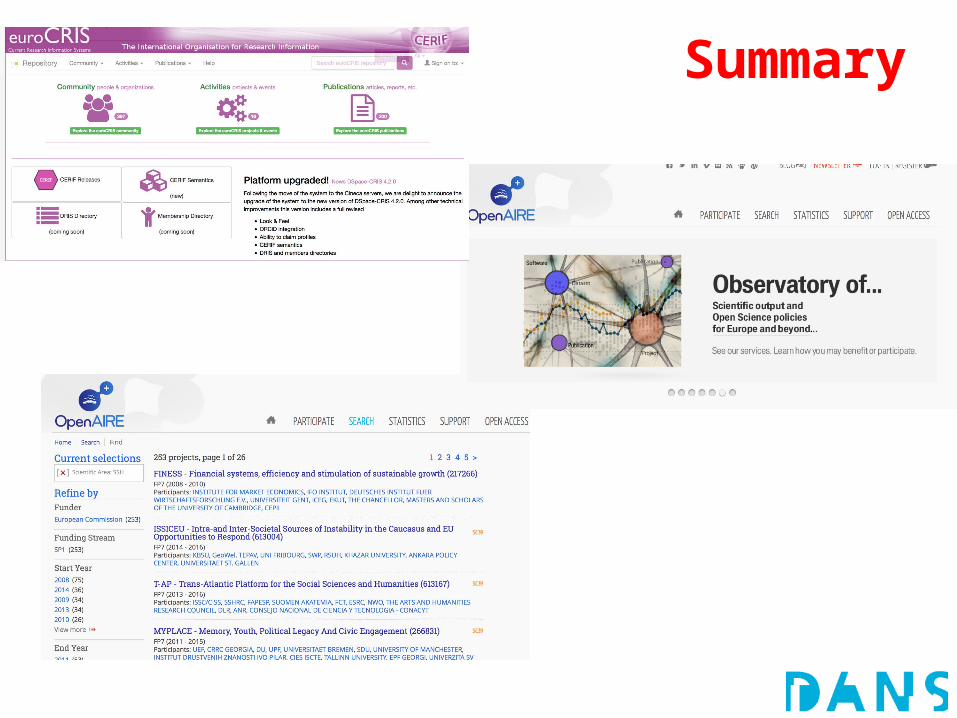
SummaryThe main problem are not the visuals but the data!
In reports about FP’s and other funding streams on the European level, we find a lot of project baseline statistics. But those are on different aggregation levels. This is why we need access to data directly and more explorations of the open data already available.(see http://ec.europa.eu/research/evaluations/pdf/archive/fp7_monitoring_reports/7th_fp7_monitoring_report.pdf#view=fit&pagemode=none as an example of a decentBread-and-butter project analytics; see https://open-data.europa.eu/en/apps for open data and applications build on them)
There are different portals into RI on European level, but they allmonitor specific aspects (e.g. openaire.eu) and often come without visuals overviews. An observatory of European funding would need to start from there.
Analytics (statistical, visual) is always question driven. Many projects have been funded to look into specific calls/programme and evaluate them, partly also also using inf vis. The problem is not a tailored approach to evaluation but that there is no overview of those studies. We need in an observatory two layers:- Baseline information on projects and –Information which of those projects figured in which evaluative study. Otherwise, there is a big risk of repetition.
Summary

ChallengeSummary
Datamine the 344 reports and see which projects they cover, methods they use and results they produce.

ANALYZING THE DYNAMICS OF INFORMATION ANALYZING THE DYNAMICS OF INFORMATION AND KNOWLEDGE LANDSCAPES AND KNOWLEDGE LANDSCAPES
Browse a collection or a database
Map size, structure, composition and evolution of the collection
Locate your search on such an interactive knowledge map
• Domain overview for students, interdisciplinary teams, lay experts and funding agencies
• Tools for scholars of history and philosophy of science and bibliometrics
• Overview of BigData collections (incl. social media)
Given the explosion of information how to navigate to find what is needed?

Information professionals•Collections, Information retrieval•WG 1 Phenomenology of knowledge spaces• WG 4 Data curation & navigation
Social scientists•Simulating user behavior•WG 2 Theory of knowledge spaces•WG 4 Data curation & navigation
Computer scientists •Semantic web, data models•WG 1 Phenomenology of Knowledge Spaces•WG 4 Data curation &navigation
Physicists, mathematicians
Digital humanities scholars•Collections, interactive design•WG 3 Visual analytics – knowledge maps•WG 4 Data curation & navigation
Participating communitiesParticipating communities
• Structure & evolution of complex knowledge spaces, big data mining
• WG 2 Theory of knowledge spaces
• WG 3 Visual analytics – knowledge maps
www.knowescape.org