Embed Size (px)
Citation preview
- Mr Kim
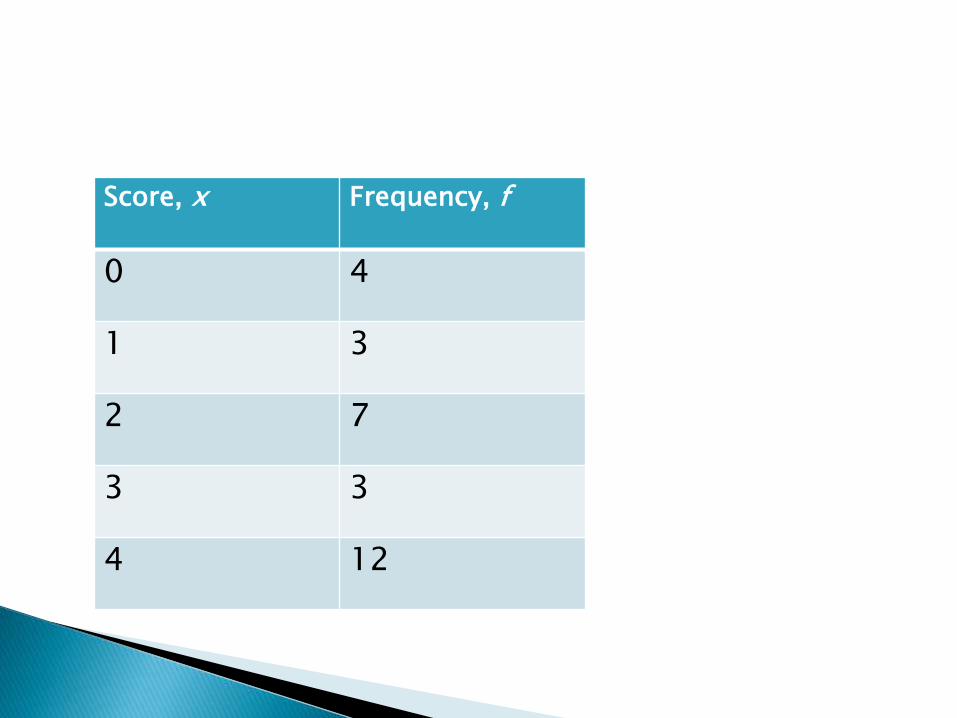
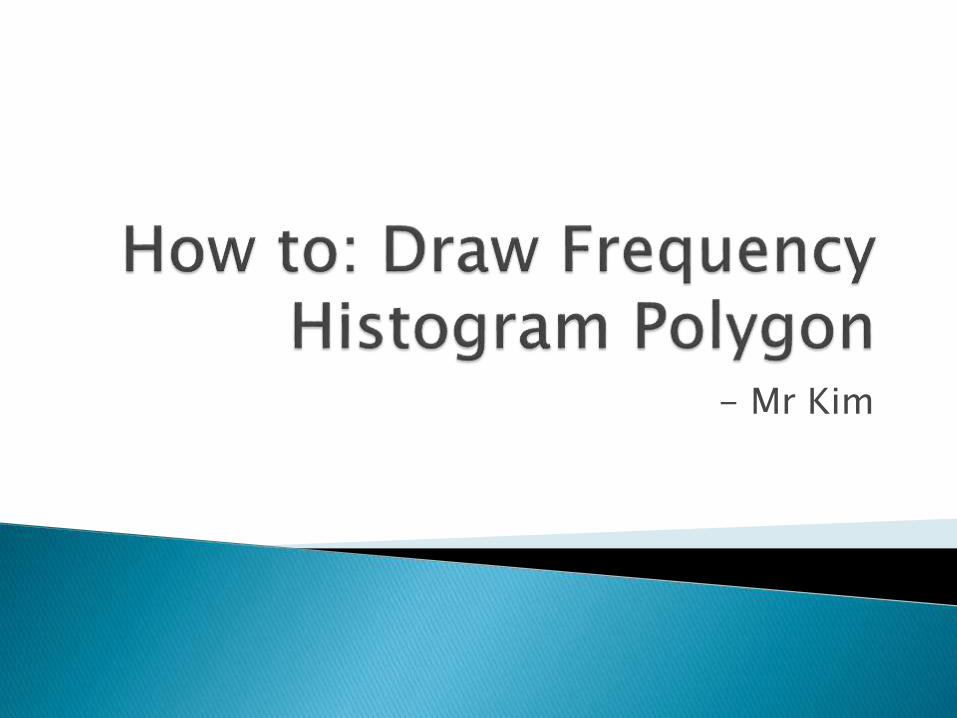
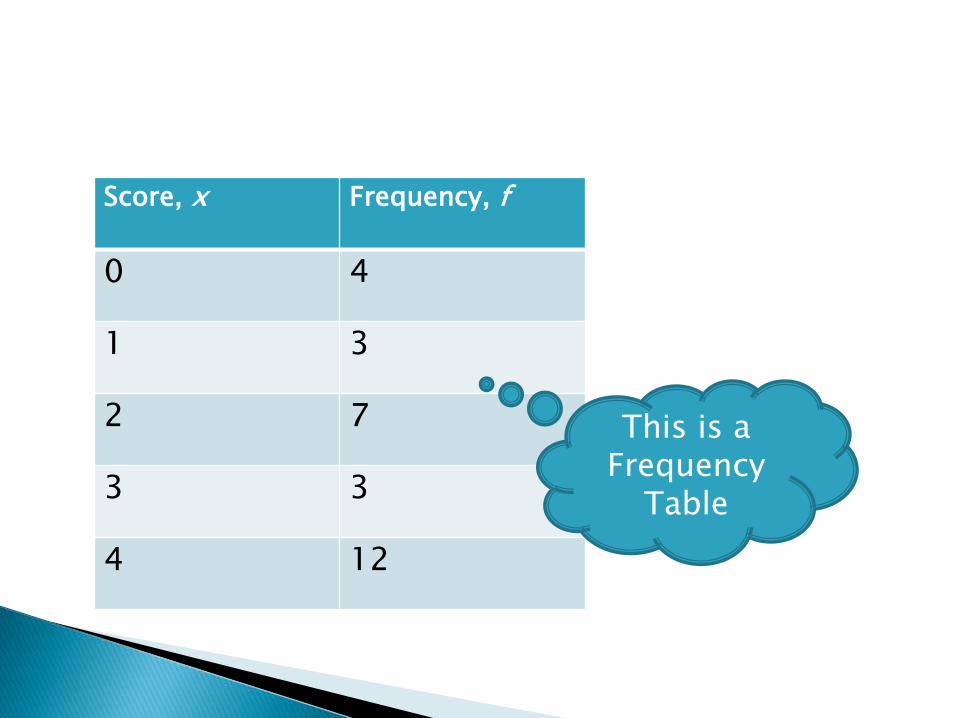
Score, x Frequency, f
0 4
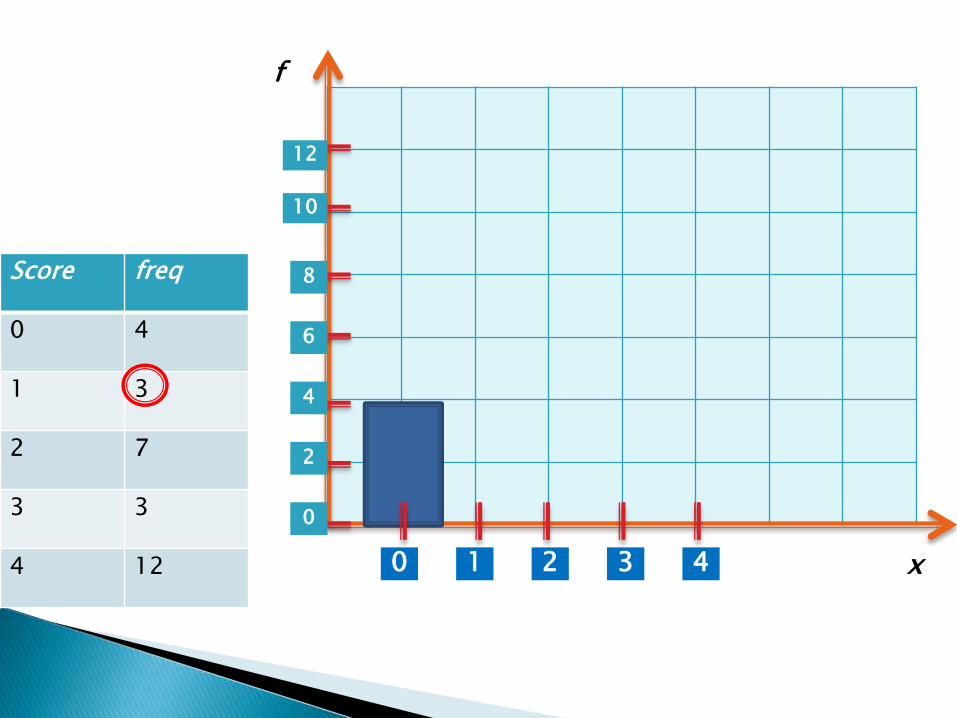
1 3
2 7
3 3
4 12
Score, x Frequency, f
0 4
1 3
2 7
3 3
4 12
This is a Frequency
Table
Score freq
0 4
1 3
2 7
3 3
4 12
Score freq
0 4
1 3
2 7
3 3
4 12
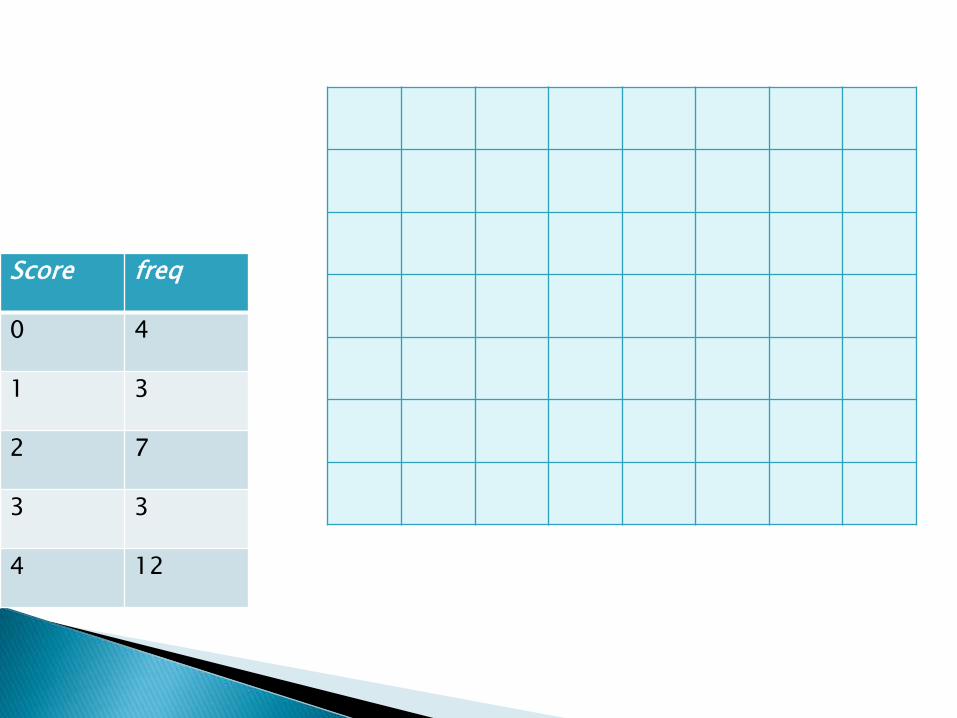
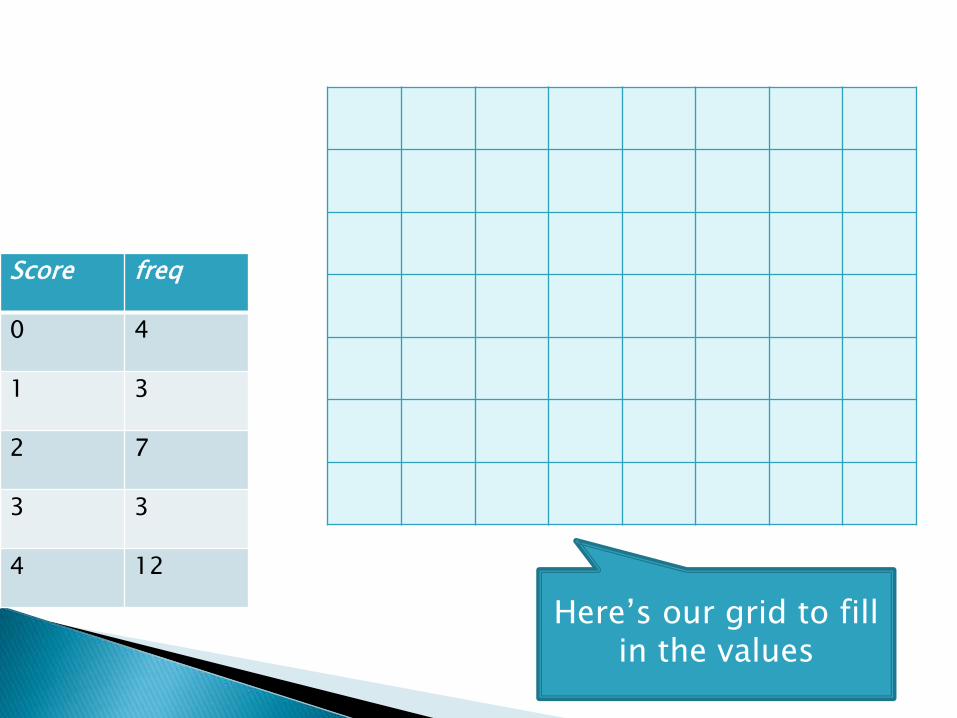
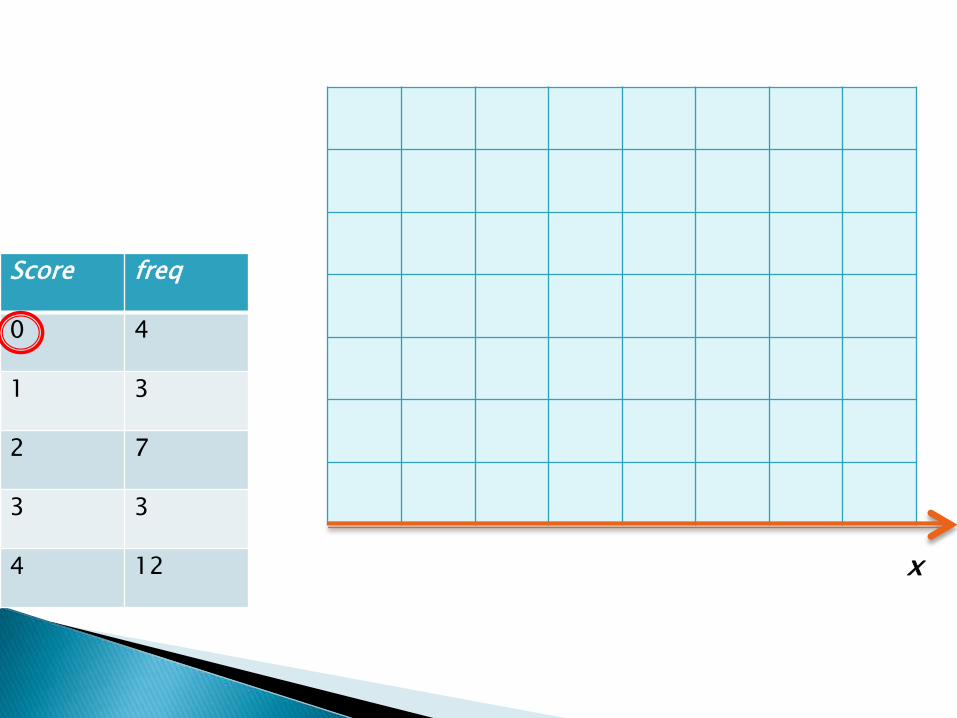
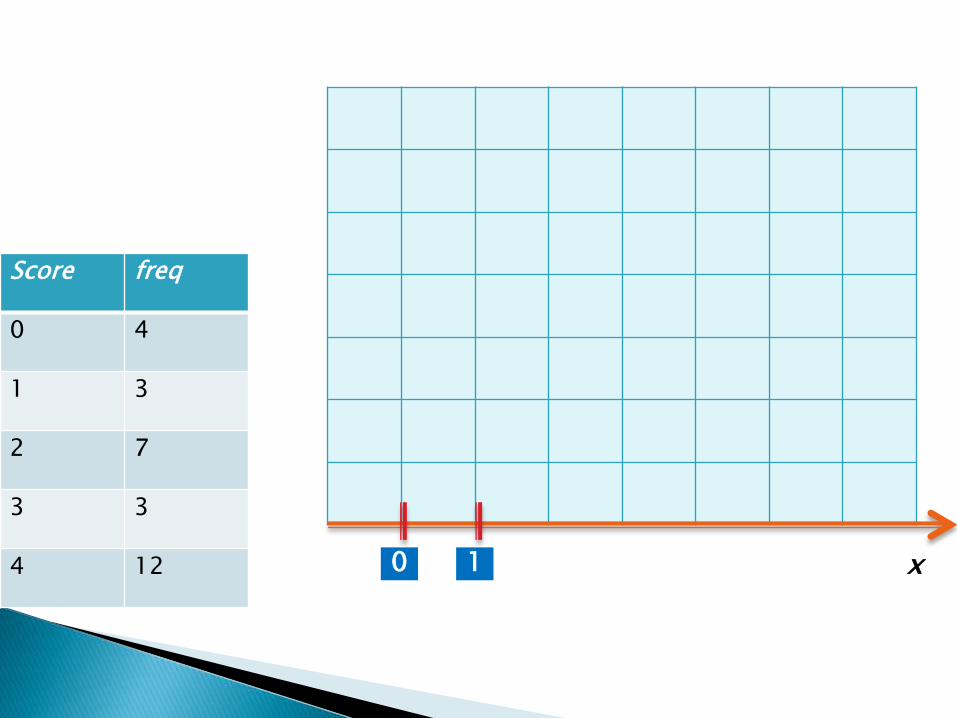
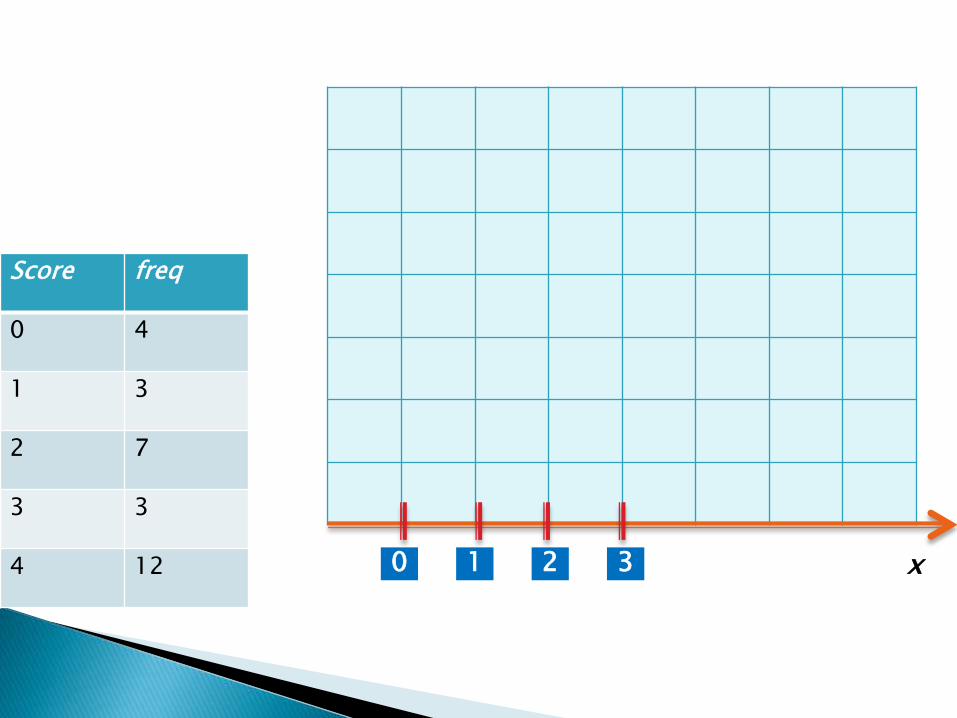
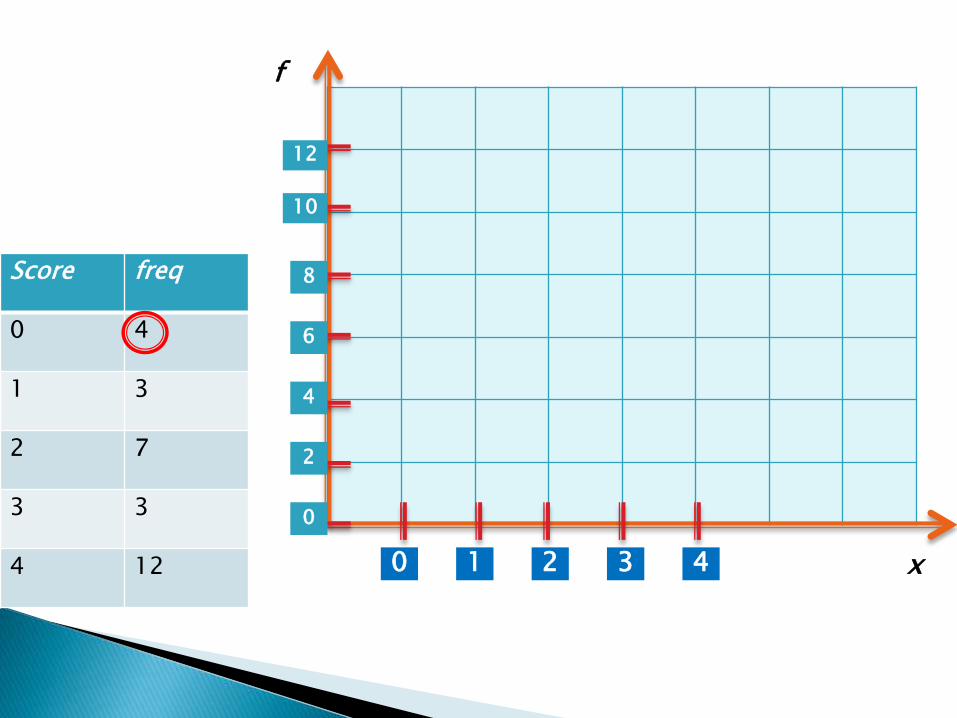
Here’s our grid to fill in the values
Score freq
0 4
1 3
2 7
3 3
4 12 x
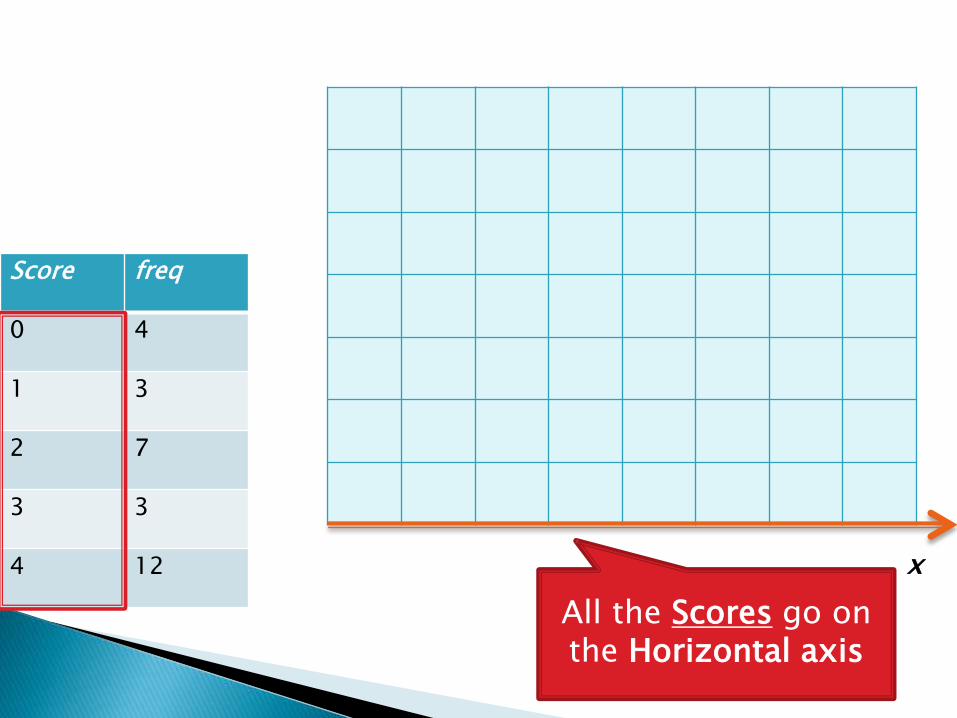
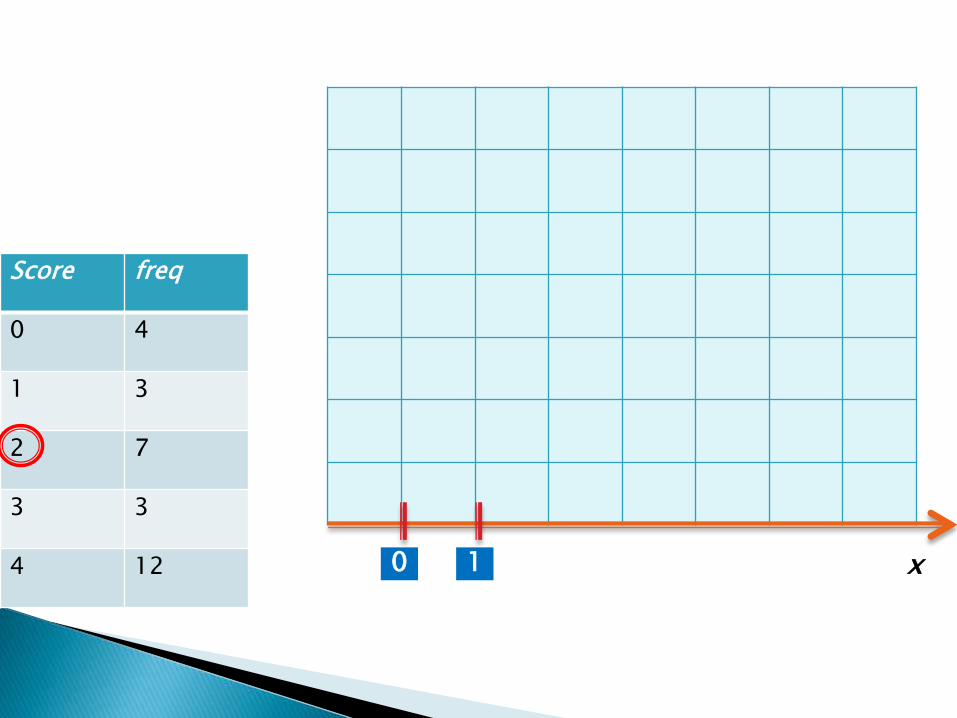
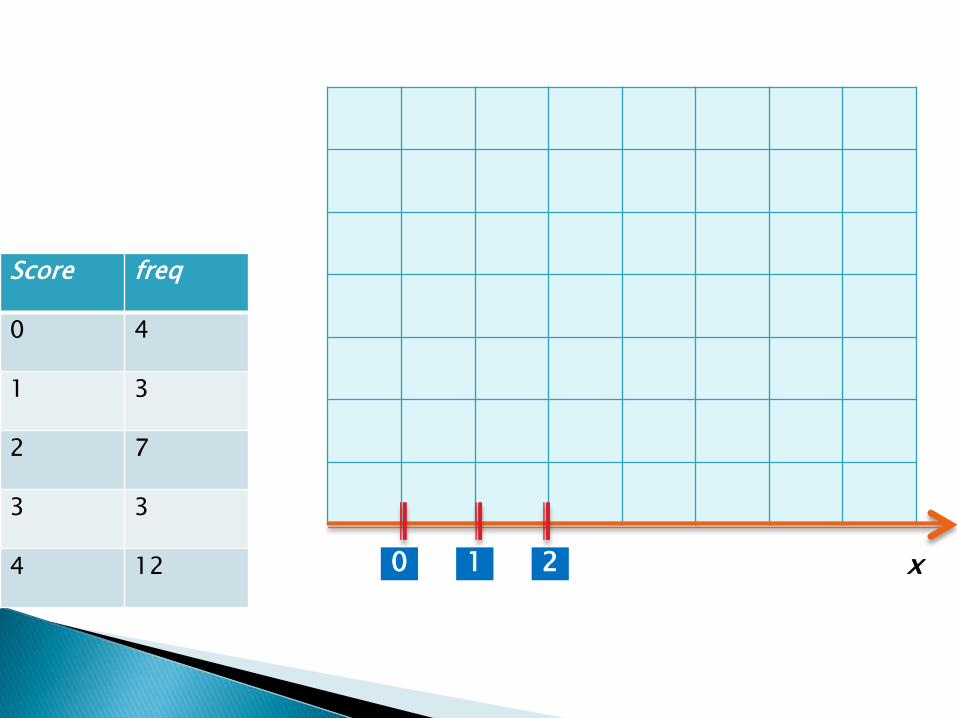
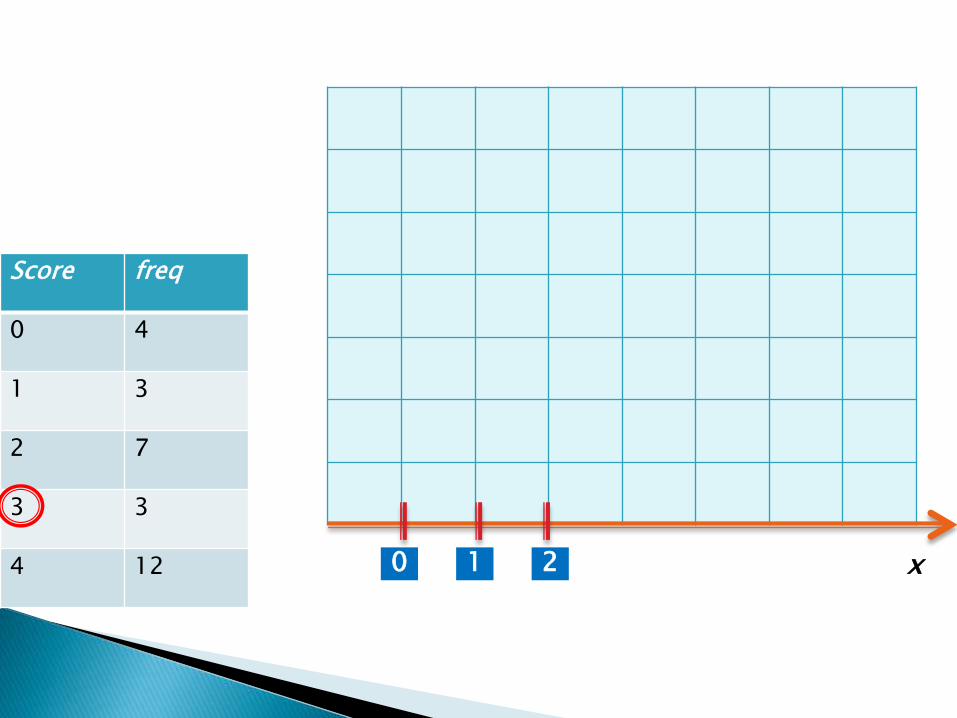
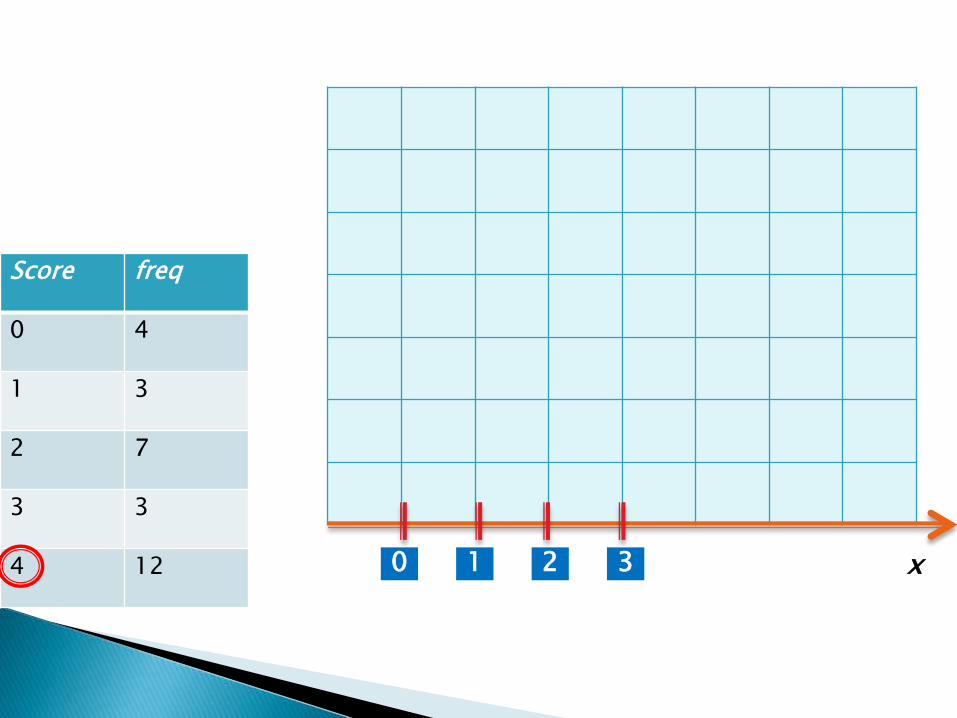
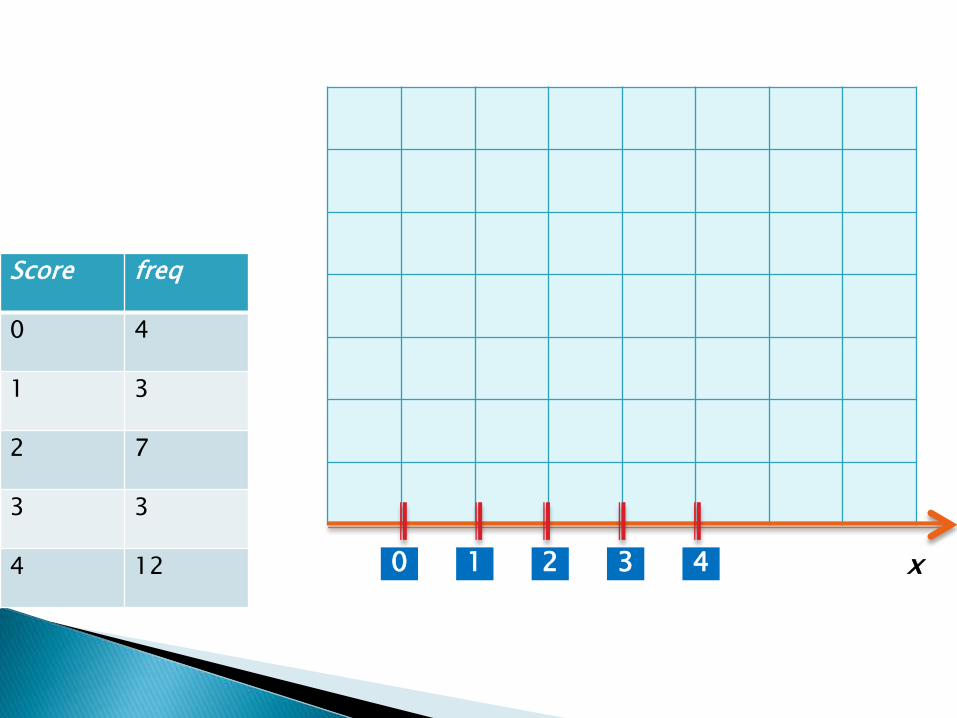
All the Scores go on the Horizontal axis
Score freq
0 4
1 3
2 7
3 3
4 12 x

Score freq
0 4
1 3
2 7
3 3
4 12 0 x
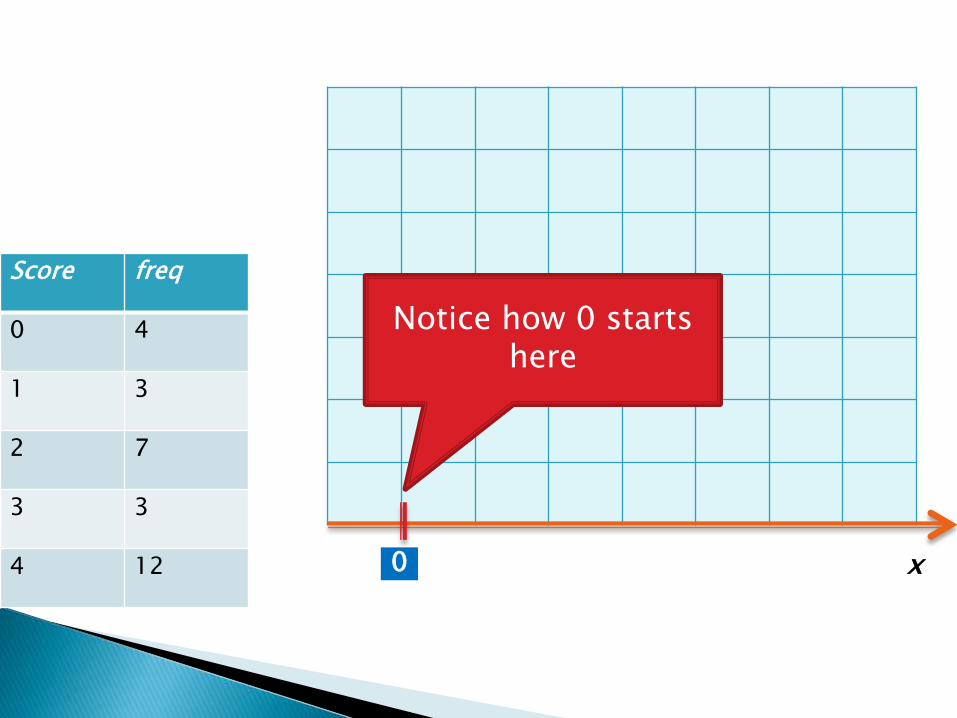
Score freq
0 4
1 3
2 7
3 3
4 12 0 x
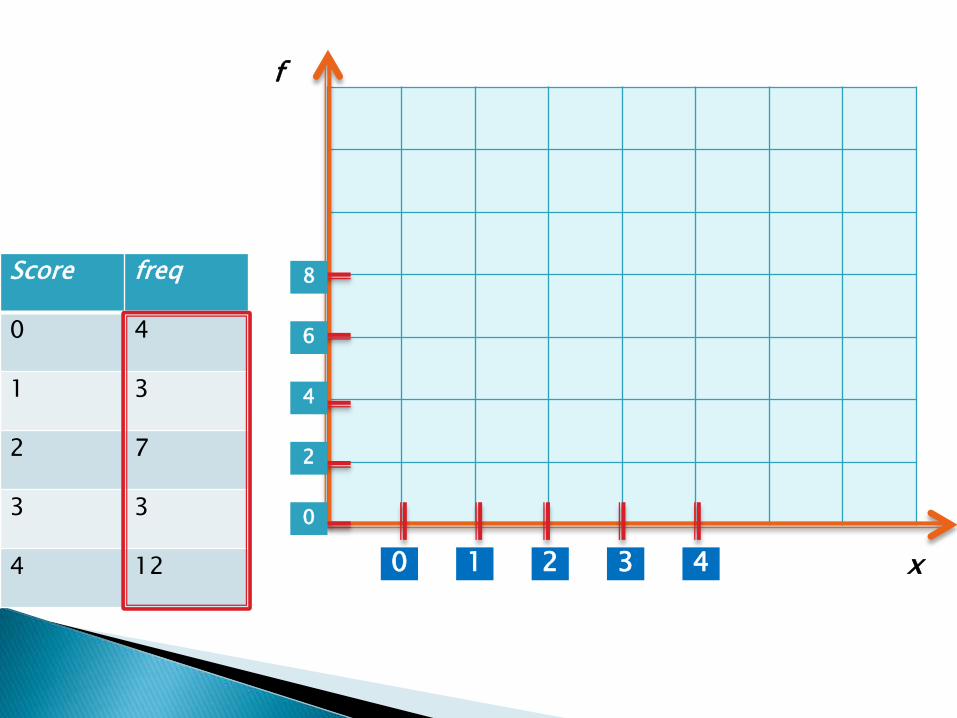
Notice how 0 starts here
Score freq
0 4
1 3
2 7
3 3
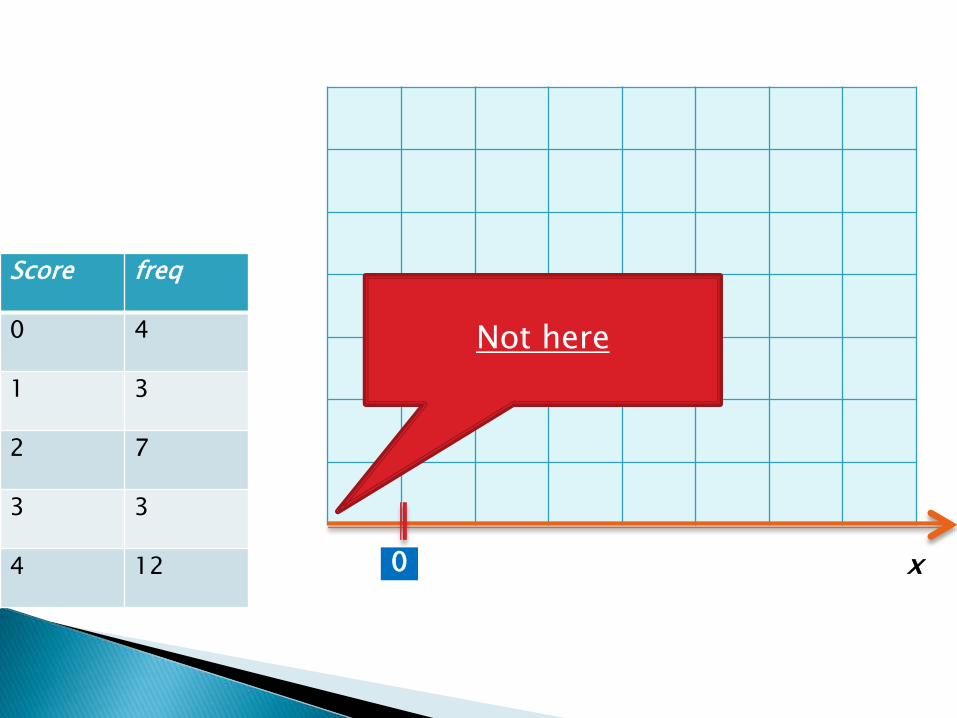
4 12 0 x
Not here
Score freq
0 4
1 3
2 7
3 3
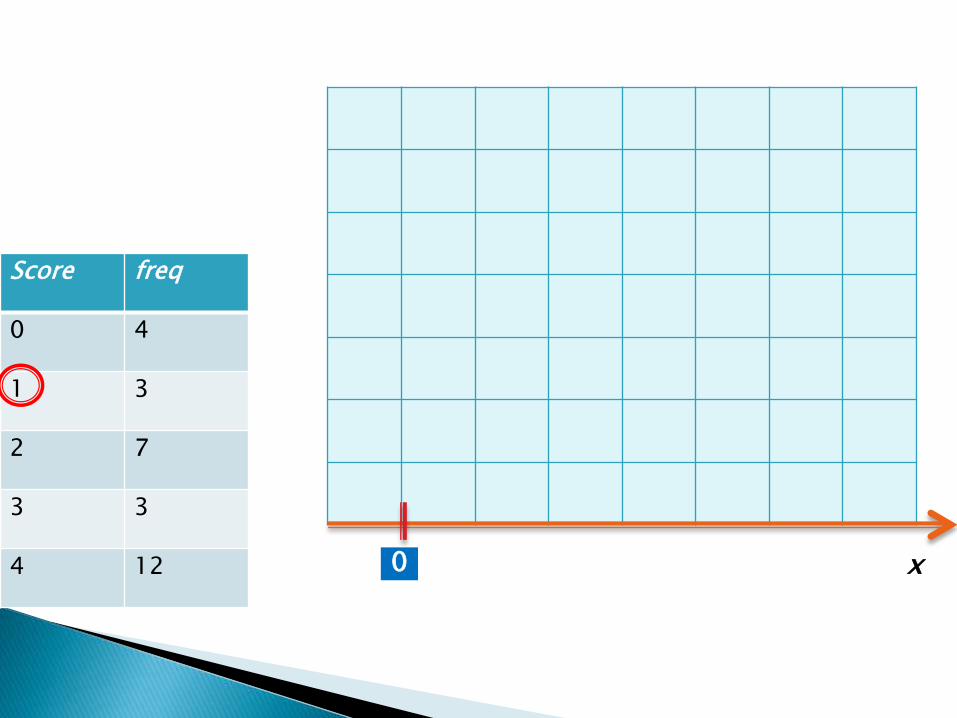
4 12 0 x
Score freq
0 4
1 3
2 7
3 3
4 12 10 x
Score freq
0 4
1 3
2 7
3 3
4 12 10 x
Score freq
0 4
1 3
2 7
3 3
4 12 1 20 x
Score freq
0 4
1 3
2 7
3 3
4 12 1 20 x
Score freq
0 4
1 3
2 7
3 3
4 12 1 2 30 x
Score freq
0 4
1 3
2 7
3 3
4 12 1 2 30 x
Score freq
0 4
1 3
2 7
3 3
4 12 1 2 3 40 x
Score freq
0 4
1 3
2 7
3 3
4 12 1 2 3 40 x
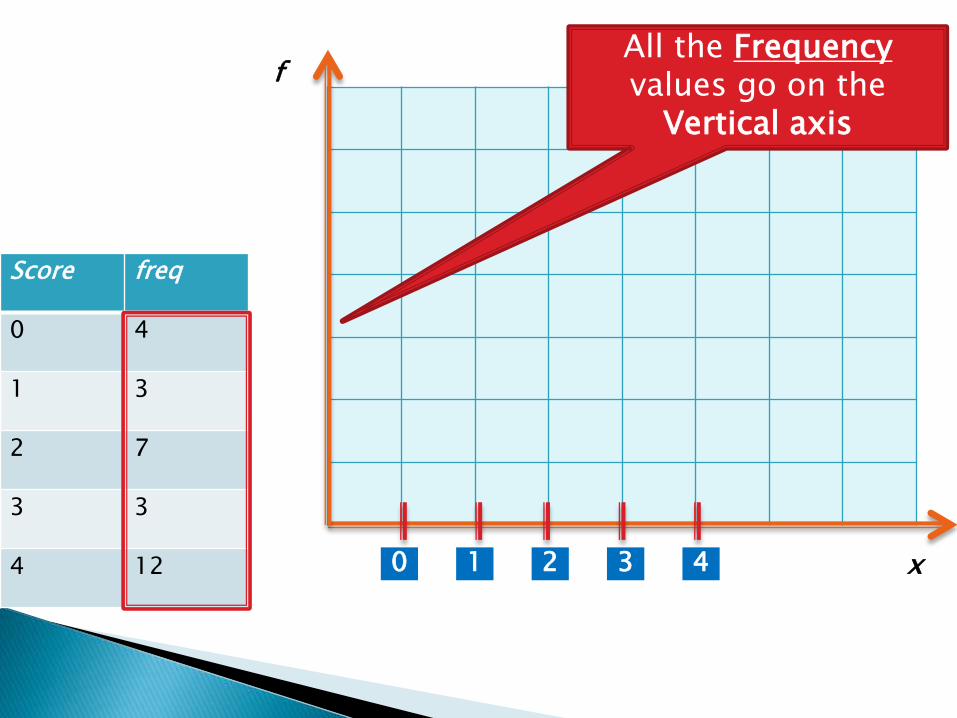
fAll the Frequencyvalues go on the
Vertical axis
Score freq
0 4
1 3
2 7
3 3
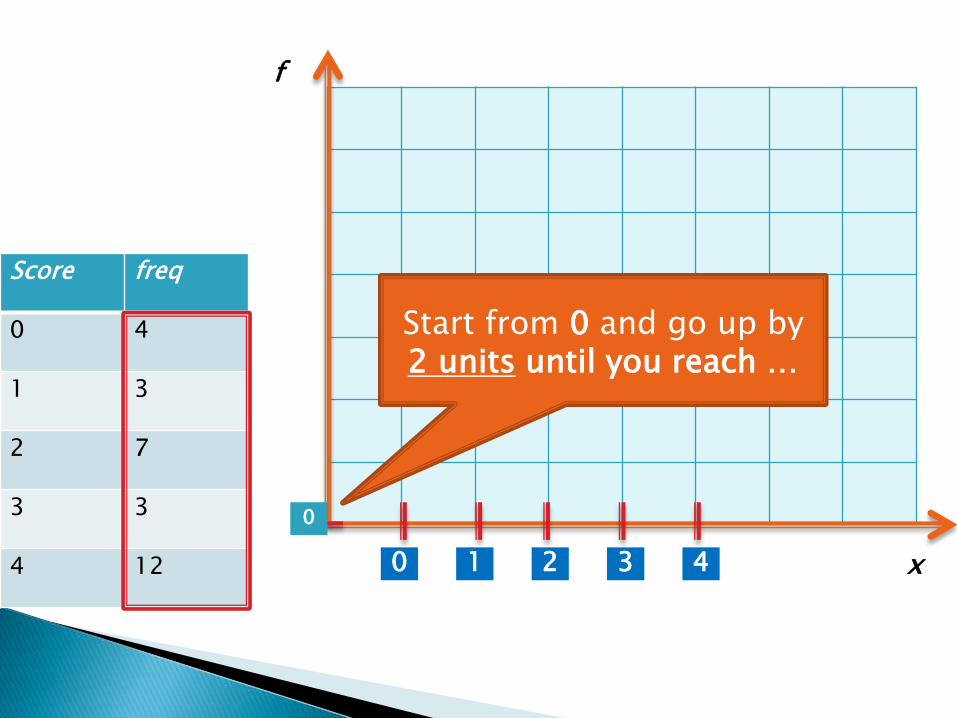
4 12 1 2 3 40
0
x
f
Start from 0 and go up by 2 units until you reach …
Score freq
0 4
1 3
2 7
3 3
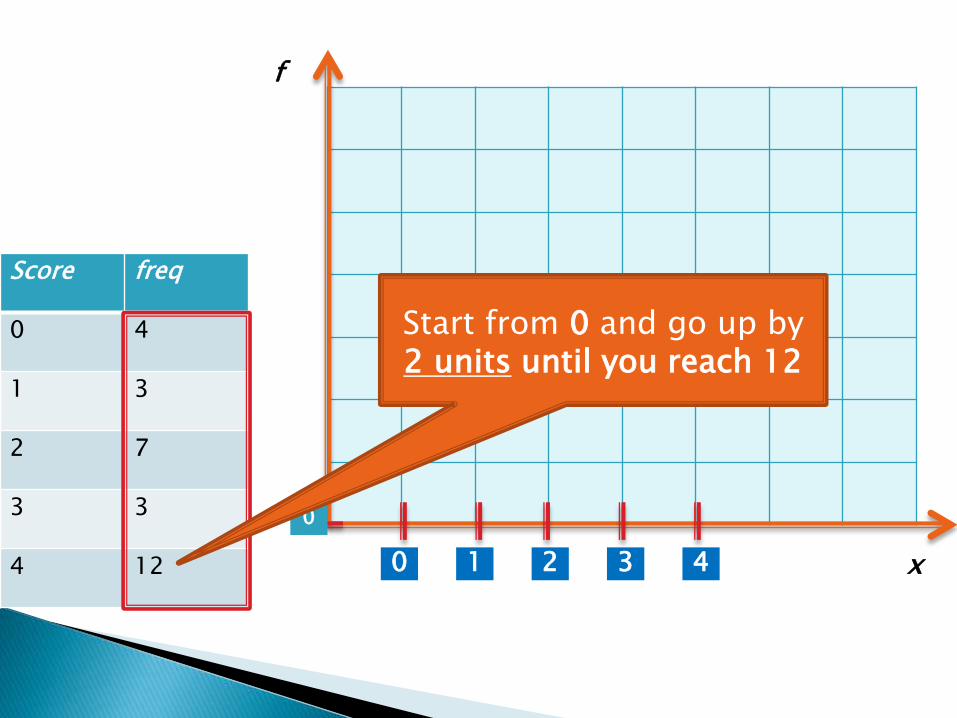
4 12 1 2 3 40
0
x
f
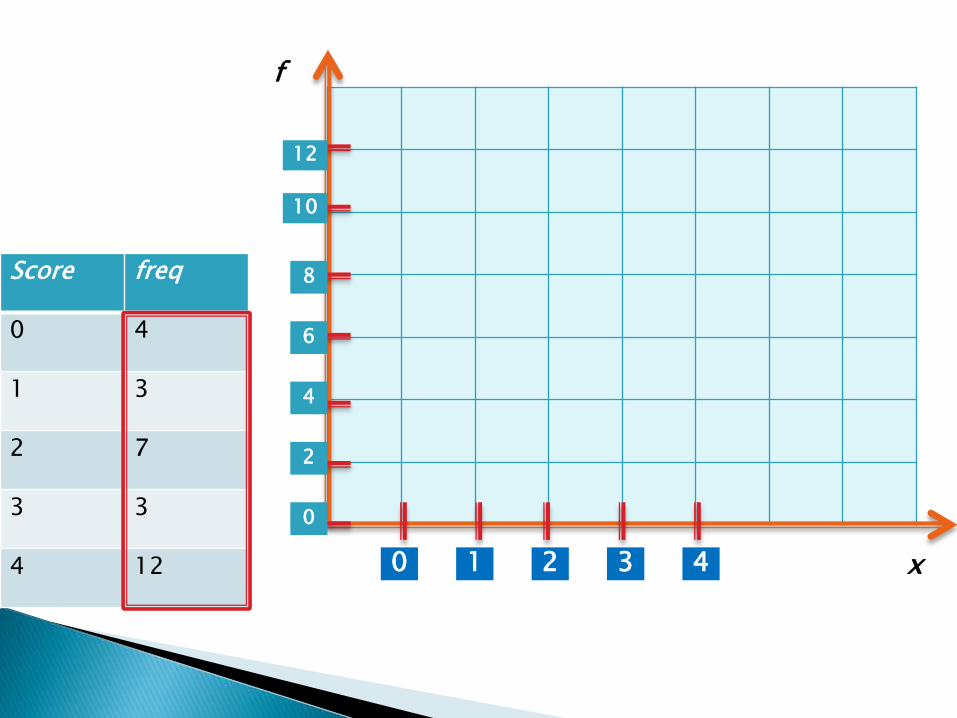
Start from 0 and go up by 2 units until you reach 12
Score freq
0 4
1 3
2 7
3 3
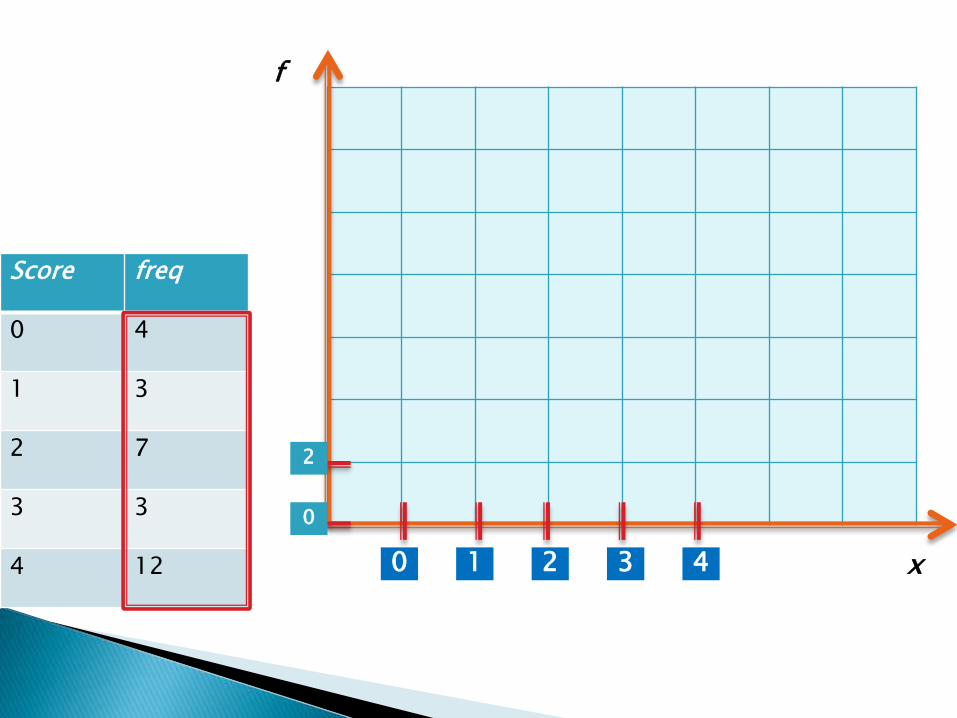
4 12 1 2 3 40
0
2
x
f
Score freq
0 4
1 3
2 7
3 3
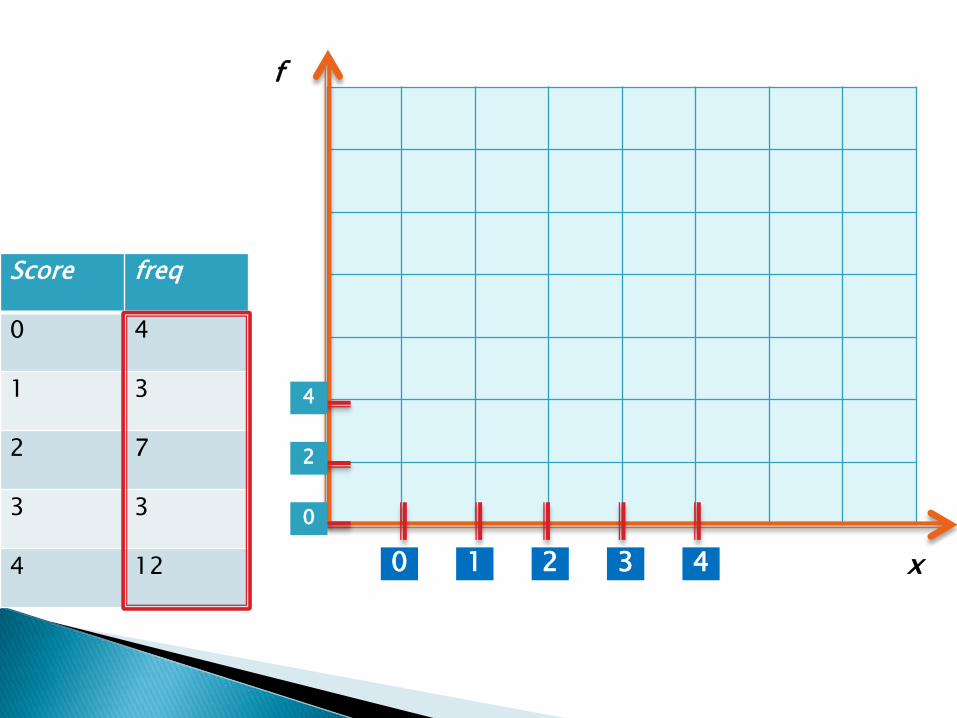
4 12 1 2 3 40
0
2
4
x
f

Score freq
0 4
1 3
2 7
3 3
4 12 1 2 3 40
0
2
4
6
x
f
Score freq
0 4
1 3
2 7
3 3
4 12 1 2 3 40
0
2
4
6
8
x
f
Score freq
0 4
1 3
2 7
3 3
4 12 1 2 3 40
0
2
4
6
8
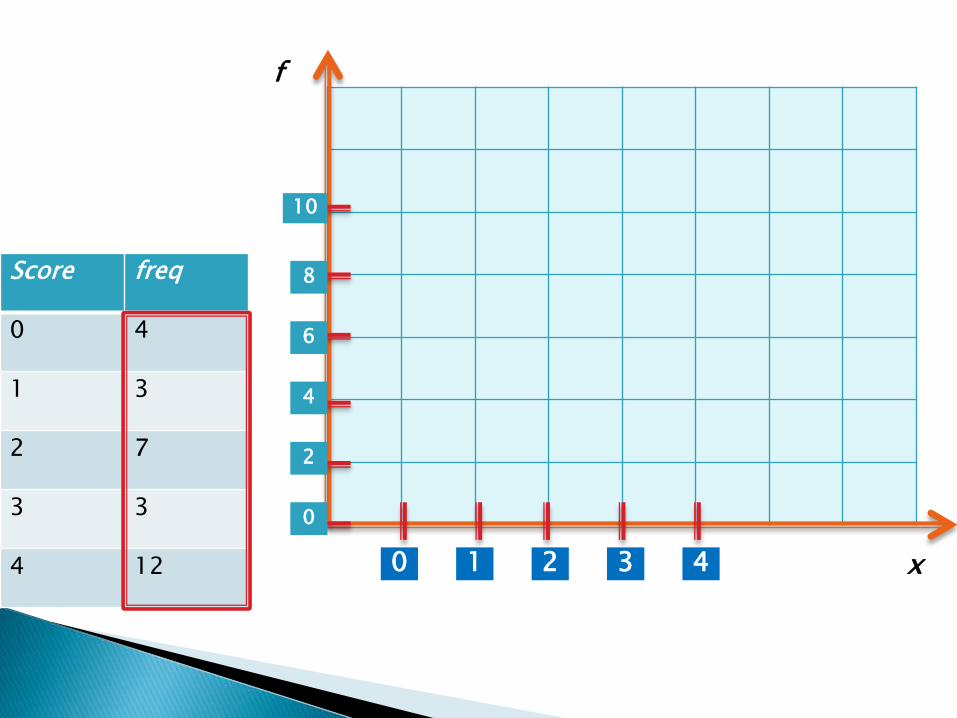
10
x
f
Score freq
0 4
1 3
2 7
3 3
4 12 1 2 3 40
0
2
4
6
8
10
12
x
f
Score freq
0 4
1 3
2 7
3 3
4 12
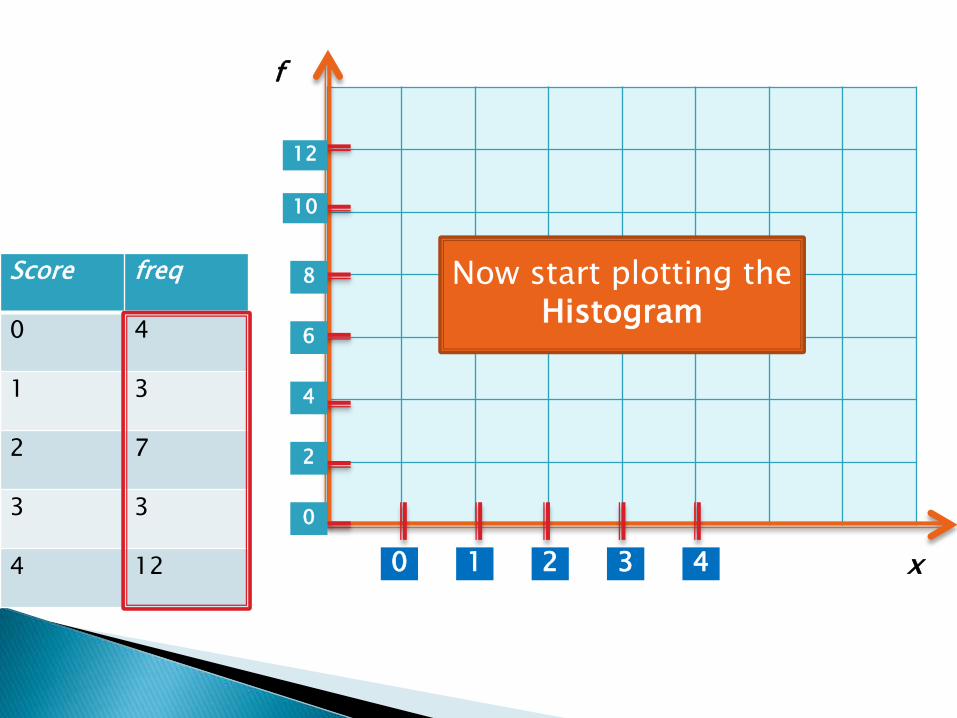
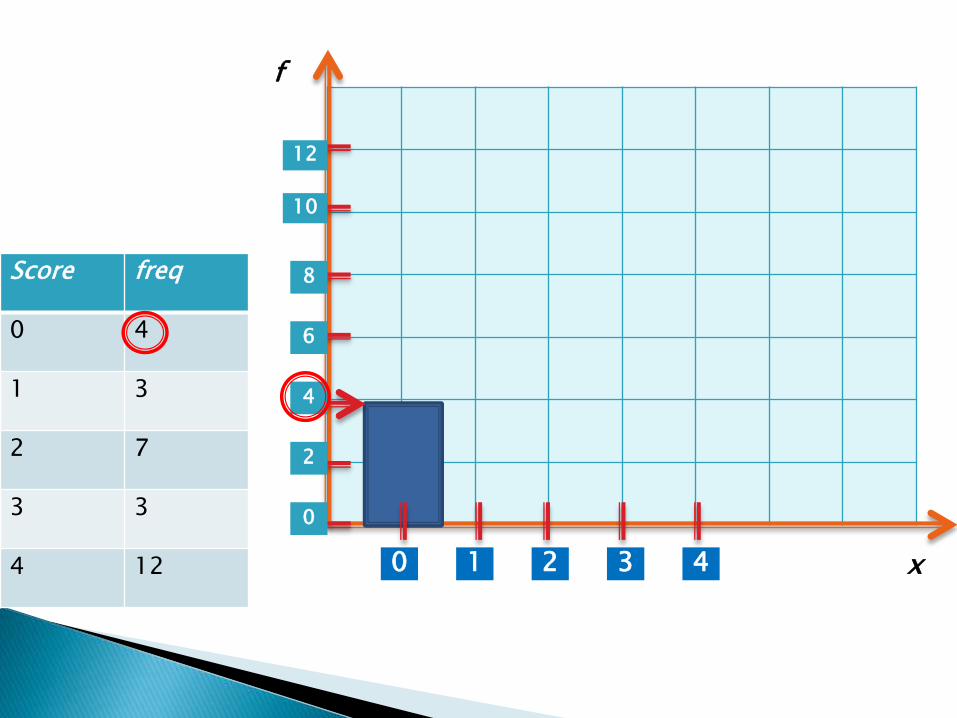
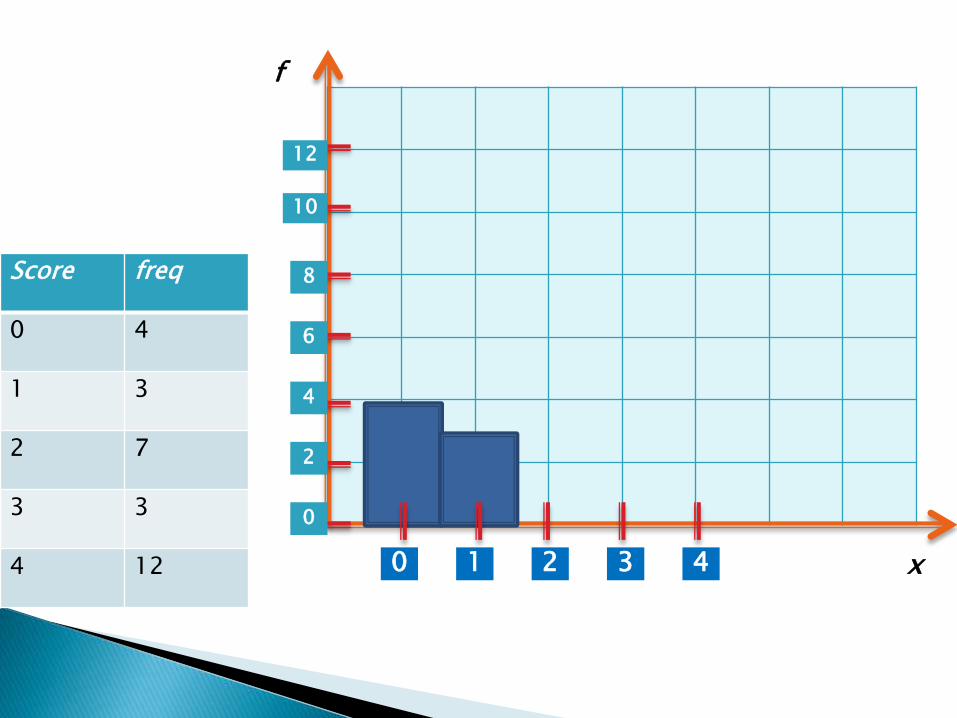
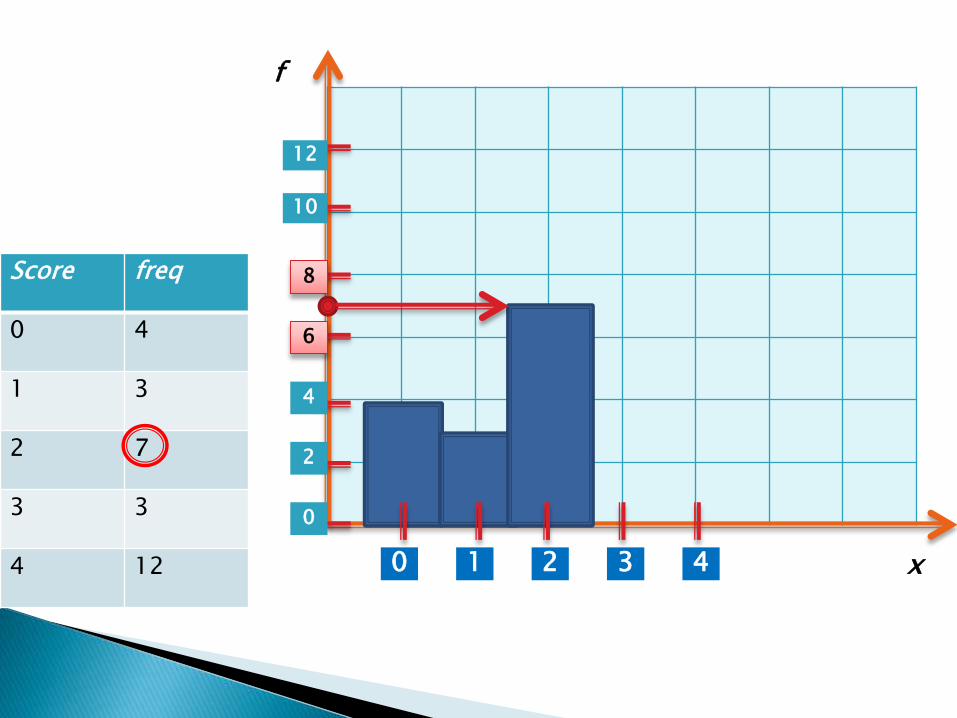
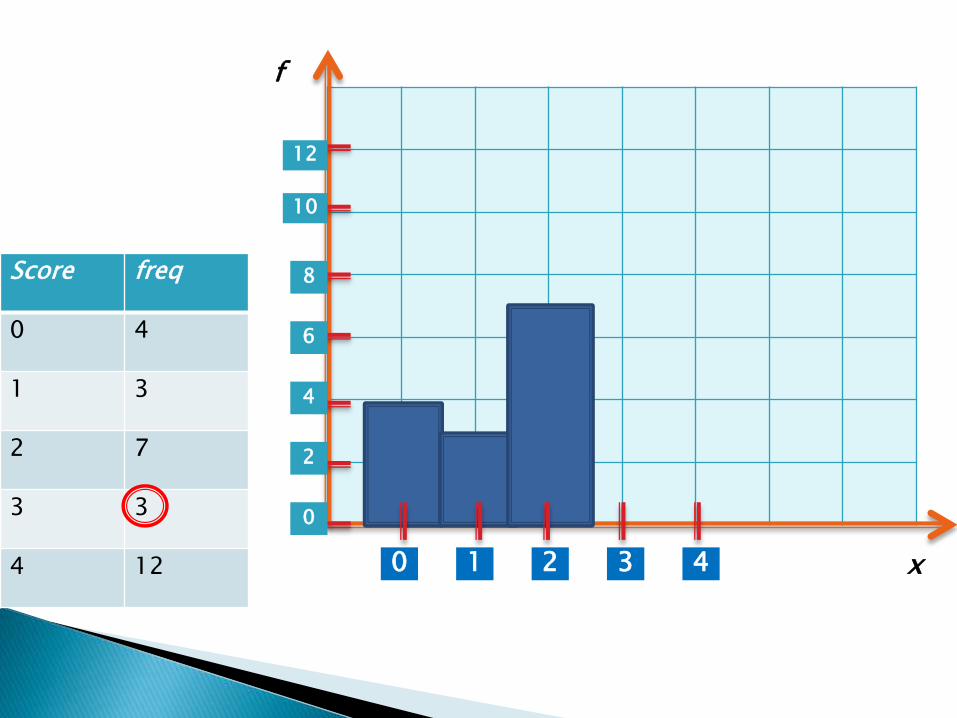
Now start plotting the Histogram
1 2 3 40
0
2
4
6
8
10
12
x
f
Score freq
0 4
1 3
2 7
3 3
4 12 1 2 3 40
0
2
4
6
8
10
12
x
f
Score freq
0 4
1 3
2 7
3 3
4 12 1 2 3 40
0
2
4
6
8
10
12
x
f
Score freq
0 4
1 3
2 7
3 3
4 12
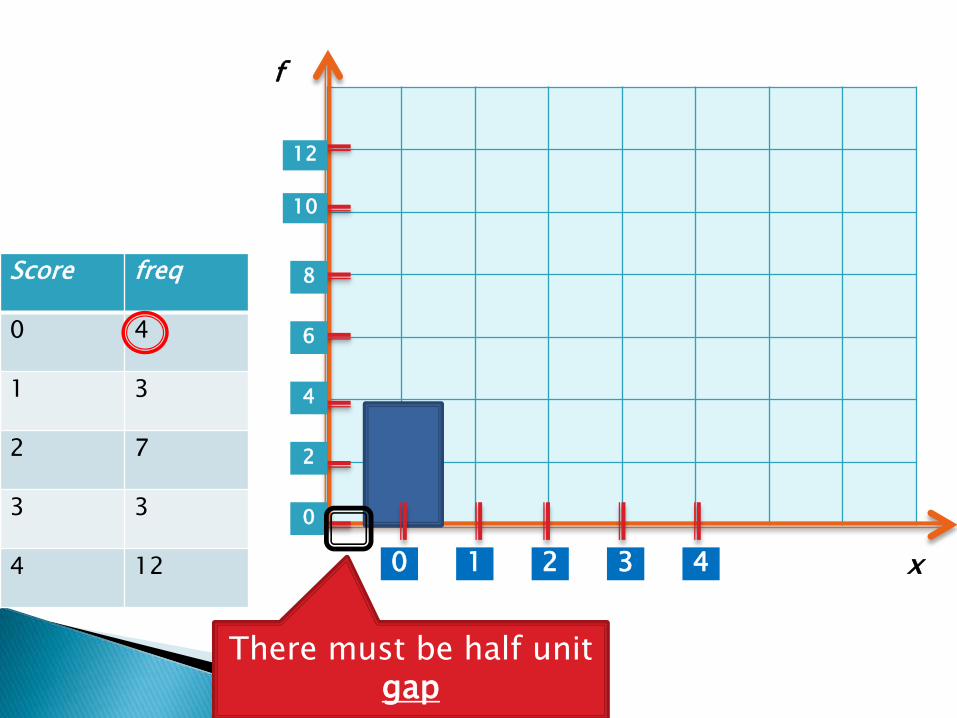
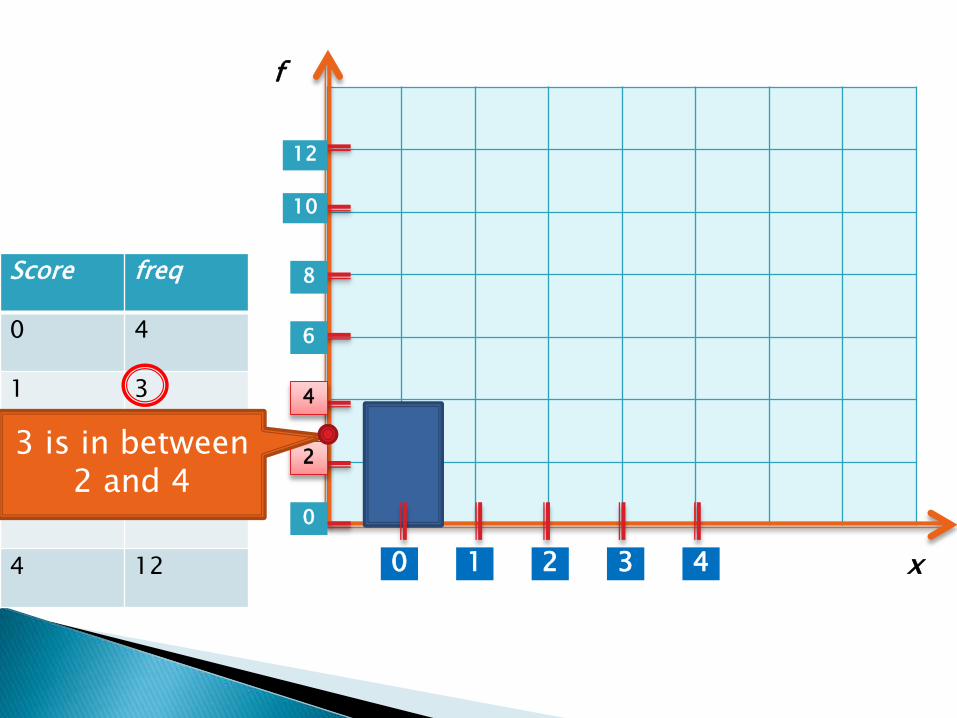
There must be half unit gap
1 2 3 40
0
2
4
6
8
10
12
x
f
Score freq
0 4
1 3
2 7
3 3
4 12 1 2 3 40
0
2
4
6
8
10
12
x
f
Score freq
0 4
1 3
2 7
3 3
4 12 1 2 3 40
0
2
4
6
8
10
12
x
f
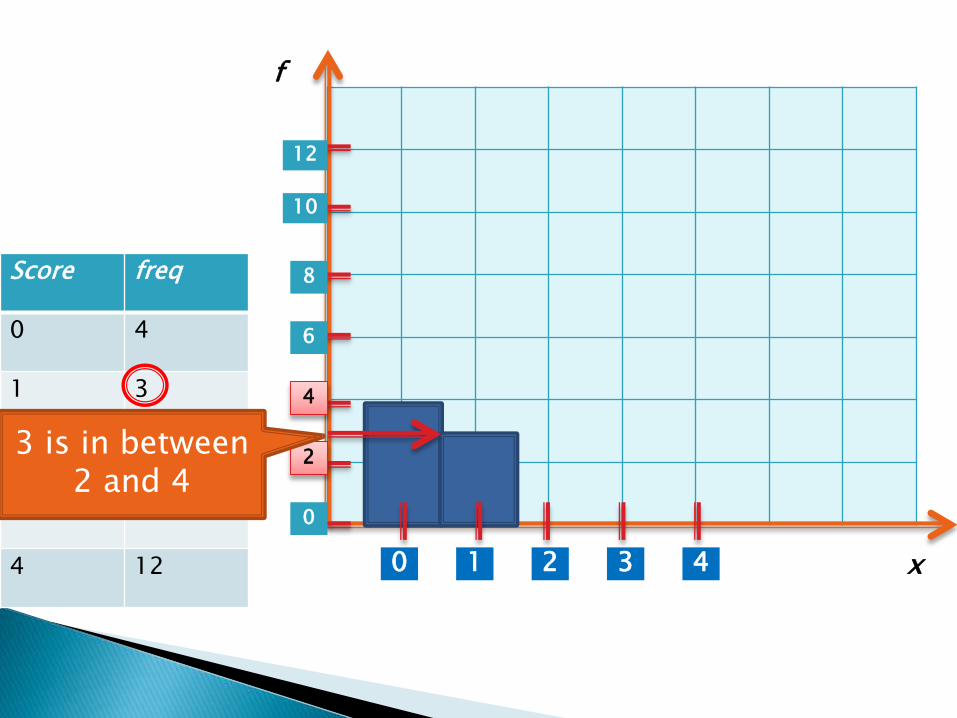
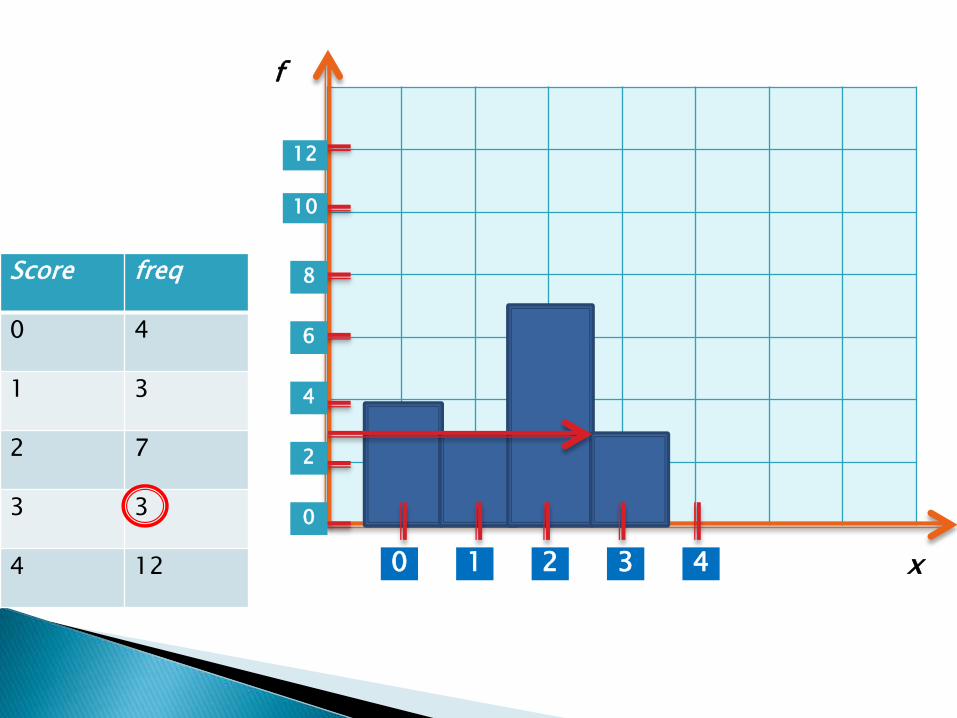
3 is in between 2 and 4
Score freq
0 4
1 3
2 7
3 3
4 12 1 2 3 40
0
2
4
6
8
10
12
x
f
3 is in between 2 and 4
Score freq
0 4
1 3
2 7
3 3
4 12 1 2 3 40
0
2
4
6
8
10
12
x
f

Score freq
0 4
1 3
2 7
3 3
4 12 1 2 3 40
0
2
4
6
8
10
12
x
f
Score freq
0 4
1 3
2 7
3 3
4 12 1 2 3 40
0
2
4
6
8
10
12
x
f
Score freq
0 4
1 3
2 7
3 3
4 12 1 2 3 40
0
2
4
6
8
10
12
x
f
Score freq
0 4
1 3
2 7
3 3
4 12 1 2 3 40
0
2
4
6
8
10
12
x
f
Score freq
0 4
1 3
2 7
3 3
4 12 1 2 3 40
0
2
4
6
8
10
12
x
f
Score freq
0 4
1 3
2 7
3 3
4 12 1 2 3 40
0
2
4
6
8
10
12
x
f
Score freq
0 4
1 3
2 7
3 3
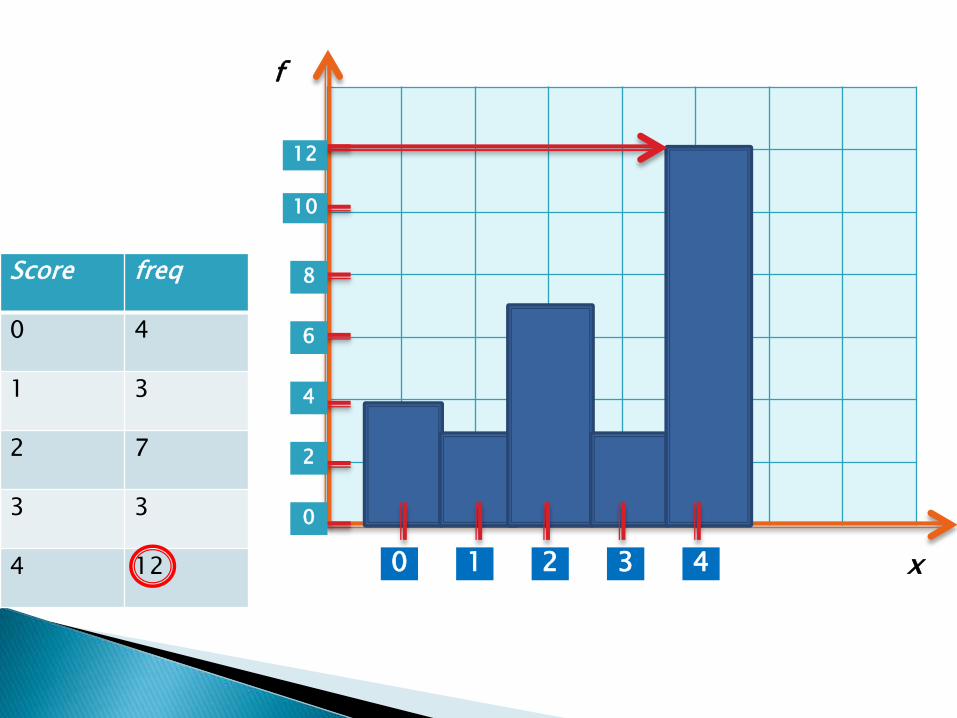
4 12
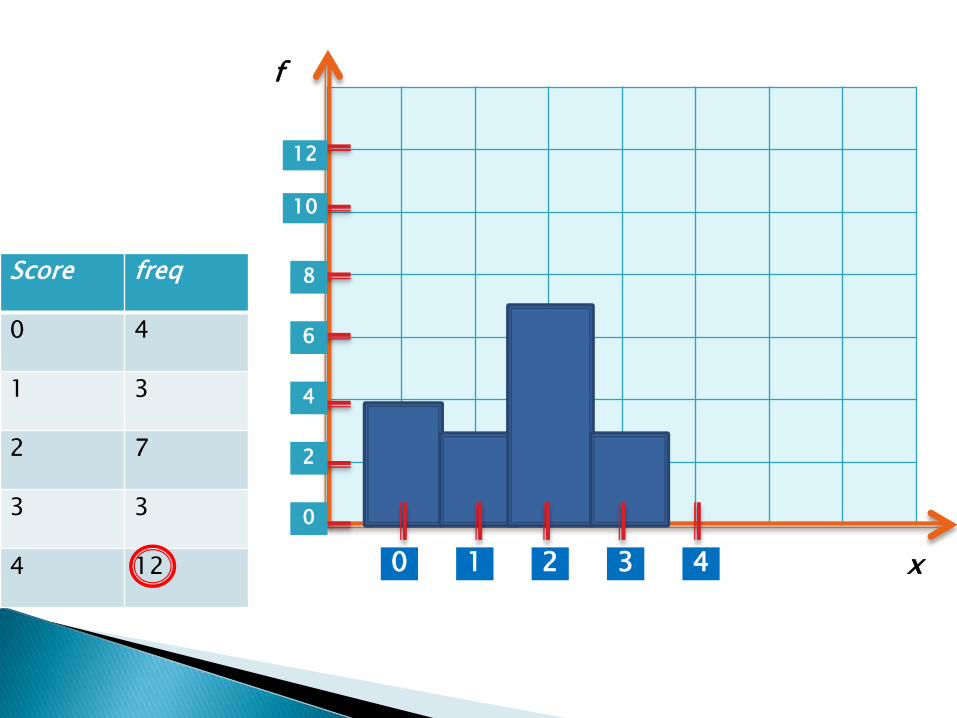
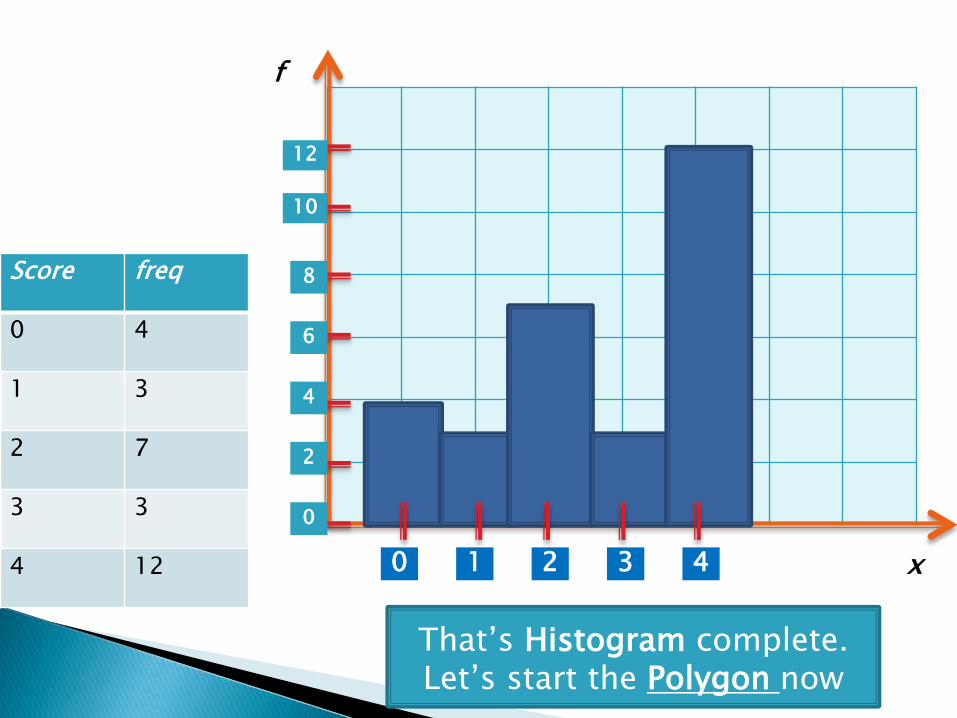
That’s Histogram complete. Let’s start the Polygon now
1 2 3 40
0
2
4
6
8
10
12
x
f

Score freq
0 4
1 3
2 7
3 3
4 12 1 2 3 40
0
2
4
6
8
10
12
x
f
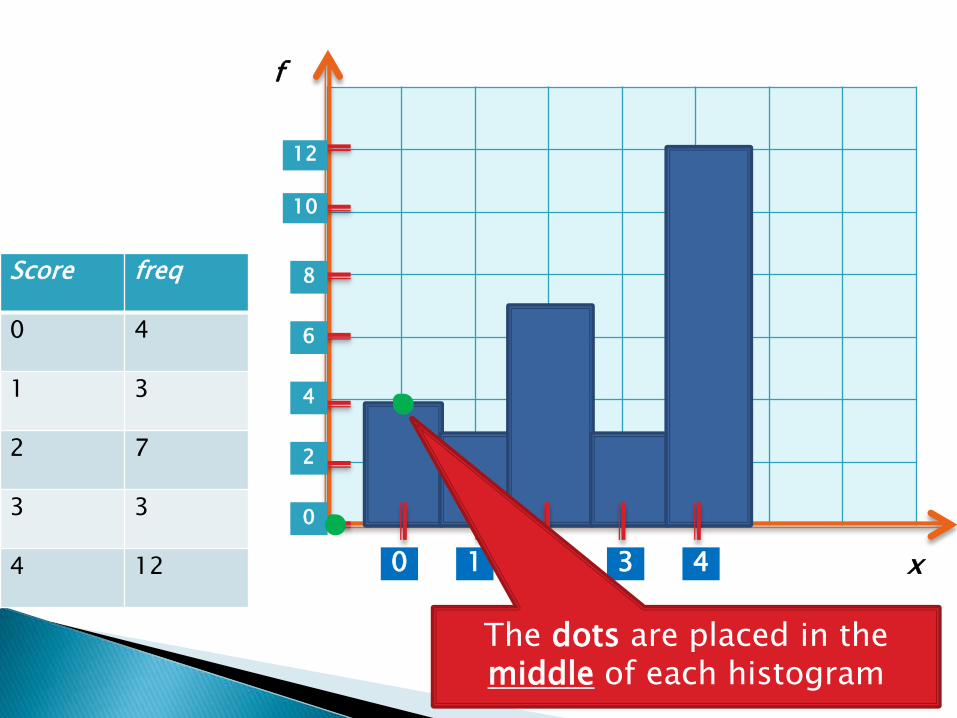
Start by plotting a dot in the corner
Score freq
0 4
1 3
2 7
3 3
4 12 1 2 3 40
0
2
4
6
8
10
12
x
f
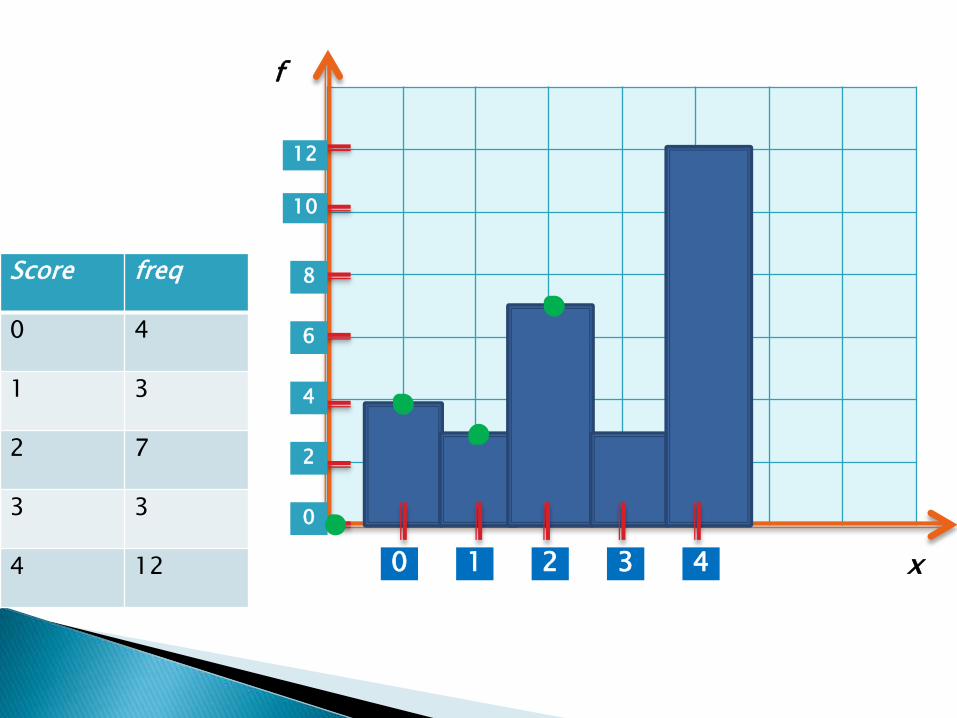
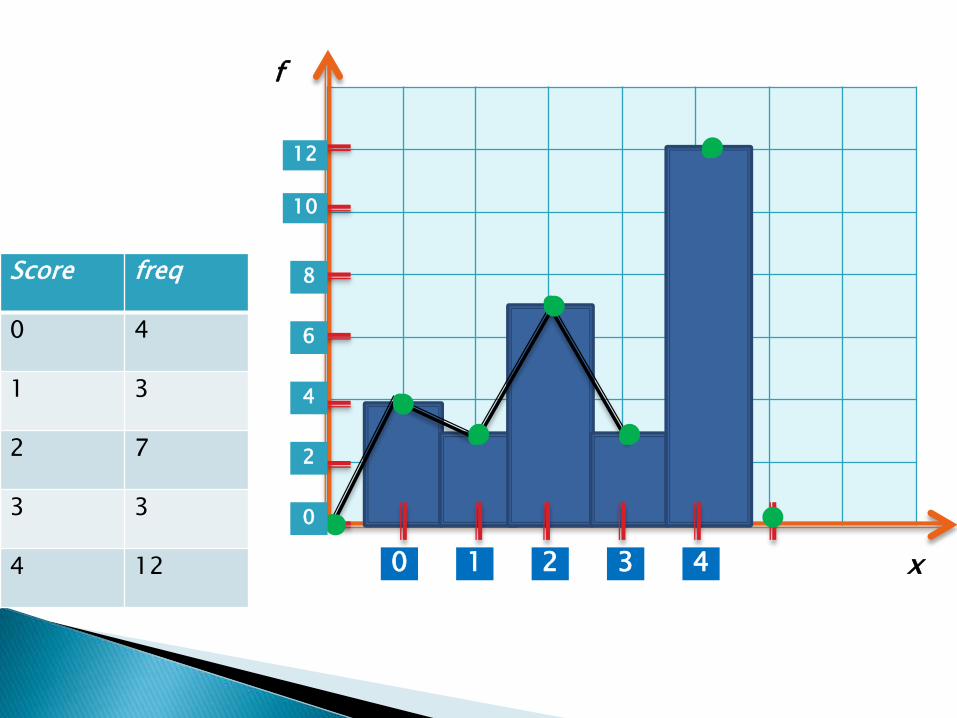
The dots are placed in the middle of each histogram

Score freq
0 4
1 3
2 7
3 3
4 12 1 2 3 40
0
2
4
6
8
10
12
x
f
Score freq
0 4
1 3
2 7
3 3
4 12 1 2 3 40
0
2
4
6
8
10
12
x
f

Score freq
0 4
1 3
2 7
3 3
4 12 1 2 3 40
0
2
4
6
8
10
12
x
f

Score freq
0 4
1 3
2 7
3 3
4 12 1 2 3 40
0
2
4
6
8
10
12
x
f
Score freq
0 4
1 3
2 7
3 3
4 12 1 2 3 40
0
2
4
6
8
10
12
x
f
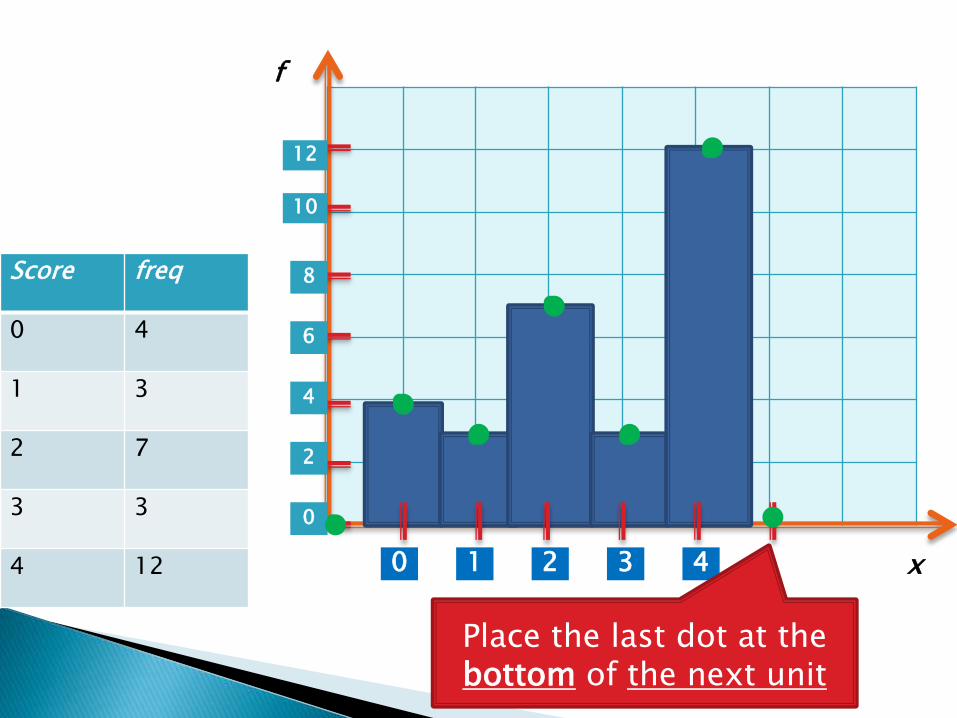
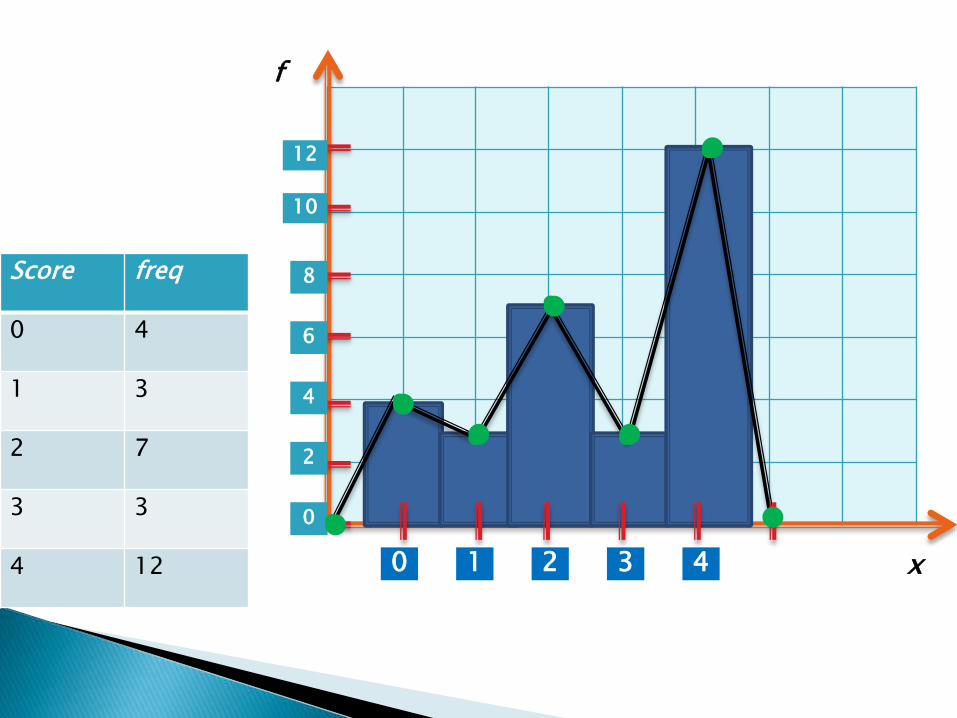
Place the last dot at the bottom of the next unit
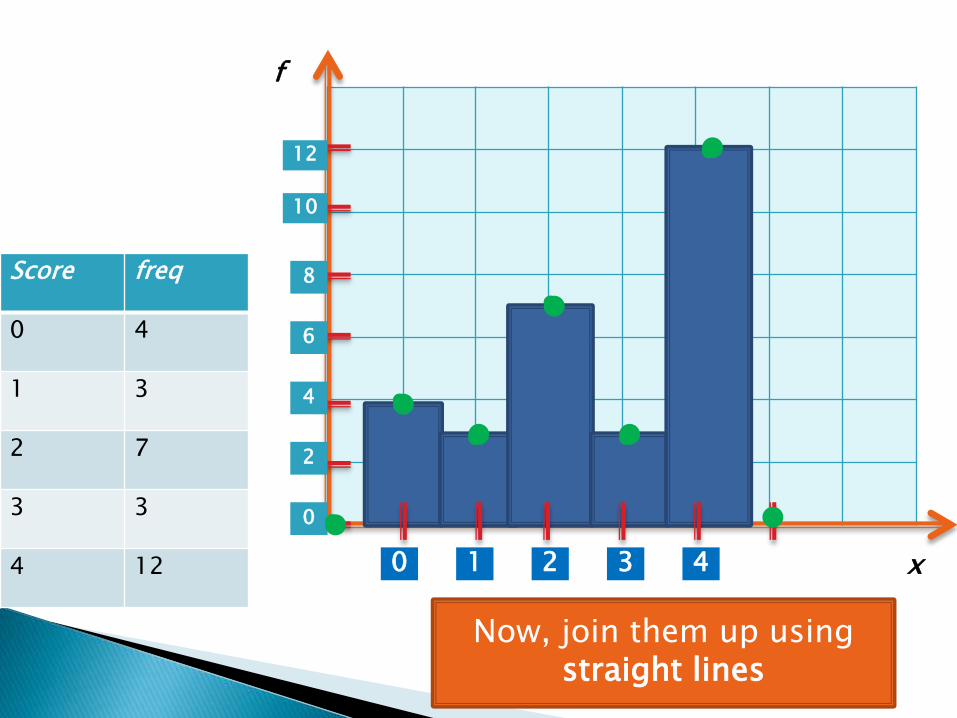
Score freq
0 4
1 3
2 7
3 3
4 12
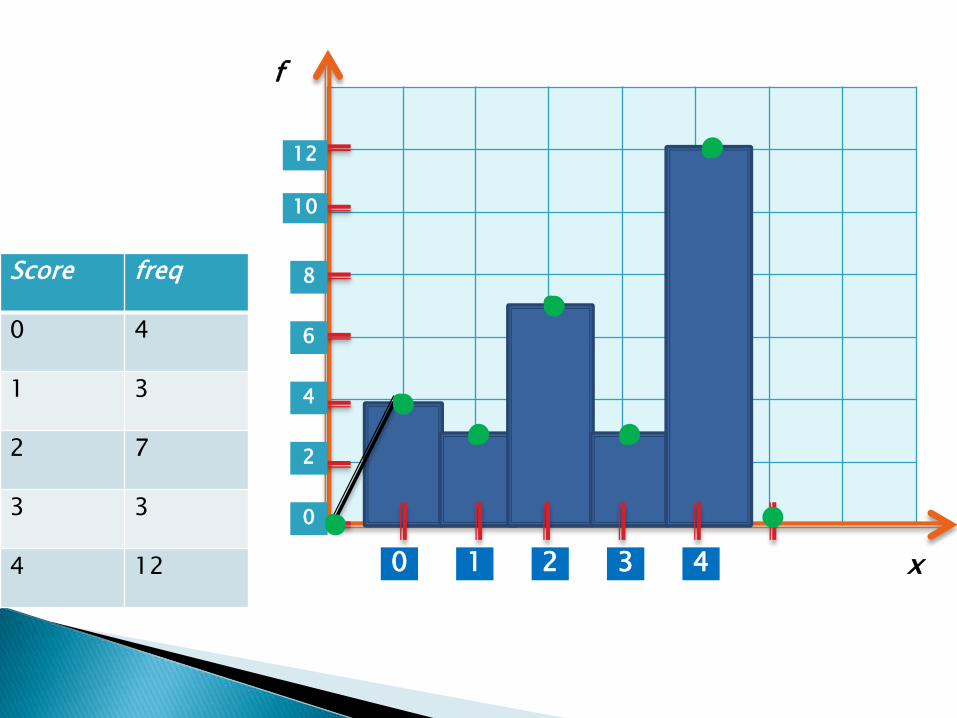
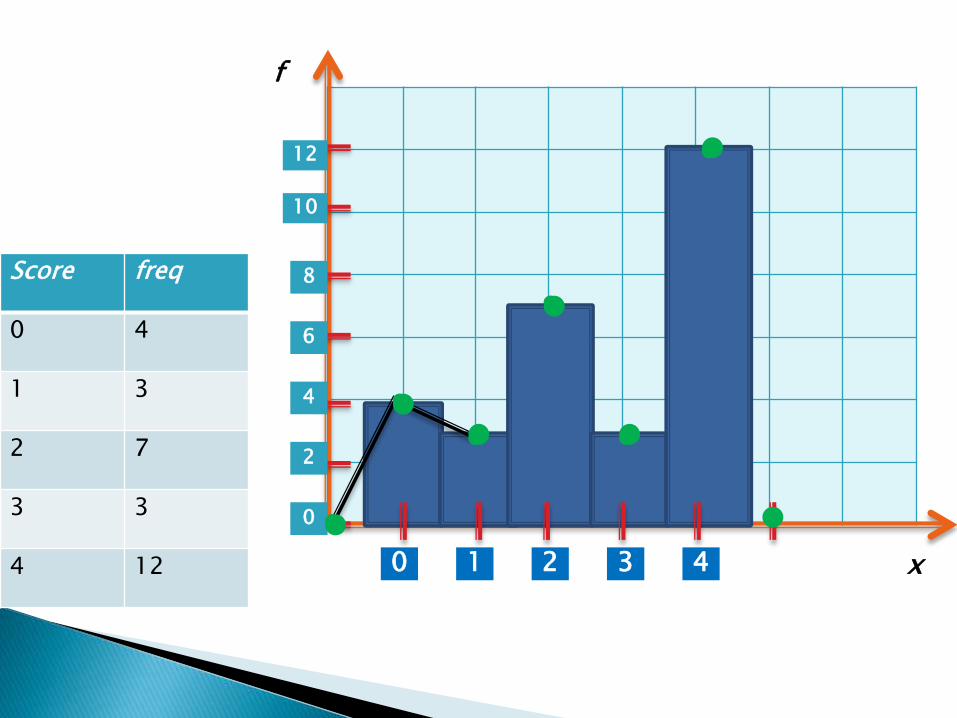
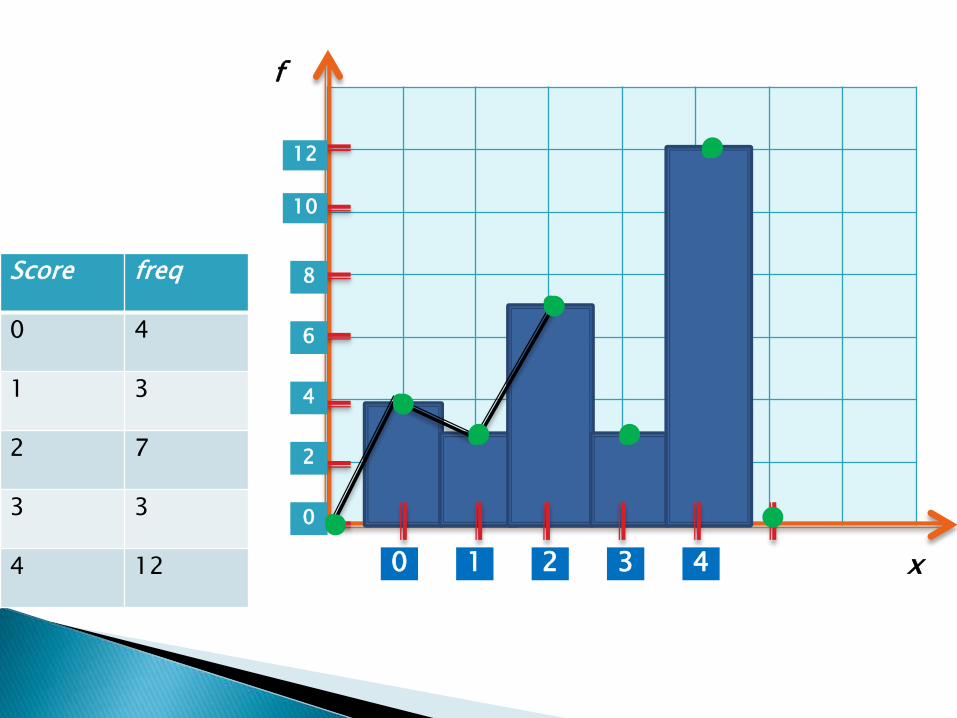
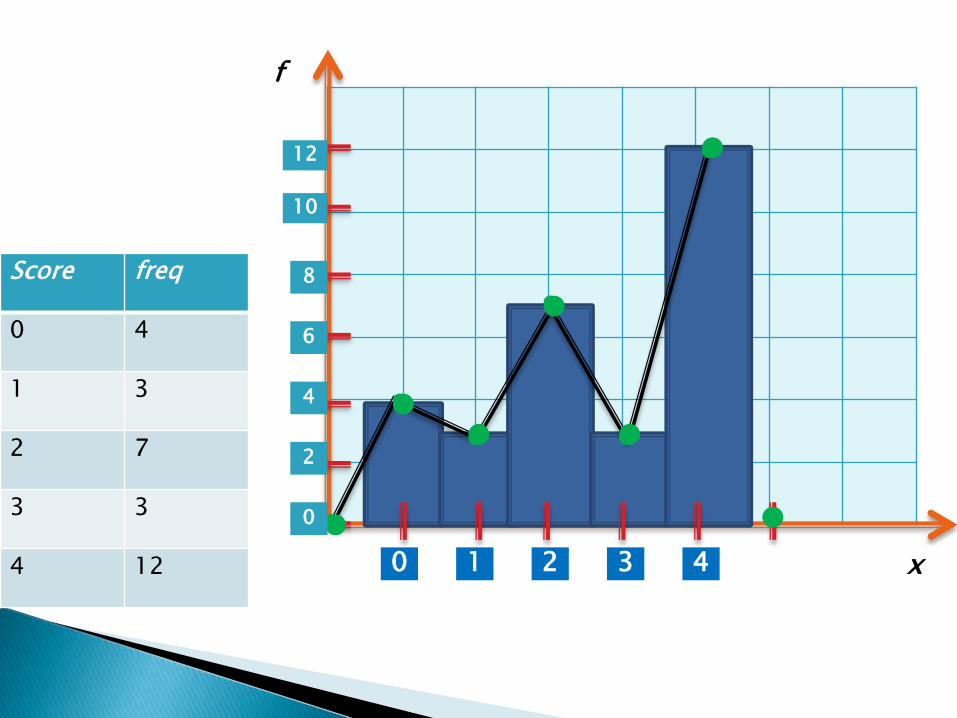
Now, join them up using straight lines
1 2 3 40
0
2
4
6
8
10
12
x
f
Score freq
0 4
1 3
2 7
3 3
4 12 1 2 3 40
0
2
4
6
8
10
12
x
f
Score freq
0 4
1 3
2 7
3 3
4 12 1 2 3 40
0
2
4
6
8
10
12
x
f
Score freq
0 4
1 3
2 7
3 3
4 12 1 2 3 40
0
2
4
6
8
10
12
x
f
Score freq
0 4
1 3
2 7
3 3
4 12 1 2 3 40
0
2
4
6
8
10
12
x
f
Score freq
0 4
1 3
2 7
3 3
4 12 1 2 3 40
0
2
4
6
8
10
12
x
f
Score freq
0 4
1 3
2 7
3 3
4 12 1 2 3 40
0
2
4
6
8
10
12
x
f
Score freq
0 4
1 3
2 7
3 3
4 12 1 2 3 40
0
2
4
6
8
10
12
x
f
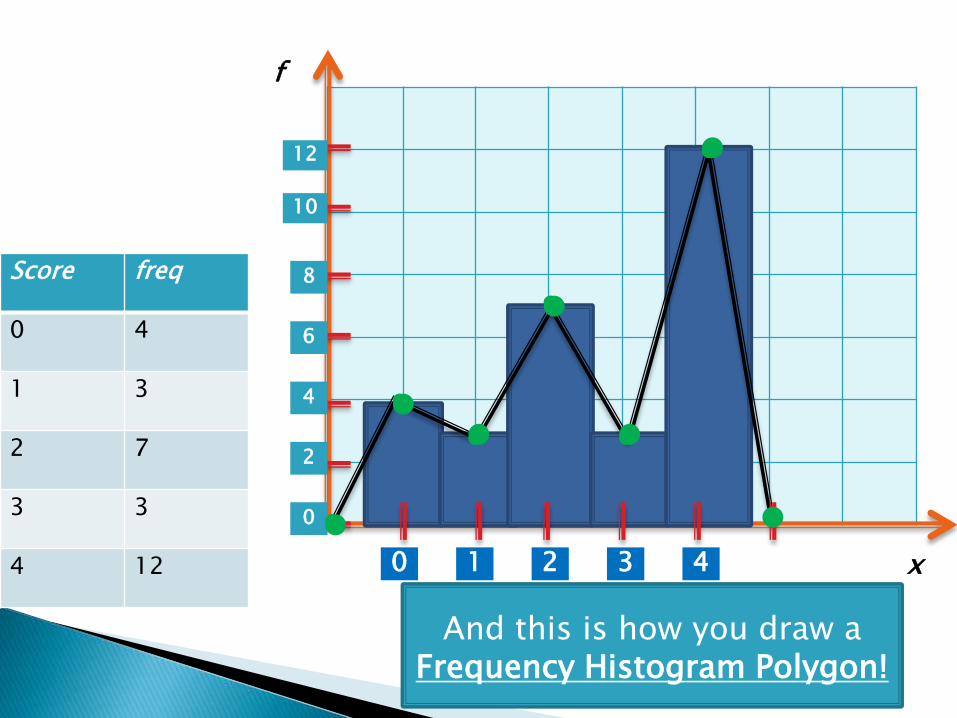
And this is how you draw a Frequency Histogram Polygon!