Embed Size (px)
Citation preview
Building Blocks of Sustainability in Marine Fisheries
Stakeholders, objectives, and strategies
Dorothy J. Dankel

Introduction
Why should we be concerned about fisheries?

Why be concerned about fisheries?
FAO SOFIA 2008

“The alarming trends in the world’s fisheries demand a fundamental change in management and fishing practices.”
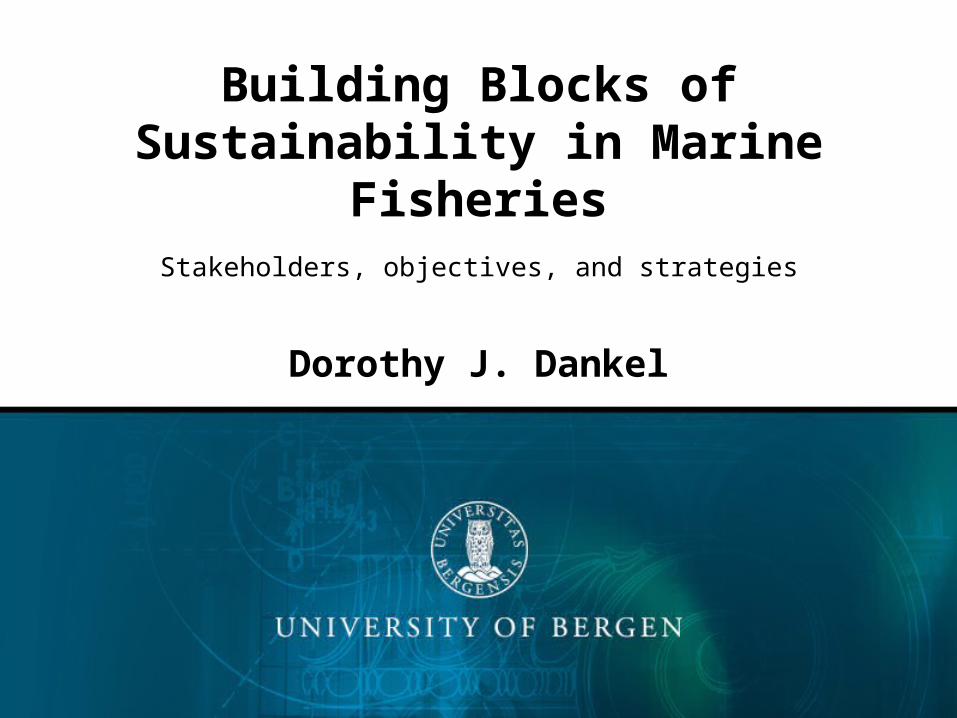
Describing the fisheries problem
“An integrated solution to the complexity of managing wild resources seems not to have been achieved.”

What is fisheries management?
• The quest for sustainable use of marine resources1. Objectives
Dialogue between stakeholders, managers & scientists
2. Strategies A plan how to realize objectives
3. Tactics Regulations (mesh size, min size, area
closures, etc)
“I believe that rocket scientists have it easy... The USA was able to put a man on the moon within a decade of setting that goal.
Achieving biological and economically sustainable fisheries has proven more elusive.”
Describing the fisheries problem
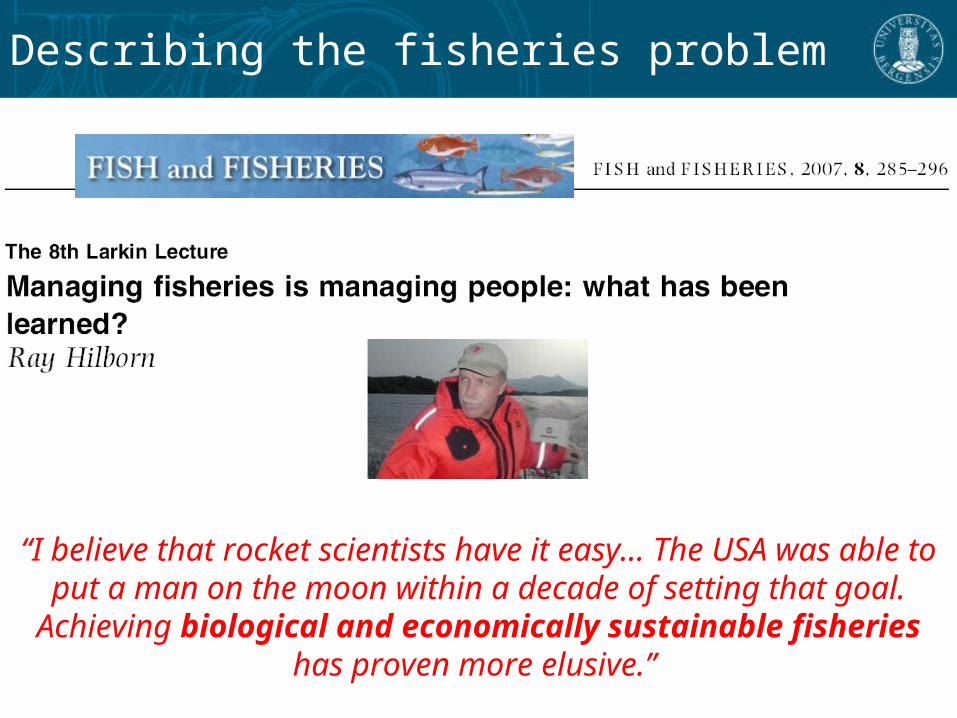
The fishery system Charles 2001
•Complexity & Diversity!•Human system is integral
Interdisciplinary science
Natural ecosystem
Human system
Management system
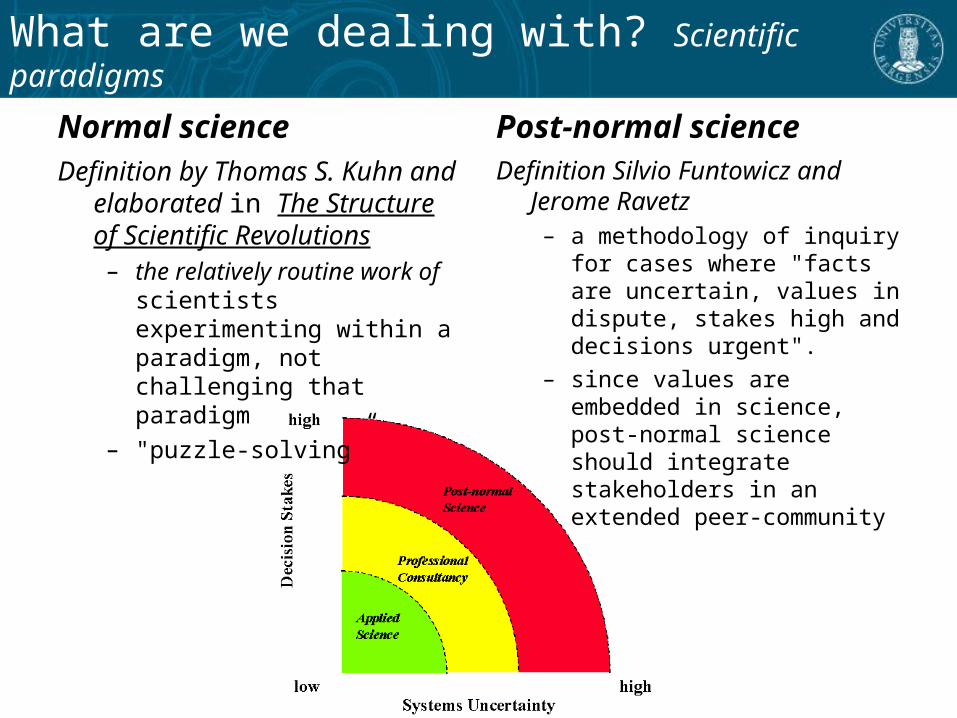
What are we dealing with? Scientific paradigms
Normal scienceDefinition by Thomas S. Kuhn
and elaborated in The Structure of Scientific Revolutions– the relatively routine work of
scientists experimenting within a paradigm, not challenging that paradigm
– "puzzle-solving”
Post-normal scienceDefinition Silvio Funtowicz and
Jerome Ravetz– a methodology of inquiry for
cases where "facts are uncertain, values in dispute, stakes high and decisions urgent".
– since values are embedded in science, post-normal science should integrate stakeholders in an extended peer-community
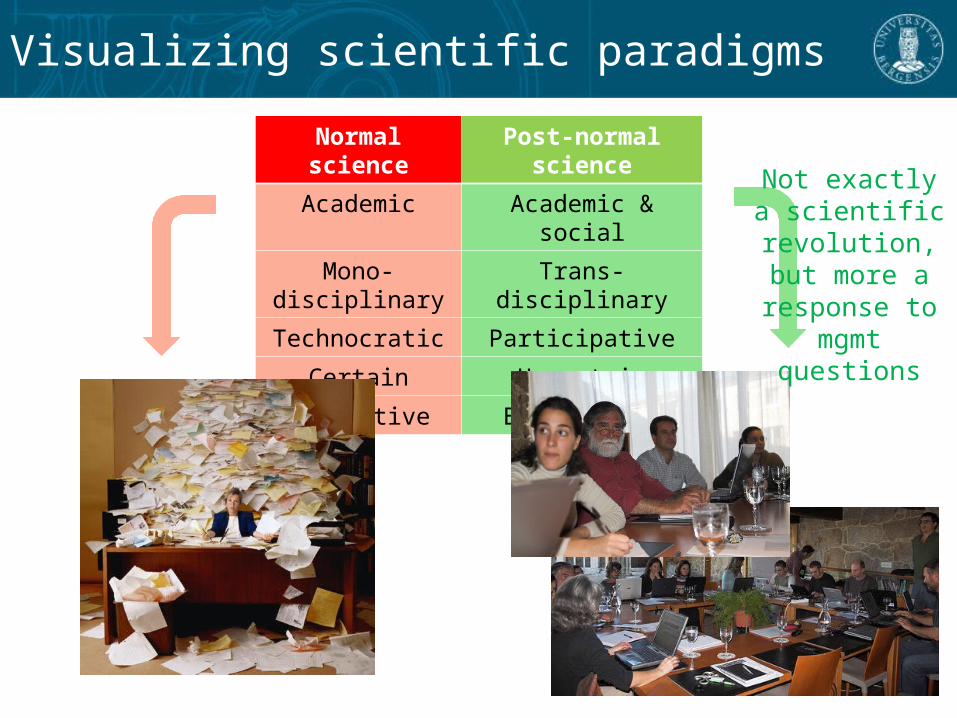
Normal science Post-normal science
Academic Academic & social
Mono-disciplinary Trans-disciplinary
Technocratic Participative
Certain Uncertain
Predictive Exploratory
Visualizing scientific paradigms
Not exactly a scientific
revolution, but more a
response to mgmt questions

• Fisheries provide food, jobs, money & heritage for society
• But, resource base is finite
Motivations for fisheries management
How can we manage for sustainability?
Why should we be concerned about fisheries?

Outline of presentation: Builiding blocks of fisheries sustainability
(I) Fisheries management in practice: review of 13 stocks
(II) Can we reconcile stakeholder conflicts?
(III) Generic properties of harvest rules
(IV) Can we increase haddock yield & save theby-catch for later?

EVALUATING CURRENT MANAGEMENT PRACTICES
Paper I

Evaluating fisheries management (I)
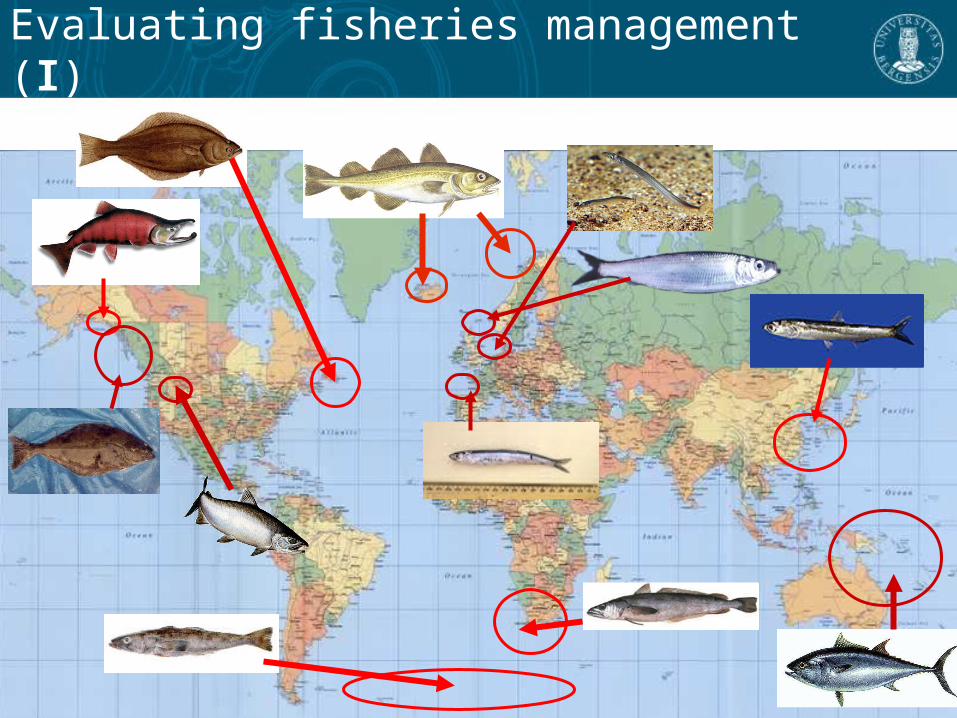
Evaluating fisheries management (I)
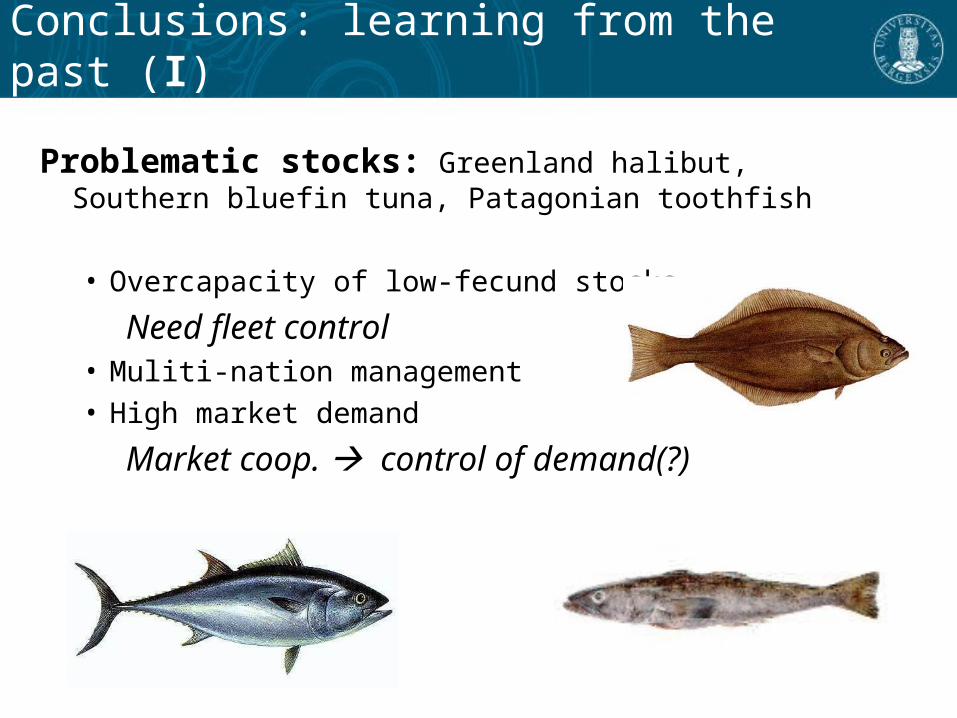
Conclusions: learning from the past (I)
Problematic stocks: Greenland halibut, Southern bluefin tuna, Patagonian toothfish
• Overcapacity of low-fecund stocks
Need fleet control• Muliti-nation management• High market demand
Market coop. control of demand(?)

Success stocks: Alaskan sockeye salmon, South African cape hakes, Pacific halibut
• Relative coastal isolation
• Fleet control (single nation management)
• Stakeholder involvement leading to consensus of a management strategy
Conclusions: learning from the past (I)
INTEGRATING STAKEHOLDER OBJECTIVES
Paper II
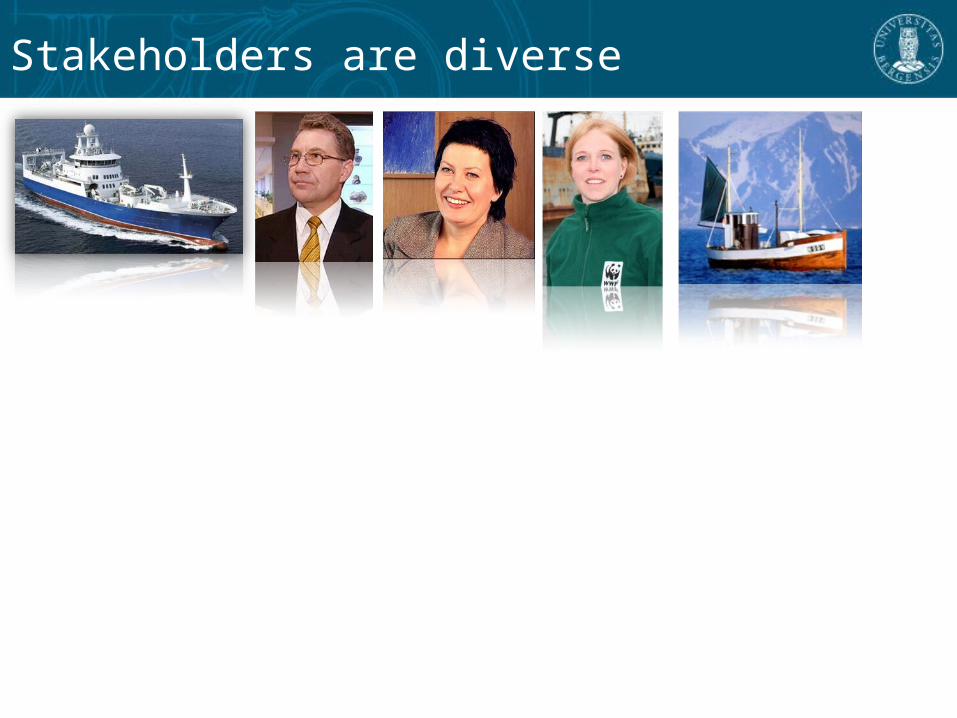
Stakeholders are diverse
YielYieldd
ProfitProfit Ecosystem Ecosystem EmploymentEmployment
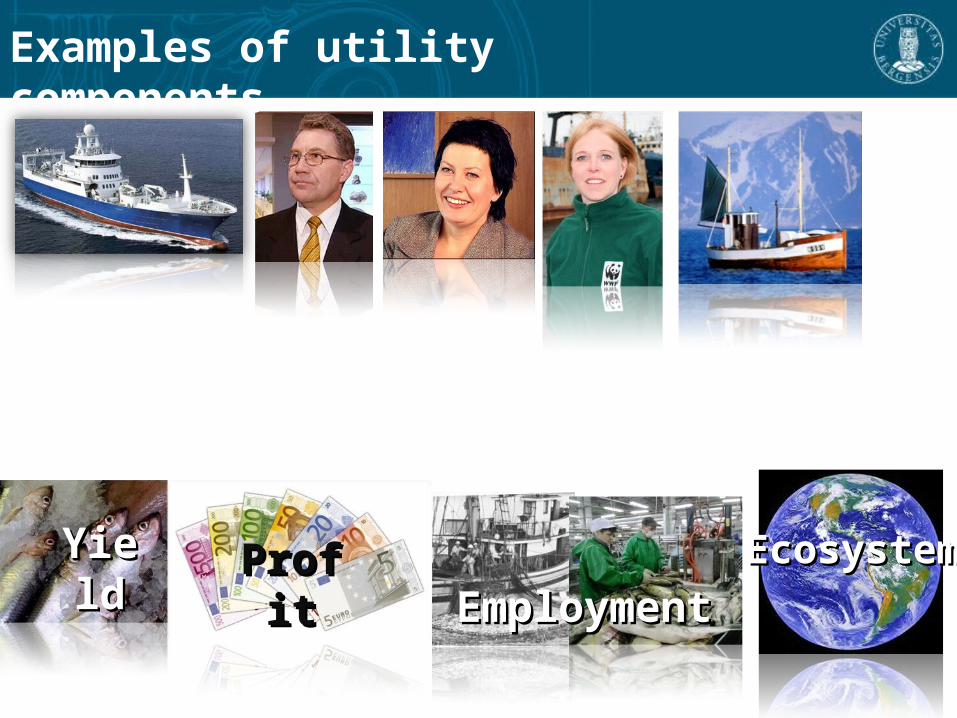
Examples of utility components

Stakeholders & diverse preferences
YieldYield ProfitProfit Ecosystem Ecosystem EmploymentEmployment
ecosystem preservation
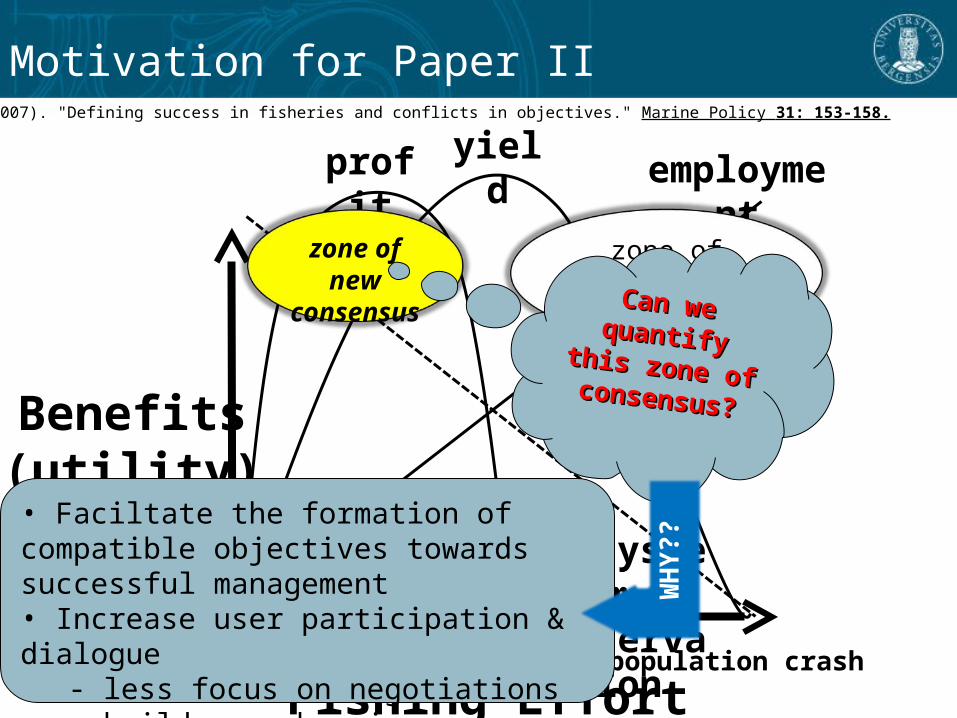
Fishing Effort
Benefits(utility)
employmentyieldprofit
zone of new consensus
zone of traditional fisheries
management
0 population crash
Motivation for Paper IIHilborn, R. (2007). "Defining success in fisheries and conflicts in objectives." Marine Policy 31: 153-158.
Can we Can we quantify this quantify this zone of zone of consensus?consensus?
• Faciltate the formation of compatible objectives towards successful management • Increase user participation & dialogue
- less focus on negotiations- build user buy-in
WHY?
?
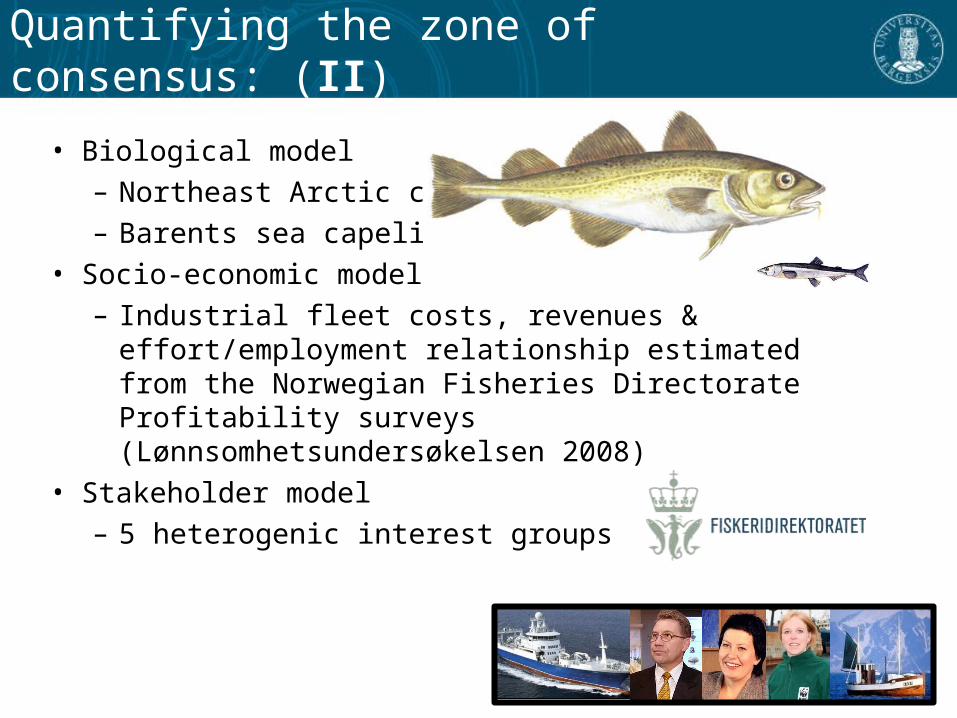
• Biological model– Northeast Arctic cod– Barents sea capelin
• Socio-economic model– Industrial fleet costs, revenues & effort/employment
relationship estimated from the Norwegian Fisheries Directorate Profitability surveys (Lønnsomhetsundersøkelsen 2008)
• Stakeholder model– 5 heterogenic interest groups
Quantifying the zone of consensus: (II)
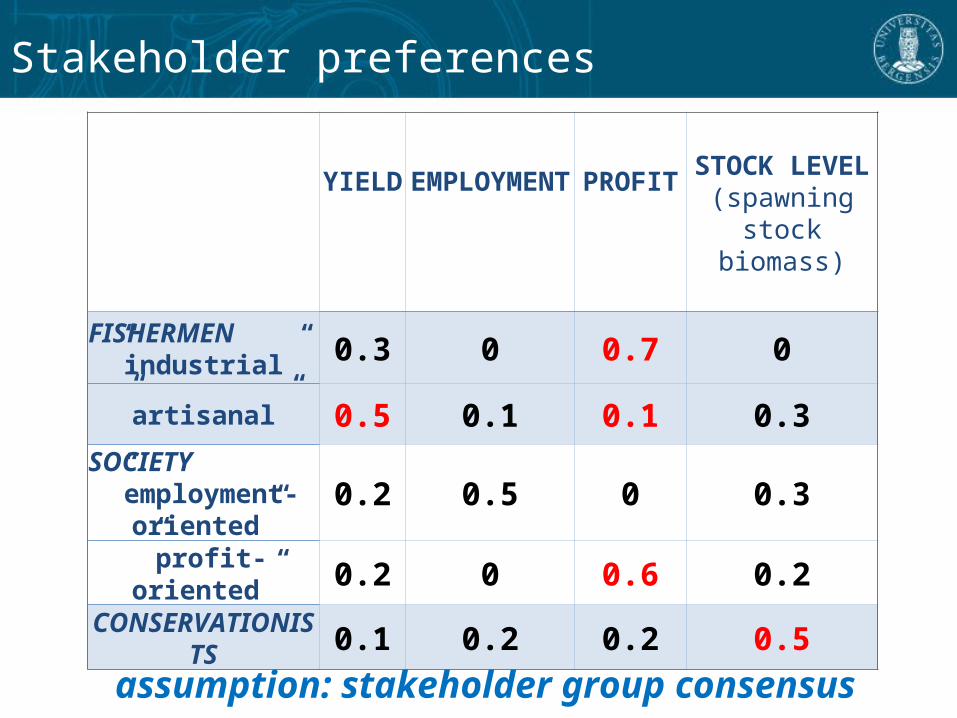
Stakeholder preferences
YIELD EMPLOYMENT PROFIT STOCK LEVEL(spawning stock
biomass)
FISHERMEN”industrial” 0.3 0 0.7 0
”artisanal” 0.5 0.1 0.1 0.3SOCIETY
”employment-oriented”
0.2 0.5 0 0.3
”profit-oriented” 0.2 0 0.6 0.2
CONSERVATIONISTS 0.1 0.2 0.2 0.5
assumption: stakeholder group consensus
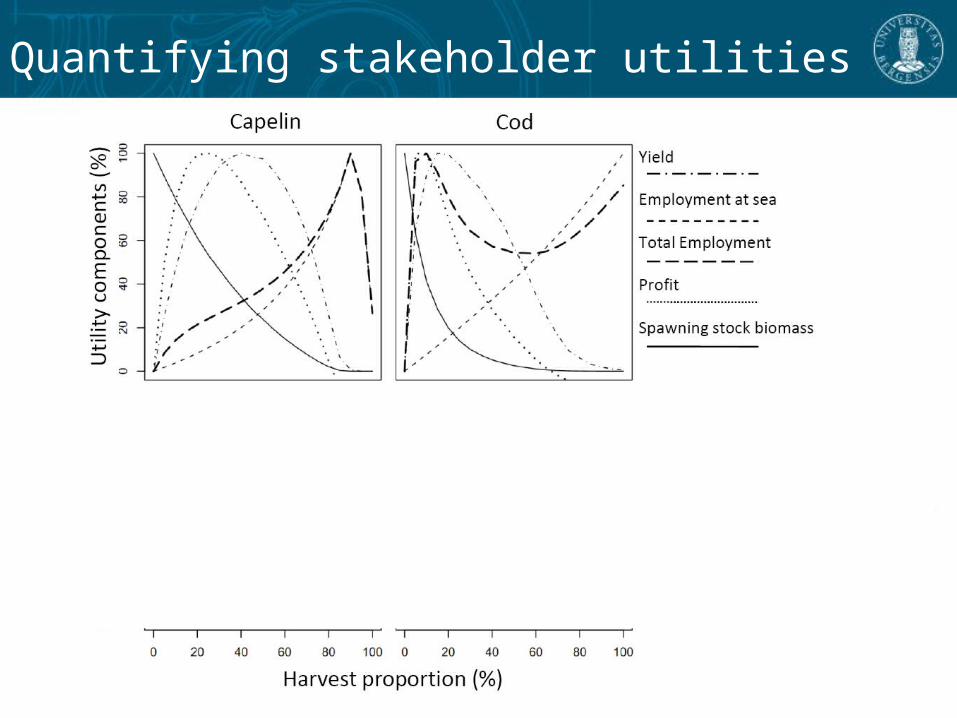
Quantifying stakeholder utilities

Quantifying the zone of consensus
Area of joint satisfaction
Most likely zone of consensus
Stakeholder A Stakeholder B
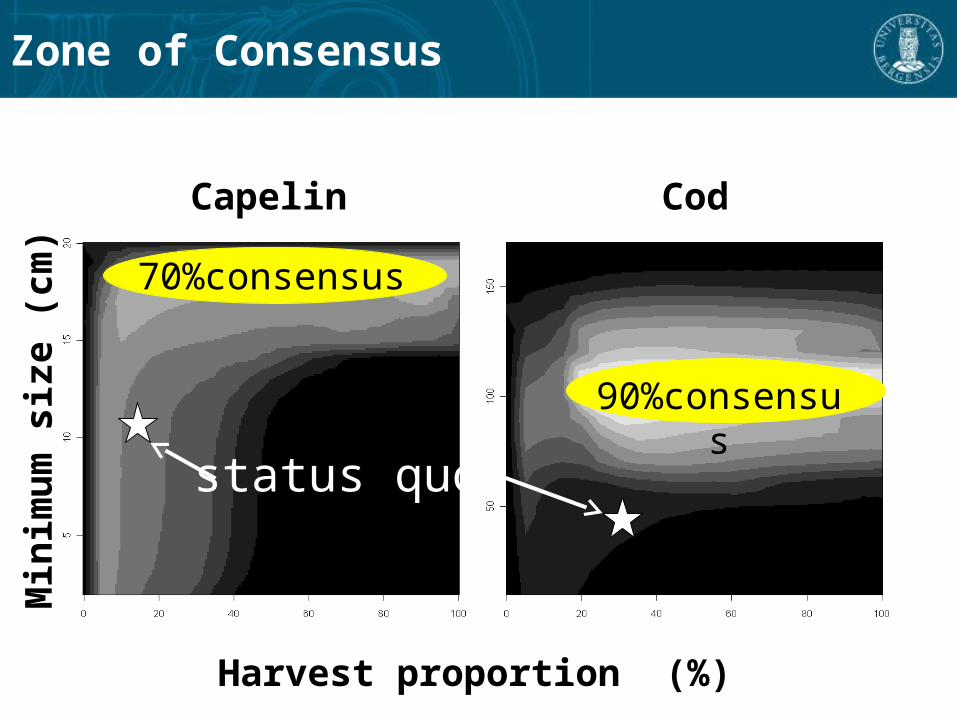
Harvest proportion (%)
Min
imum
siz
e (c
m)
status quo
Zone of Consensus
Capelin Cod
70%consensus
90%consensus

HARVEST RULES AS A TOOL TOWARDS A MANAGEMENT STRATEGY
Paper III
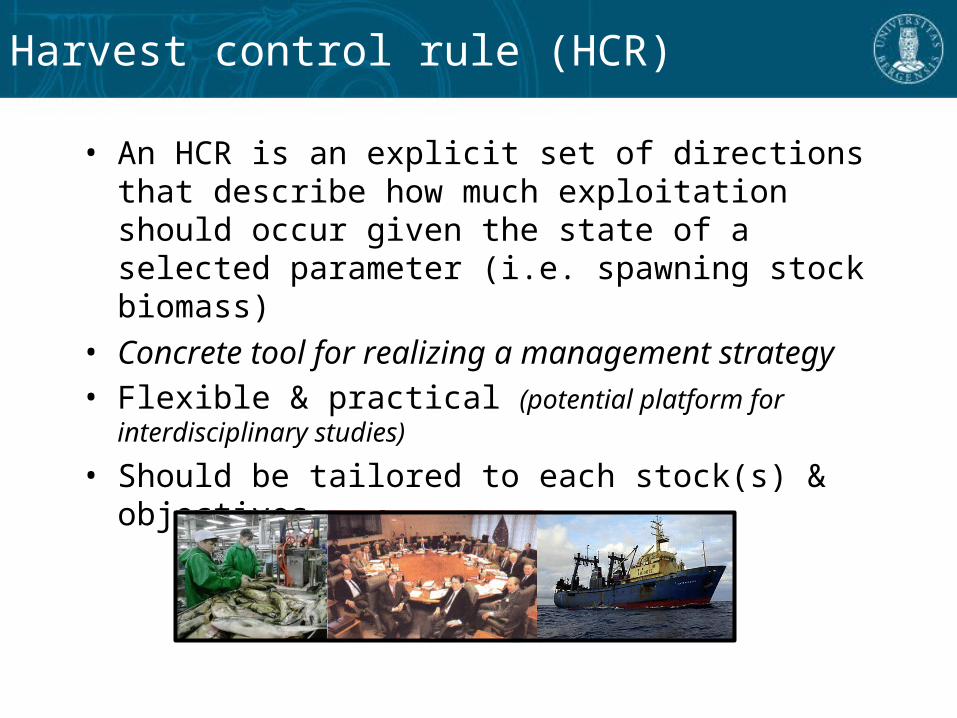
Harvest control rule (HCR)
• An HCR is an explicit set of directions that describe how much exploitation should occur given the state of a selected parameter (i.e. spawning stock biomass)
• Concrete tool for realizing a management strategy• Flexible & practical (potential platform for interdisciplinary
studies)• Should be tailored to each stock(s) & objectives
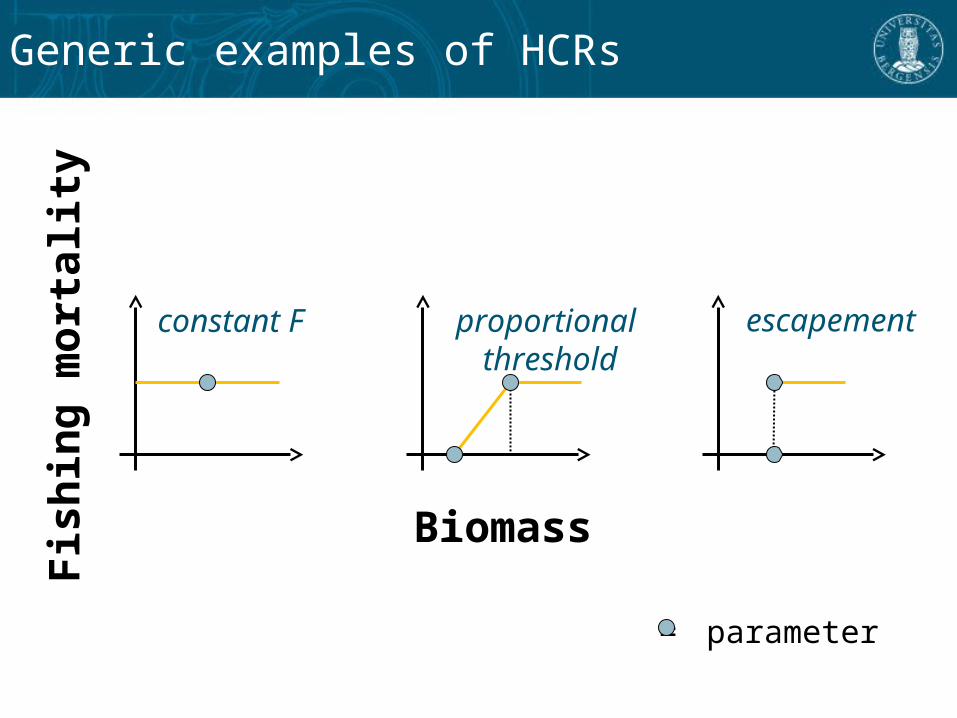
Generic examples of HCRs
BiomassFish
ing
mor
talit
y
constant F proportional threshold
escapement
= parameter
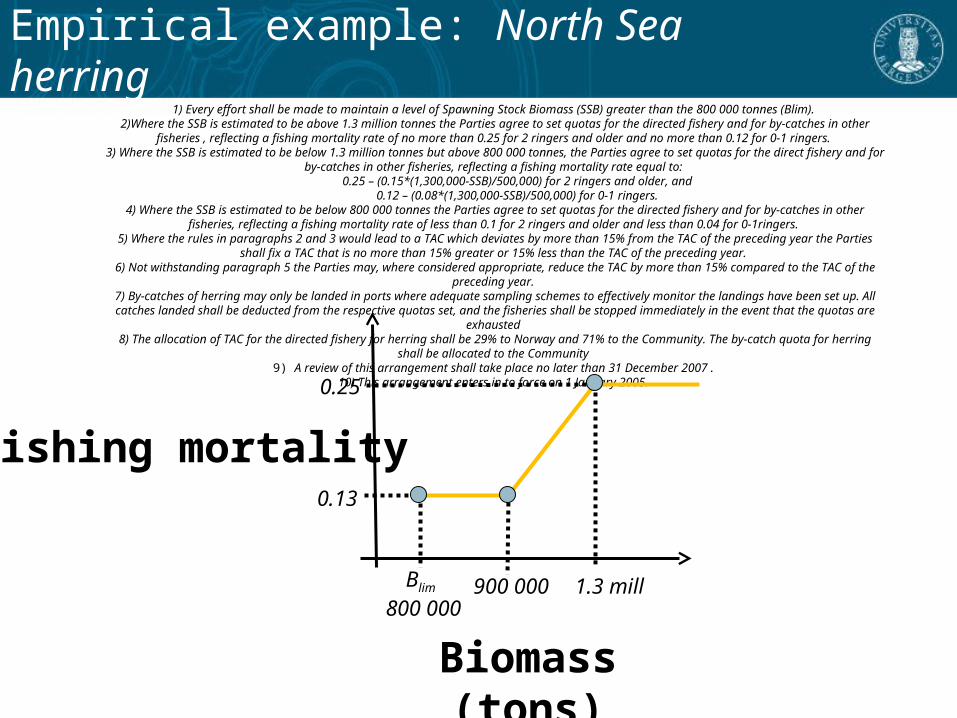
1) Every effort shall be made to maintain a level of Spawning Stock Biomass (SSB) greater than the 800 000 tonnes (Blim). 2)Where the SSB is estimated to be above 1.3 million tonnes the Parties agree to set quotas for the directed fishery and for by‐catches in other
fisheries , reflecting a fishing mortality rate of no more than 0.25 for 2 ringers and older and no more than 0.12 for 0‐1 ringers. 3) Where the SSB is estimated to be below 1.3 million tonnes but above 800 000 tonnes, the Parties agree to set quotas for the direct fishery and
for by‐catches in other fisheries, reflecting a fishing mortality rate equal to: 0.25 – (0.15*(1,300,000‐SSB)/500,000) for 2 ringers and older, and
0.12 – (0.08*(1,300,000‐SSB)/500,000) for 0‐1 ringers. 4) Where the SSB is estimated to be below 800 000 tonnes the Parties agree to set quotas for the directed fishery and for by‐catches in other
fisheries, reflecting a fishing mortality rate of less than 0.1 for 2 ringers and older and less than 0.04 for 0‐1ringers. 5) Where the rules in paragraphs 2 and 3 would lead to a TAC which deviates by more than 15% from the TAC of the preceding year the Parties
shall fix a TAC that is no more than 15% greater or 15% less than the TAC of the preceding year. 6) Not withstanding paragraph 5 the Parties may, where considered appropriate, reduce the TAC by more than 15% compared to the TAC of the
preceding year. 7) By‐catches of herring may only be landed in ports where adequate sampling schemes to effectively monitor the landings have been set up. All catches landed shall be deducted from the respective quotas set, and the fisheries shall be stopped immediately in the event that the quotas are
exhausted 8) The allocation of TAC for the directed fishery for herring shall be 29% to Norway and 71% to the Community. The by‐catch quota for herring
shall be allocated to the Community 9) A review of this arrangement shall take place no later than 31 December 2007 .
10) This arrangement enters in to force on 1 January 2005.
Empirical example: North Sea herring
Biomass (tons)
Fishing mortality
Blim 800 000
900 000 1.3 mill
0.25
0.13
Tips & tricks for HCRs
• If you can’t code it, it’s not good enough– HCRs need to be tested!– Should be ”fool-proof”, not flexible for
interpretations/negotiations over meanings• Example: the HCR should ensure that the TAC is
within sustainable levels in the long-term– The TAC in what year? When is the data
collected and when are the decisions made?– What are ”sustainable levels”?– What is the ”long-term”? 10 years? 50 years?
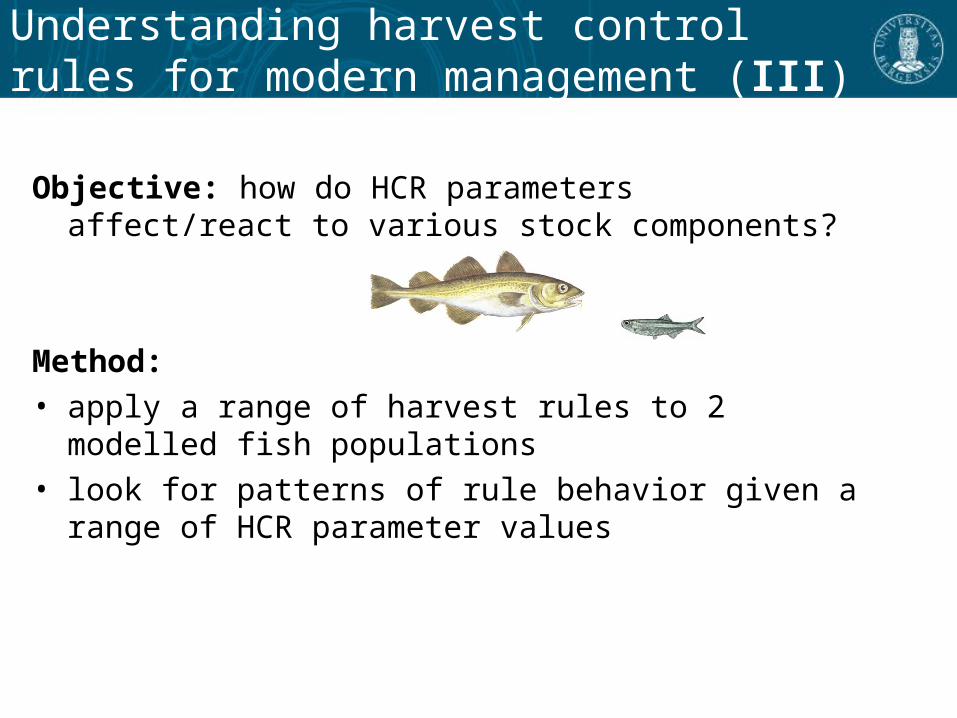
Understanding harvest control rules for modern management (III)
Objective: how do HCR parameters affect/react to various stock components?
Method: • apply a range of harvest rules to 2 modelled fish
populations• look for patterns of rule behavior given a range of HCR
parameter values
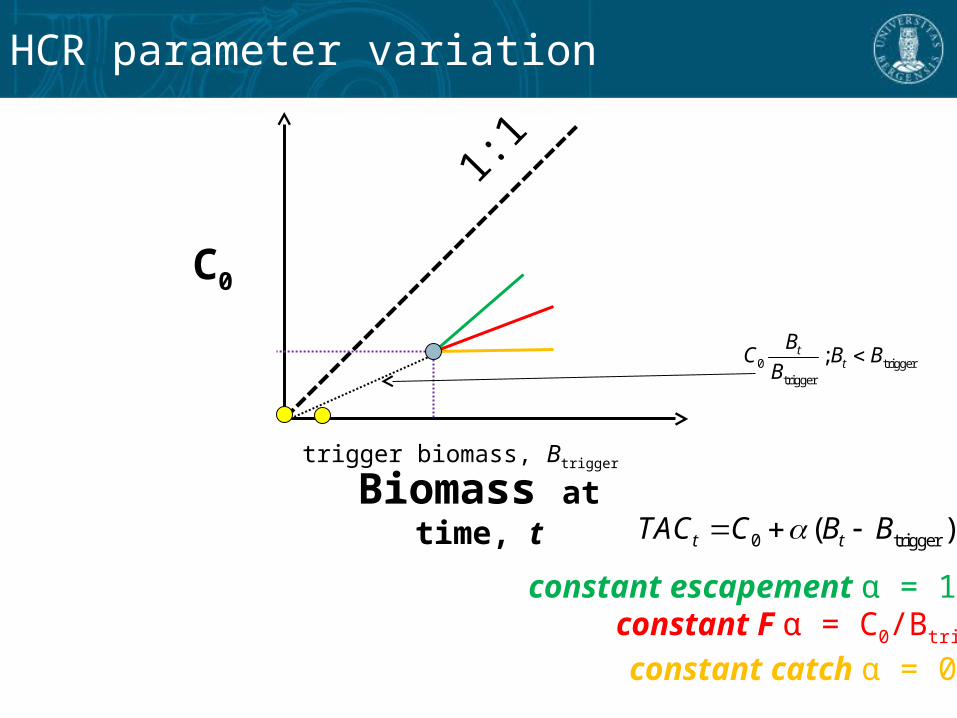
HCR parameter variation
Biomass at time, t
C0
1:1trigger biomass, Btrigger
0 trigger( )t tTAC C B B
constant catch α = 0constant F α = C0/Btrig
constant escapement α = 1
0 triggertrigger
;tt
BC B BB
NOTE: Very difficult to visualize 4 dimensionsOver from a scientific presenation to a stakeholder
presention
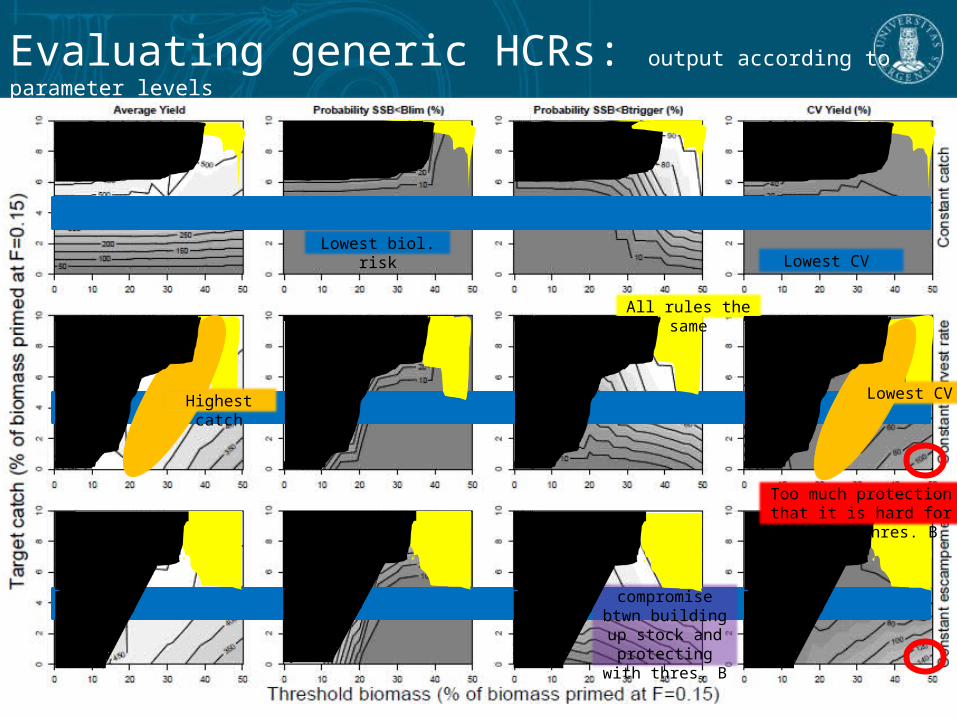
Evaluating generic HCRs: output according to parameter levels
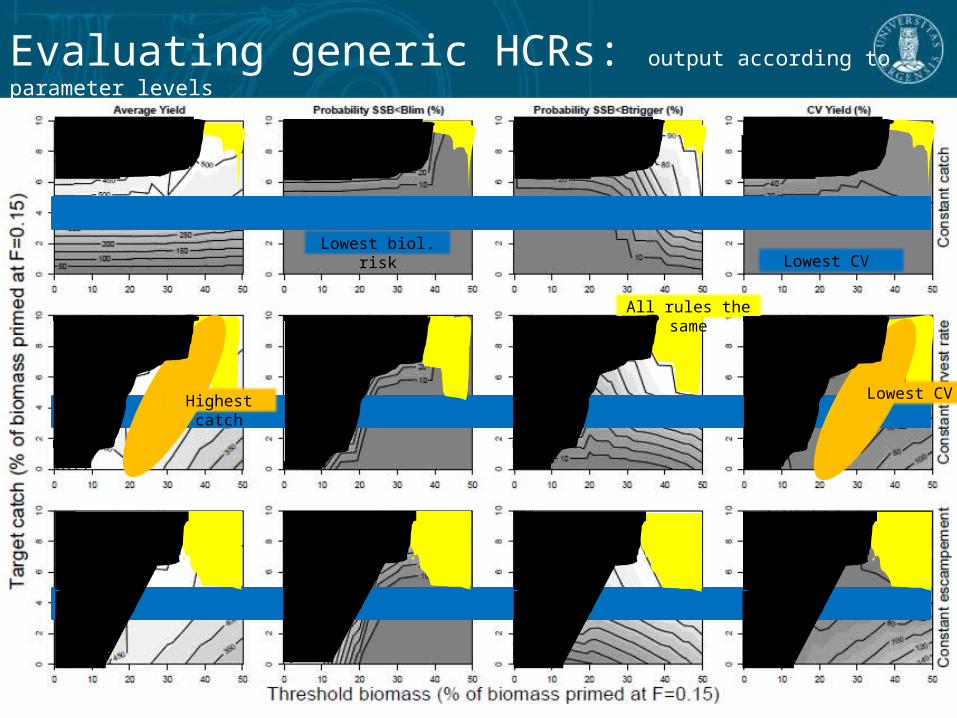
Evaluating generic HCRs: output according to parameter levels
Lowest CV Lowest biol. risk
All rules the same
Lowest CVHighest catch
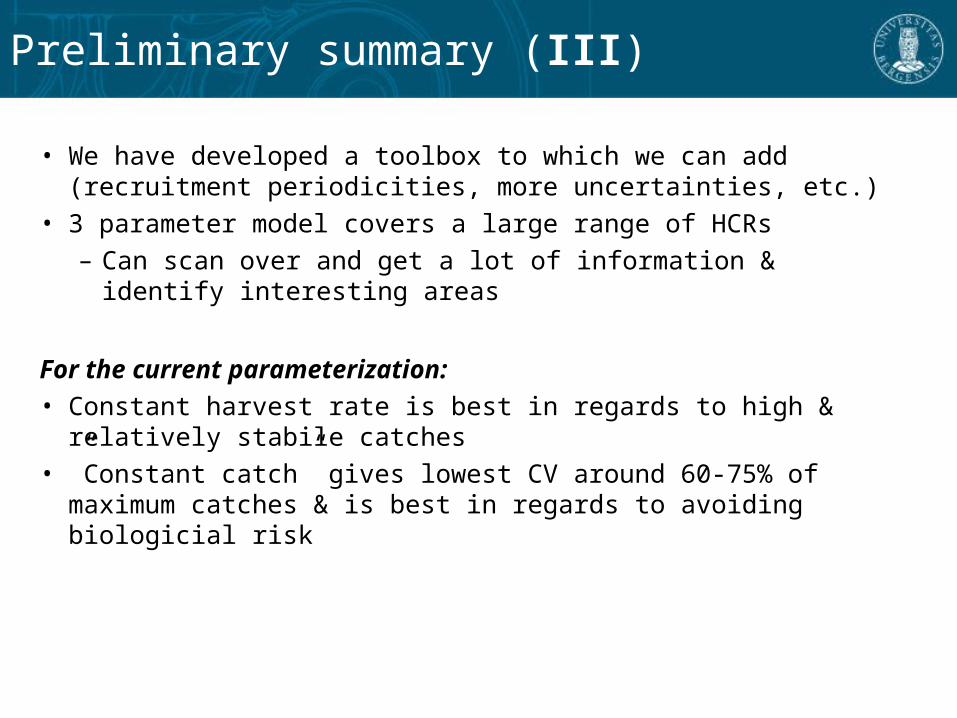
Preliminary summary (III)
• We have developed a toolbox to which we can add (recruitment periodicities, more uncertainties, etc.)
• 3 parameter model covers a large range of HCRs– Can scan over and get a lot of information & identify
interesting areas
For the current parameterization:• Constant harvest rate is best in regards to high & relatively
stabile catches• ”Constant catch” gives lowest CV around 60-75% of maximum
catches & is best in regards to avoiding biologicial risk
PUTTING IT TOGETHER: MAPPING OUT MANAGEMENT SCENARIOS FOR GEORGES BANK
Paper IV
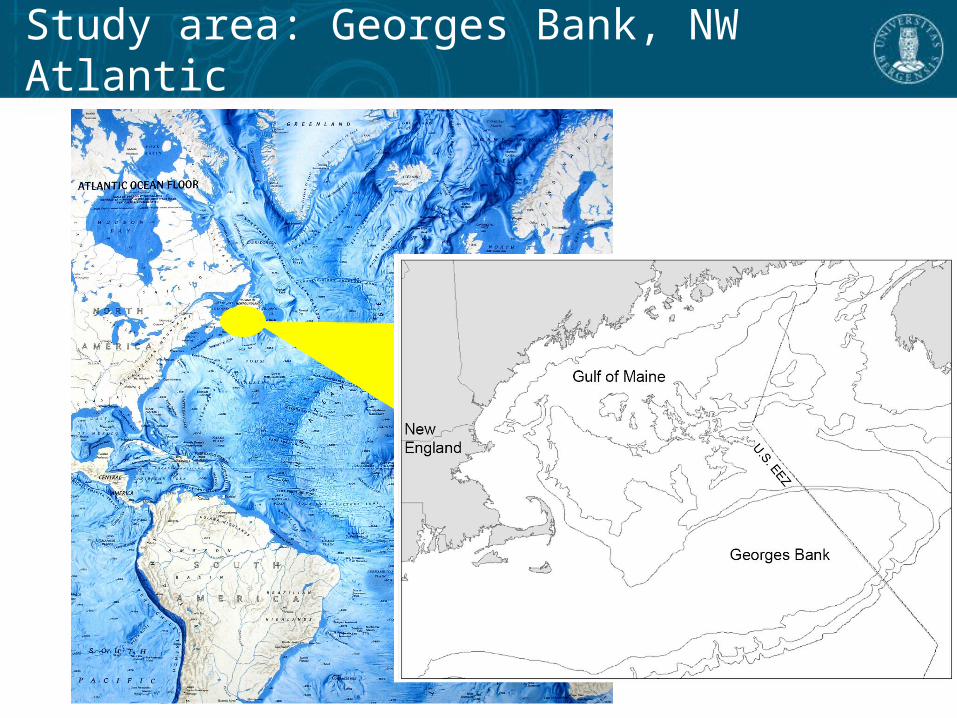
Study area: Georges Bank, NW Atlantic
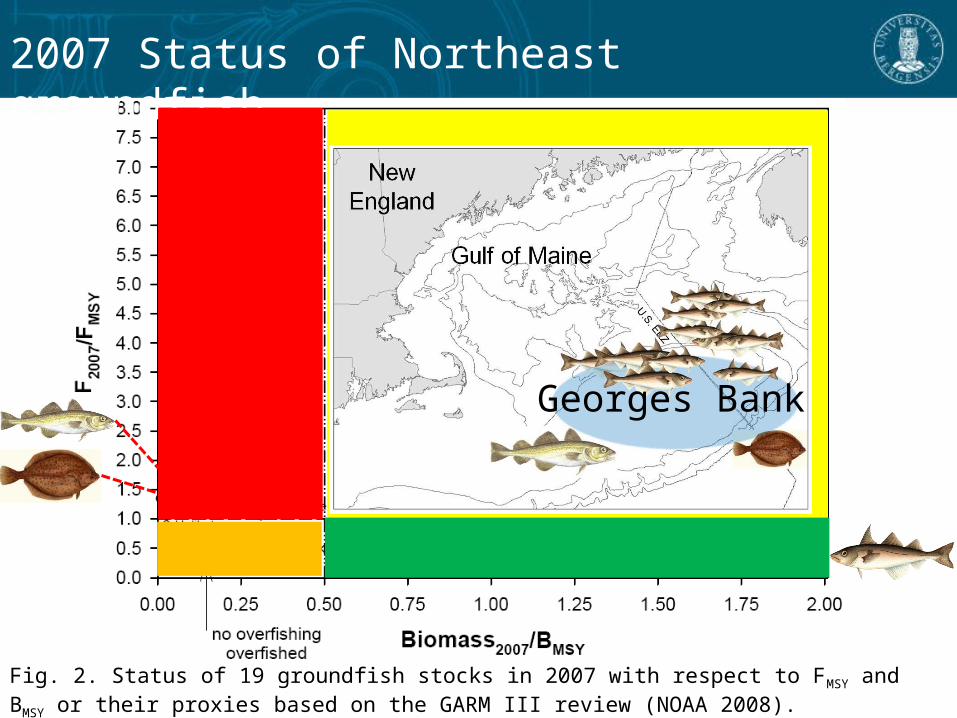
Fig. 2. Status of 19 groundfish stocks in 2007 with respect to FMSY and BMSY or their proxies based on the GARM III review (NOAA 2008).
2007 Status of Northeast groundfish
Georges Bank
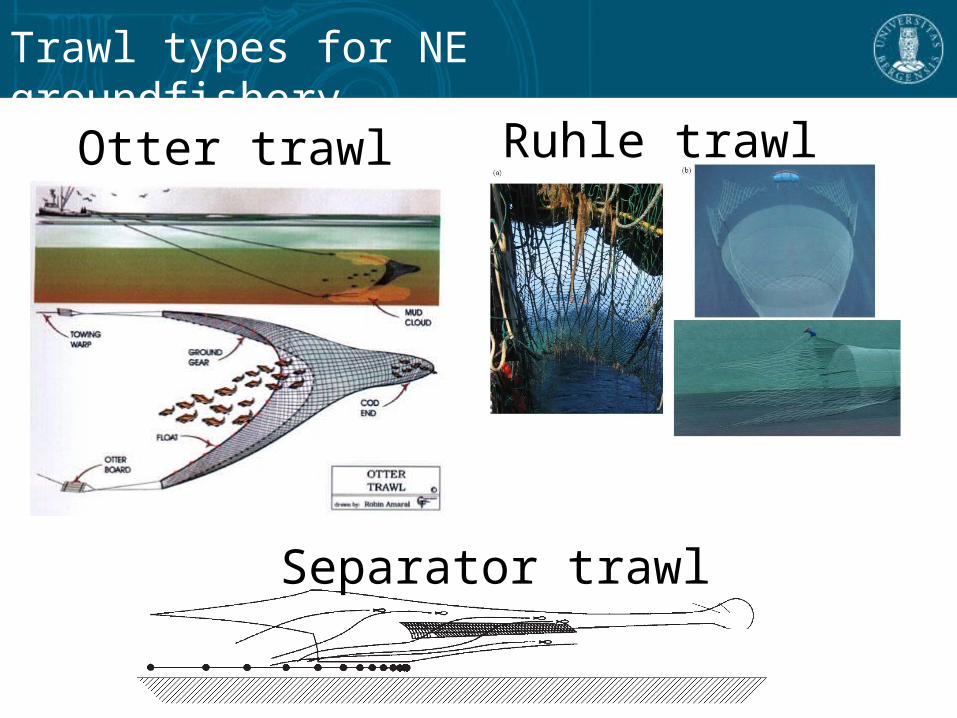
Separator trawl
Ruhle trawlOtter trawl
Trawl types for NE groundfishery
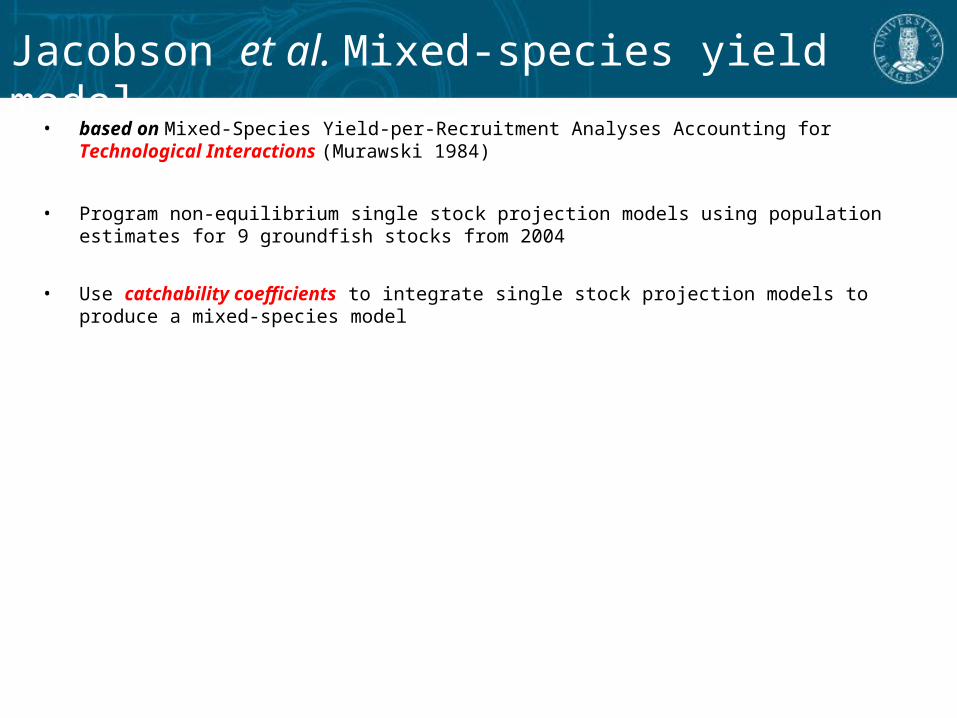
• based on Mixed-Species Yield-per-Recruitment Analyses Accounting for Technological Interactions (Murawski 1984)
• Program non-equilibrium single stock projection models using population estimates for 9 groundfish stocks from 2004
• Use catchability coefficients to integrate single stock projection models to produce a mixed-species model
Jacobson et al. Mixed-species yield model
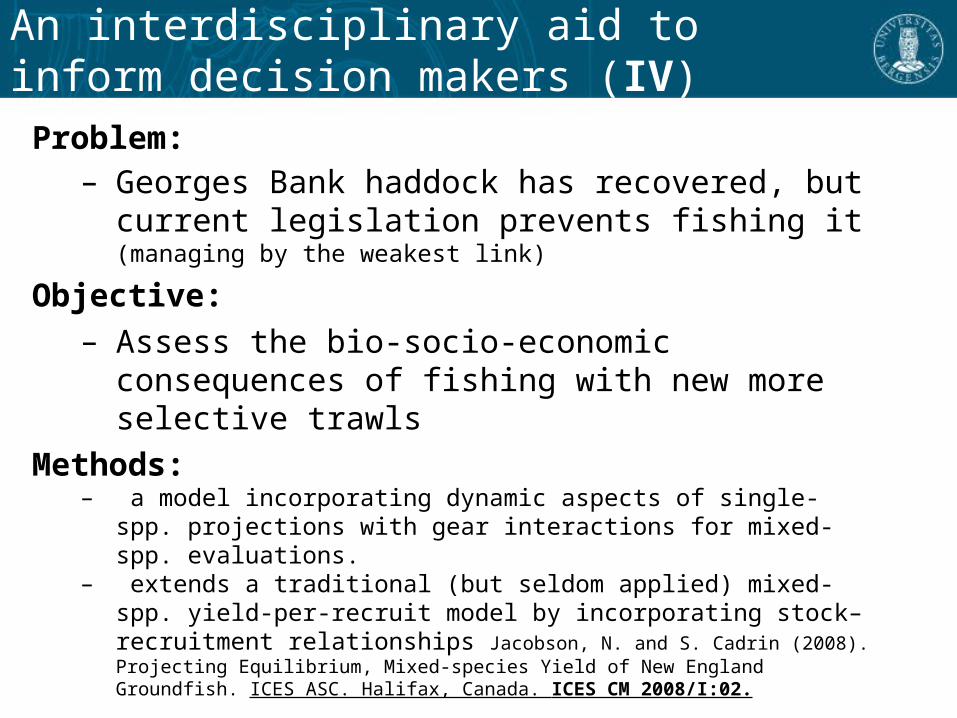
An interdisciplinary aid to inform decision makers (IV)
Problem:– Georges Bank haddock has recovered, but current
legislation prevents fishing it (managing by the weakest link)
Objective:– Assess the bio-socio-economic consequences of
fishing with new more selective trawlsMethods:
– a model incorporating dynamic aspects of single-spp. projections with gear interactions for mixed-spp. evaluations.
– extends a traditional (but seldom applied) mixed-spp. yield-per-recruit model by incorporating stock–recruitment relationships Jacobson, N. and S. Cadrin (2008). Projecting Equilibrium, Mixed-species Yield of New England Groundfish. ICES ASC. Halifax, Canada. ICES CM 2008/I:02.
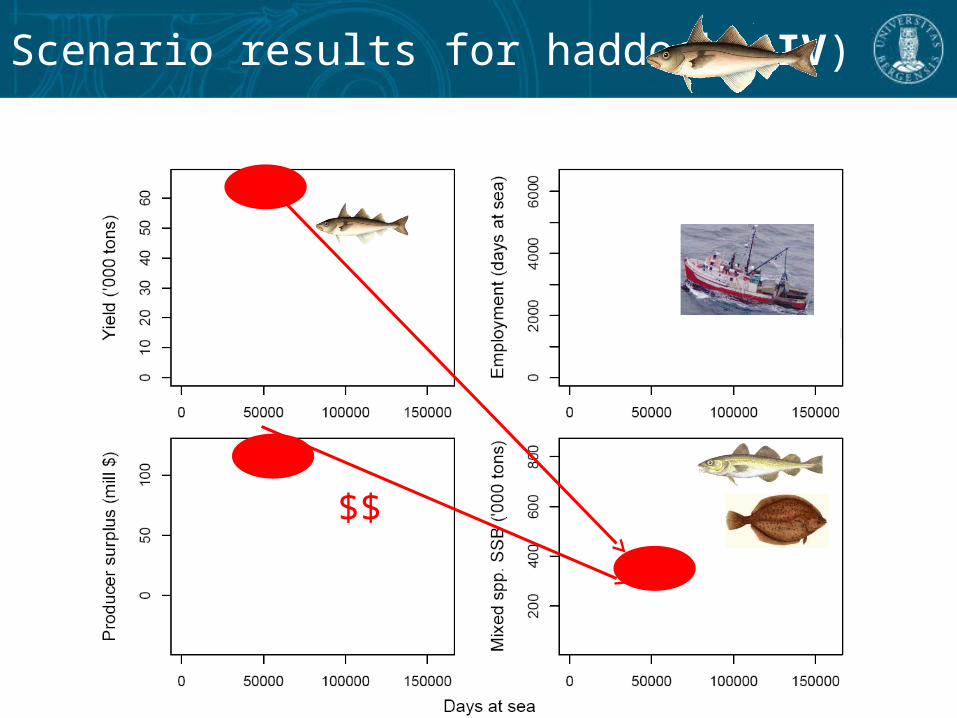
Scenario results for haddock (IV)
$$
Summary: Building blocks of sustainability for fisheries management
I have outlined some techniques that can be used to promote more sustainable fisheries through 4 papers:
I. Evaluates & benchmarks current management situationsII. Quantification of stakeholder objectives for clarification of
consensus in managementIII. Understanding properties of harvest control rules to
strengthen the scientific base of this modern management tool
IV. Facilitating the bio-socio-economic evaluation of new gear technology
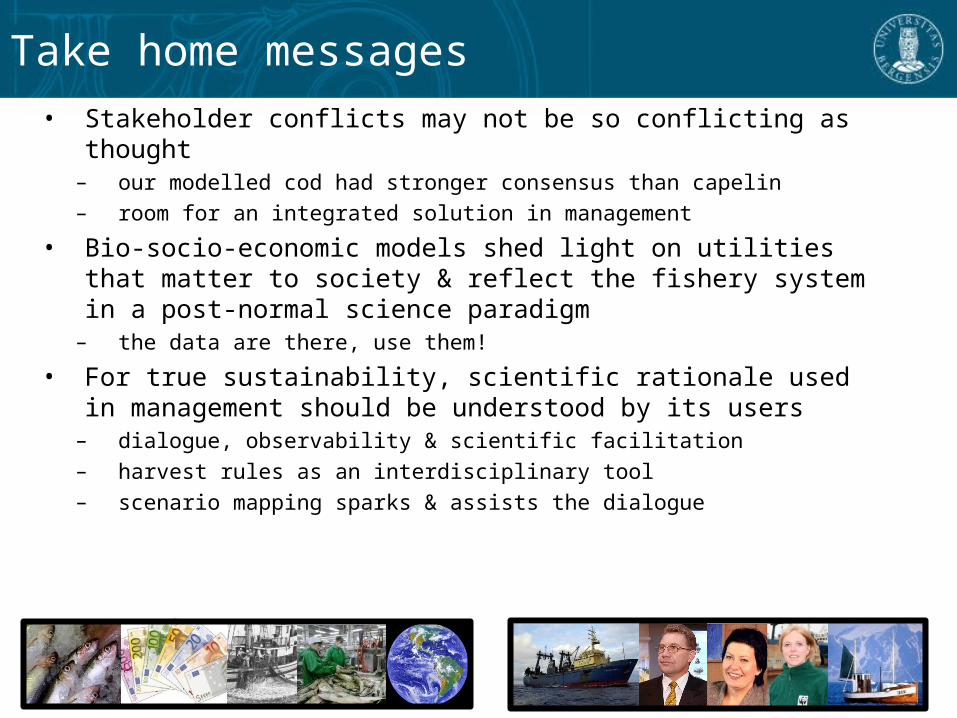
Take home messages• Stakeholder conflicts may not be so conflicting as thought
– our modelled cod had stronger consensus than capelin– room for an integrated solution in management
• Bio-socio-economic models shed light on utilities that matter to society & reflect the fishery system in a post-normal science paradigm
– the data are there, use them!
• For true sustainability, scientific rationale used in management should be understood by its users
– dialogue, observability & scientific facilitation– harvest rules as an interdisciplinary tool– scenario mapping sparks & assists the dialogue
Acknowledgements
Funding: the Norwegian Research Council & an extra grant from IIASA through the EU project FishACE
Advising: Mikko Heino, Dankert Skagen, Øyvind Ulltang, Ulf Dieckmann, Steve Cadrin
Other collaboration & discussions: Pelagic research group and colleagues at IMR, EvoFish research group (UiB), Nikki Jacobson, Steve Correia, Brian Rothschild, Dan Georgianna, Liz Brooks, Paul Rago, Peter Gullestad, ICES colleagues (SGMAS, Galway conference on Management Strategies), IIASA colleagues, & attendees at the Harvest Control Rule Sympsoium (AFS 2008)


Zone of Zone of consensusconsensus
Harvest proportion (%)
Min
imum
sIz
e (c
m)
Stakeholder utility results using 2 regulations
Zone of consensus = minimum
stakeholder whinge
Use more imaginary example
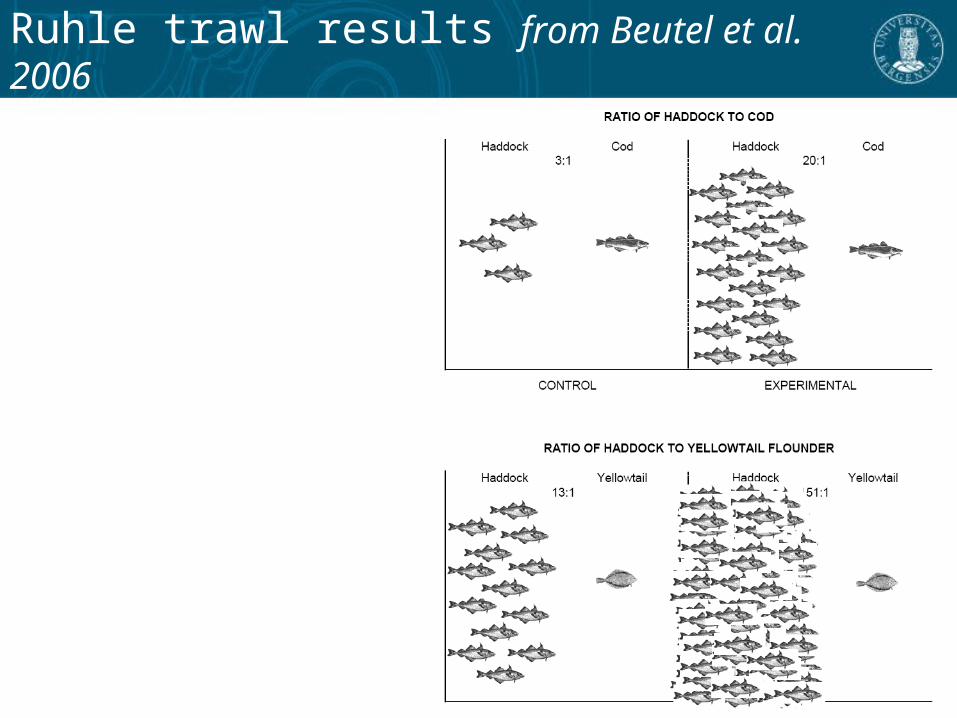
Ruhle trawl results from Beutel et al. 2006

HCR parameter variation
Biomass at time, t
C0
1:10 trigger( )t tTAC C B B
constant catch α = 0constant F α = C0/Btrig
constant escapement α = 1
similar
trigger biomass, Btrigger

HCR parameter variation
Biomass at time, t
C0
1:10 trigger( )t tTAC C B B
constant catch α = 0constant F α = C0/Btrig
constant escapement α = 1
similar
similar
trigger biomass, Btrigger
Not a simple task to visualize
4 dimensionsOver from a scientific to
a stakeholder presentation
Evaluating generic HCRs: output according to parameter levels
Lowest CV Lowest biol. risk
compromise btwn building up stock
and protecting with thres. B
All rules the same
Lowest CVHighest catch
Too much protection that it is hard for B to > thres. B
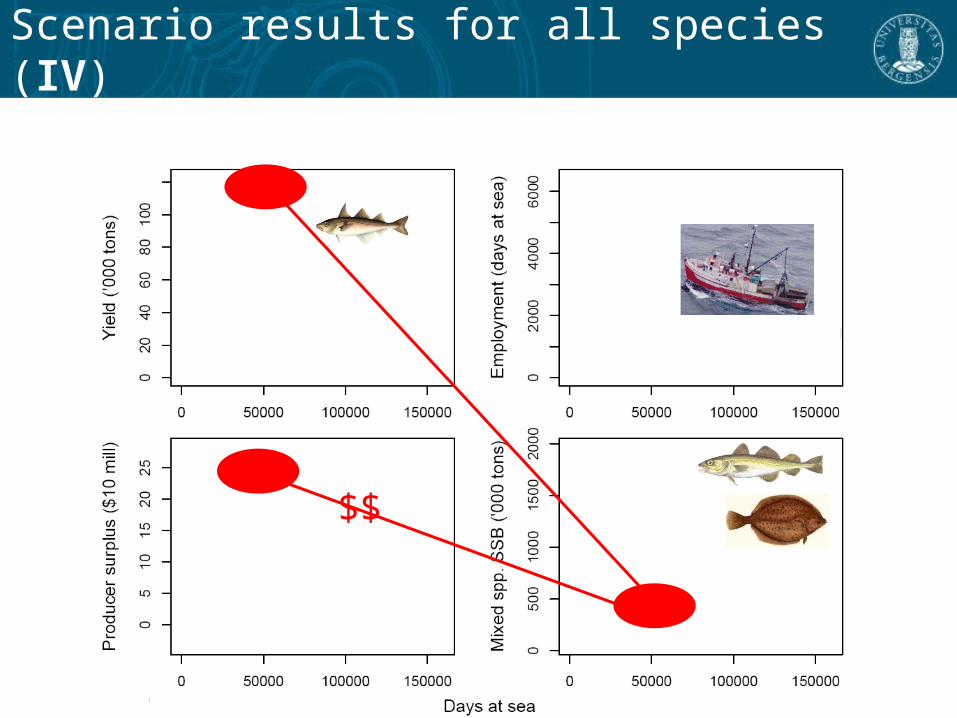
Scenario results for all species (IV)
$$