Embed Size (px)
Citation preview
Death and uncertainty: Bayesian modeling of the association between life span and reproductive investment in birds.
Owen R. Jones* and Fernando ColcheroMax Planck Institute for Demographic Research, Rostock*[email protected], website: owenjon.es
11th September 2012, GfÖ, Lüneburg, Germany
Phot
o: b
ram
blej
ungl
e/fli
ckr
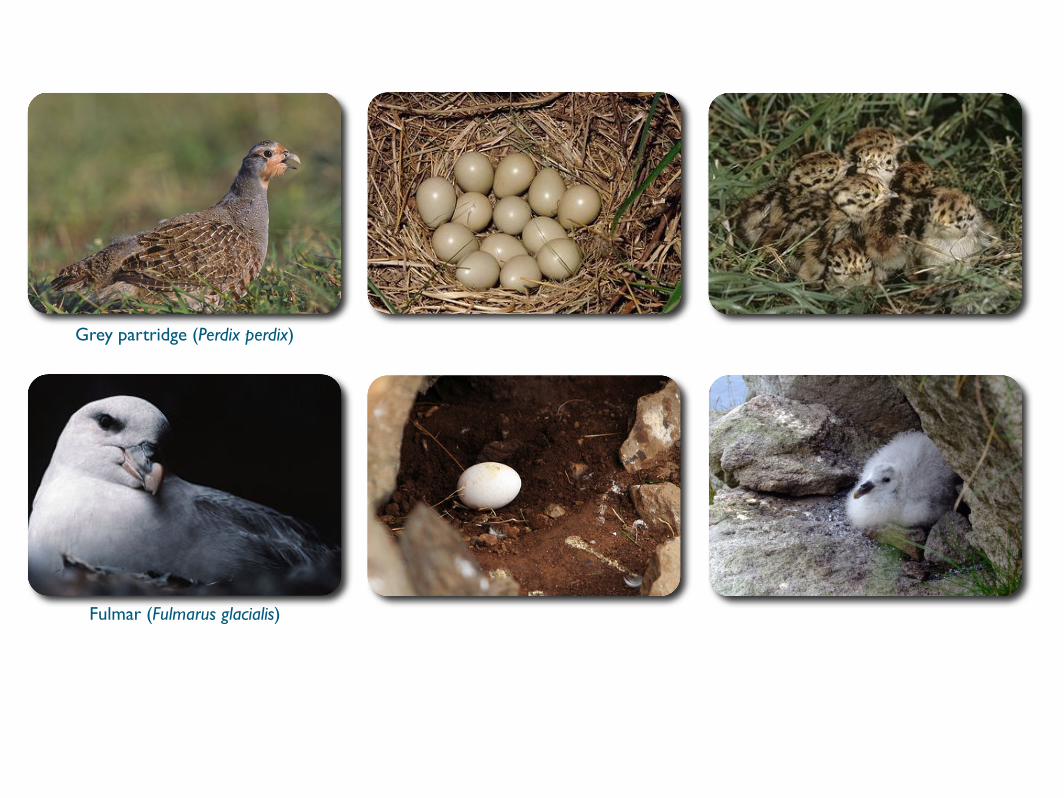
Fulmar (Fulmarus glacialis)
Grey partridge (Perdix perdix)

de Magalhaes & Costa 2009 J. Evol. Biol.
Robinson 2005 BTO Research Report 407
Sample size
Max
. obs
erve
d life
span
0 20 40 60 80 100
0
5
10
15
20
25
30
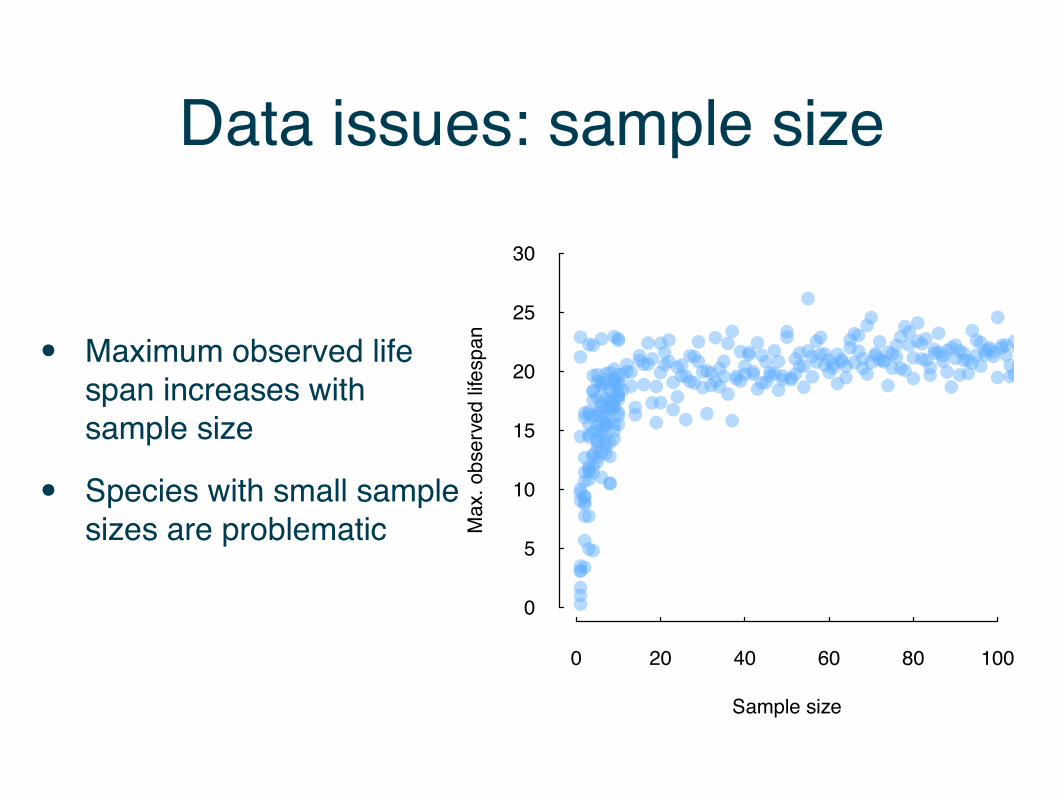
Data issues: sample size
• Maximum observed life span increases with sample size
• Species with small sample sizes are problematic
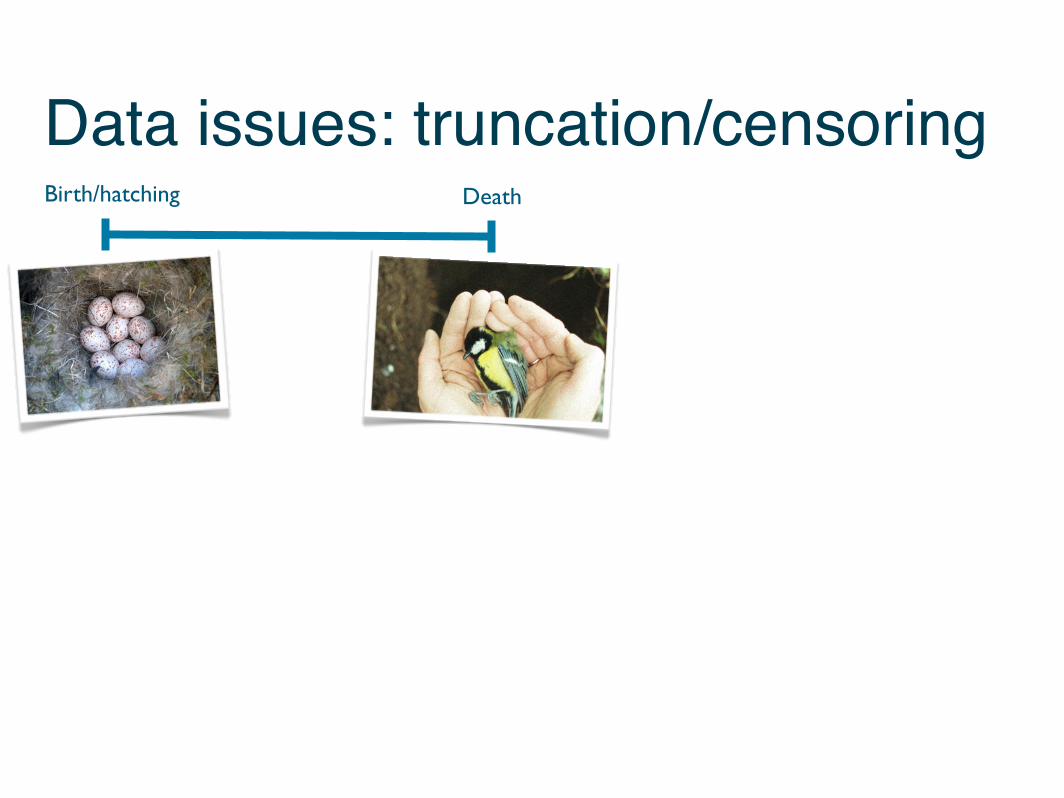
Birth/hatching Death
Data issues: truncation/censoring
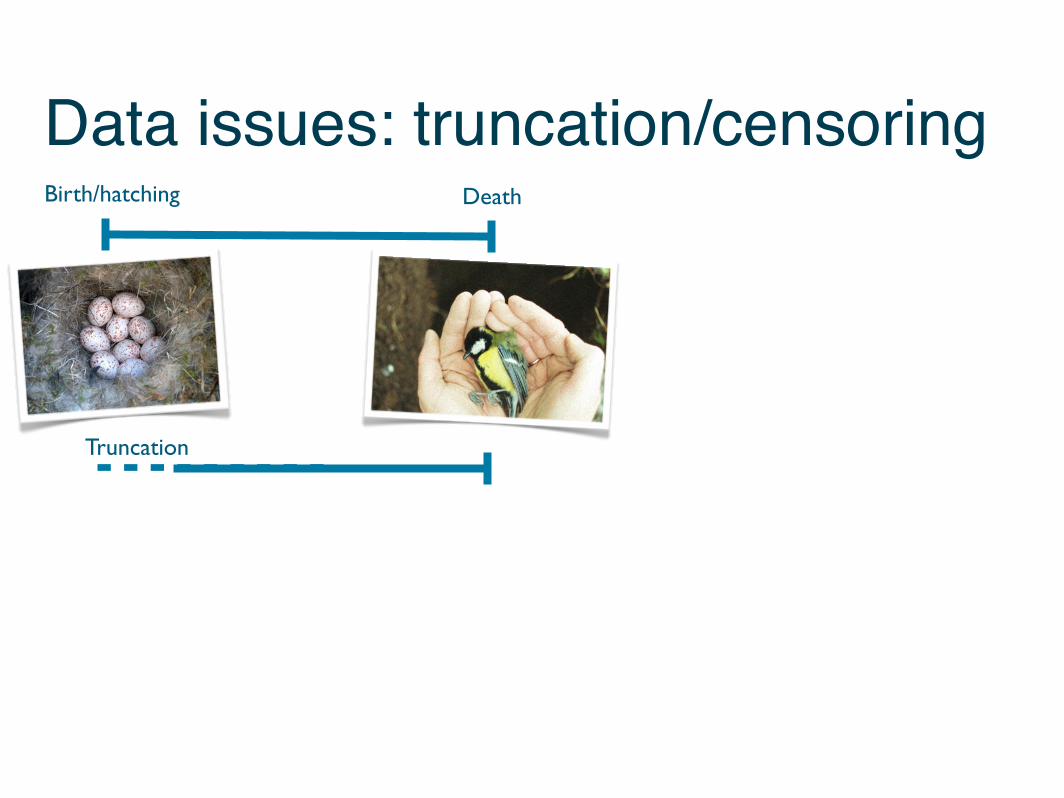
DeathBirth/hatching
Data issues: truncation/censoring
Truncation
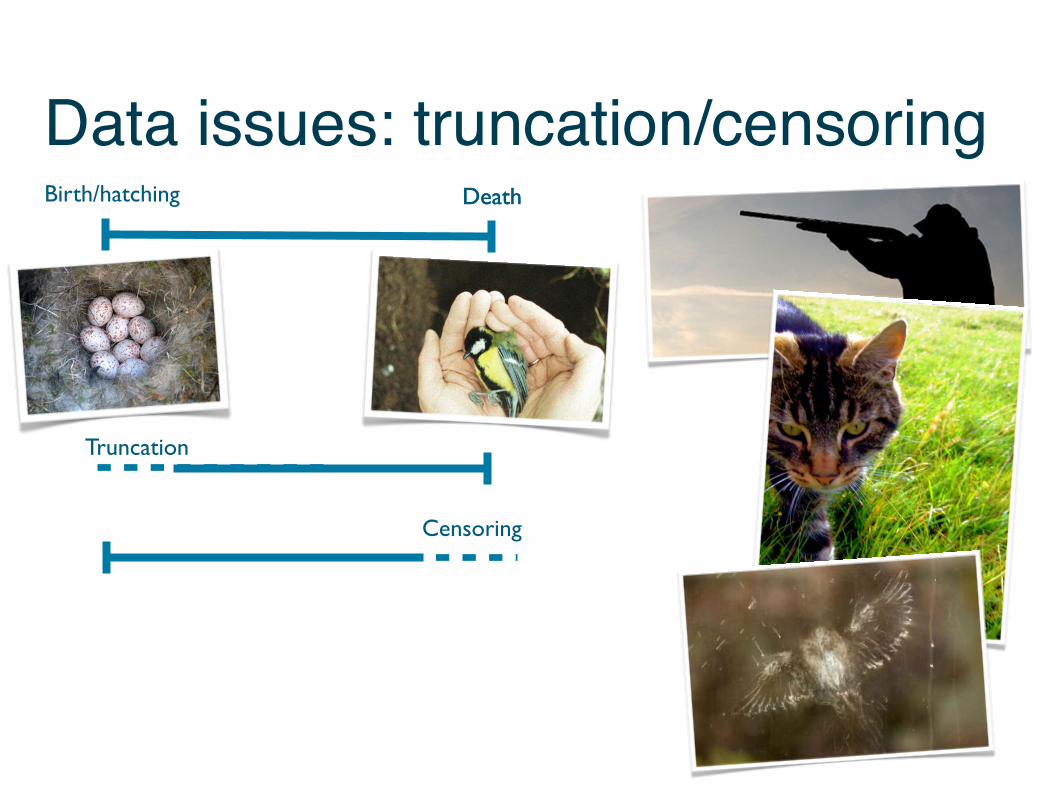
Death
Censoring
DeathBirth/hatching
Truncation
Data issues: truncation/censoring
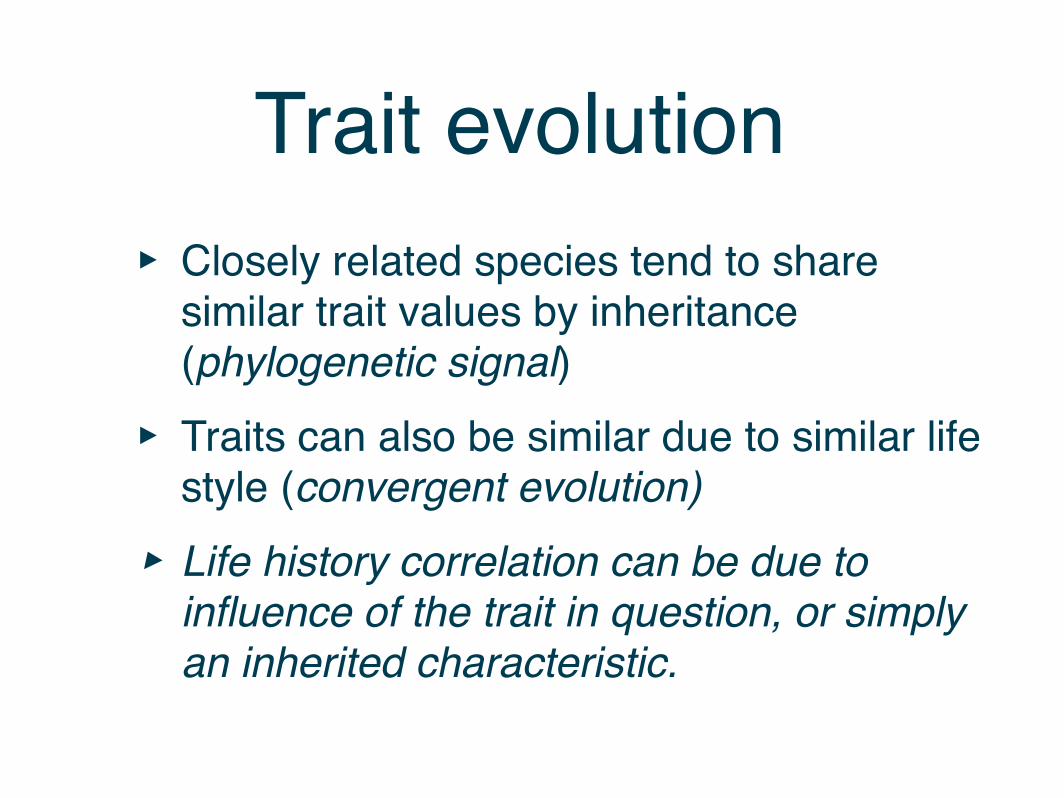
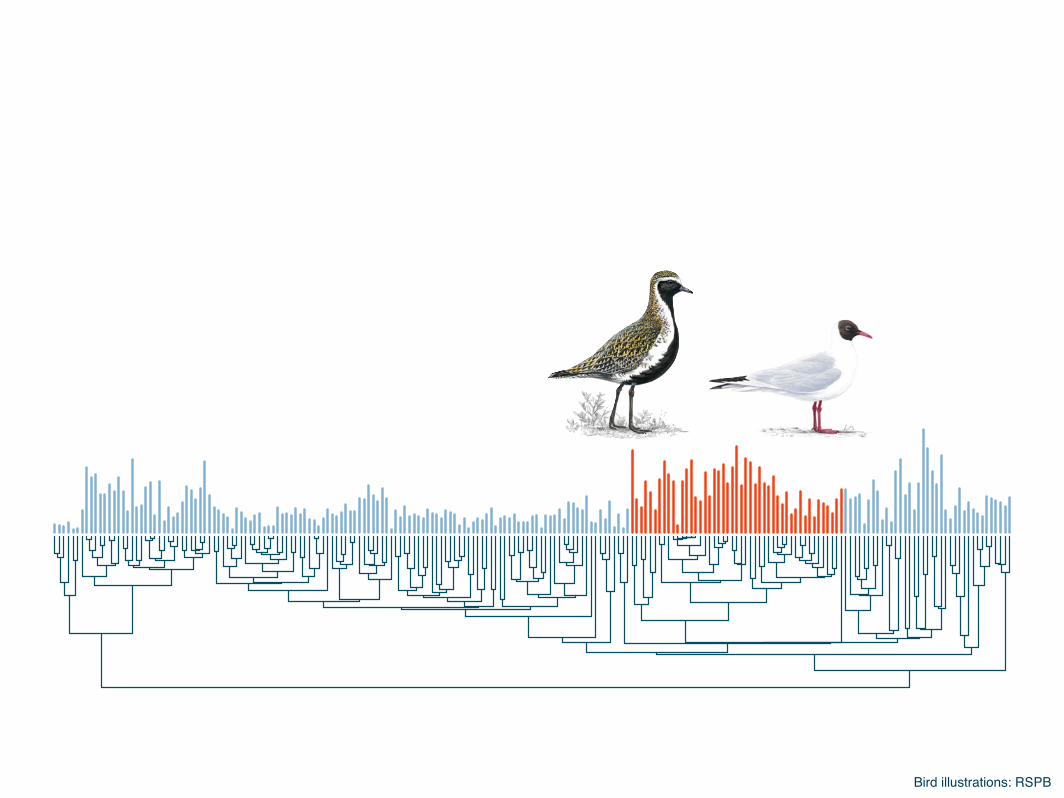
Trait evolution‣ Closely related species tend to share
similar trait values by inheritance (phylogenetic signal)
‣ Traits can also be similar due to similar life style (convergent evolution)
‣ Life history correlation can be due to influence of the trait in question, or simply an inherited characteristic.
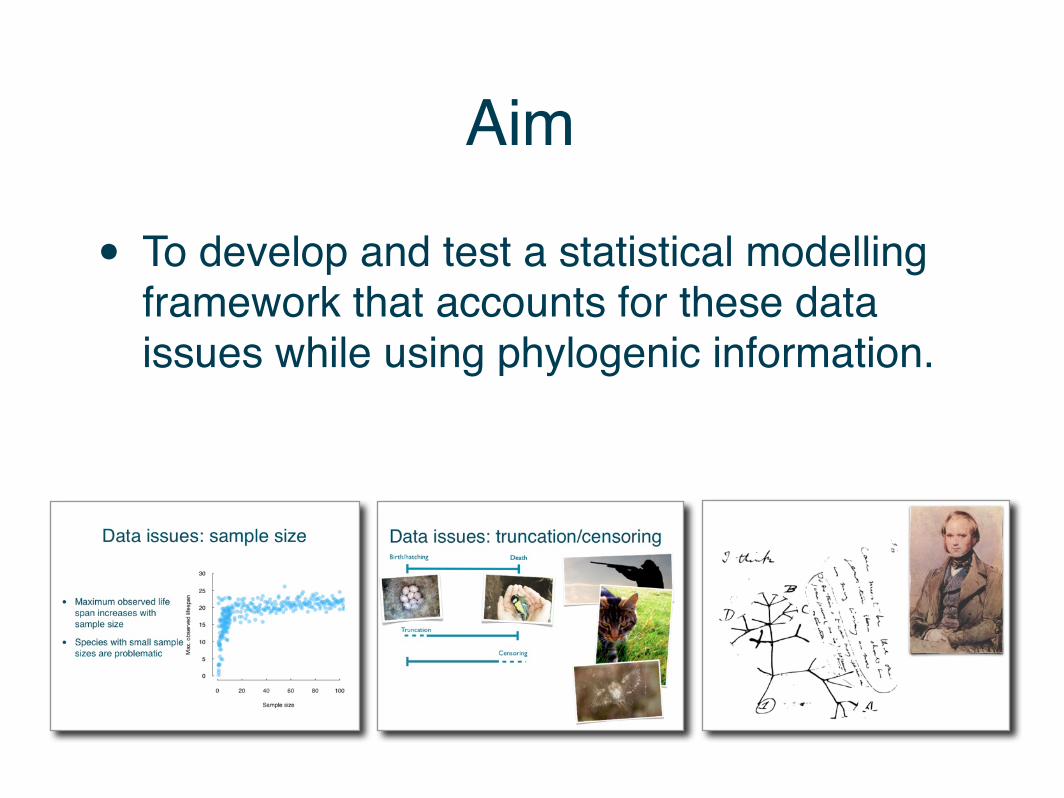
• To develop and test a statistical modelling framework that accounts for these data issues while using phylogenic information.
Aim
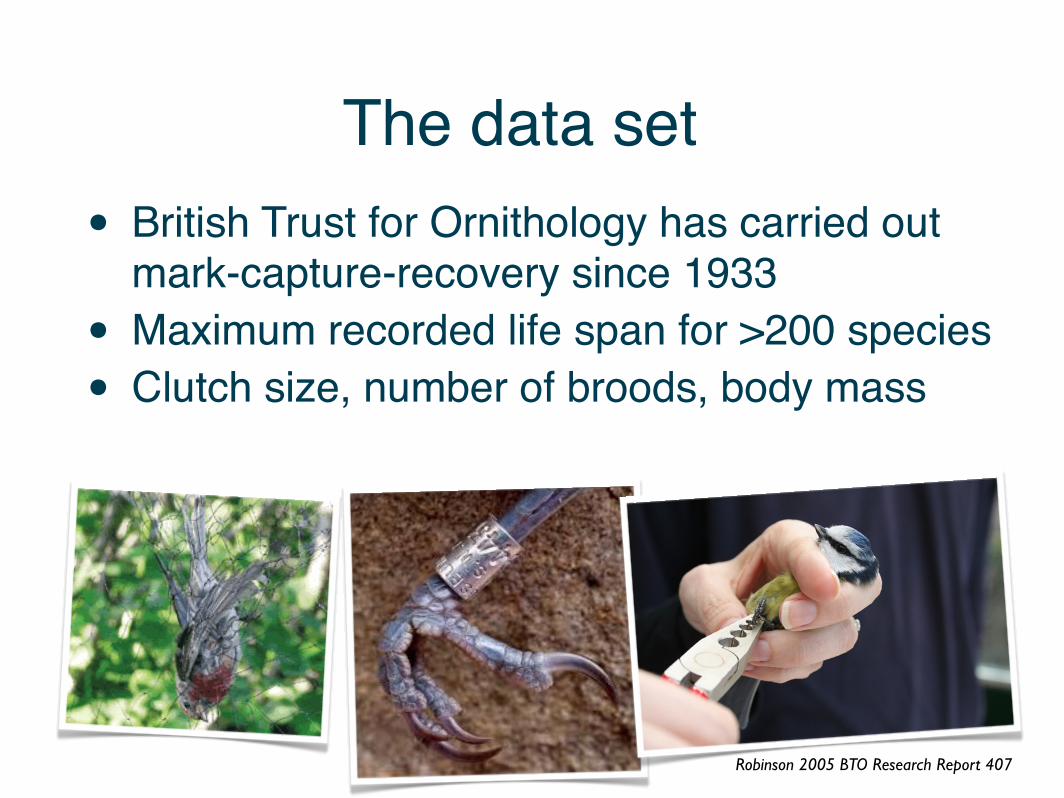
• British Trust for Ornithology has carried out mark-capture-recovery since 1933
• Maximum recorded life span for >200 species• Clutch size, number of broods, body mass
The data set
Robinson 2005 BTO Research Report 407
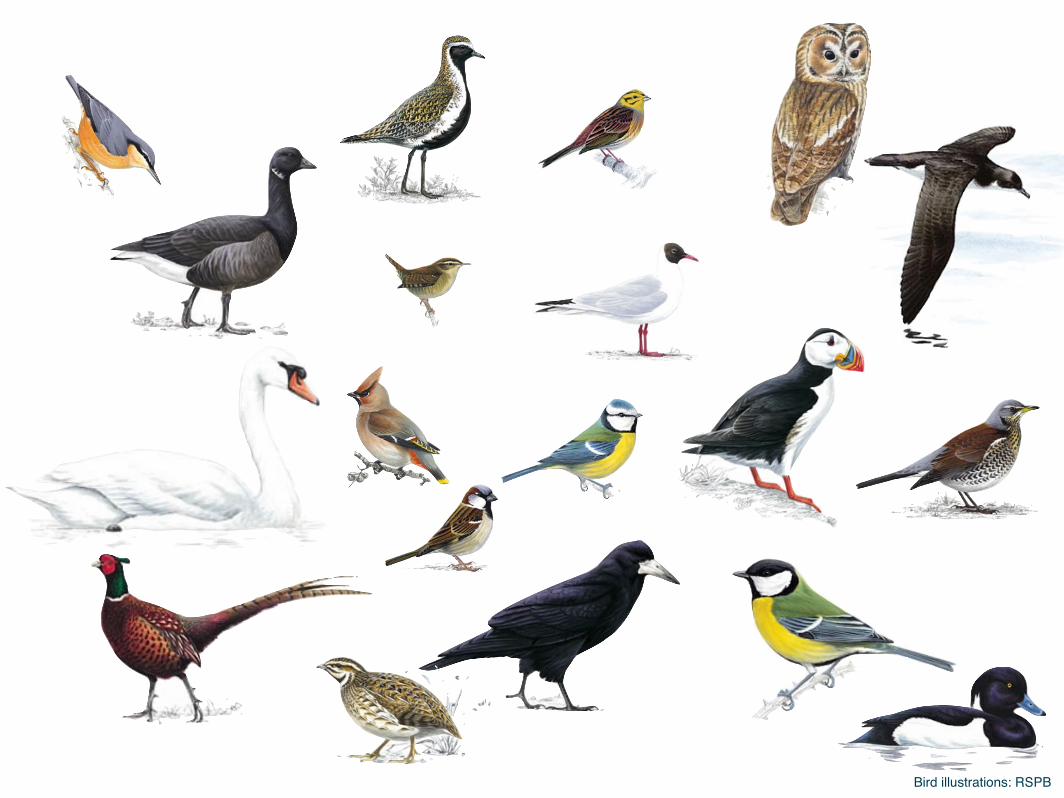
Bird illustrations: RSPB
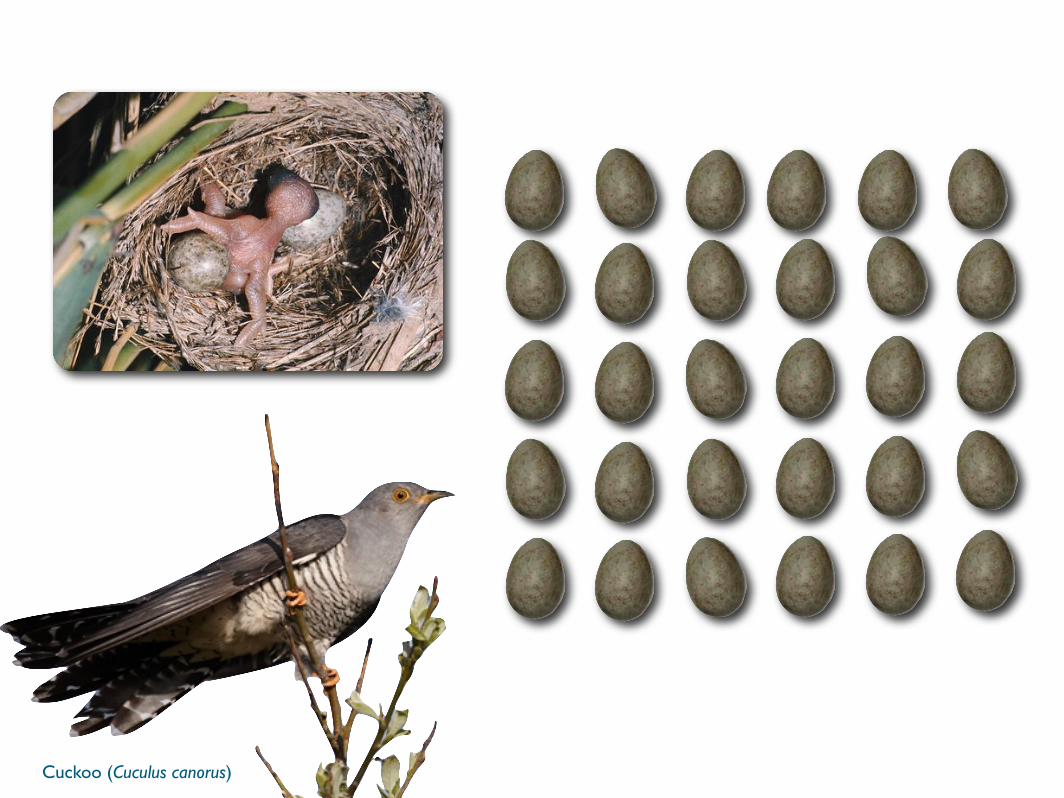
Cuckoo (Cuculus canorus)
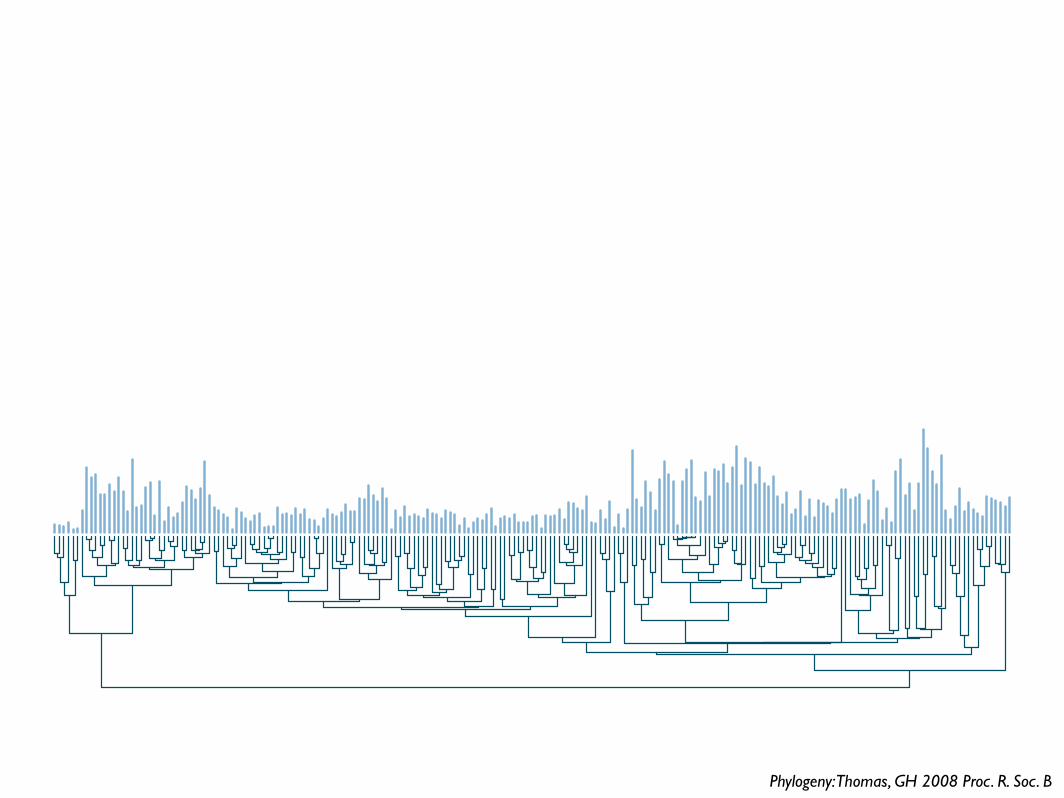
Phylogeny: Thomas, GH 2008 Proc. R. Soc. B
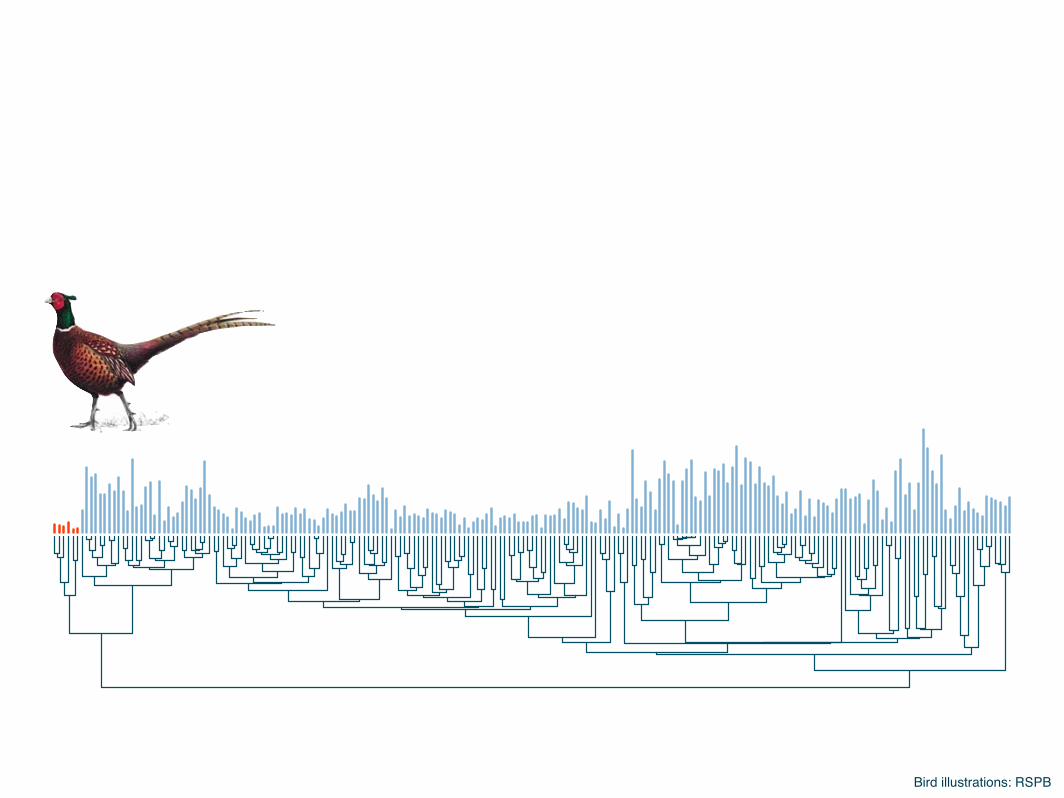
Bird illustrations: RSPB
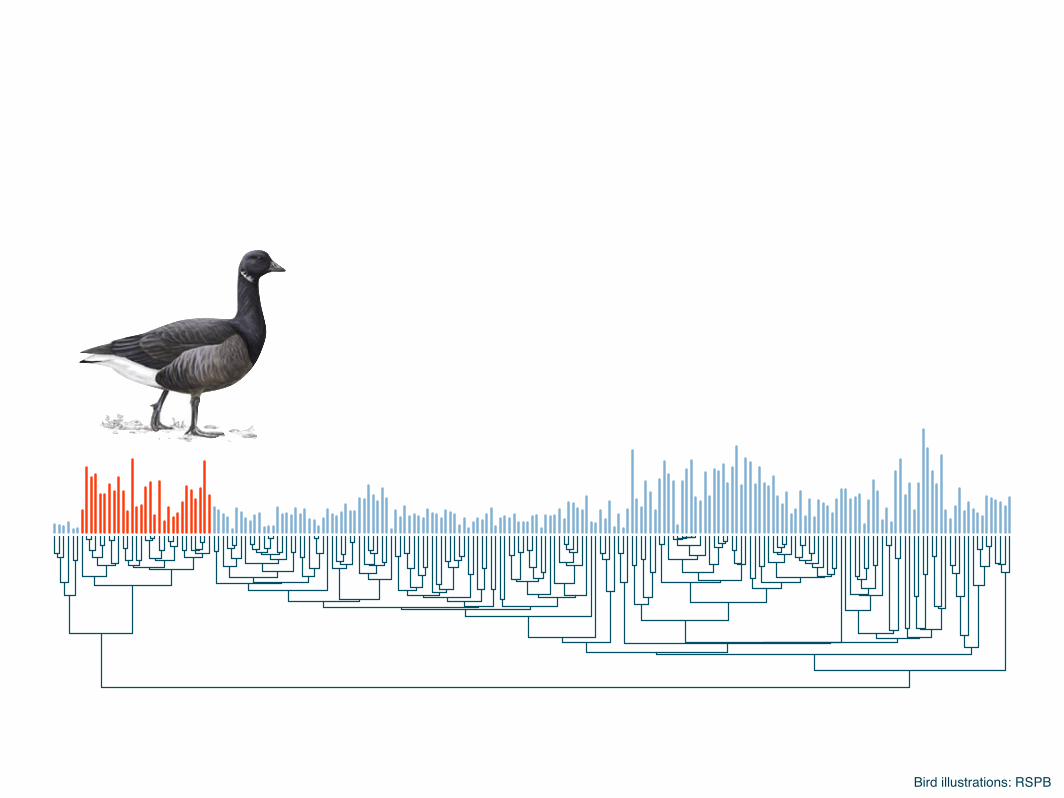
Bird illustrations: RSPB
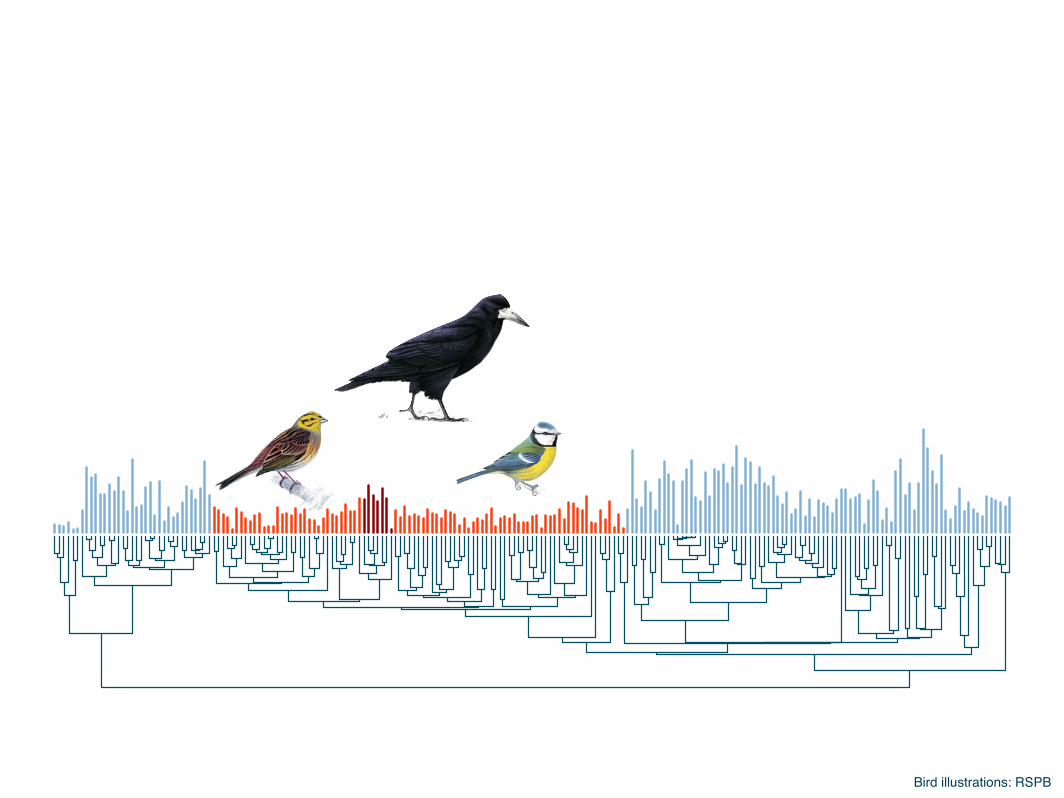
Bird illustrations: RSPB
Bird illustrations: RSPB
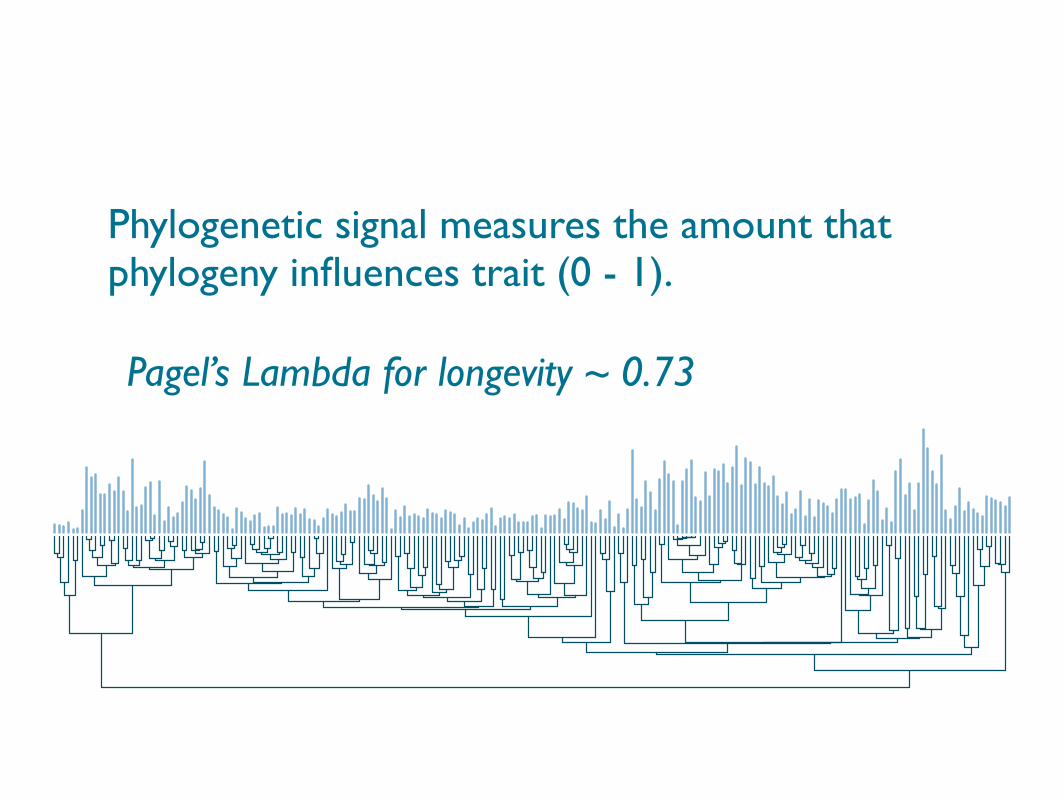
Pagel’s Lambda for longevity ~ 0.73
Phylogenetic signal measures the amount that phylogeny influences trait (0 - 1).
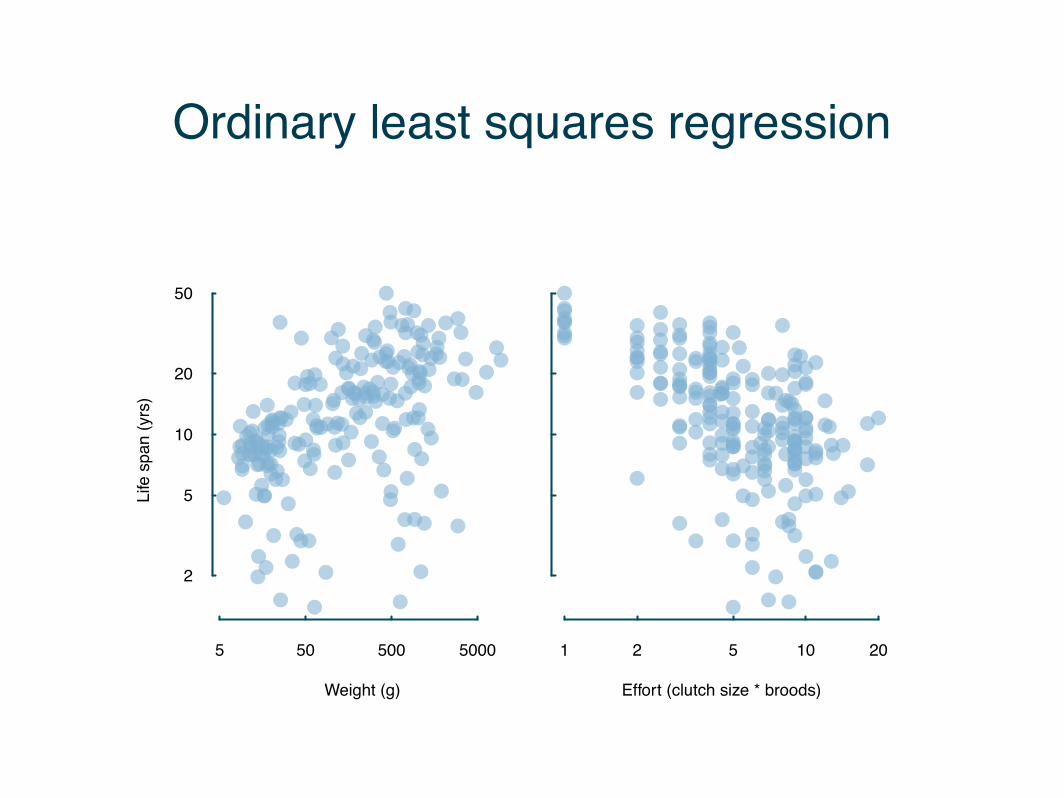
Weight (g)
Life
spa
n (y
rs)
5 50 500 5000
2
5
10
20
50
Effort (clutch size * broods)
1 2 5 10 20
Ordinary least squares regression
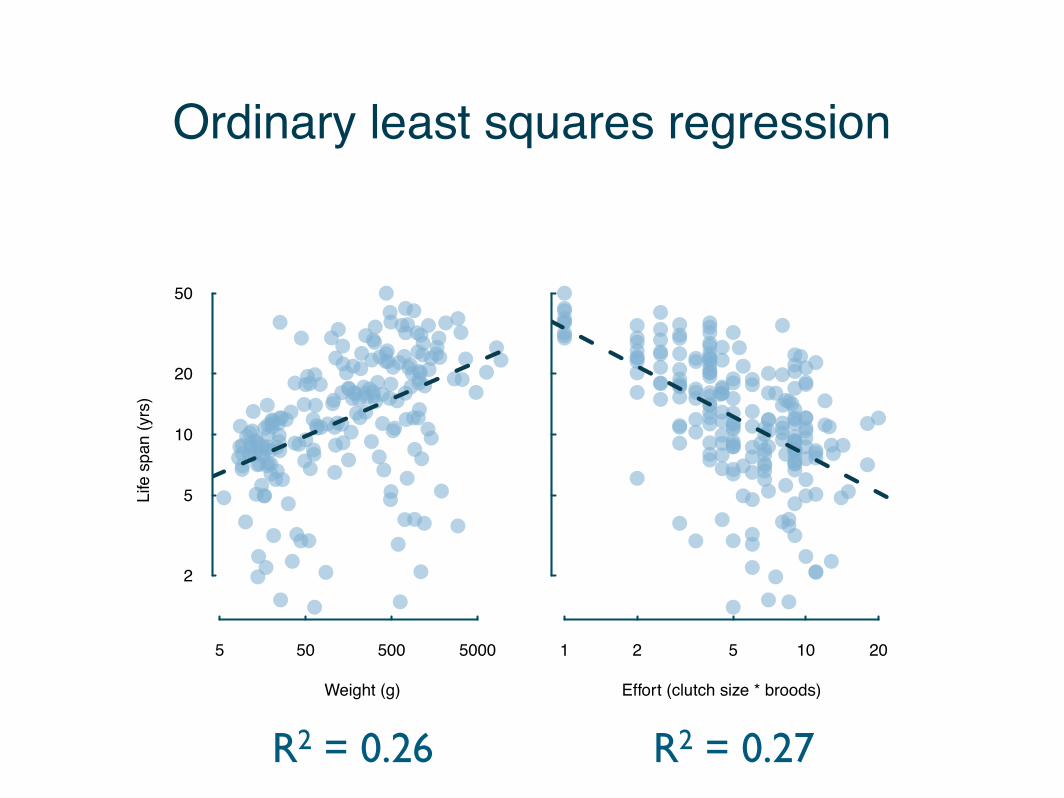
R2 = 0.27R2 = 0.26
Ordinary least squares regression
Weight (g)
Life
spa
n (y
rs)
5 50 500 5000
2
5
10
20
50
Effort (clutch size * broods)
1 2 5 10 20
Weight (g)
Life
spa
n (y
rs)
5 50 500 5000
2
5
10
20
50
Effort (clutch size * broods)
1 2 5 10 20
R2 = 0.27 to <0.01R2 = 0.26 to <0.01
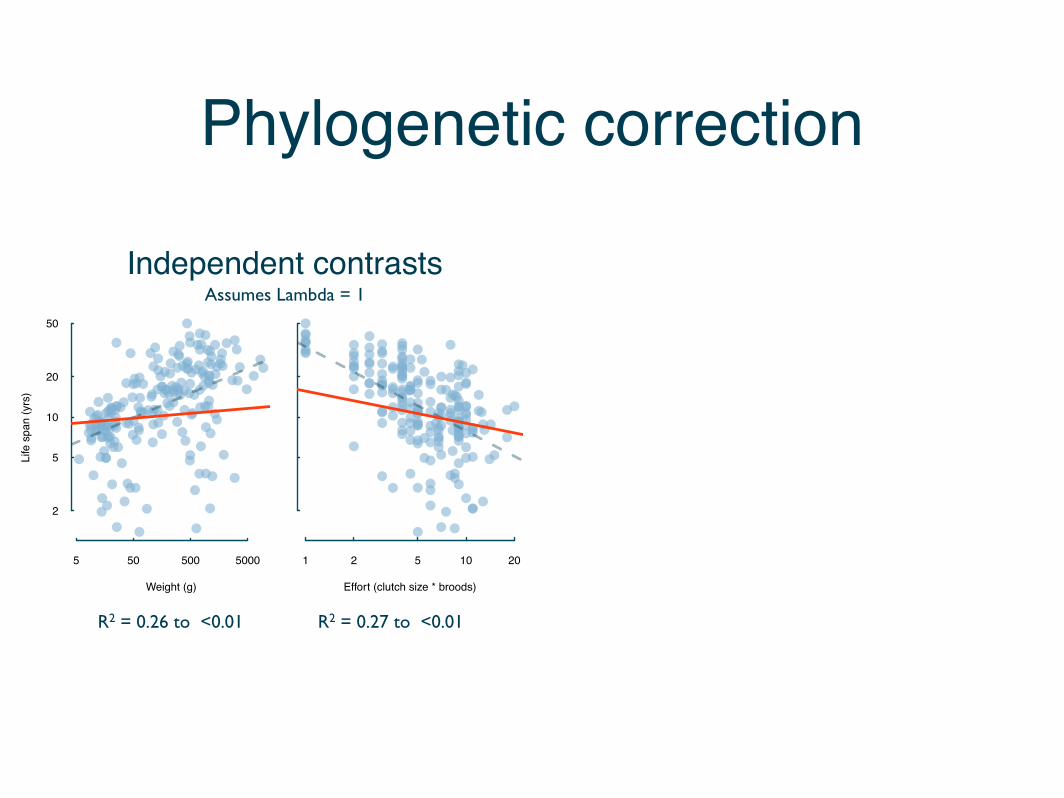
Phylogenetic correction
Independent contrastsAssumes Lambda = 1
Independent contrasts
Weight (g)
Life
spa
n (y
rs)
5 50 500 5000
2
5
10
20
50
Effort (clutch size * broods)
1 2 5 10 20
R2 = 0.27 to <0.01R2 = 0.26 to <0.01
Weight (g)
Life
spa
n (y
rs)
5 50 500 5000
2
5
10
20
50
Effort (clutch size * broods)
1 2 5 10 20
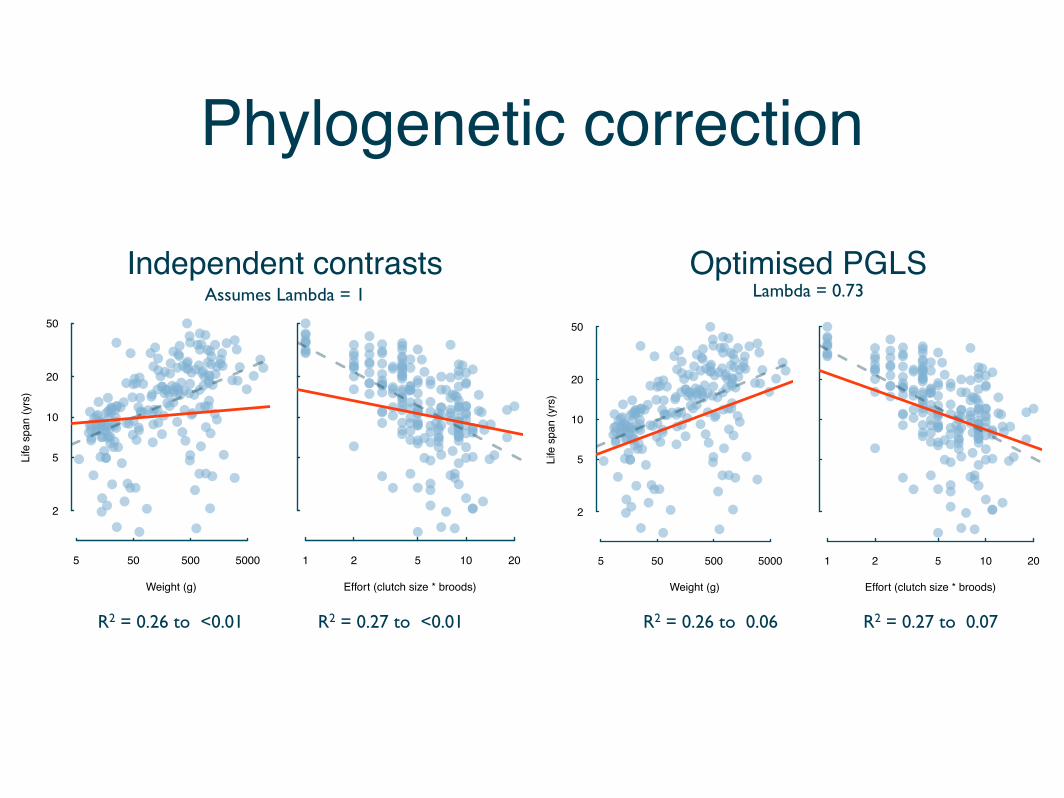
Optimised PGLS
R2 = 0.27 to 0.07R2 = 0.26 to 0.06
Phylogenetic correction
Assumes Lambda = 1 Lambda = 0.73
Weight (g)
Life
spa
n (y
rs)
5 50 500 5000
2
5
10
20
50
Effort (clutch size * broods)
1 2 5 10 20
R2 = 0.27 to <0.01R2 = 0.26 to <0.01
Weight (g)
Life
spa
n (y
rs)
5 50 500 5000
2
5
10
20
50
Effort (clutch size * broods)
1 2 5 10 20
R2 = 0.27 to 0.07R2 = 0.26 to 0.06
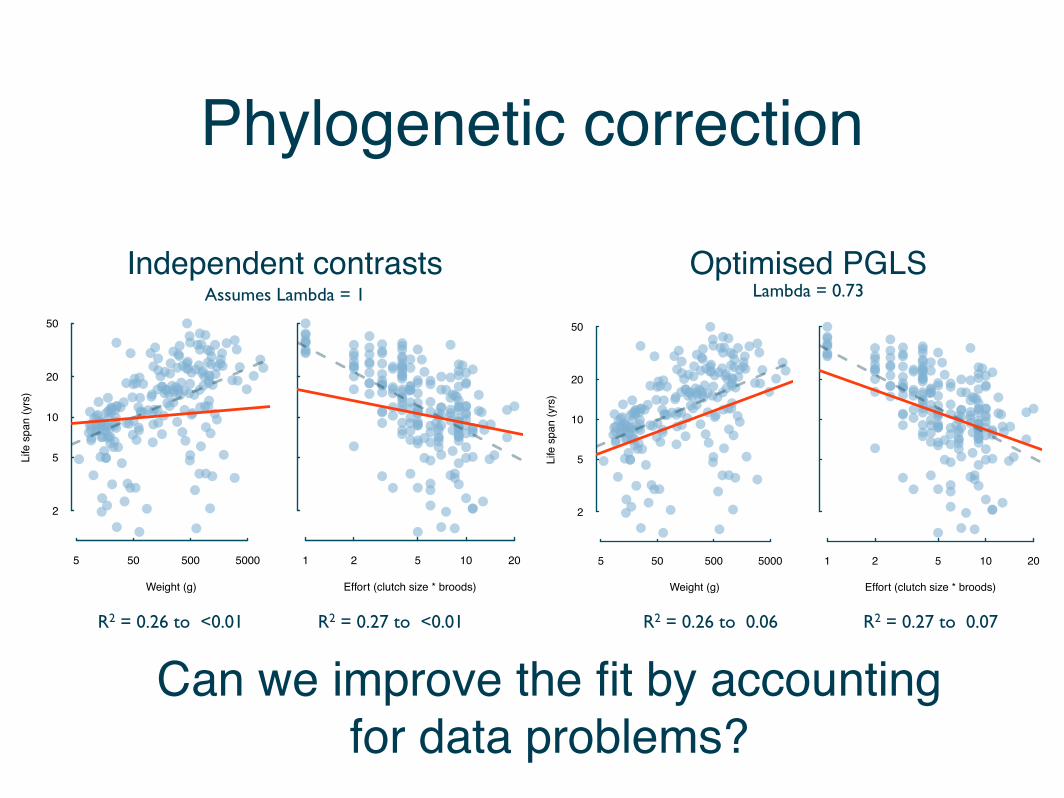
Phylogenetic correction
Can we improve the fit by accounting for data problems?
Independent contrasts Optimised PGLSAssumes Lambda = 1 Lambda = 0.73
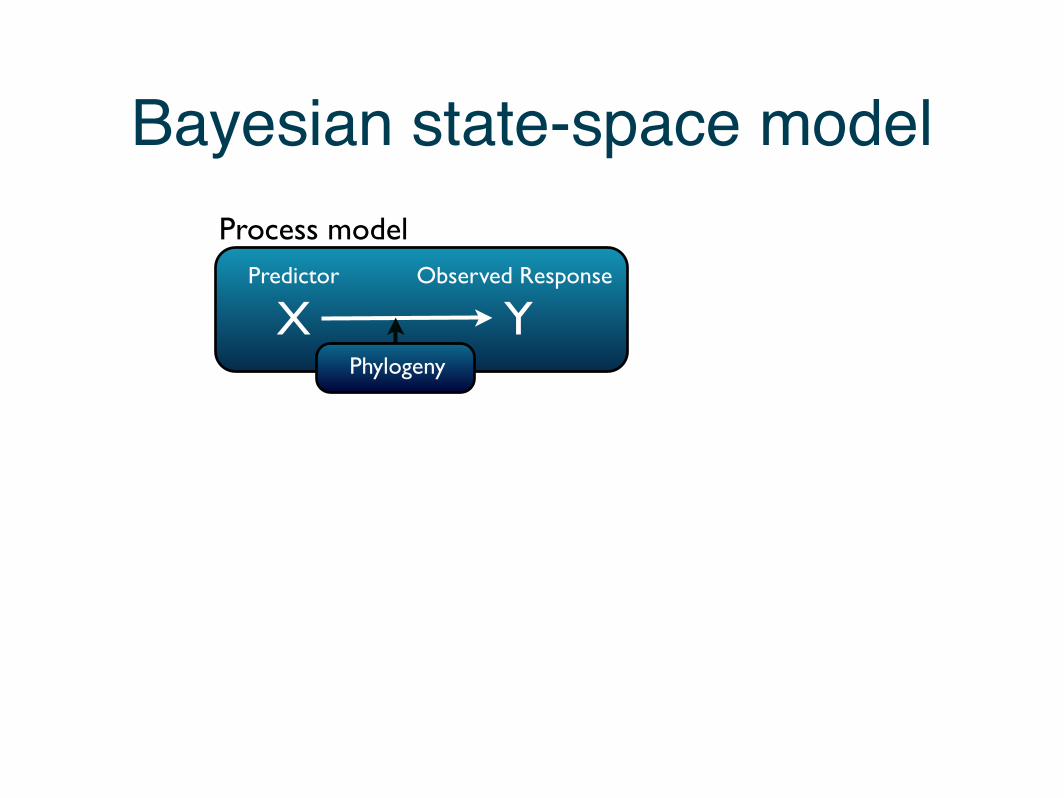
Process model
X YPredictor Observed Response
Bayesian state-space model
Phylogeny
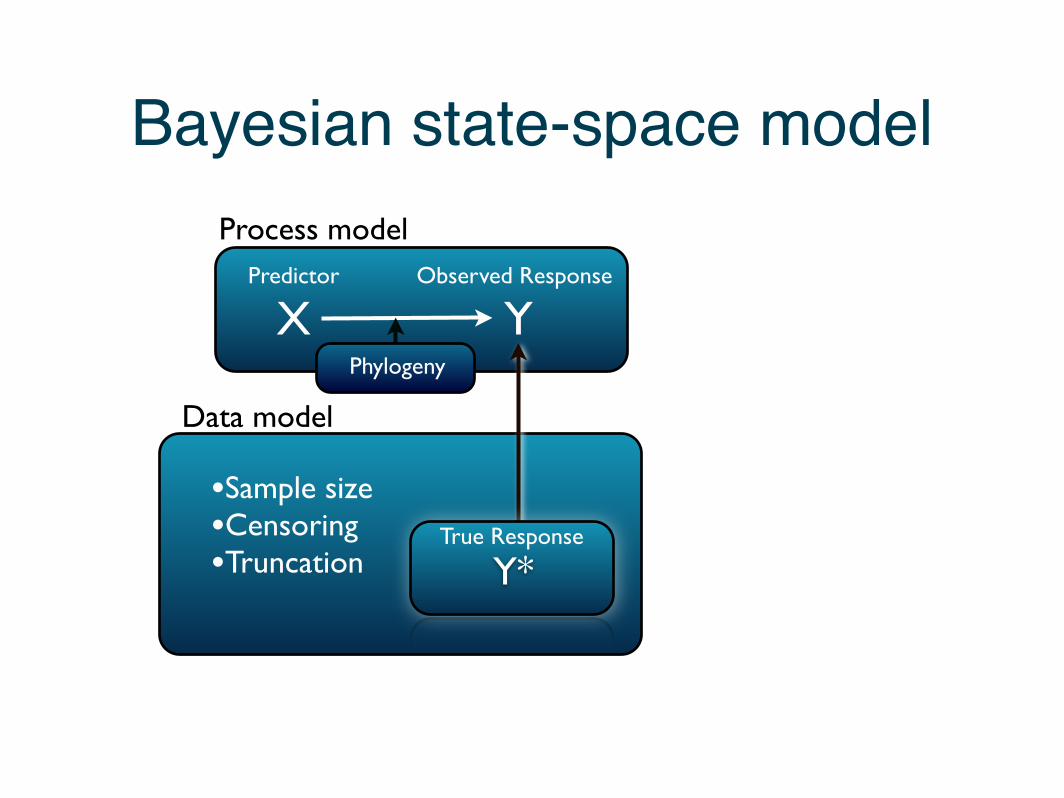
Process model
True Response
Y*
X YPredictor Observed Response
•Sample size•Censoring•Truncation
Data model
Bayesian state-space model
Phylogeny
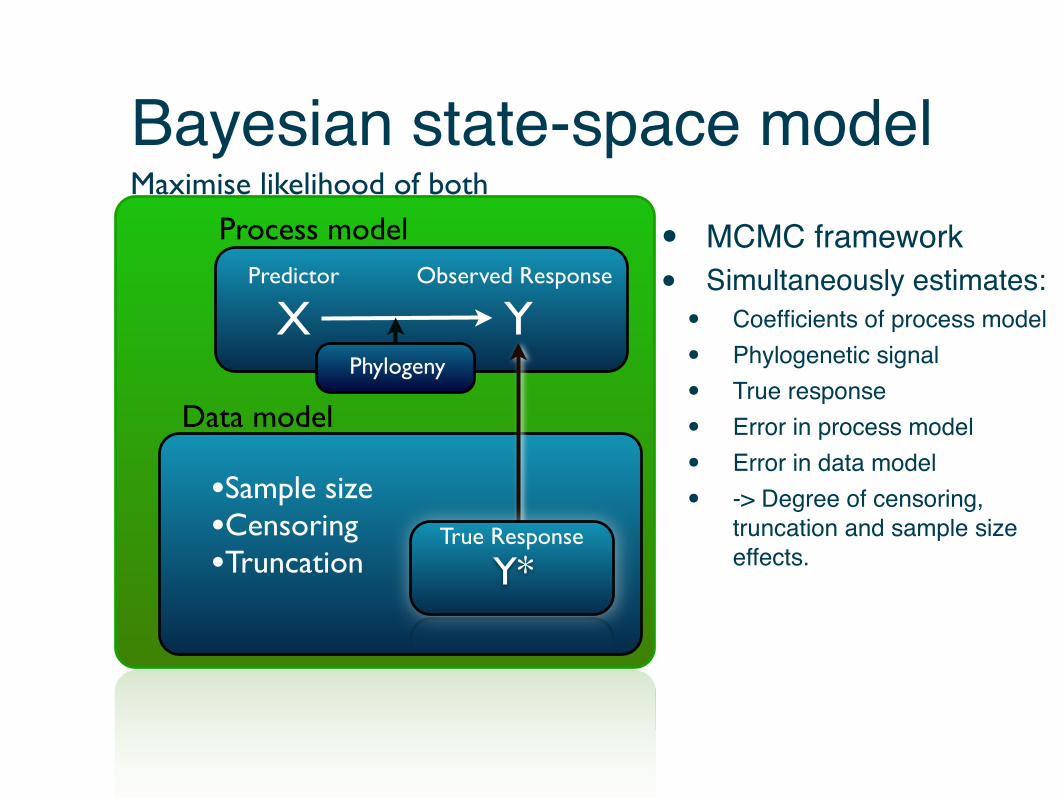
Process model
True Response
Y*
X YPredictor Observed Response
•Sample size•Censoring•Truncation
Data model
Maximise likelihood of both
Phylogeny
• MCMC framework• Simultaneously estimates:• Coefficients of process model• Phylogenetic signal• True response• Error in process model• Error in data model• -> Degree of censoring,
truncation and sample size effects.
Bayesian state-space model
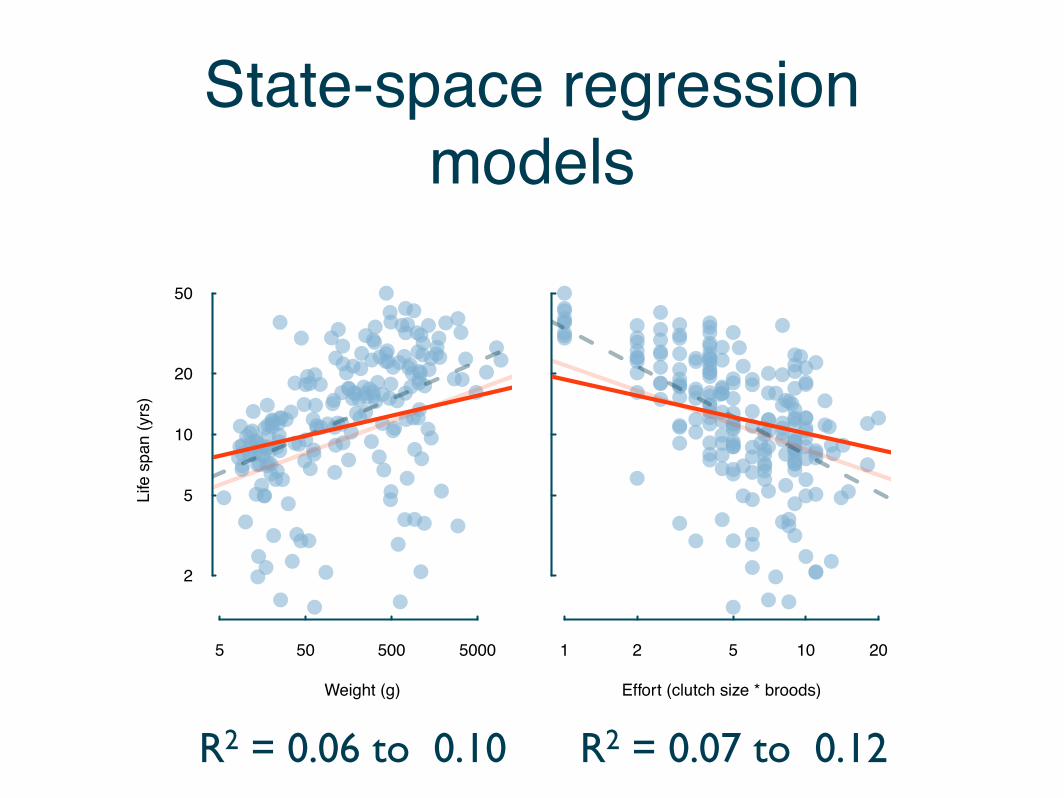
R2 = 0.07 to 0.12R2 = 0.06 to 0.10
State-space regression models
Weight (g)
Life
spa
n (y
rs)
5 50 500 5000
2
5
10
20
50
Effort (clutch size * broods)
1 2 5 10 20
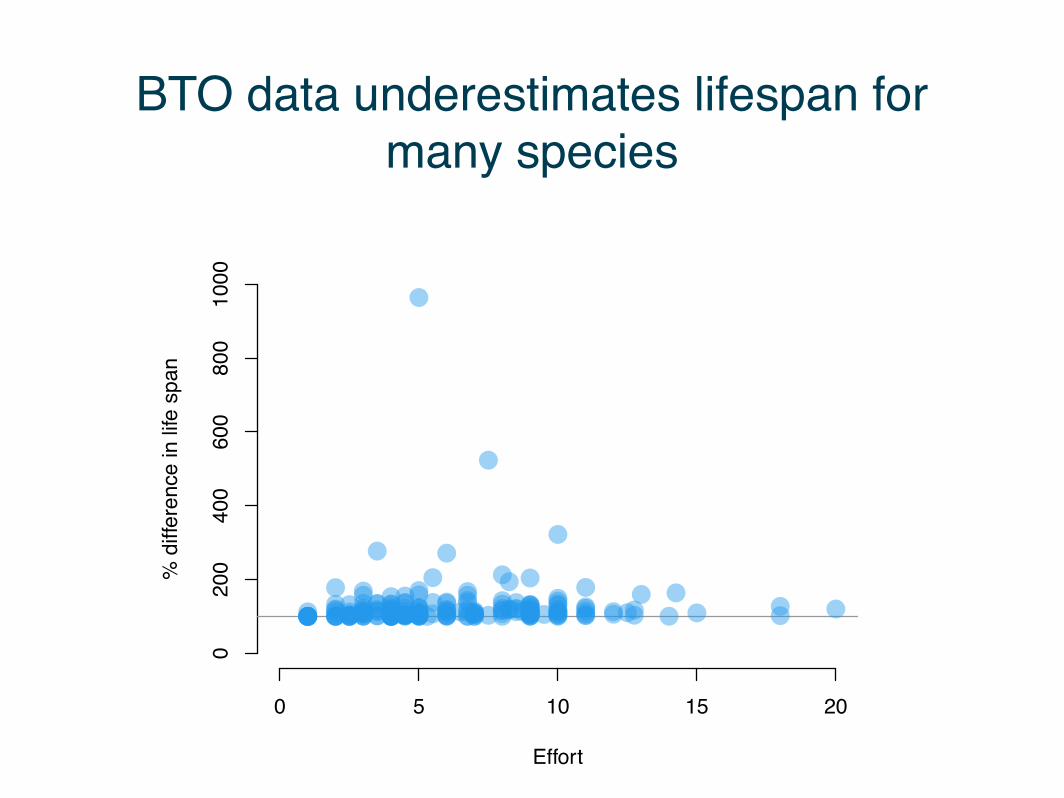
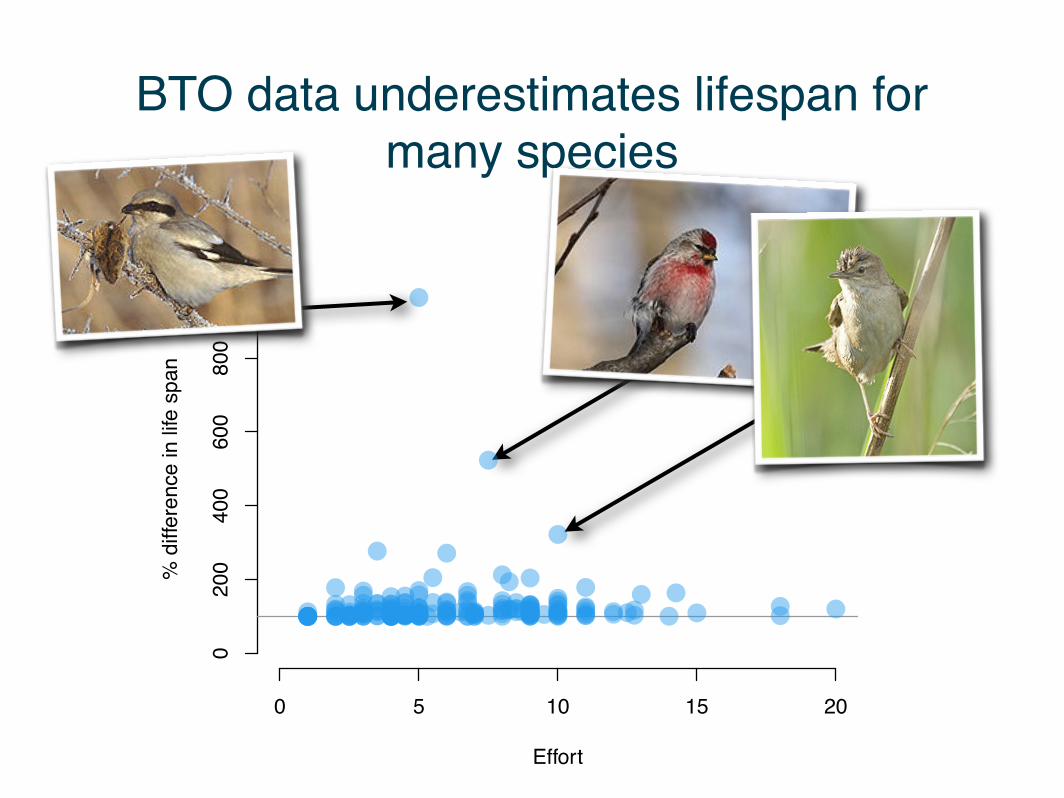
BTO data underestimates lifespan for many species
Effort
% d
iffer
ence
in li
fe s
pan
0 5 10 15 20
020
040
060
080
010
00
BTO data underestimates lifespan for many species
Effort
% d
iffer
ence
in li
fe s
pan
0 5 10 15 20
020
040
060
080
010
00
Conclusions
• Life history patterns are moderated by phylogeny - we can use this information
• Method of correction is fundamentally important (i.e. evolutionary model assumed)
• Data issues can be solved
• Further analyses are in the pipeline!
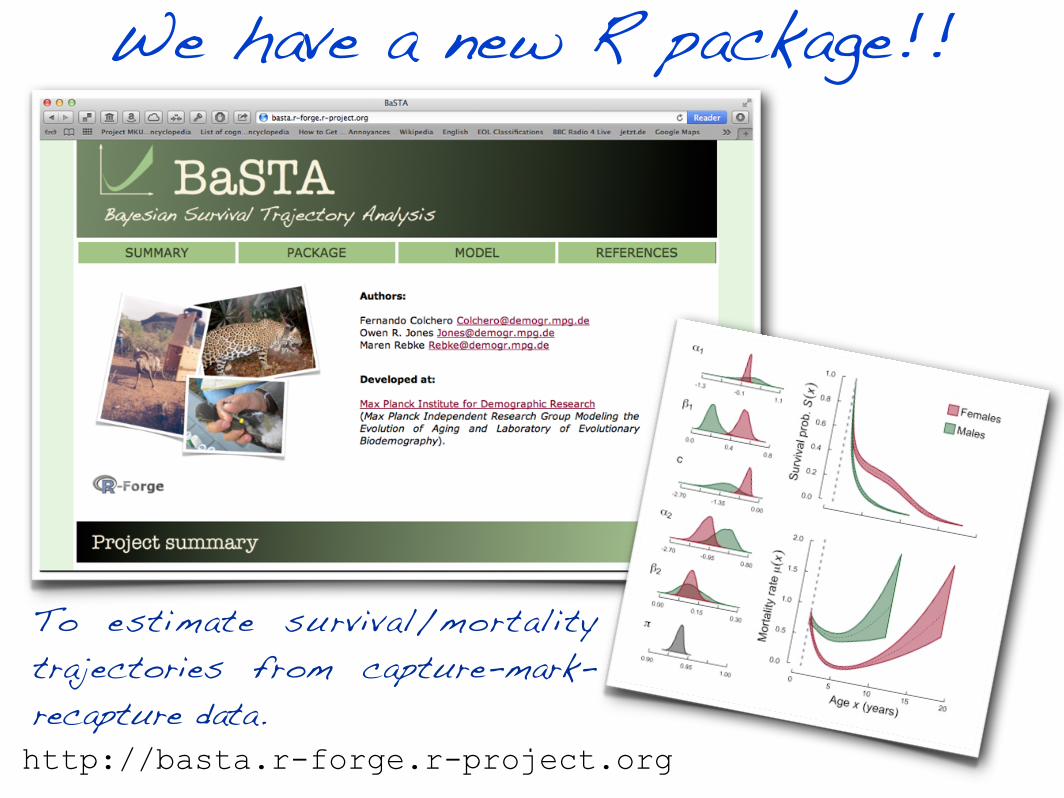
We have a new R package!!
http://basta.r-forge.r-project.org
To estimate survival/mortality trajectories from capture-mark-recapture data.