Embed Size (px)
Citation preview
START WORKING WITH DATA
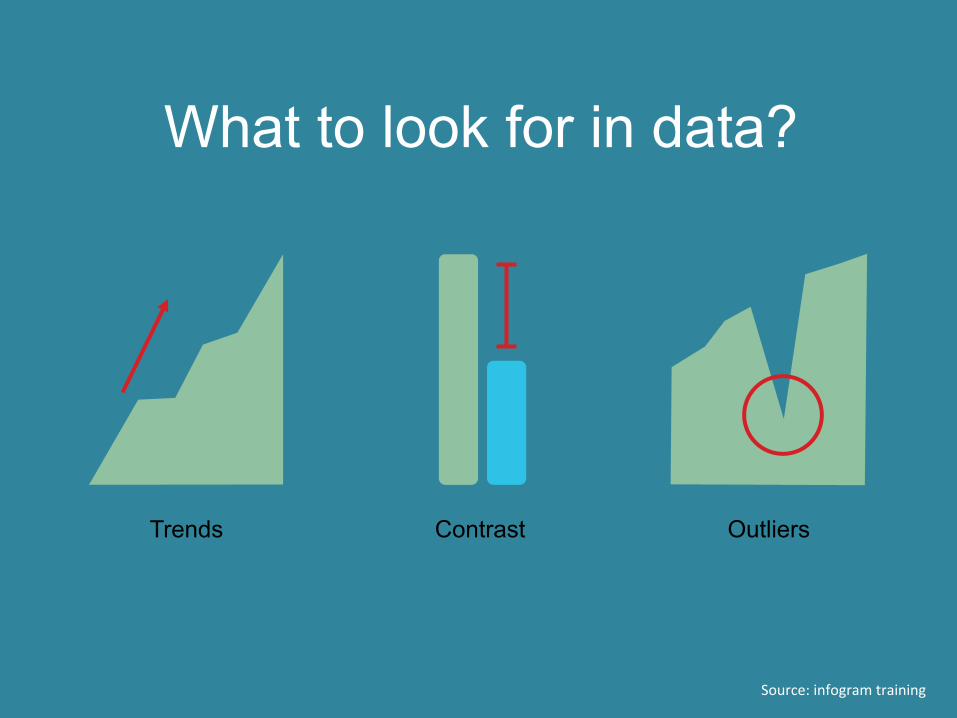
What to look for in data?
Trends Contrast Outliers
Source: infogram training
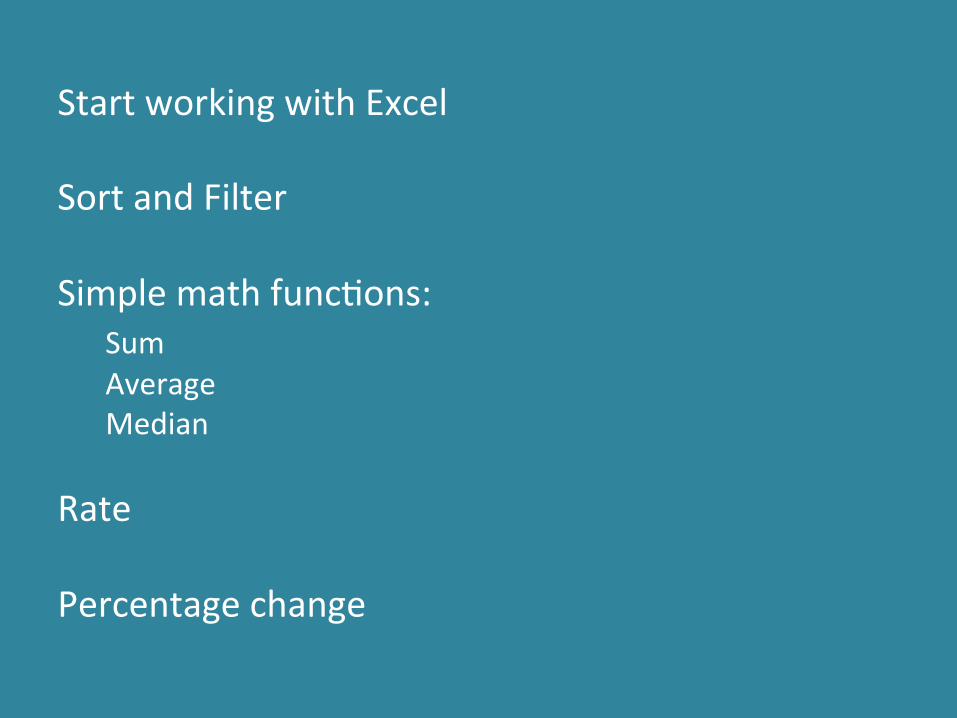
Start working with Excel Sort and Filter Simple math func9ons: Sum Average Median
Rate Percentage change
Sort and Filter
Open CSO Crime Sta9s9cs
hBp://www.cso.ie/px/pxeirestat/Sta9re/SelectVarVal/define.asp?
MainTable=CJQ03&ProductID=DB_CJ&PLanguage=0&Tabstrip=&PXSId=0&SessID=2261873&FF=1&grouping1=201110261037123737&grouping2=201110261038503737&\r
equency=4

Simple math func9ons: Sum Measures of centrality
Sum To add up a set of numbers.
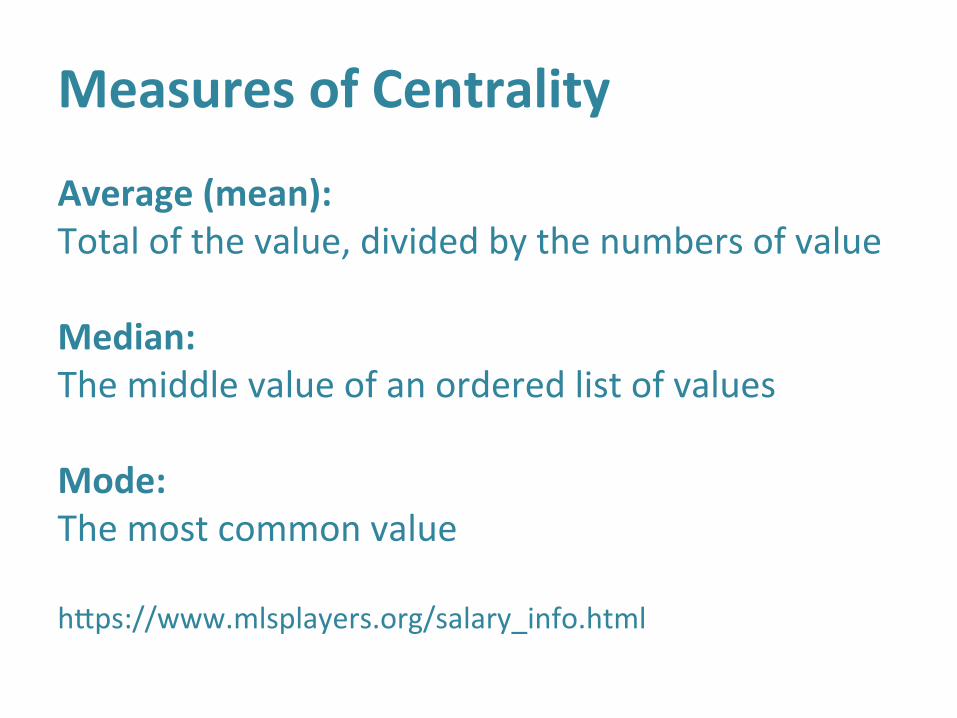
Measures of Centrality Average (mean): Total of the value, divided by the numbers of value Median: The middle value of an ordered list of values Mode: The most common value hBps://www.mlsplayers.org/salary_info.html
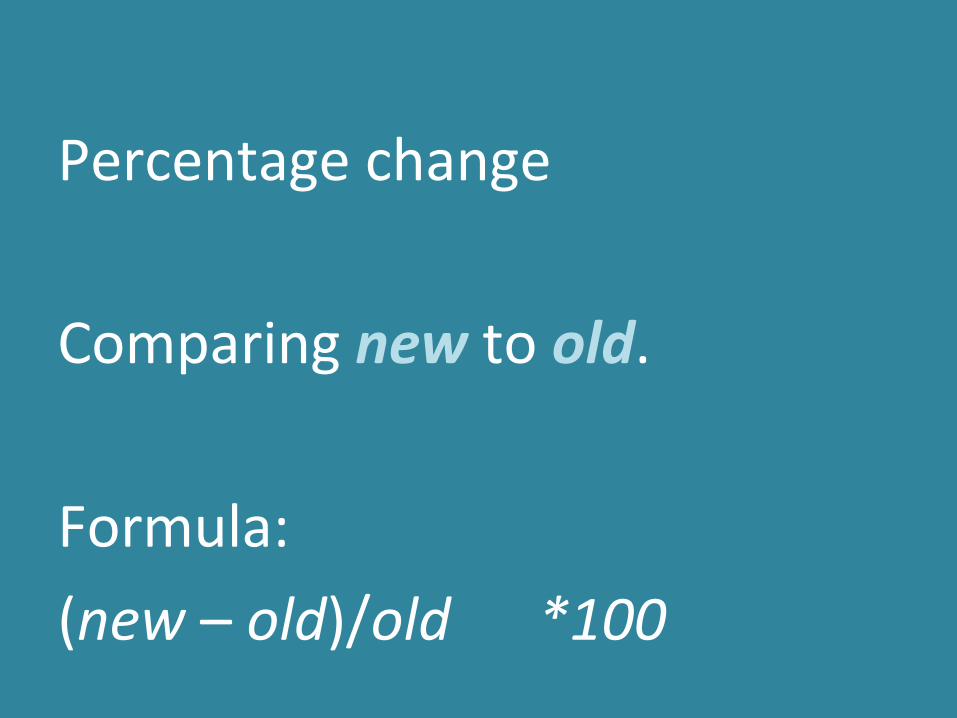
Percentage change Comparing new to old. Formula: (new – old)/old *100
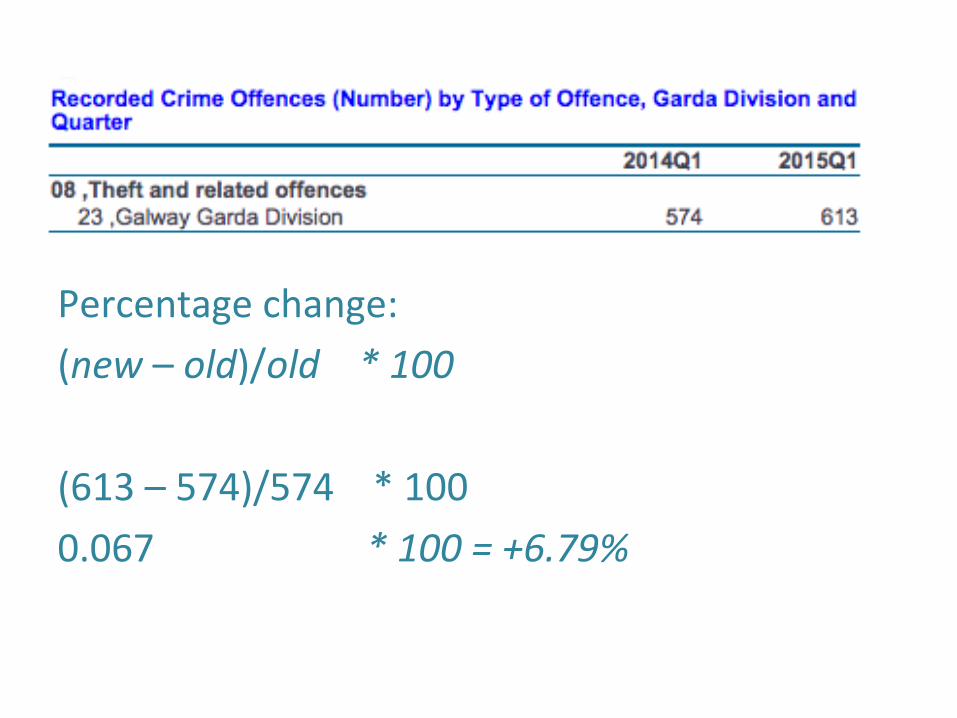
Percentage change: (new – old)/old * 100 (613 – 574)/574 * 100 0.067 * 100 = +6.79%
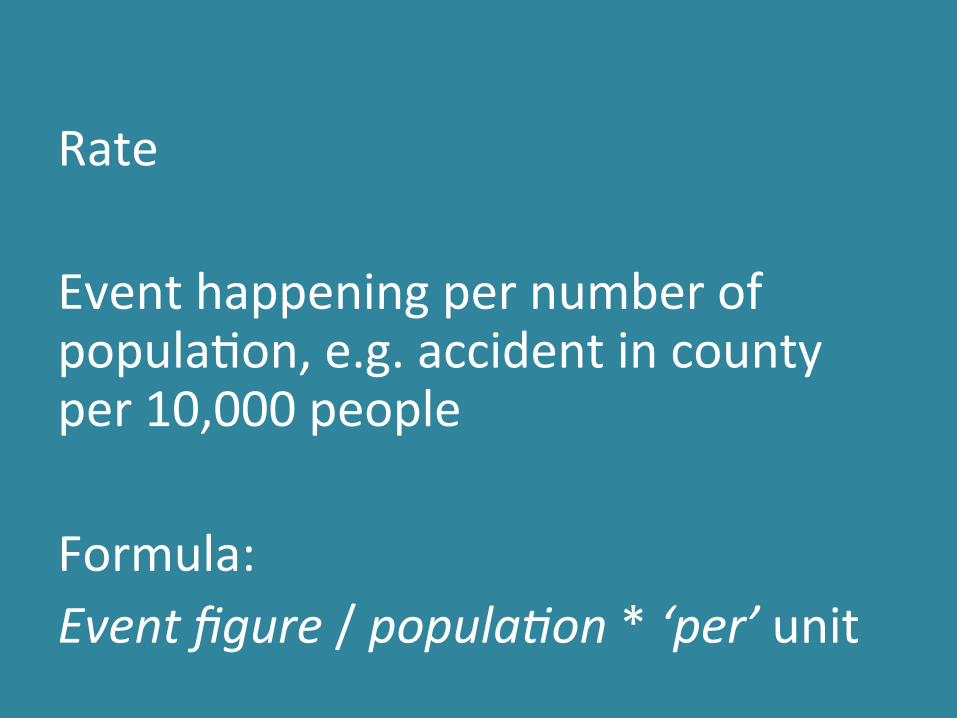
Rate Event happening per number of popula9on, e.g. accident in county per 10,000 people Formula: Event figure / popula;on * ‘per’ unit
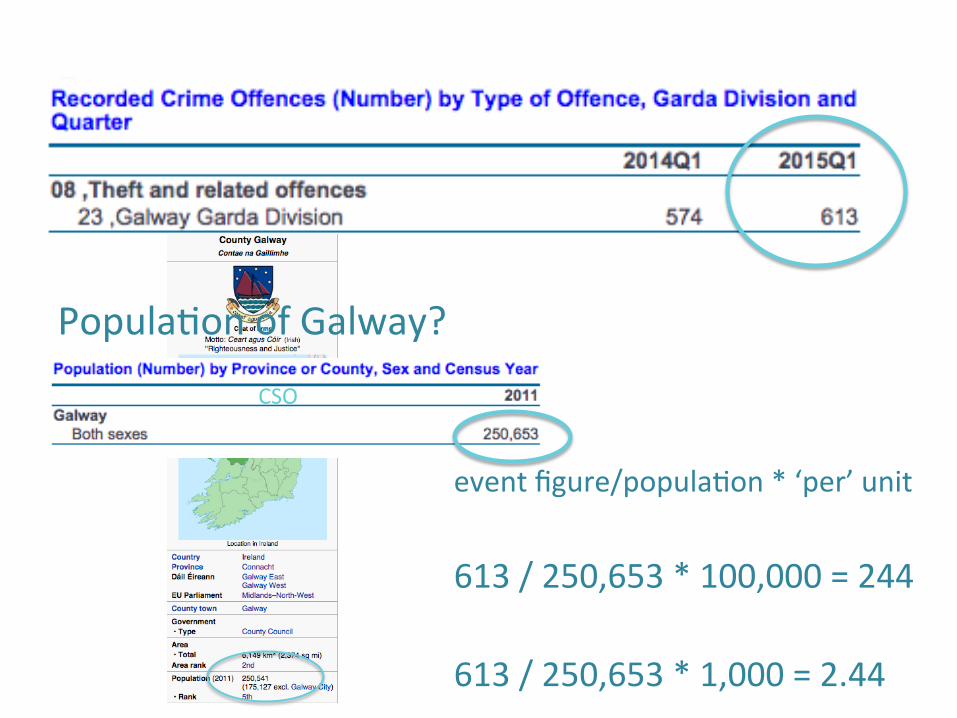
event figure/popula9on * ‘per’ unit 613 / 250,653 * 100,000 = 244 613 / 250,653 * 1,000 = 2.44
Popula9on of Galway?
CSO
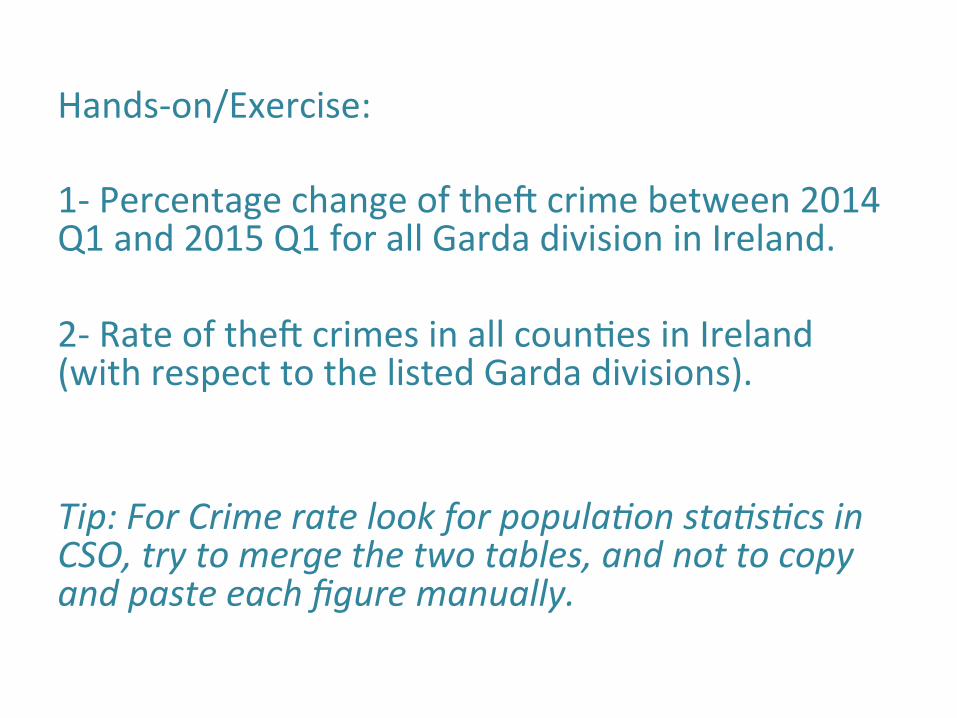
Hands-‐on/Exercise: 1-‐ Percentage change of thej crime between 2014 Q1 and 2015 Q1 for all Garda division in Ireland. 2-‐ Rate of thej crimes in all coun9es in Ireland (with respect to the listed Garda divisions). Tip: For Crime rate look for popula;on sta;s;cs in CSO, try to merge the two tables, and not to copy and paste each figure manually.
Resources: Data Journalism Handbook, Chapter: “Understanding Data”. Newsroom Math Cheat Sheet, by Steve Doig Data Smart book, John Foreman.
TOOLS
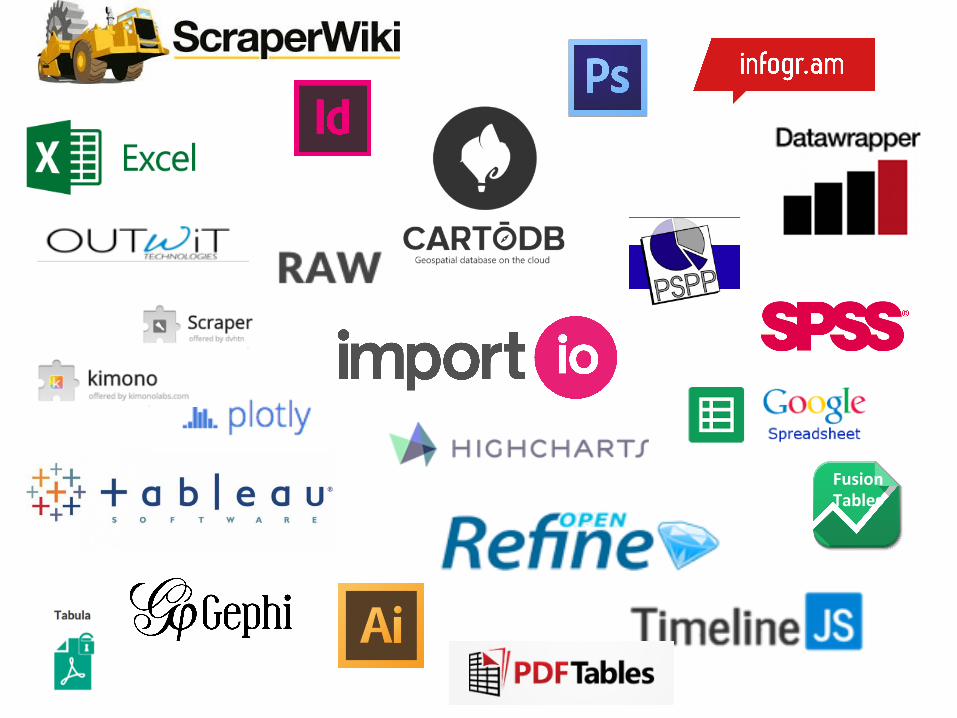
Fusion Tables

QuesGons?
@Bahareh360 Bahareh.Heravi@insight-‐centre.org