Embed Size (px)
Citation preview

Cycling by choice or necessity?Exploring the gender gap
in bicycling in Oregon
Patrick Singleton & Tara Goddard
Portland State University
Friday Transportation Seminar Series
29 January 2016 | Portland, OR

Gender gap in bicycling
2Gender gap in bicycling – Method & data – Results – Discussion
Pu
cher
, J.,
an
d R
. Bu
ehle
r. M
akin
g cy
clin
g ir
resi
stib
le: L
esso
ns
fro
m t
he
Net
her
lan
ds,
Den
mar
k an
d G
erm
any.
Tra
nsp
ort
Rev
iew
s, V
ol.
28
, No
. 4
, 20
08
, pp
. 49
5–5
28
.

Gender gap in bicycling
3Gender gap in bicycling – Method & data – Results – Discussion
Gar
rard
, J.,
S. H
and
y, a
nd
J. D
ill. W
om
en a
nd
cyc
ling.
In J
. Pu
cher
and
R.
Bu
ehle
r (E
ds.
), C
ity
Cyc
ling
(p
p. 2
11–2
34
). T
he
MIT
Pre
ss, C
amb
rid
ge,
MA
, 20
12
.
Gender gap in bicycling
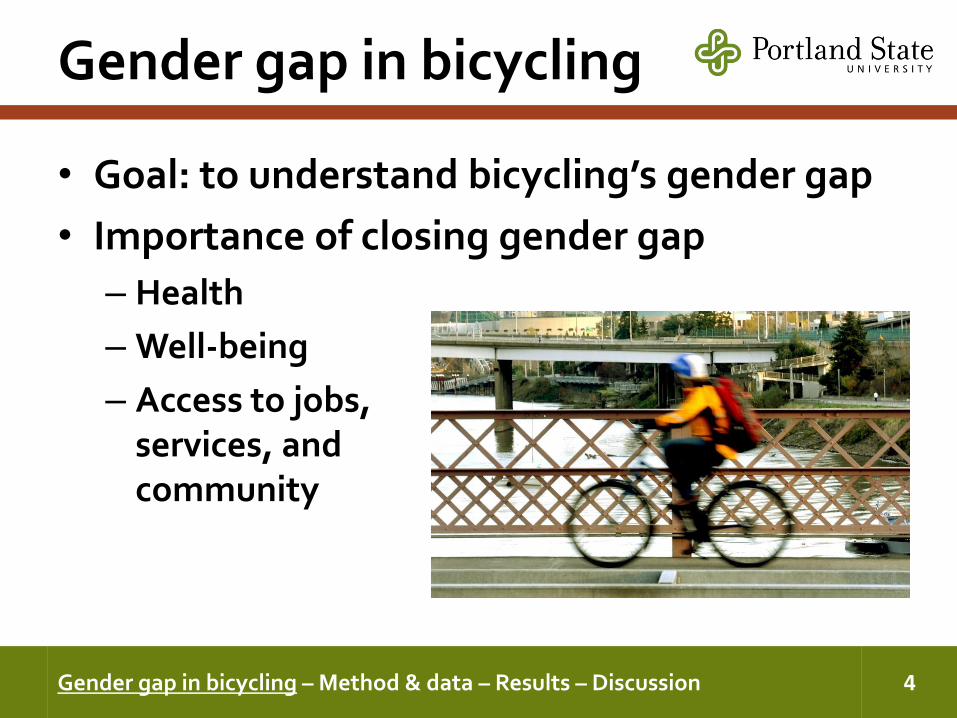
• Goal: to understand bicycling’s gender gap
• Importance of closing gender gap
– Health
– Well-being
– Access to jobs, services, and community
4Gender gap in bicycling – Method & data – Results – Discussion

Gender gap in bicycling
• Explanations
– Bicycle facility preferences & safety perceptions
– Household responsibilities & time constraints
– Social normative gender roles
Gender gap in bicycling – Method & data – Results – Discussion 5
https://www.flickr.com/photos/krawcowicz/4279213591/
https://www.flickr.com/photos/bike/196792901
Gender gap in bicycling
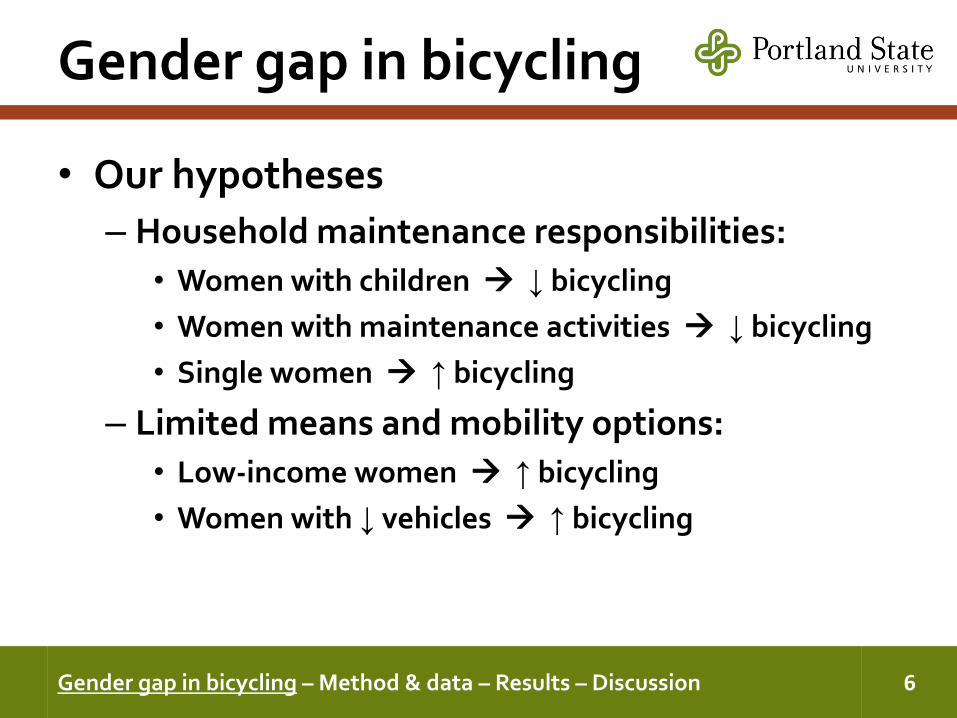
• Our hypotheses
– Household maintenance responsibilities:
• Women with children ↓ bicycling
• Women with maintenance activities ↓ bicycling
• Single women ↑ bicycling
– Limited means and mobility options:
• Low-income women ↑ bicycling
• Women with ↓ vehicles ↑ bicycling
Gender gap in bicycling – Method & data – Results – Discussion 6

Method & data
• Method
– Travel behavior: cross-sectional, one-day
– Bicycle use by gender across demographic and household variables
– For any characteristic, looked for reduced or increased gender gap in bicycling
– Suggest possible interventions; or identify target populations for interventions
Gender gap in bicycling – Method & data – Results – Discussion 7

Method & data
• Data
– One-day, household-based, travel diary survey
– Weighted
– 30,090 adults (age 18+)
Gender gap in bicycling – Method & data – Results – Discussion 8
OregonHousehold
Activity Survey(OHAS)
2009–2011

Method & data
• Bivariate analysis
– Pearson’s chi-squared tests of independence, two-way contingency tables
Gender gap in bicycling – Method & data – Results – Discussion 9
Made a bicycle trip
Normally commuted
by bicycle
BICYCLISTS
NON-BICYCLISTS
Bicycle use Women Men
Made a bicycle trip
2.8%(453)
5.5%(768)
Normally commuted by bicycle
2.2%(356)
4.8%(665)
Bicyclists 3.6%(590)
7.4%(1,023)

Results
Gender gap in bicycling – Method & data – Results – Discussion 10
1.5%
4.1%
3.3%2.9%
6.2%
2.1%
3.0%
3.8%
7.9%7.3%
6.8%
8.2% 8.1%
9.2% 9.2%
7.0%
0%
5%
10%
15%
1 2+ 0 1 2 3+ Yes No
Number of people in
household
Number of children in household Presence of children aged
6-11 in household
Women Men
7.4%
3.6%
Percentage of bicyclists by gender for demographics

Results
Gender gap in bicycling – Method & data – Results – Discussion 11
Percentage of bicyclists by gender for socioeconomics
5.1%
0.9%0.4%
2.4%
6.0%
3.0%
3.8% 3.8%
8.2%
5.3%4.8%
4.4%
11.1%
8.5%
6.8% 6.6%
0%
5%
10%
15%
Yes No Not a HS
grad
HS grad,
some college
College grad $0–35k $35–75k $75k+
Worker status Education level Household income
Women Men
7.4%
3.6%

Results
Gender gap in bicycling – Method & data – Results – Discussion 12
Percentage of bicyclists by gender for mobility characteristics
3.9%
1.5%1.9%
11.7%
2.3%
4.6%
7.4%
16.3%
7.2%
8.6%
16.6%15.6%
5.1%
9.4%
14.2%
23.0%
0%
5%
10%
15%
20%
25%
Yes No 0 0.01–0.99 1+ 0.01–0.99 1 1.01+
Driver license holding Number of vehicles per licensed driver
in household
Number of bicycles per person in
household
Women Men
7.4%
3.6%

Results
Gender gap in bicycling – Method & data – Results – Discussion 13
Percentage of bicyclists by gender for trip and activity characteristics
1.1%
5.0%
2.5%
5.6%
4.5%
2.7%
3.7%
2.2%
3.6%
2.0%
5.4%
6.8%
8.2%
6.6%
5.4%
6.9%
5.8%
7.7%
6.3% 6.3%
0%
5%
10%
15%
0 1+ 1–240 241+ 0 1+ 1–30 31+ 0 1+
Number of trips for
work and/or school
Time spent at work
and/or school
Number of trips for
maintenance
activities
Time spent in
maintenance
activities
Number of trips for
escorting
Women Men
6.3%
3.2%

Discussion
• Women, household roles, and bicycling
– Household maintenance trip-making; time spent on maintenance activities:
• Women less likely to bicycle; men more likely.
• Women made more maintenance trips, and spent more time on maintenance activities.
– Presence of children:
• Women with 2+ children more likely to bicycle.
• Women with children aged 6–11 slightly less likely to bicycle; men more likely.
Gender gap in bicycling – Method & data – Results – Discussion 14

Discussion
• Bicycling as a choice– Women with more economic means and
mobility options were more likely to bicycle: • ↑ income, employed, Friday, driver license,
motor vehicle access, ↑ bicycles.
• Bicycling (or not) by necessity– Women with less economic means and limited
mobility options were less likely to bicycle: • < HS degree, not working, low-income HH, no
work/school trips, no driver license, zero-vehicle HH.
Gender gap in bicycling – Method & data – Results – Discussion 15

Discussion
• Potential policy implications
– Target low-bicycling women:
• Living alone or in single adult HH, < HS education, not working, no driver license, and/or living in low-income or zero-vehicle HH.
– Interventions:
• Infrastructure installations, awareness-raising, training, skills-building, and social events.
Gender gap in bicycling – Method & data – Results – Discussion 16

Discussion
• Future work
– Multivariate model of bicycling (gender × other variables)
– Multi-day travel survey, longitudinal data
– Data on built environment, bicycle facilities, safety, attitudes and preferences
– External validation of findings (beyond Oregon)
– Supplementary qualitative interviews, case studies, …, to ask: Why?
Gender gap in bicycling – Method & data – Results – Discussion 17

Questions?
Gender gap in bicycling – Method & data – Results – Discussion 18
Patrick Singleton [email protected]
Tara Goddard [email protected]