Embed Size (px)
Citation preview

Math 119 HonorsSUS AN MCCO URT SPR ING 2017DAY 2
Last Time• Syllabus• Project 1• Introductory Vocabulary• Descriptive Statistics• Measures of Center • Measures of Dispersion• Survey

StatCrunch• www.statcrunch.com• Basic features• Class space: MTH 119 Honors Spring 2017• Resources tabs gives help document and links to videos
to help you.• Also consider looking for what you want on youtube

Descriptive StatisticsPROJECT 1 – PART 2

StatCrunch Applet: Mean and Standard Deviation
• Follow the instructions• Discover and build your intuition• Take notes! • Ask questions of me and each other
• HINT: start learning the vocabulary and notation
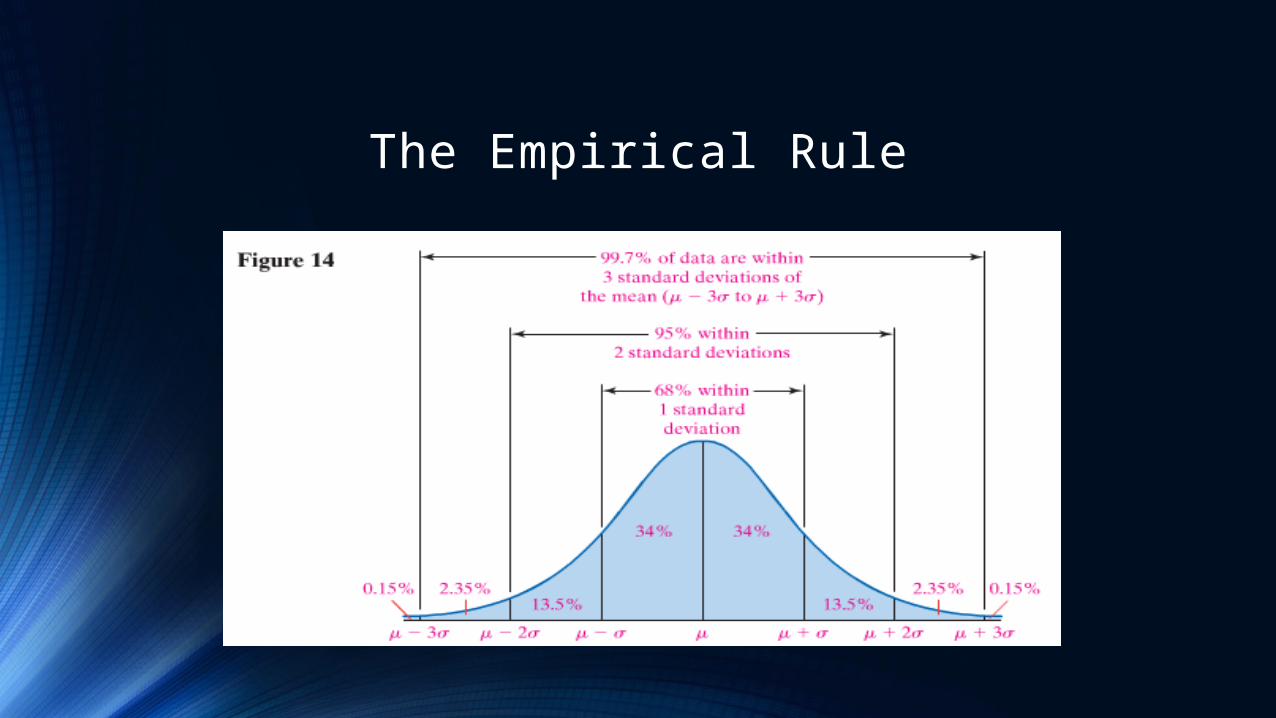
The Empirical Rule
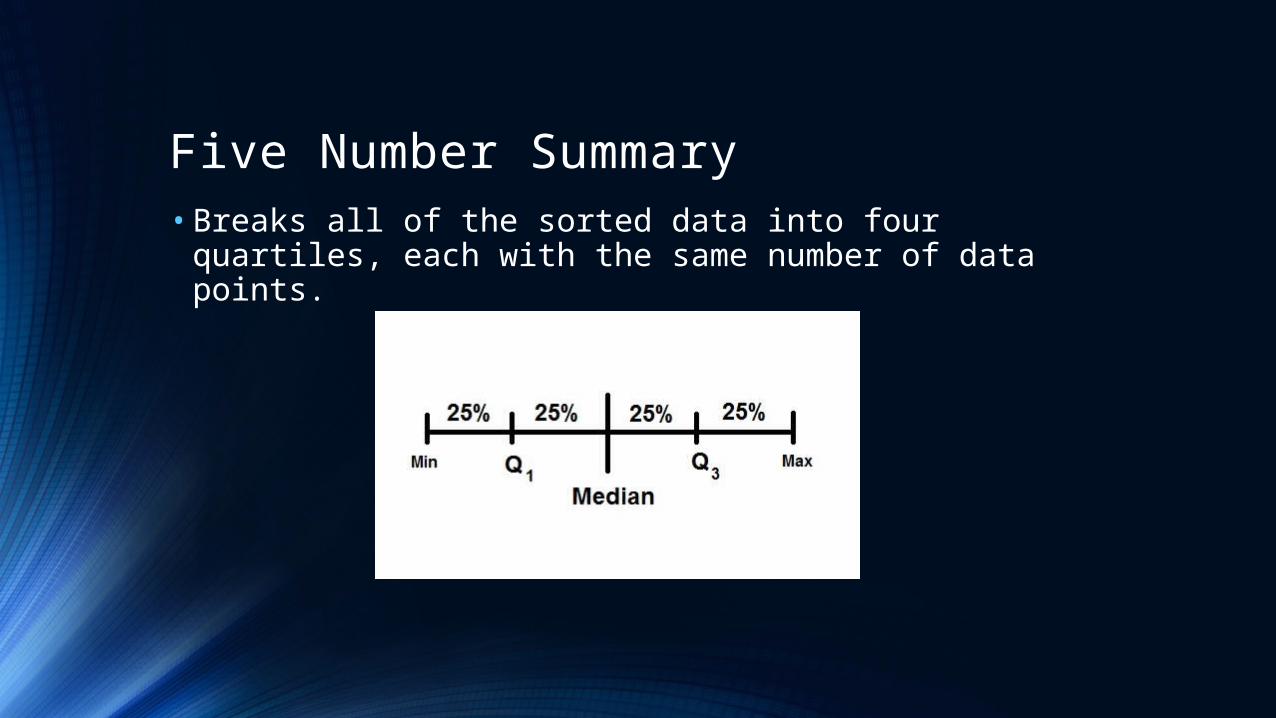
Five Number Summary• Breaks all of the sorted data into four quartiles, each
with the same number of data points.

Five Number Summary
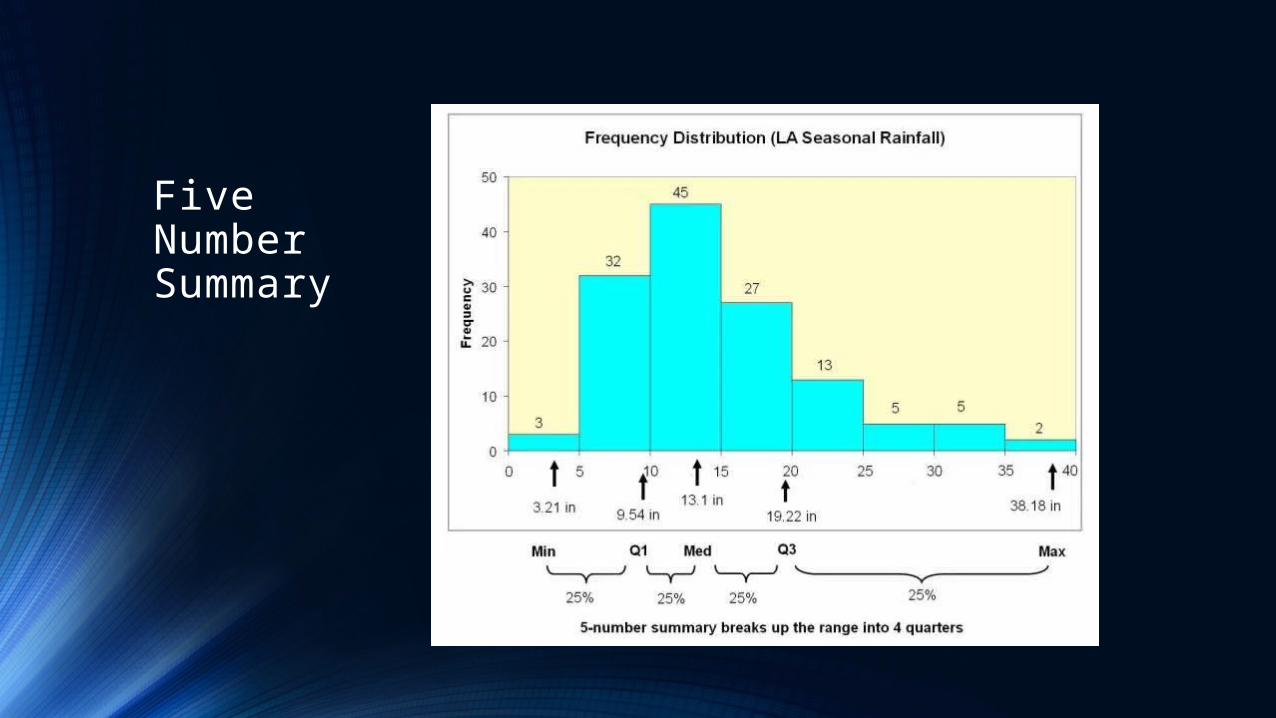
Five Number Summary
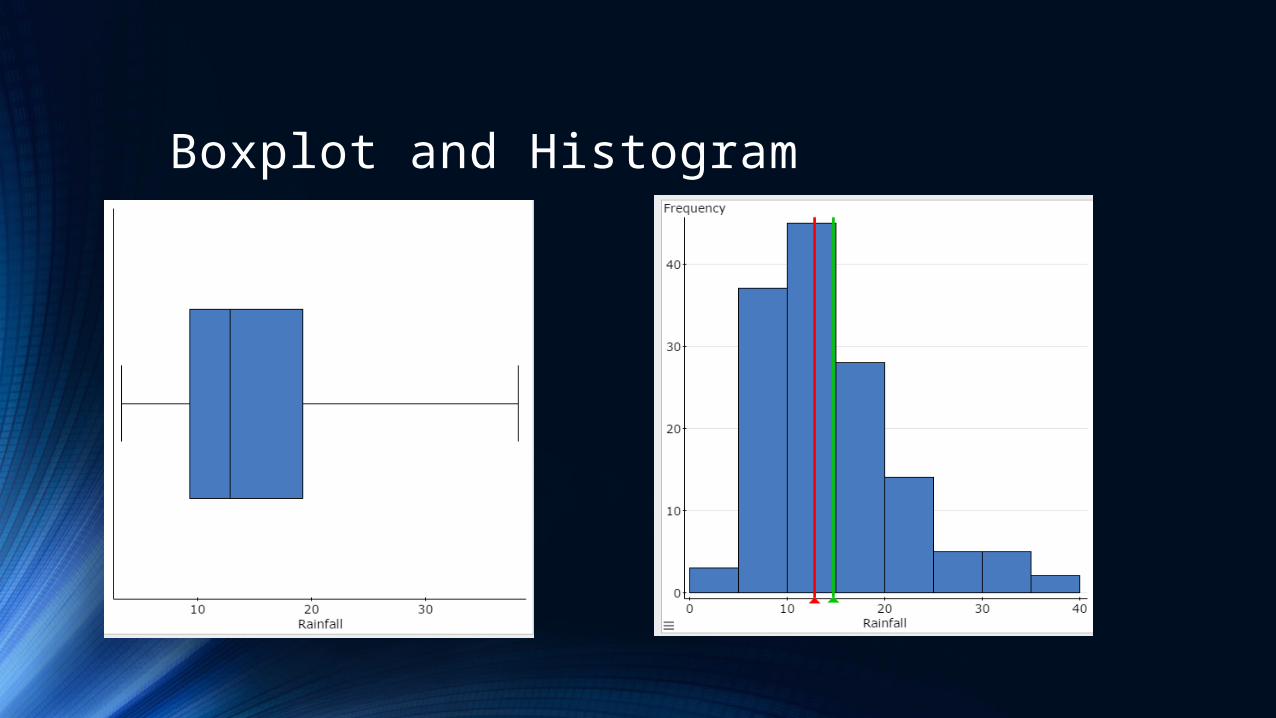
Boxplot and Histogram
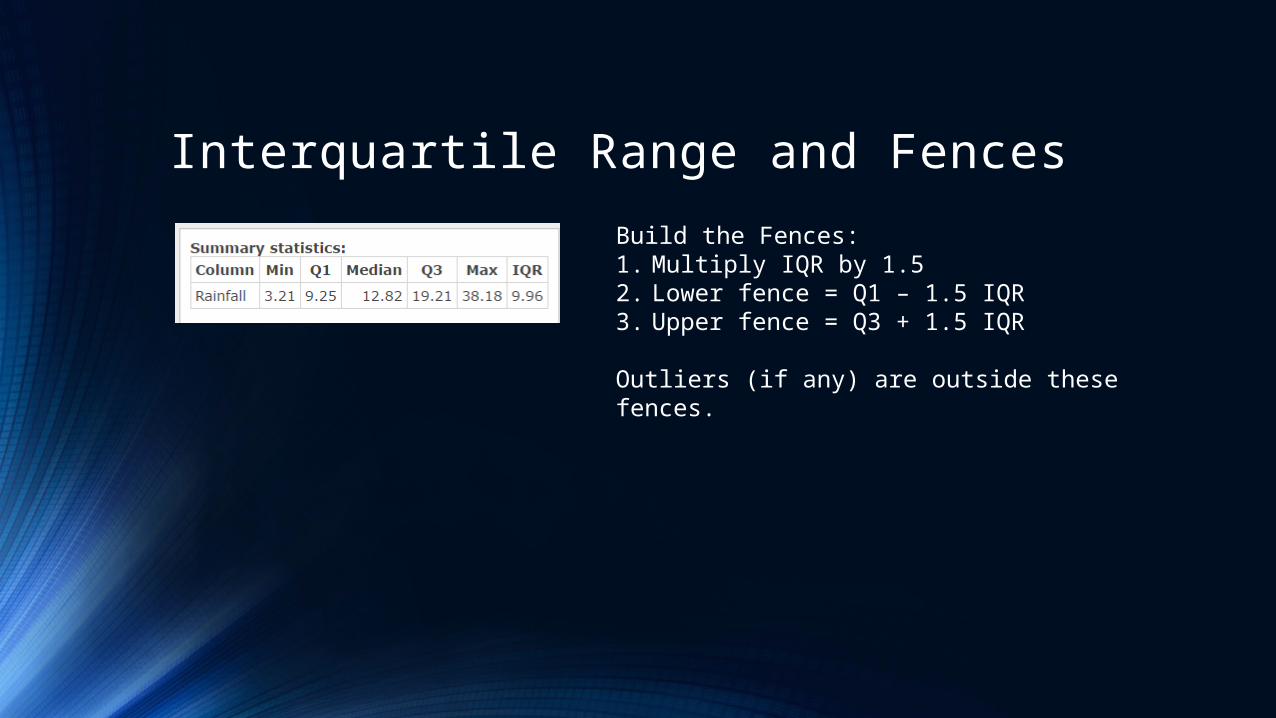
Interquartile Range and FencesBuild the Fences:1. Multiply IQR by 1.52. Lower fence = Q1 – 1.5 IQR3. Upper fence = Q3 + 1.5 IQR
Outliers (if any) are outside these fences.
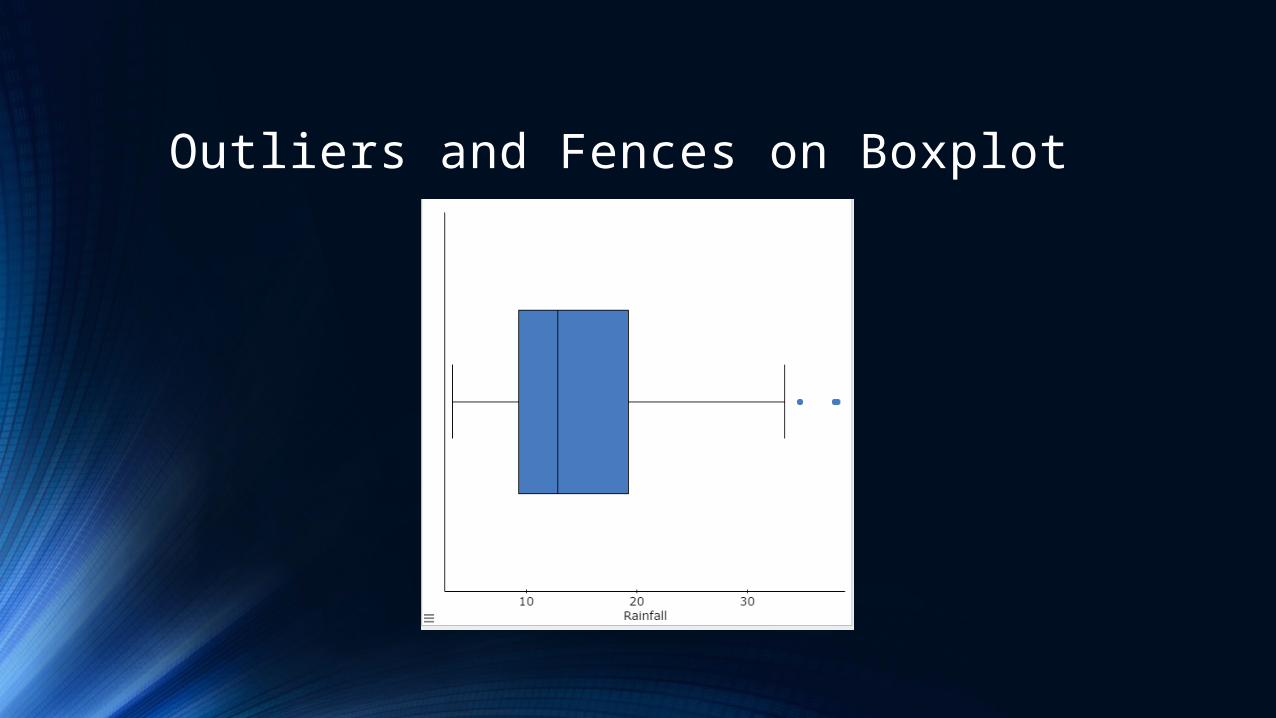
Outliers and Fences on Boxplot
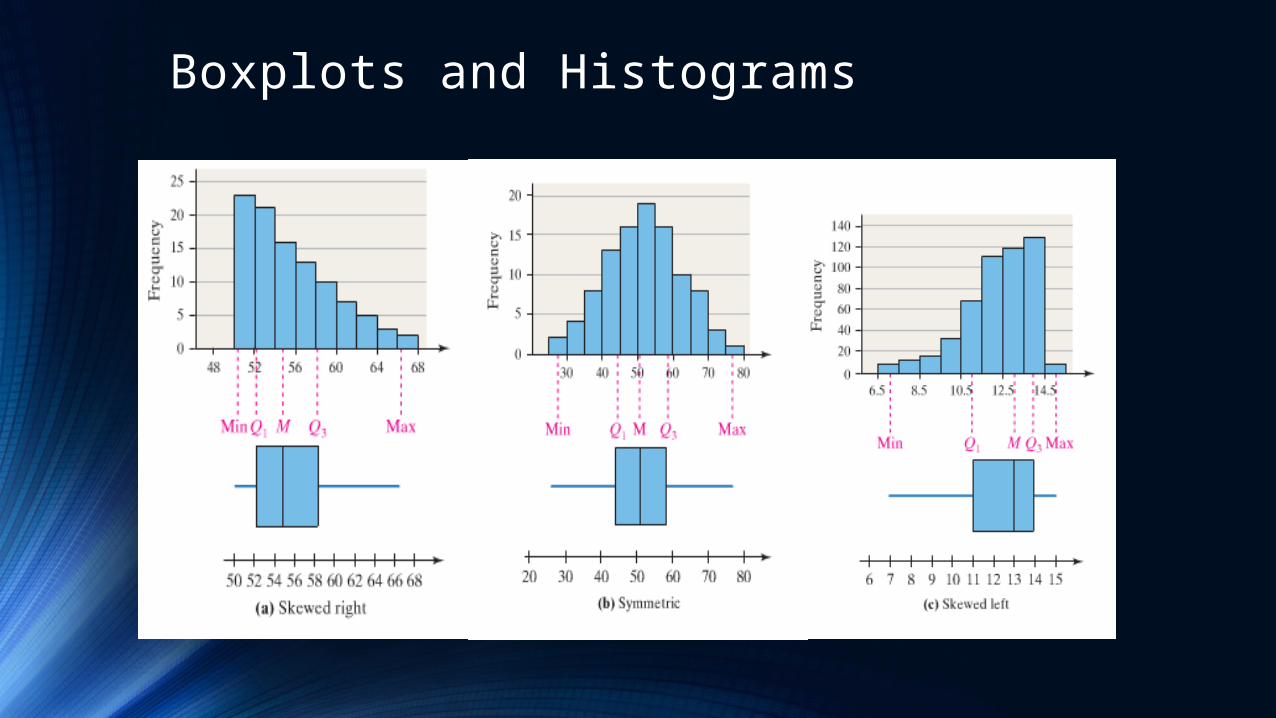
Boxplots and Histograms
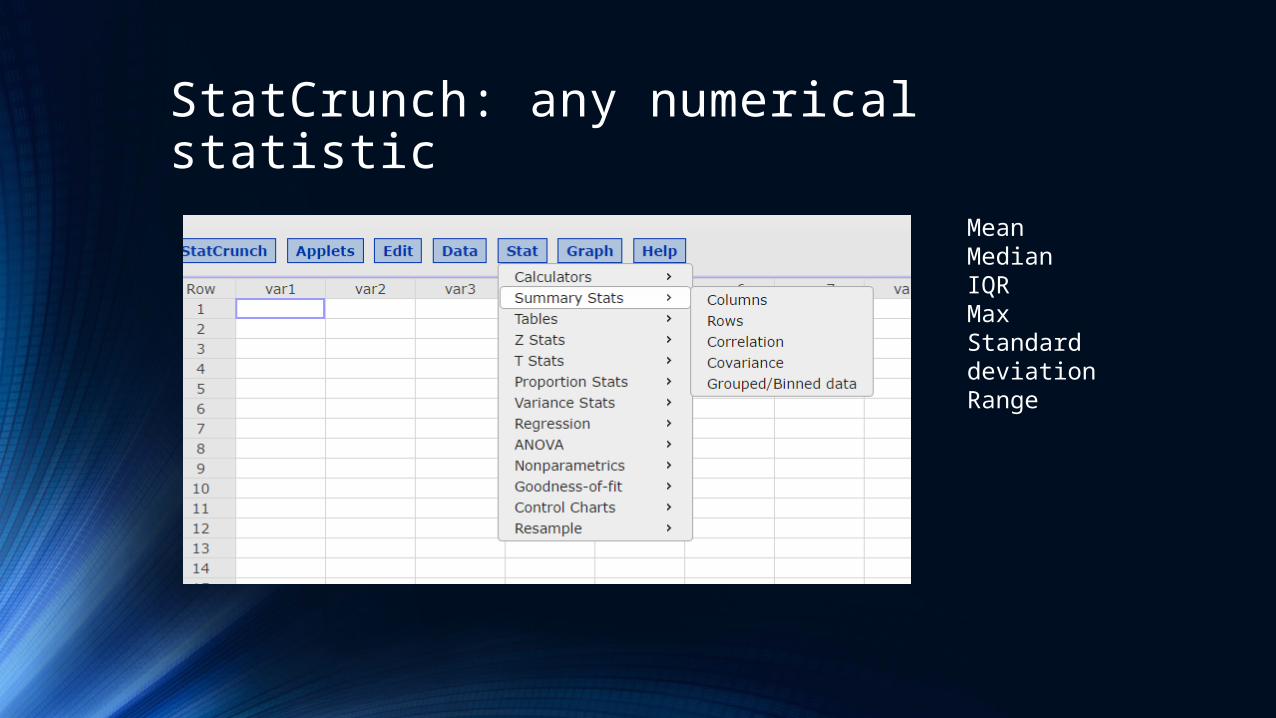
StatCrunch: any numerical statistic MeanMedianIQRMaxStandard deviationRange
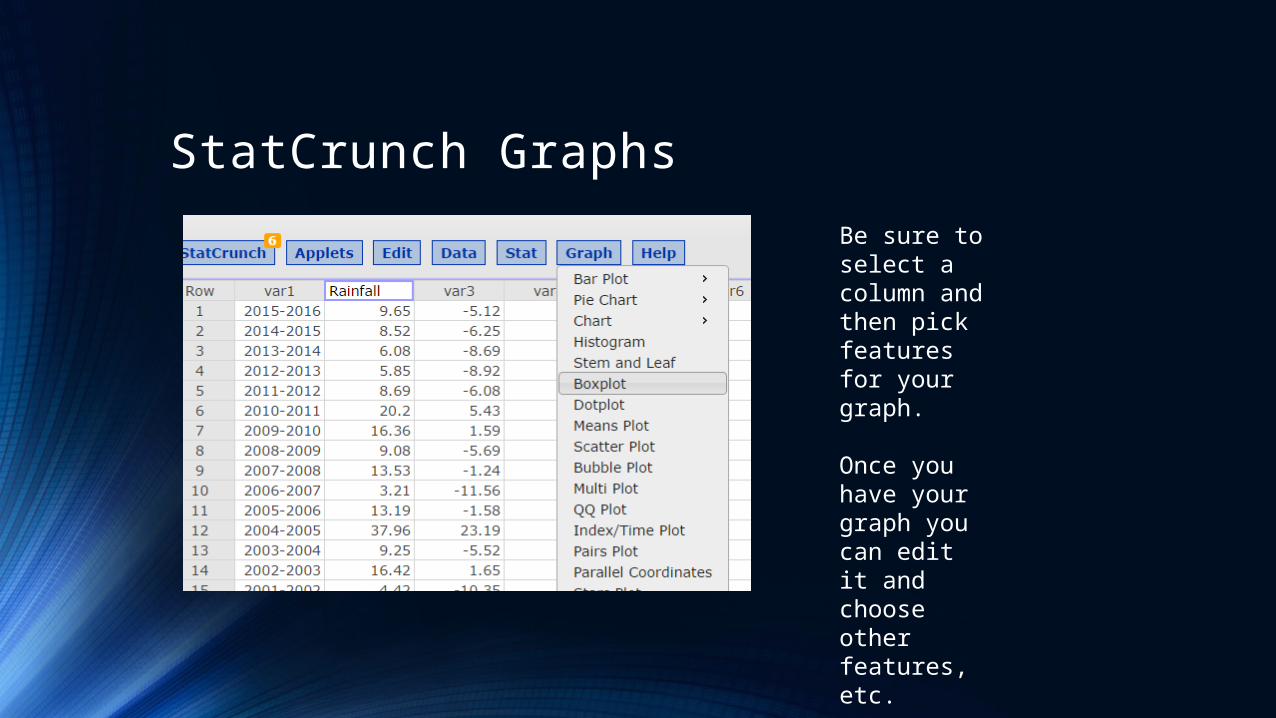
StatCrunch GraphsBe sure to select a column and then pick features for your graph.
Once you have your graph you can edit it and choose other features, etc.

Project 1• Course Material is covered• Groups• Data• Other ?

Closing• Questions?• Statcrunch• Survey