Embed Size (px)
Citation preview
Challenges, Opportunities andFinancial Health Overview
The HEFCE Conference
Professor Madeleine Atkins
Chief Executive
12th October 2017
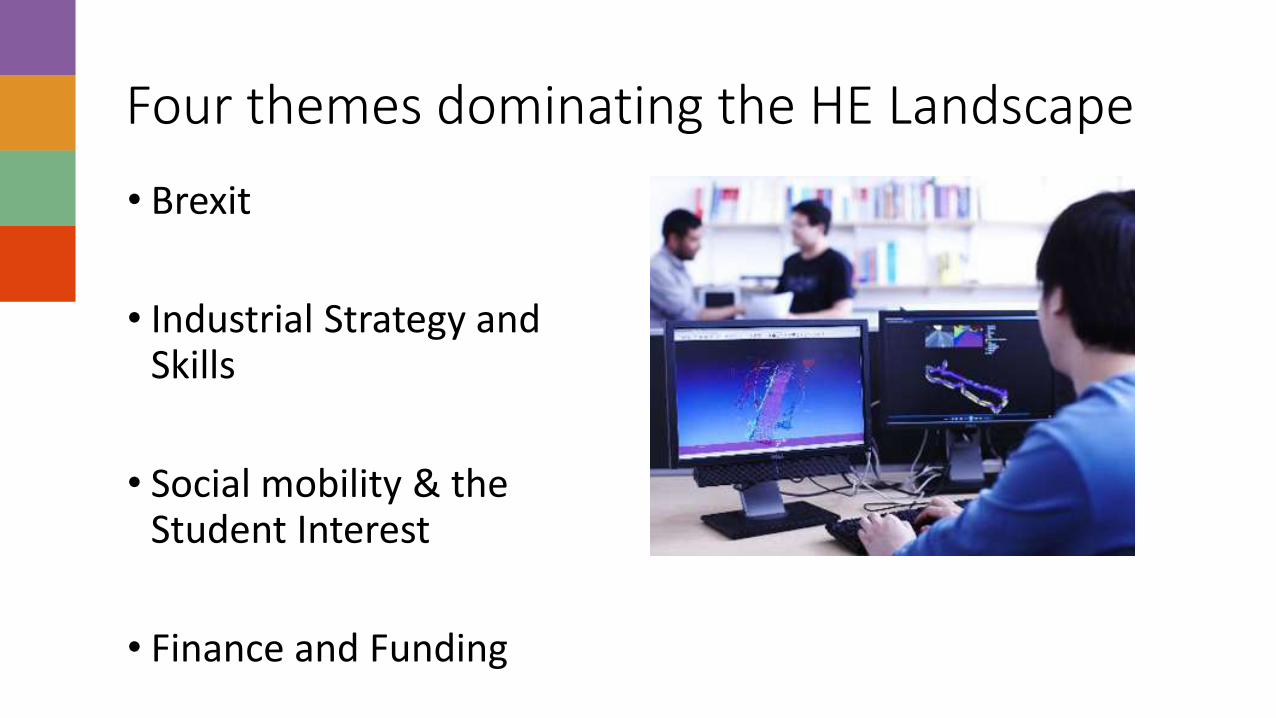
Four themes dominating the HE Landscape
• Brexit
• Industrial Strategy andSkills
• Social mobility & the Student Interest
• Finance and Funding
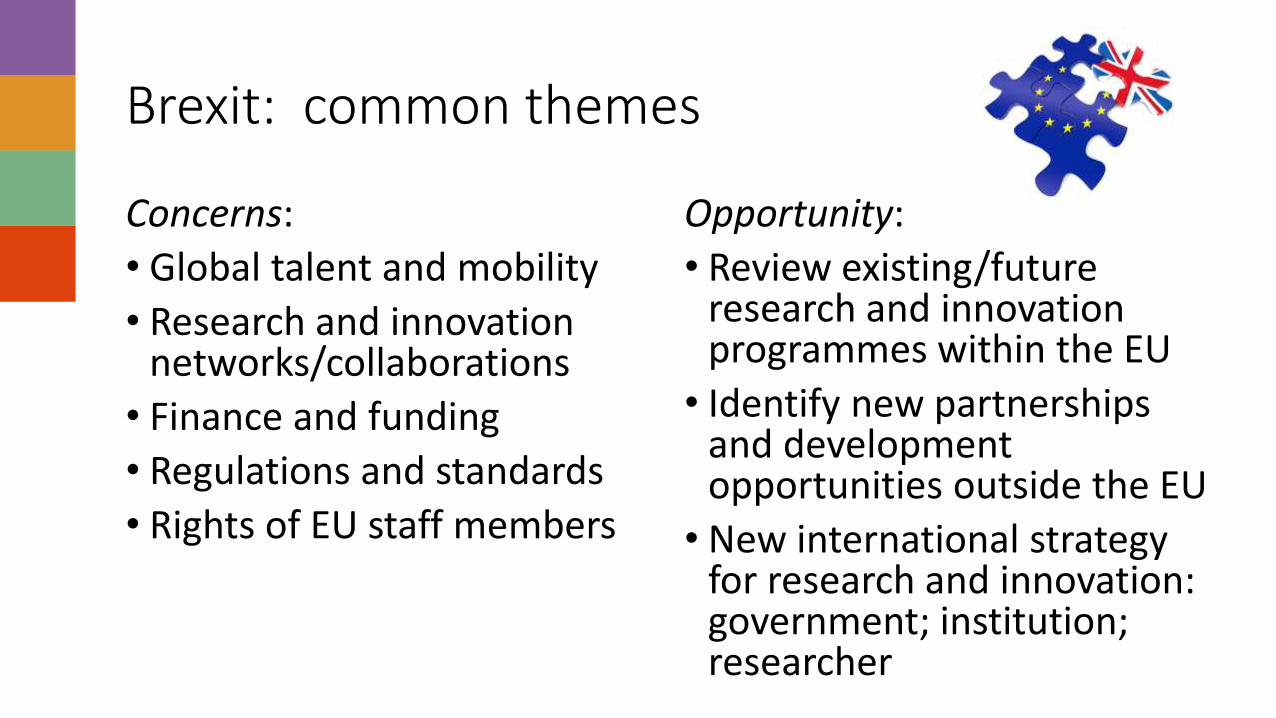
Brexit: common themes
Concerns:
• Global talent and mobility
• Research and innovation networks/collaborations
• Finance and funding
• Regulations and standards
• Rights of EU staff members
Opportunity:
• Review existing/future research and innovation programmes within the EU
• Identify new partnerships and development opportunities outside the EU
• New international strategy for research and innovation: government; institution; researcher

Industrial Strategy and Skills
• White Paper and Budget
• National skills initiatives
• Devo in England
• UKRI and OfS joint agendas
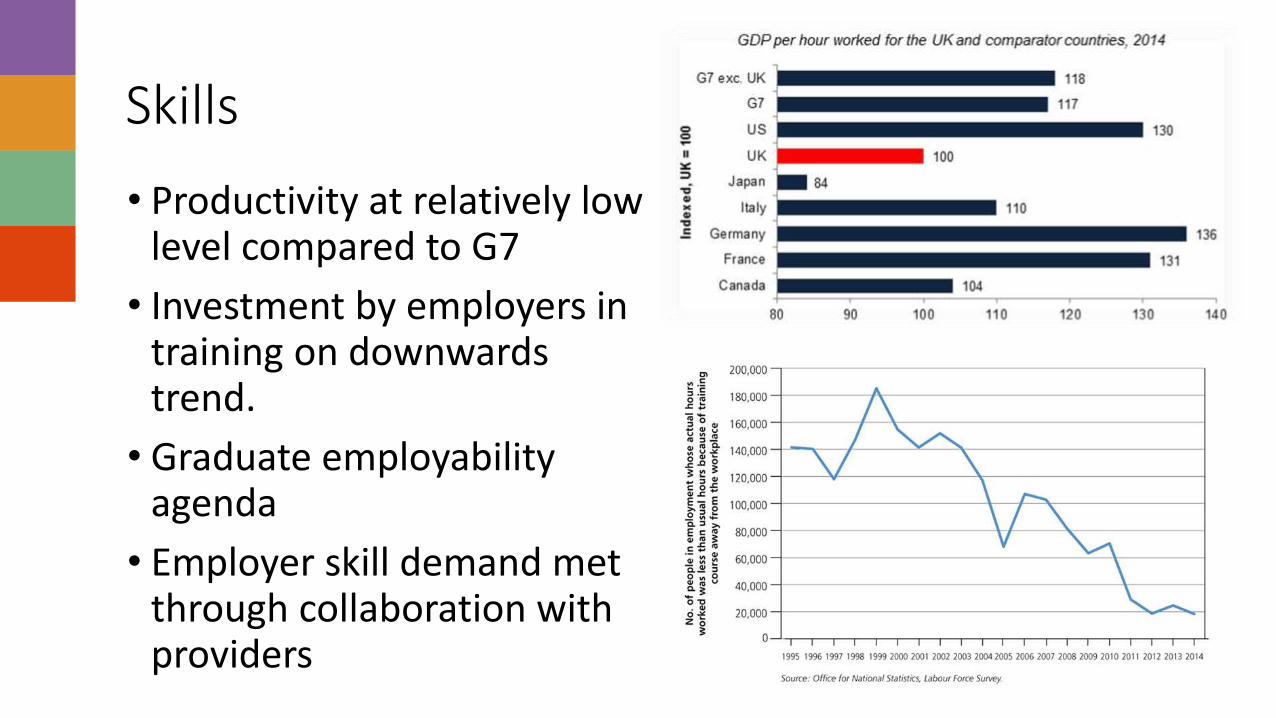
Skills
• Productivity at relatively low level compared to G7
• Investment by employers in training on downwards trend.
• Graduate employability agenda
• Employer skill demand met through collaboration with providers
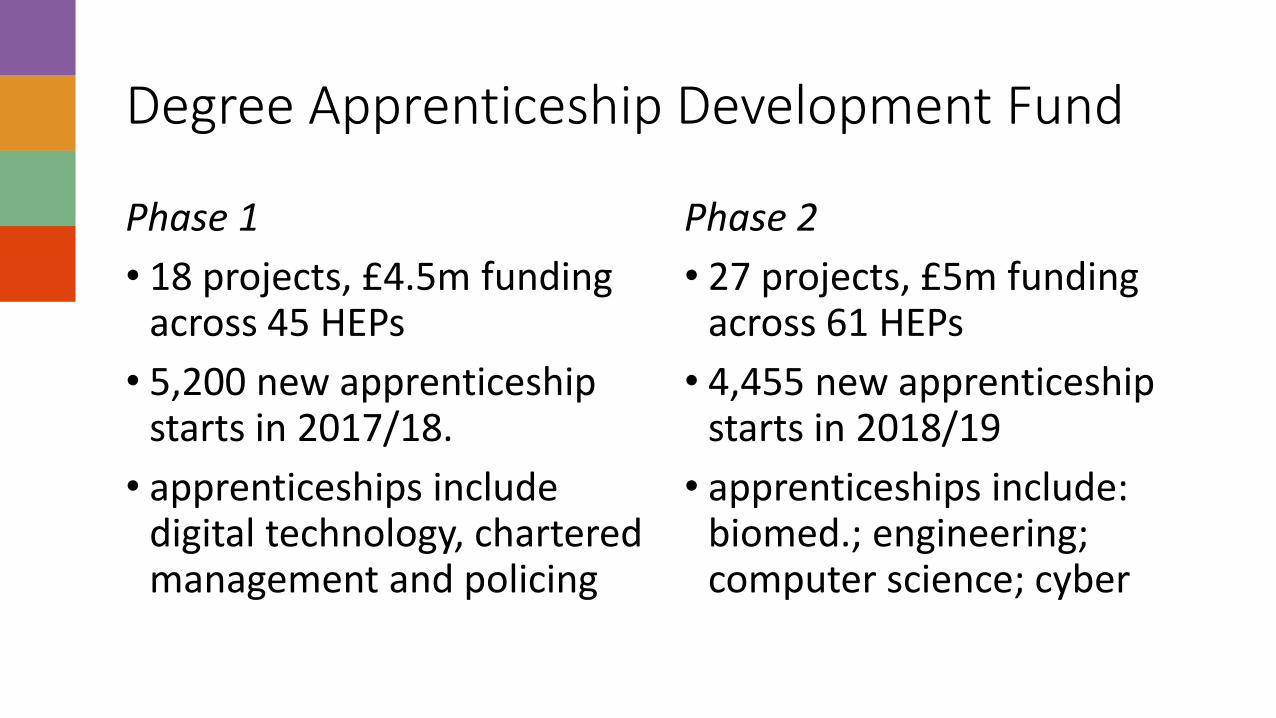
Degree Apprenticeship Development Fund
Phase 1
• 18 projects, £4.5m funding across 45 HEPs
• 5,200 new apprenticeship starts in 2017/18.
• apprenticeships include digital technology, chartered management and policing
Phase 2
• 27 projects, £5m funding across 61 HEPs
• 4,455 new apprenticeship starts in 2018/19
• apprenticeships include: biomed.; engineering; computer science; cyber
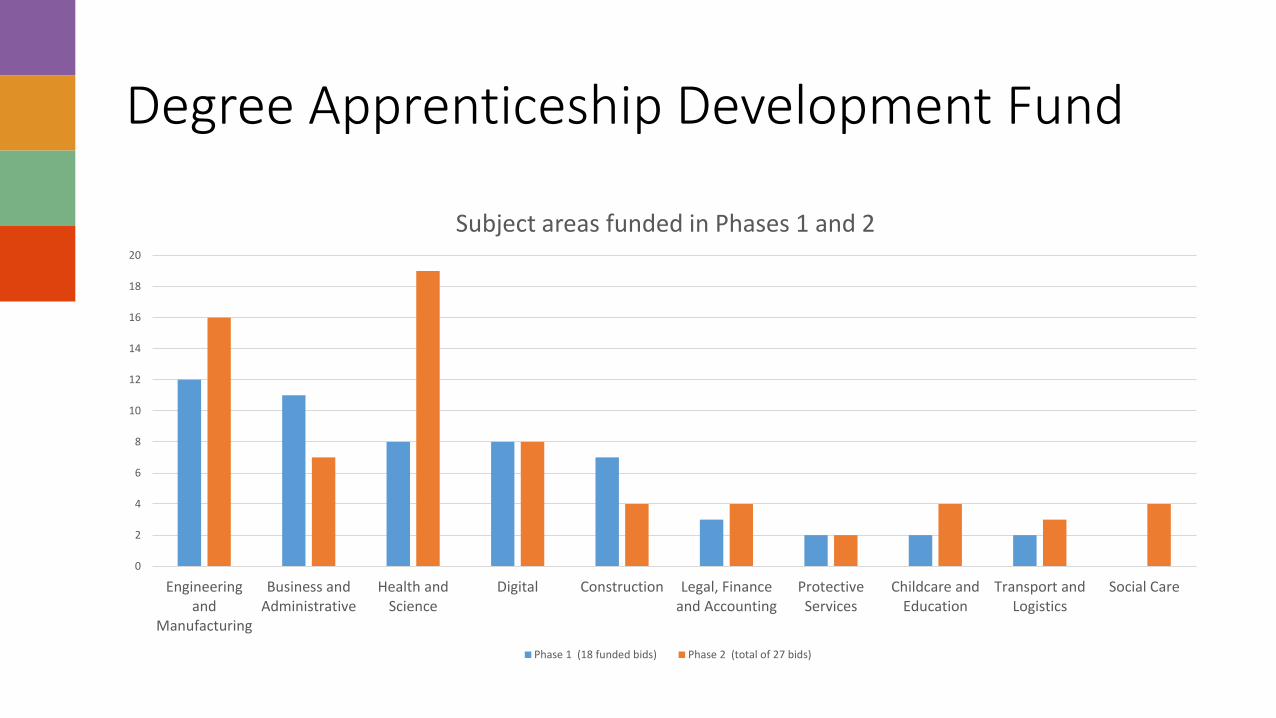
Degree Apprenticeship Development Fund
0
2
4
6
8
10
12
14
16
18
20
Engineeringand
Manufacturing
Business andAdministrative
Health andScience
Digital Construction Legal, Financeand Accounting
ProtectiveServices
Childcare andEducation
Transport andLogistics
Social Care
Subject areas funded in Phases 1 and 2
Phase 1 (18 funded bids) Phase 2 (total of 27 bids)
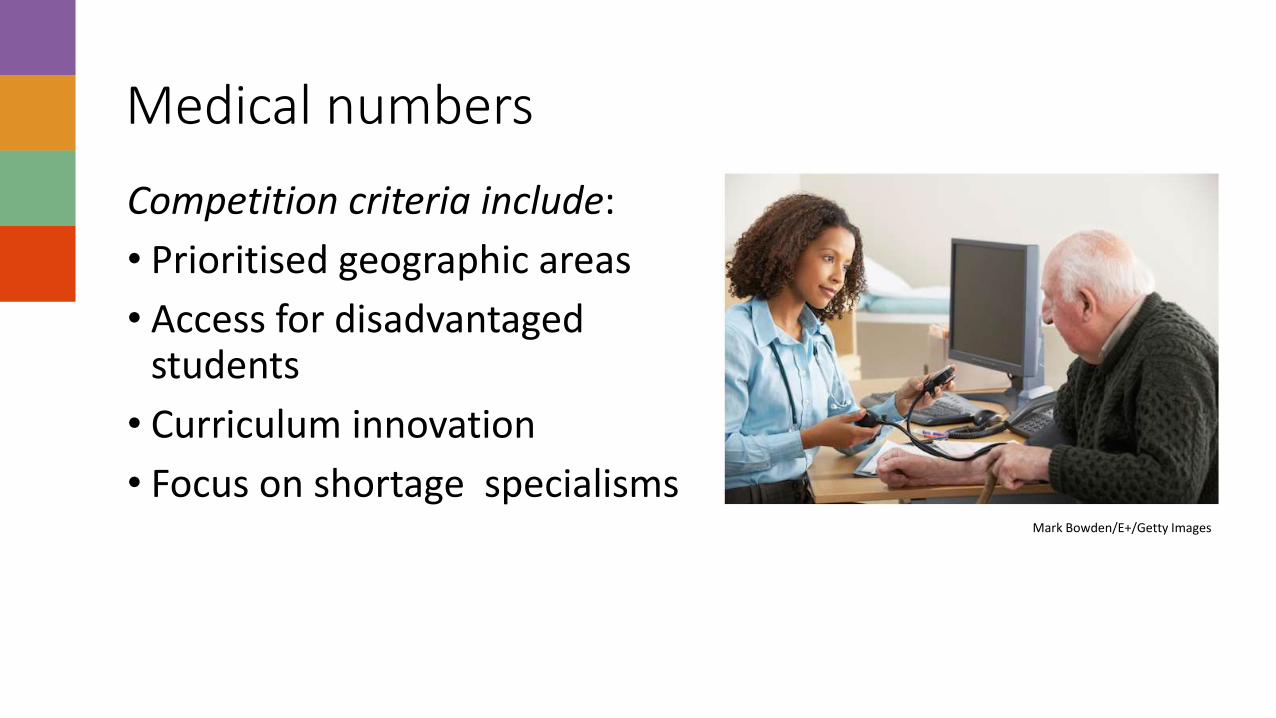
Medical numbers
Competition criteria include:
• Prioritised geographic areas
• Access for disadvantaged students
• Curriculum innovation
• Focus on shortage specialismsMark Bowden/E+/Getty Images
Some Joint Agendas: OfS and UKRI
• Place-making and anchor role
• Knowledge exchange/CPD
• Postgraduate developments
• Infrastructure funding
• Health of disciplines
• Interface between TEF and REF
Deloitte Economic Impact Study: Catalyst and Strategic Development Funds Hefce funding has achieved:
• Increased collaboration/partnerships
• Increased economic productivity
• Growth in SMEs
• Strengthening of “anchor role”
• Innovation across HE providers
• Return of £12 for every £1 over time
Social Mobility & the Student Interest
• Defining ‘students’
• End to end thinking
• Routes and choices
• Careers advice and information
• Potential of linked databases
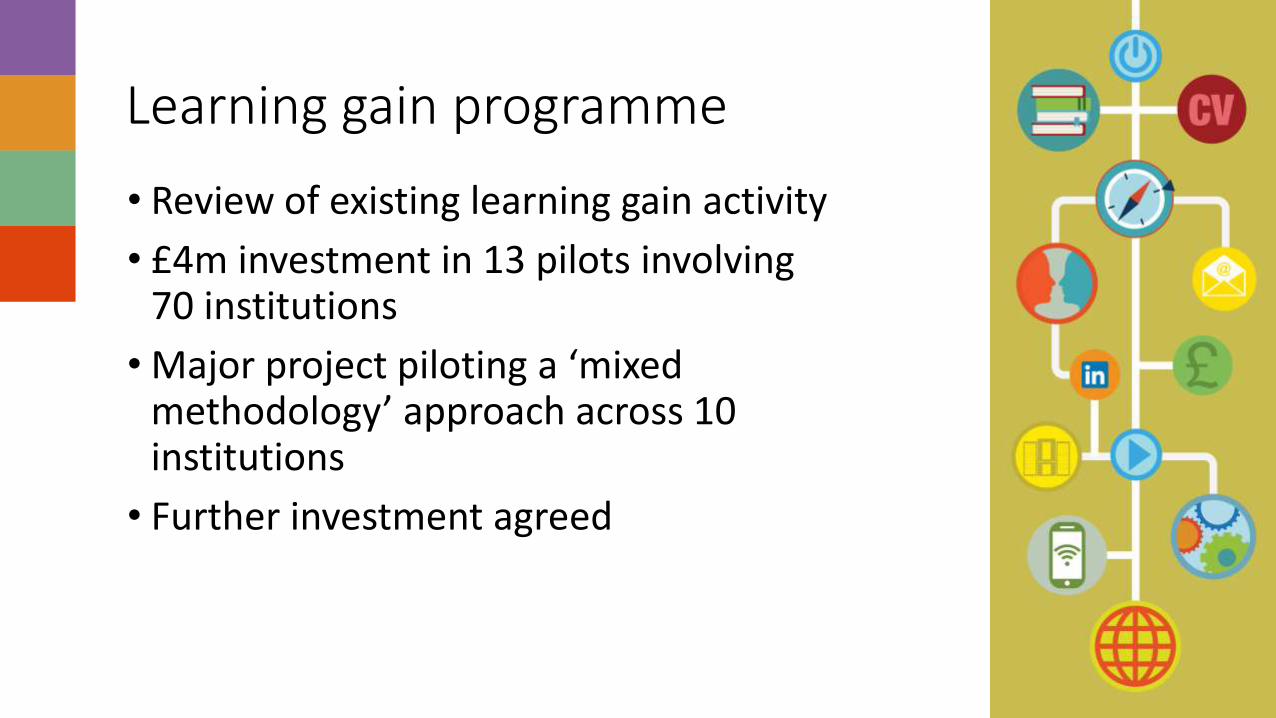
Learning gain programme
• Review of existing learning gain activity
• £4m investment in 13 pilots involving 70 institutions
• Major project piloting a ‘mixed methodology’ approach across 10 institutions
• Further investment agreed

Finance and Funding
• Student recruitment
• Financial forecasts
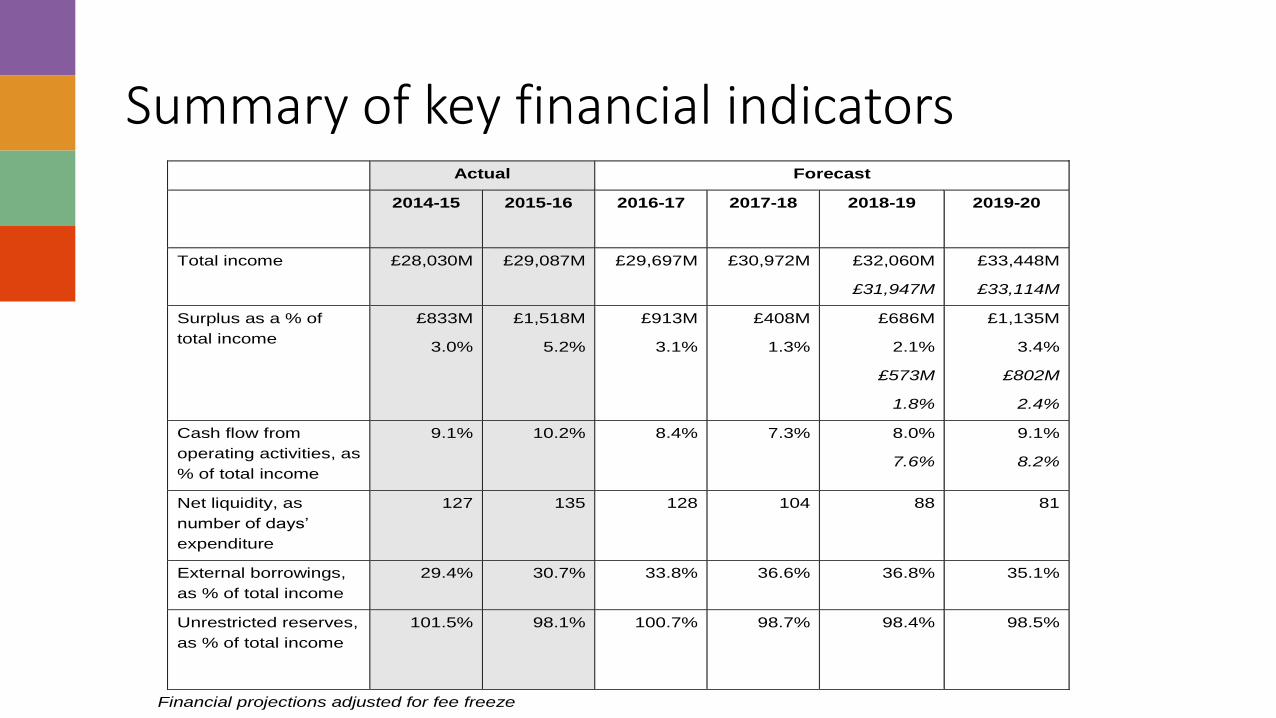
Summary of key financial indicators Actual Forecast
2014-15
2015-16 2016-17 2017-18 2018-19 2019-20
Total income
£28,030M £29,087M £29,697M £30,972M £32,060M
£31,947M
£33,448M
£33,114M
Surplus as a % of
total income
£833M
3.0%
£1,518M
5.2%
£913M
3.1%
£408M
1.3%
£686M
2.1%
£573M
1.8%
£1,135M
3.4%
£802M
2.4%
Cash flow from
operating activities, as
% of total income
9.1% 10.2% 8.4% 7.3% 8.0%
7.6%
9.1%
8.2%
Net liquidity, as
number of days’
expenditure
127 135 128 104 88 81
External borrowings,
as % of total income
29.4% 30.7% 33.8% 36.6% 36.8% 35.1%
Unrestricted reserves,
as % of total income
101.5% 98.1% 100.7% 98.7% 98.4% 98.5%
Financial projections adjusted for fee freeze
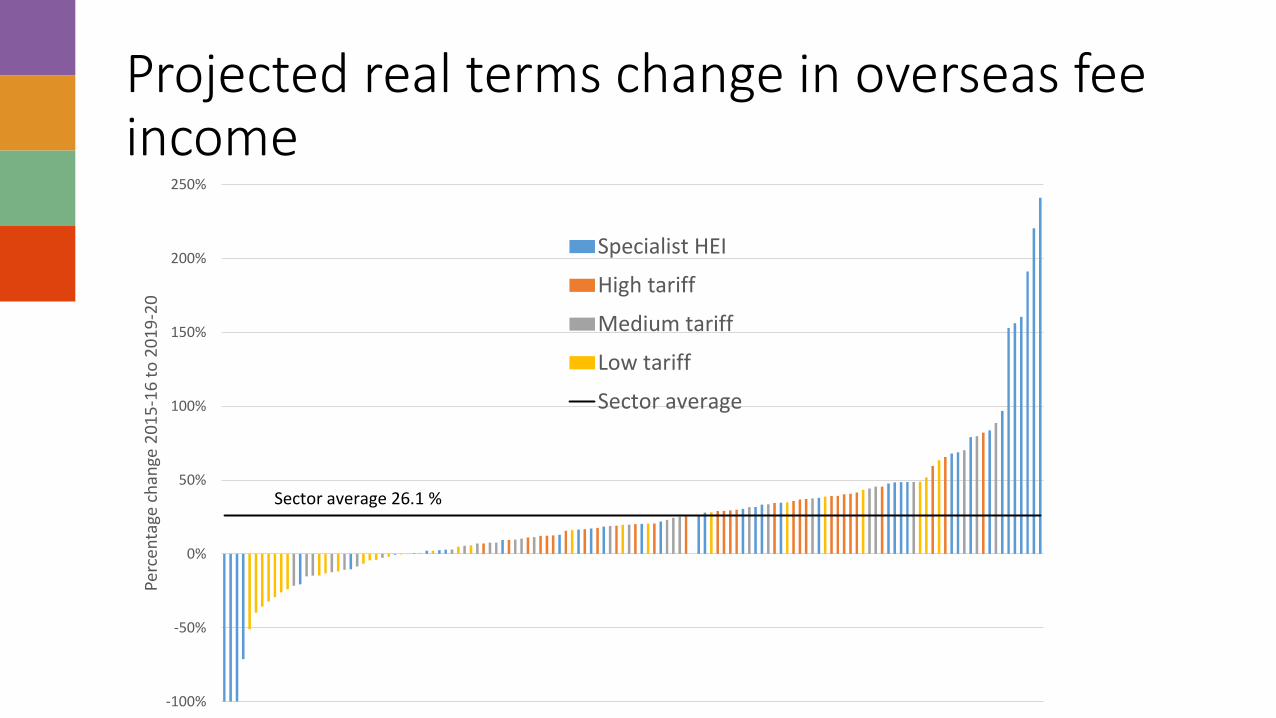
Projected real terms change in overseas fee income
-100%
-50%
0%
50%
100%
150%
200%
250%
Perc
enta
ge c
han
ge 2
01
5-1
6 t
o 2
01
9-2
0
Specialist HEI
High tariff
Medium tariff
Low tariff
Sector average
Sector average 26.1 %
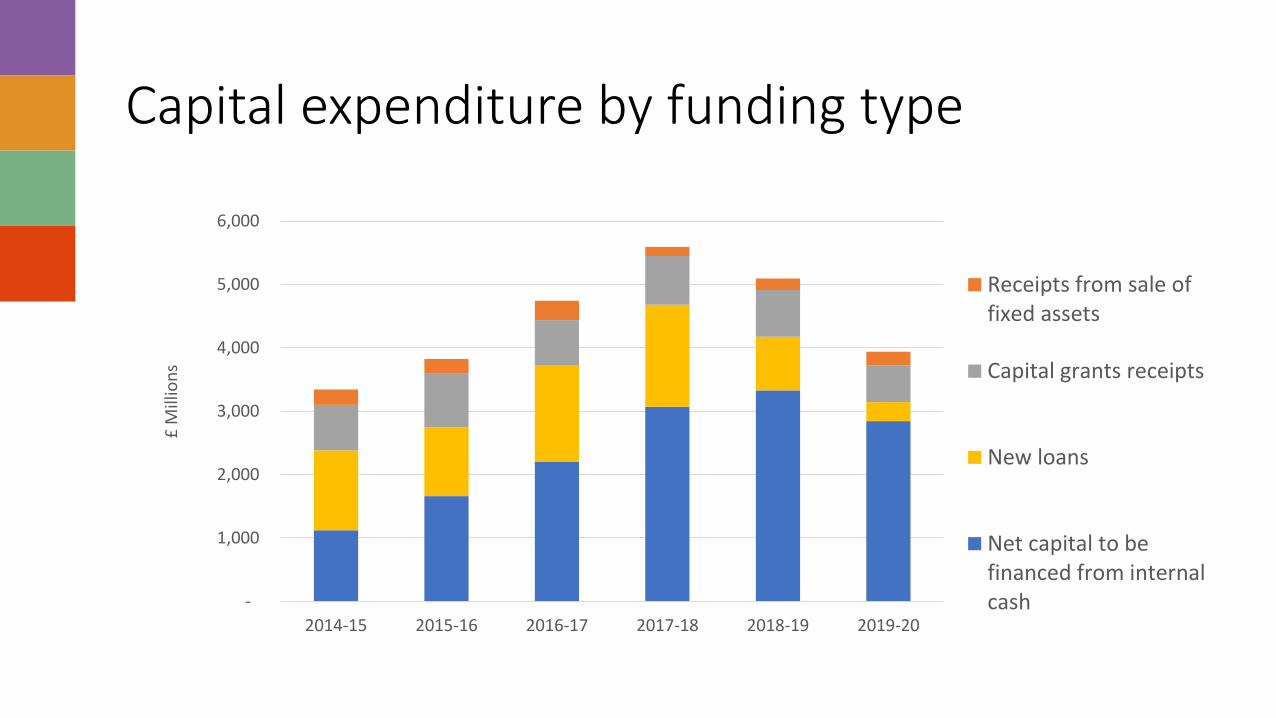
Capital expenditure by funding type
-
1,000
2,000
3,000
4,000
5,000
6,000
2014-15 2015-16 2016-17 2017-18 2018-19 2019-20
£ M
illio
ns
Receipts from sale offixed assets
Capital grants receipts
New loans
Net capital to befinanced from internalcash
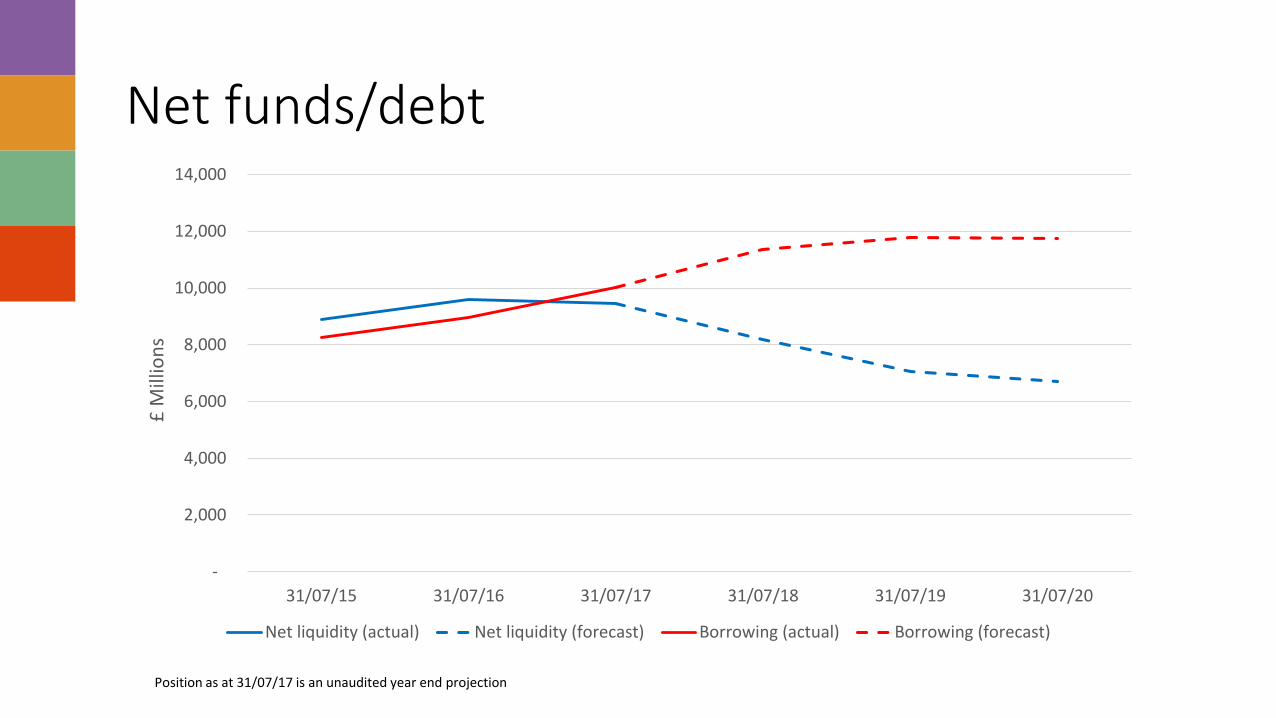
Net funds/debt
-
2,000
4,000
6,000
8,000
10,000
12,000
14,000
31/07/15 31/07/16 31/07/17 31/07/18 31/07/19 31/07/20
£ M
illio
ns
Net liquidity (actual) Net liquidity (forecast) Borrowing (actual) Borrowing (forecast)
Position as at 31/07/17 is an unaudited year end projection