Embed Size (px)
Citation preview

© 2015 Pearson Education, Inc
Chapter 7Economic Growth

© 2015 Pearson Education, Inc
Chapter Outline
7.1 The Power of Economic Growth
7.2 How Does a Nation's Economy Grow?
EBE Why are you so much more prosperous than your great-great-grandparents were?
7.3 The History of Growth and Technology
7.4 Growth, Inequality, and Poverty
7 Economic Growth
© 2015 Pearson Education, Inc
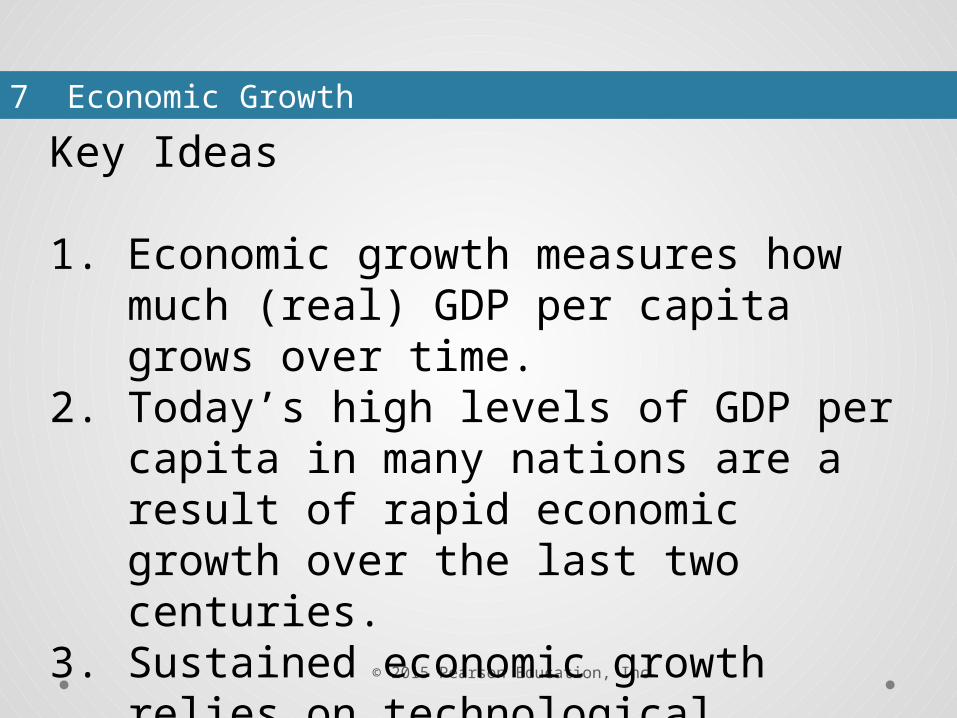
Key Ideas
1. Economic growth measures how much (real) GDP per capita grows over time.
2. Today’s high levels of GDP per capita in many nations are a result of rapid economic growth over the last two centuries.
3. Sustained economic growth relies on technological progress.
7 Economic Growth
© 2015 Pearson Education, Inc
Key Ideas
4. There are sizable differences in the historical growth rates of different economies, which are largely responsible for their differences in the levels of GDP per capita.
5. Economic growth is a powerful tool for poverty reduction.
7 Economic Growth
© 2015 Pearson Education, Inc
7.1 The Power of Economic Growth
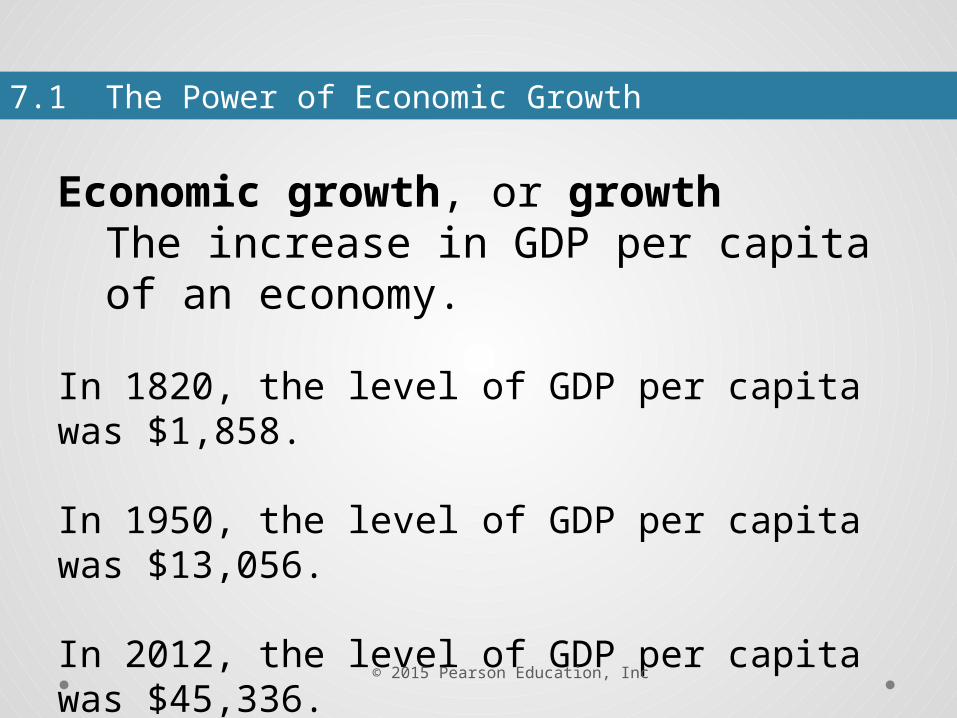
Economic growth, or growthThe increase in GDP per capita of an economy.
In 1820, the level of GDP per capita was $1,858.
In 1950, the level of GDP per capita was $13,056.
In 2012, the level of GDP per capita was $45,336.
© 2015 Pearson Education, Inc
7.1 The Power of Economic Growth
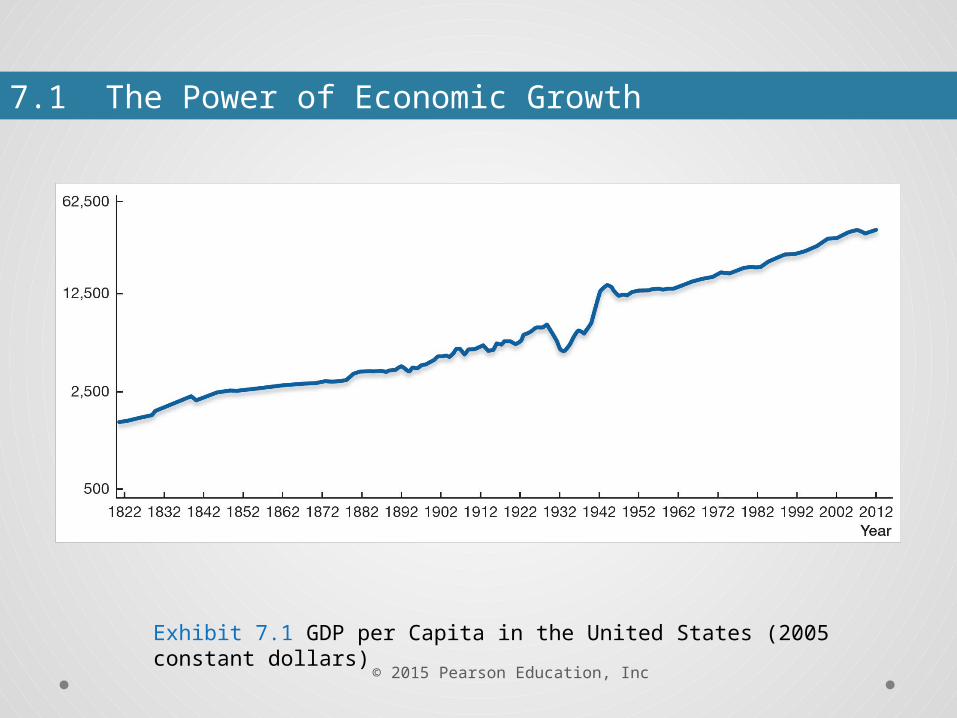
Exhibit 7.1 GDP per Capita in the United States (2005 constant dollars)
© 2015 Pearson Education, Inc
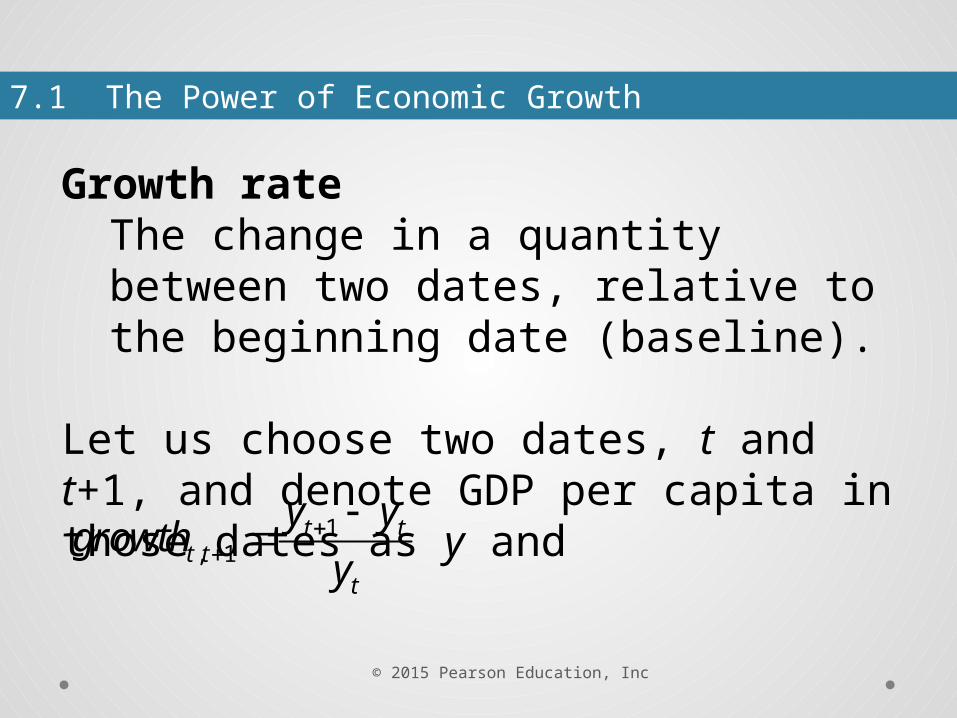
Growth rate The change in a quantity between two dates, relative to the beginning date (baseline).
Let us choose two dates, t and t+1, and denote GDP per capita in those dates as y and
7.1 The Power of Economic Growth
1, 1
t tt t
t
y ygrowth
y
© 2015 Pearson Education, Inc
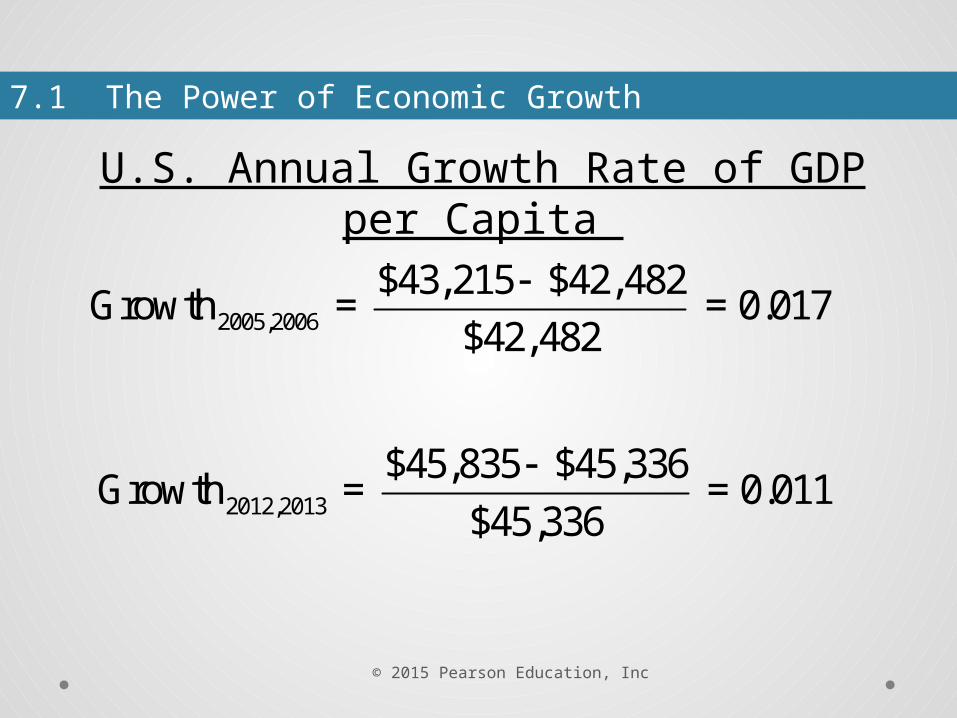
U.S. Annual Growth Rate of GDP per Capita
2005,2006
$43,215 $42,482 Growth = = 0.017
$42,482
2012,2013
$45,835 $45,336 Growth = = 0.011
$45,336
7.1 The Power of Economic Growth
© 2015 Pearson Education, Inc
The annual growth rate of GDP per capita of the U.S. economy is mostly positive but can be negative, as it was in 2007–2008 and 2008–2009.
The average annual growth rate of the U.S. economy between 1950 and 2012 is 2.03%.
7.1 The Power of Economic Growth
© 2015 Pearson Education, Inc
7.1 The Power of Economic Growth
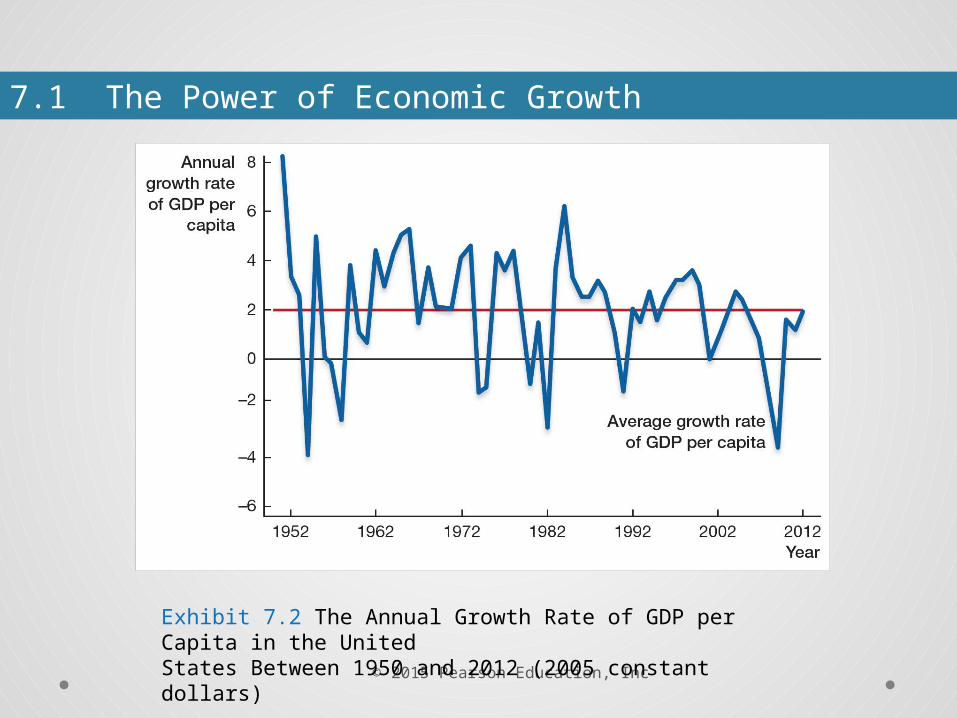
Exhibit 7.2 The Annual Growth Rate of GDP per Capita in the UnitedStates Between 1950 and 2012 (2005 constant dollars)
© 2015 Pearson Education, Inc
Exponential growth A process by which a quantity, like GDP per capita, grows at a constant proportion or growth rate.
7.1 The Power of Economic Growth
© 2015 Pearson Education, Inc
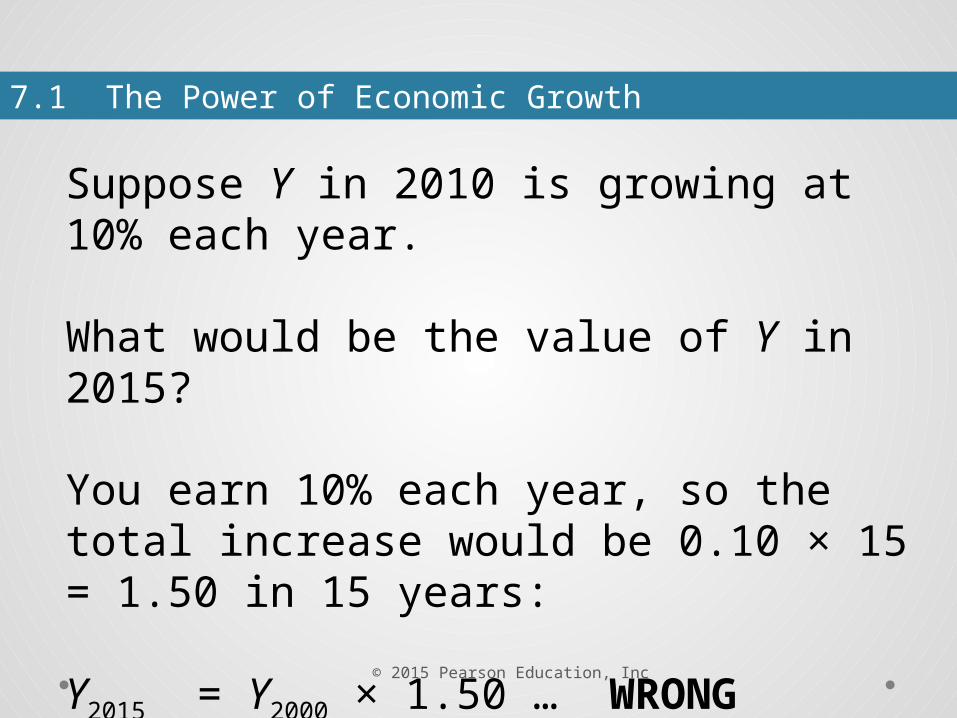
Suppose Y in 2010 is growing at 10% each year.
What would be the value of Y in 2015?
You earn 10% each year, so the total increase would be 0.10 × 15 = 1.50 in 15 years:
Y2015 = Y2000 × 1.50 … WRONG
7.1 The Power of Economic Growth
© 2015 Pearson Education, Inc
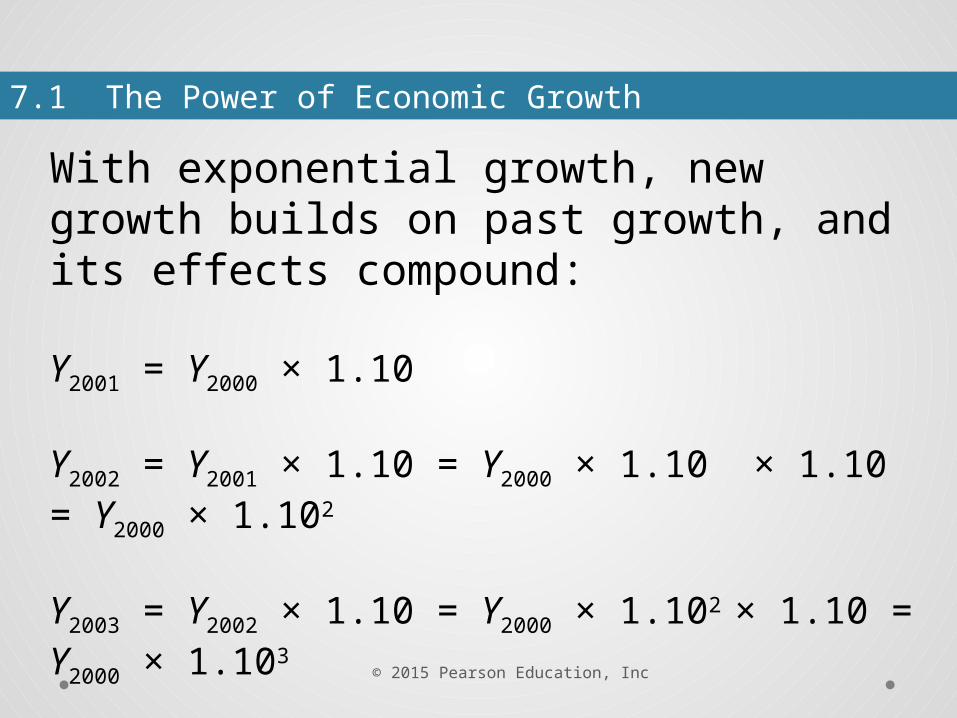
With exponential growth, new growth builds on past growth, and its effects compound:
Y2001 = Y2000 × 1.10
Y2002 = Y2001 × 1.10 = Y2000 × 1.10 × 1.10 = Y2000 × 1.102
Y2003 = Y2002 × 1.10 = Y2000 × 1.102 × 1.10 = Y2000 × 1.103
Y2004 = Y2003 × 1.10 = Y2000 × 1.103 × 1.10 = Y2000 × 1.104
7.1 The Power of Economic Growth
© 2015 Pearson Education, Inc
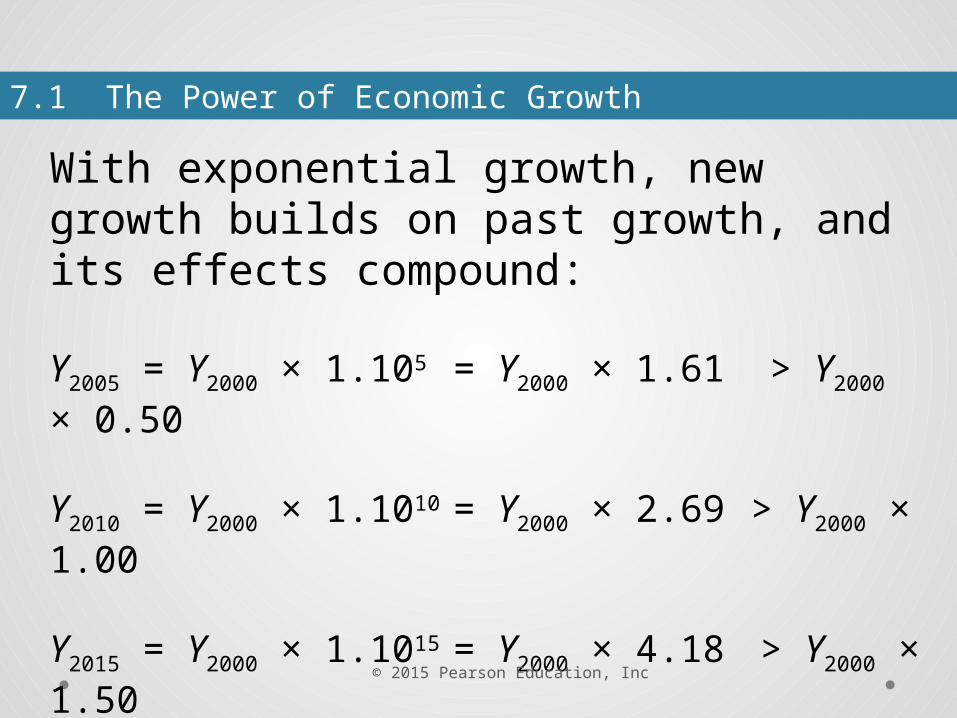
With exponential growth, new growth builds on past growth, and its effects compound:
Y2005 = Y2000 × 1.105 = Y2000 × 1.61 > Y2000 × 0.50
Y2010 = Y2000 × 1.1010 = Y2000 × 2.69 > Y2000 × 1.00
Y2015 = Y2000 × 1.1015 = Y2000 × 4.18 > Y2000 × 1.50
7.1 The Power of Economic Growth
© 2015 Pearson Education, Inc
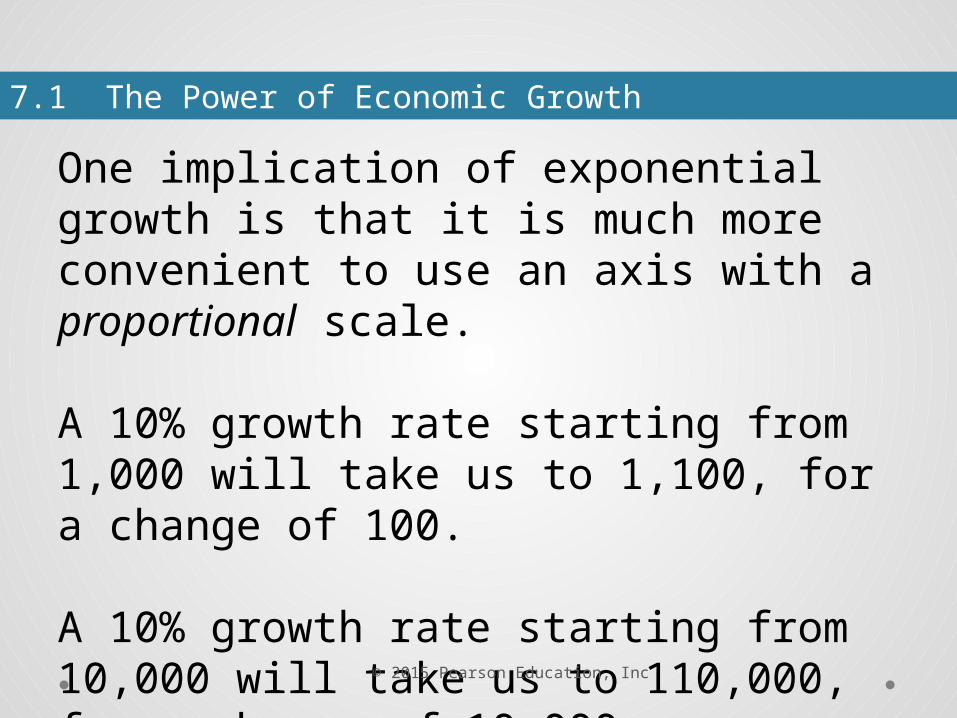
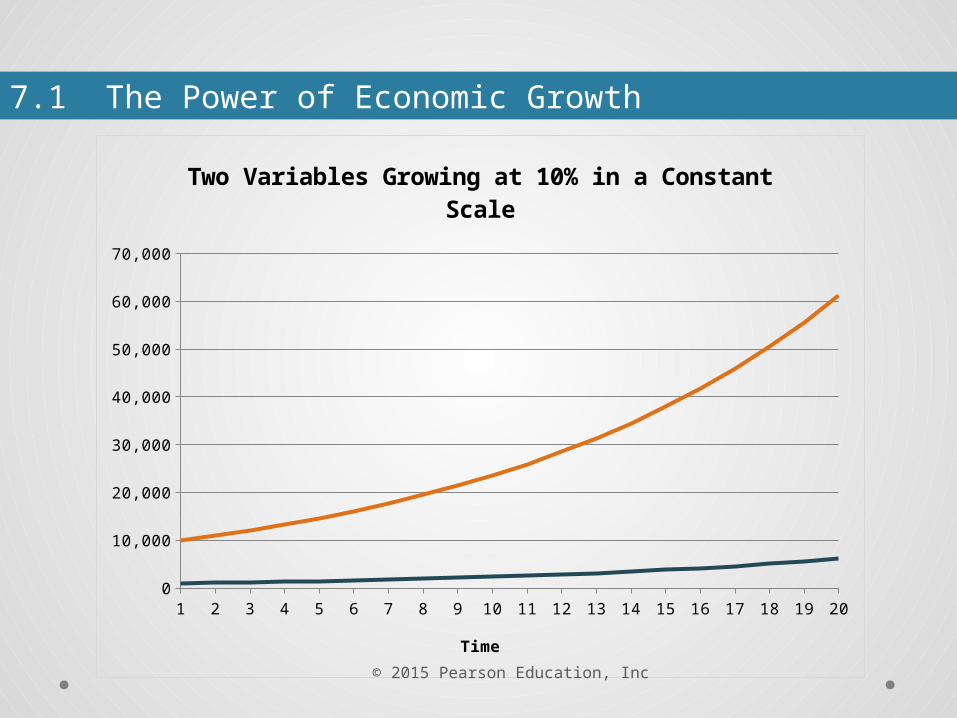
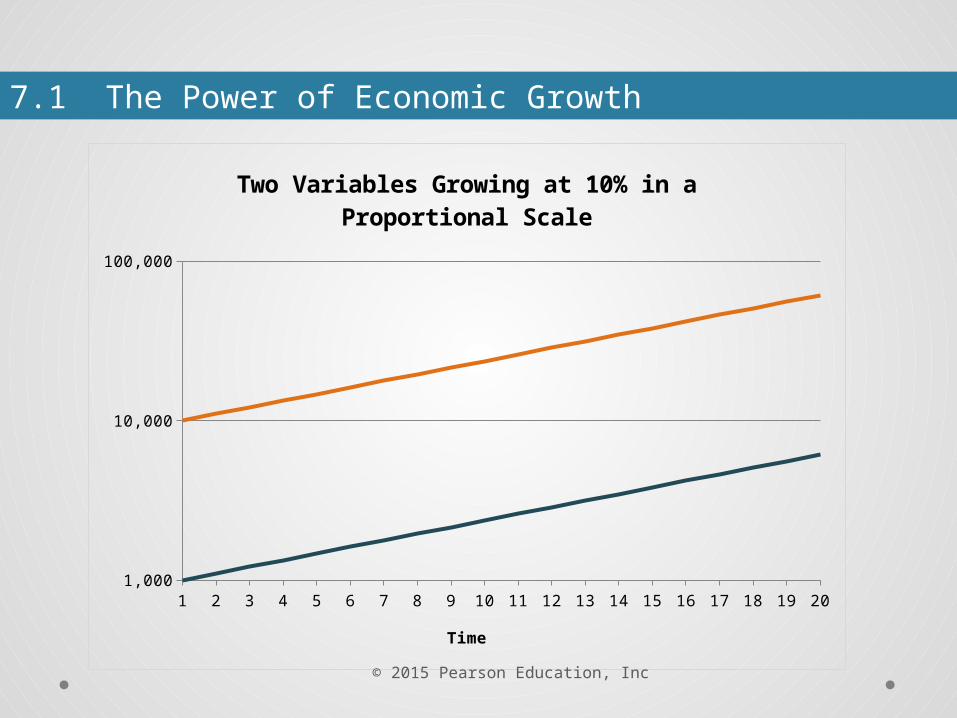
One implication of exponential growth is that it is much more convenient to use an axis with a proportional scale.
A 10% growth rate starting from 1,000 will take us to 1,100, for a change of 100.
A 10% growth rate starting from 10,000 will take us to 110,000, for a change of 10,000.
7.1 The Power of Economic Growth
© 2015 Pearson Education, Inc
1 2 3 4 5 6 7 8 9 10 11 12 13 14 15 16 17 18 19 200
10,000
20,000
30,000
40,000
50,000
60,000
70,000
Two Variables Growing at 10% in a Constant Scale
Time
7.1 The Power of Economic Growth
© 2015 Pearson Education, Inc
1 2 3 4 5 6 7 8 9 10 11 12 13 14 15 16 17 18 19 201,000
10,000
100,000
Two Variables Growing at 10% in a Proportional Scale
Time
7.1 The Power of Economic Growth
© 2015 Pearson Education, Inc
An important implication of exponential growth is that small changes in growth rates lead to large differences in the level of GDP per capita.
7.1 The Power of Economic Growth
© 2015 Pearson Education, Inc
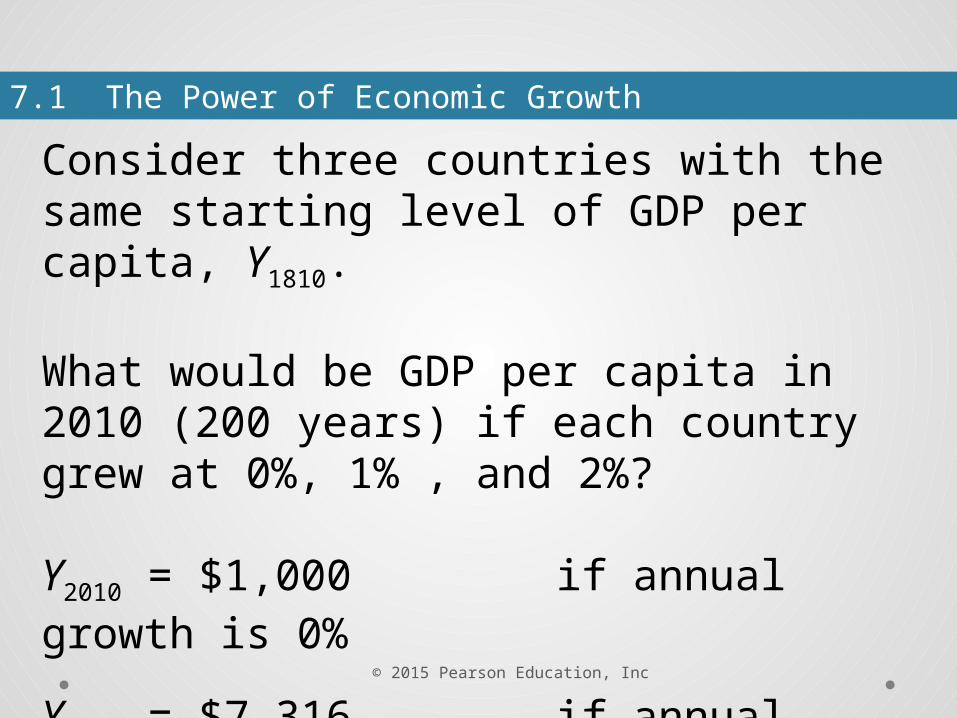
Consider three countries with the same starting level of GDP per capita, Y1810.
What would be GDP per capita in 2010 (200 years) if each country grew at 0%, 1% , and 2%?
Y2010 = $1,000 if annual growth is 0%
Y2010 = $7,316 if annual growth is 1%
Y2010 = $52,485 if annual growth is 2%
7.1 The Power of Economic Growth
© 2015 Pearson Education, Inc
Let’s look at what exponential growth implies about the growth experiences of rich vs. poor countries and fast vs. slow growers.
We use a 1960 to 2010 data set where GDP per capita is in PPP-adjusted 2005 constant dollars.
7.1 The Power of Economic Growth
© 2015 Pearson Education, Inc
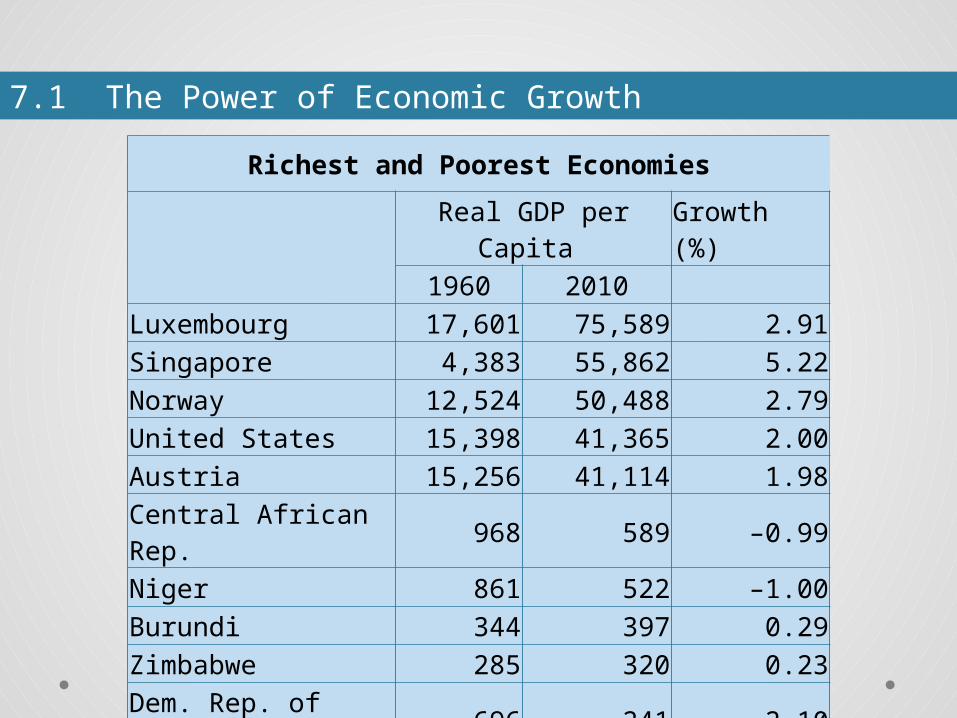
Richest and Poorest Economies
Real GDP per Capita Growth (%)
1960 2010
Luxembourg 17,601 75,589 2.91
Singapore 4,383 55,862 5.22
Norway 12,524 50,488 2.79
United States 15,398 41,365 2.00
Austria 15,256 41,114 1.98
Central African Rep. 968 589 –0.99
Niger 861 522 –1.00
Burundi 344 397 0.29
Zimbabwe 285 320 0.23
Dem. Rep. of Congo 696 241 –2.10
7.1 The Power of Economic Growth
© 2015 Pearson Education, Inc
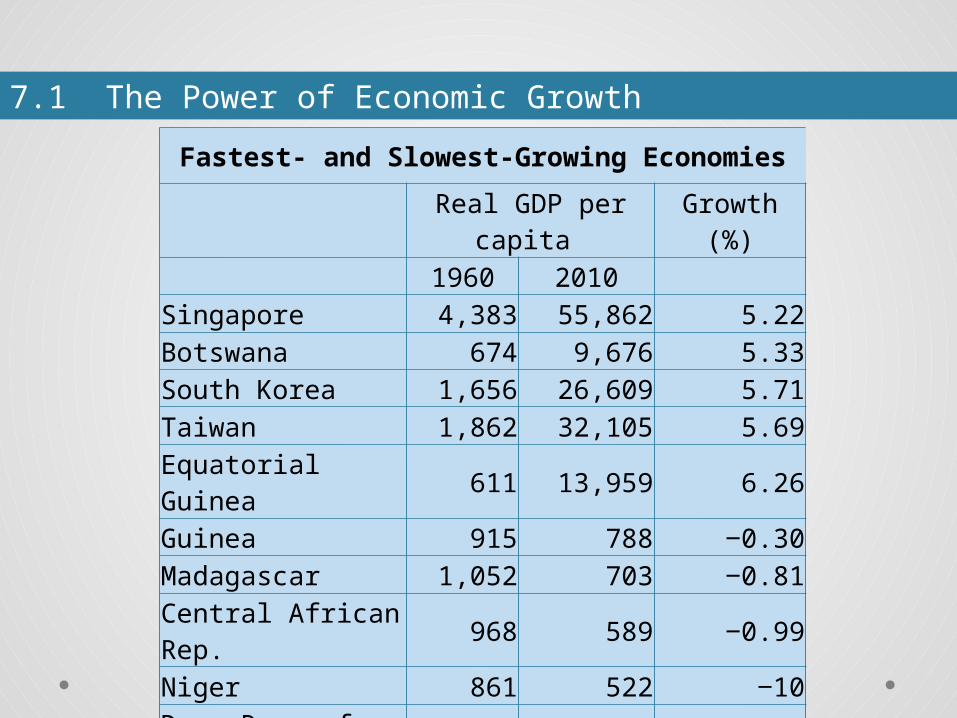
Fastest- and Slowest-Growing Economies
Real GDP per capita Growth (%)
1960 2010Singapore 4,383 55,862 5.22Botswana 674 9,676 5.33South Korea 1,656 26,609 5.71Taiwan 1,862 32,105 5.69Equatorial Guinea 611 13,959 6.26Guinea 915 788 ‒0.30Madagascar 1,052 703 ‒0.81Central African Rep. 968 589 ‒0.99Niger 861 522 ‒10Dem. Rep. of Congo 696 241 ‒2.10
7.1 The Power of Economic Growth
© 2015 Pearson Education, Inc
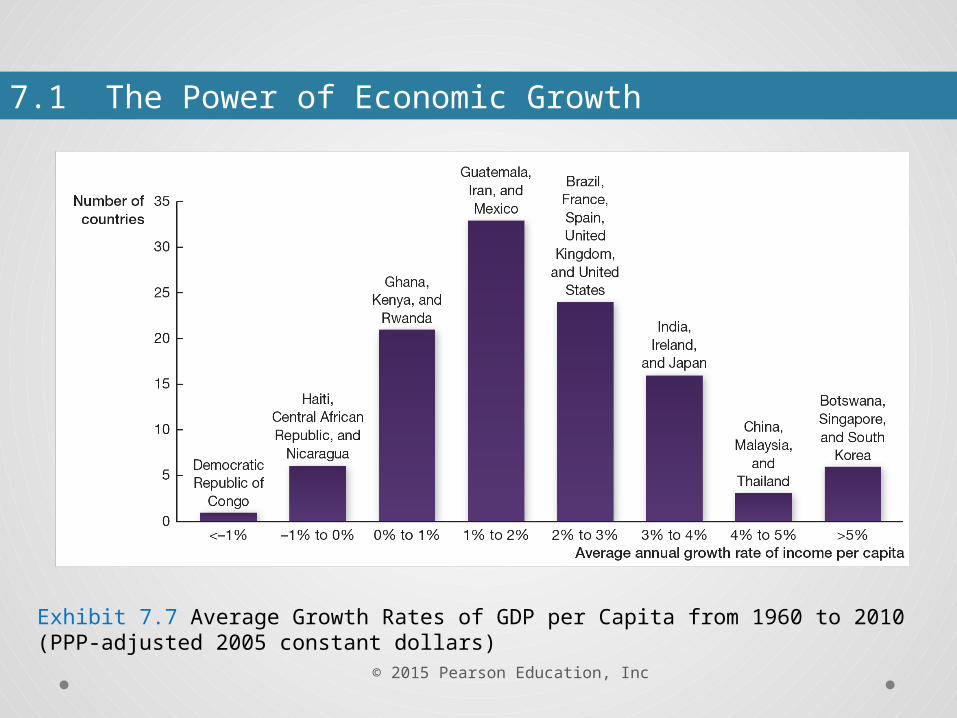
What about the implied average growth rates for all countries?
The next slide shows that the majority of nations have experienced average annual growth in real GDP per capita of 1%‒3%.
7.1 The Power of Economic Growth
© 2015 Pearson Education, Inc
Exhibit 7.7 Average Growth Rates of GDP per Capita from 1960 to 2010(PPP-adjusted 2005 constant dollars)
7.1 The Power of Economic Growth
© 2015 Pearson Education, Inc
What about the implied average growth rates for longer time periods?
The Maddison Project, named after the late Angus Maddison, has estimated growth rates for numerous countries back to 1820 and beyond.
We look at the implied growth rates for a few of these countries in the next slide.
7.1 The Power of Economic Growth
© 2015 Pearson Education, Inc
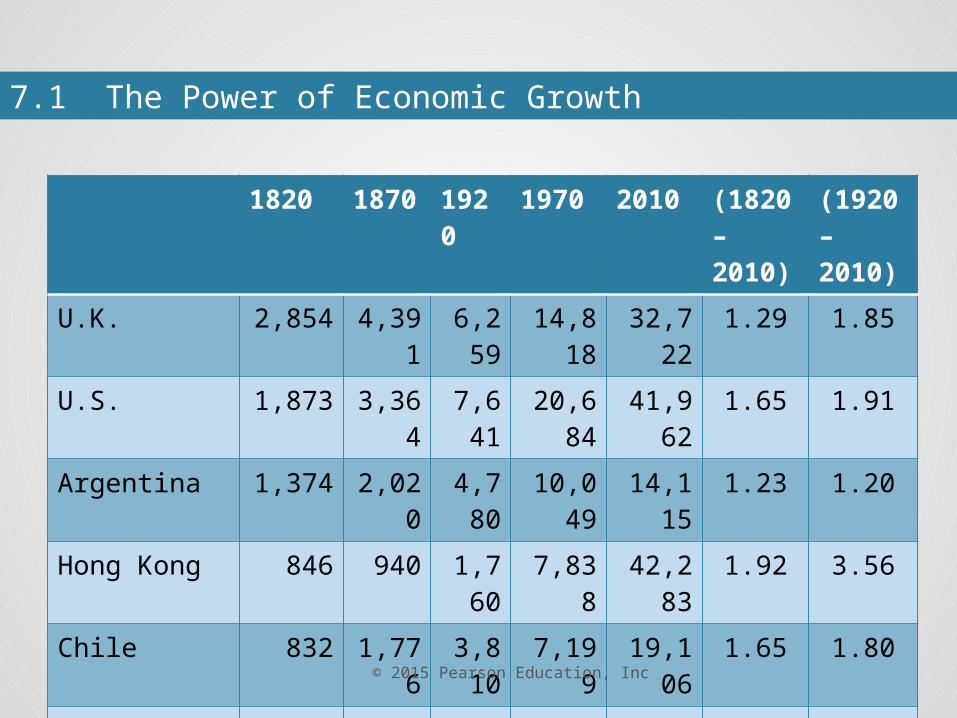
1820 1870
1920
1970 2010 (1820– 2010)
(1920– 2010)
U.K. 2,854 4,391
6,259
14,818
32,722
1.29 1.85
U.S. 1,873 3,364
7,641
20,684
41,962
1.65 1.91
Argentina 1,374 2,020
4,780
10,049
14,115
1.23 1.20
Hong Kong 846 940 1,760
7,838 42,283
1.92 3.56
Chile 832 1,776
3,810
7,199 19,106
1.65 1.80
South Korea 461 464 839 2,983 29,864
2.22 4.05
7.1 The Power of Economic Growth

© 2015 Pearson Education, Inc
There are two important take-aways from these growth tables.
7.1 The Power of Economic Growth
© 2015 Pearson Education, Inc
1. Catch-up growth: Poor countries tend to grow faster, or “catch up,” to rich countries as they adopt the production and technologies of the richest countries.
Examples include Chile, Hong Kong, and South Korea.
As Argentina shows, however, catch-up growth is not guaranteed.
7.1 The Power of Economic Growth
© 2015 Pearson Education, Inc
2. Sustained growth: Some countries experience positive and relatively steady growth rates over 50- , 100-, and even 200-year periods.
Examples include the United Kingdom, United States, France, and Spain.
7.1 The Power of Economic Growth
© 2015 Pearson Education, Inc
How does a nation’s economy grow?
Let us return to the aggregate production function of Chapter 6:
( )Y = A × F K,H
7.2 How Does a Nation’s Economy Grow?
© 2015 Pearson Education, Inc
A nation can increase its GDP by:
1. Increasing its stock of physical capital, K
2. Increasing the total efficiency units of labor, H
3. Improving its technology, A
7.2 How Does a Nation’s Economy Grow?
© 2015 Pearson Education, Inc
7.2 How Does a Nation’s Economy Grow?Capital Accumulation
Consider a simply economy where there is no government nor exports nor imports, so that G = X = M = 0.
Therefore, on the expenditure side, Y = C + I.
Similarly, on the income side, Y = C + S.
Setting the two equations together, I = S.
© 2015 Pearson Education, Inc
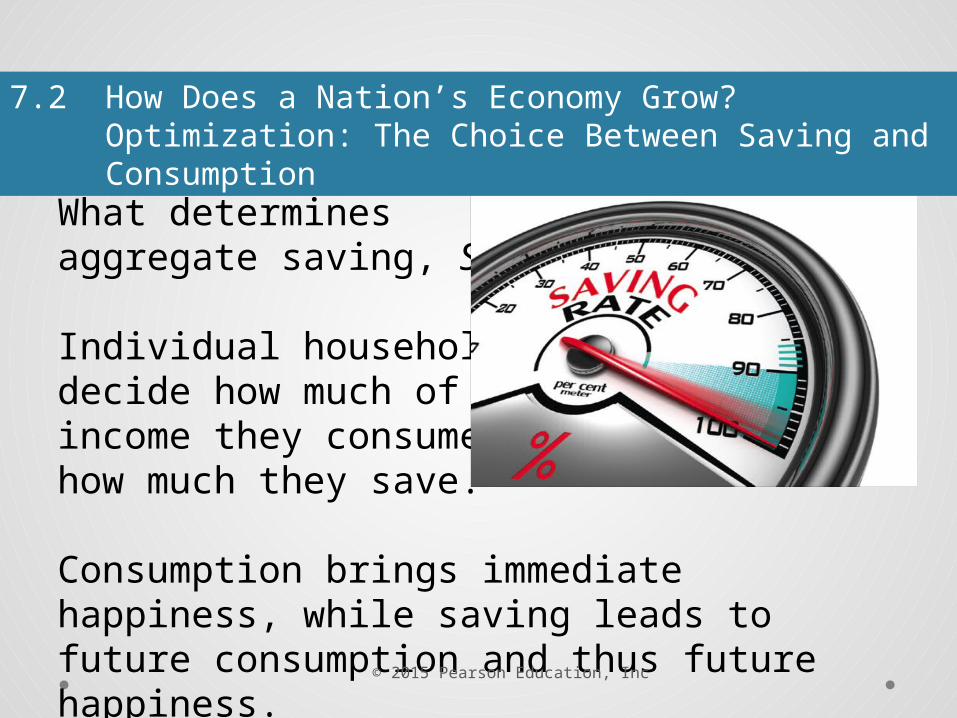
What determines aggregate saving, S?
Individual households decide how much of theirincome they consume andhow much they save.
Consumption brings immediate happiness, while saving leads to future consumption and thus future happiness.
7.2 How Does a Nation’s Economy Grow?Optimization: The Choice Between Saving and Consumption
© 2015 Pearson Education, Inc
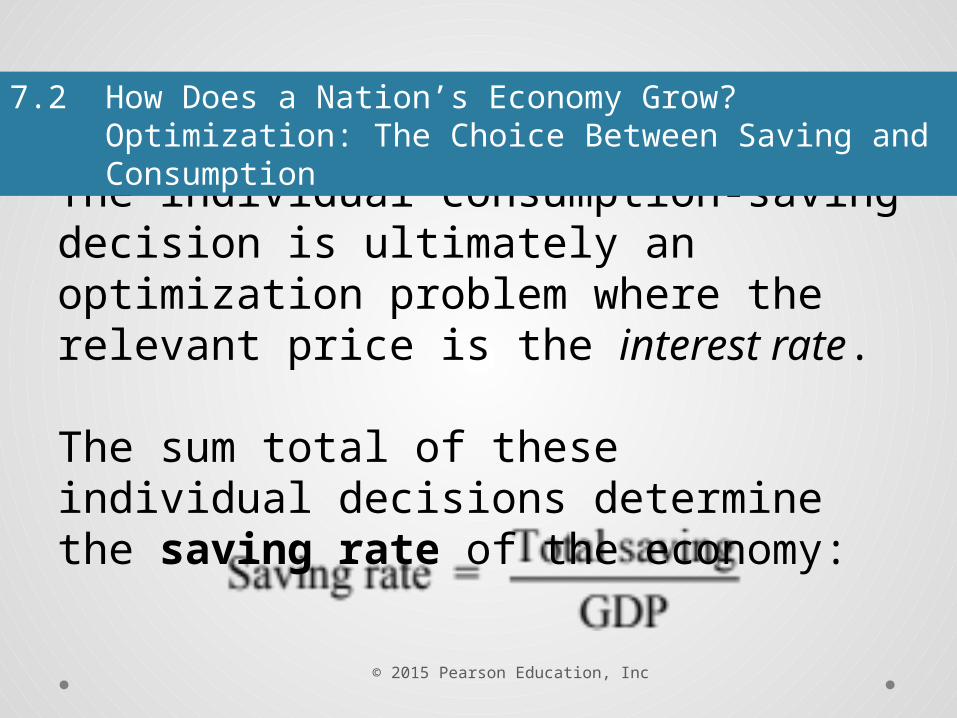
The individual consumption-saving decision is ultimately an optimization problem where the relevant price is the interest rate.
The sum total of these individual decisions determine the saving rate of the economy:
7.2 How Does a Nation’s Economy Grow?Optimization: The Choice Between Saving and Consumption
© 2015 Pearson Education, Inc
Physical capital accumulation by itself cannot generate sustained growth due to the diminishing marginal product of physical capital.
Why? More and more capital will generate smaller and smaller increases in GDP.
Therefore, a constant or sustained growth rate cannot be achieved.
7.2 How Does a Nation’s Economy Grow?
© 2015 Pearson Education, Inc
Similarly, population growth and education by themselves cannot generate sustained growth due to the diminishing marginal product of labor and diminishing marginal product of skills.
Why? More and more labor will generate smaller and smaller increases in GDP.
Therefore, a constant or sustained growth rate cannot be achieved.
7.2 How Does a Nation’s Economy Grow?

© 2015 Pearson Education, Inc
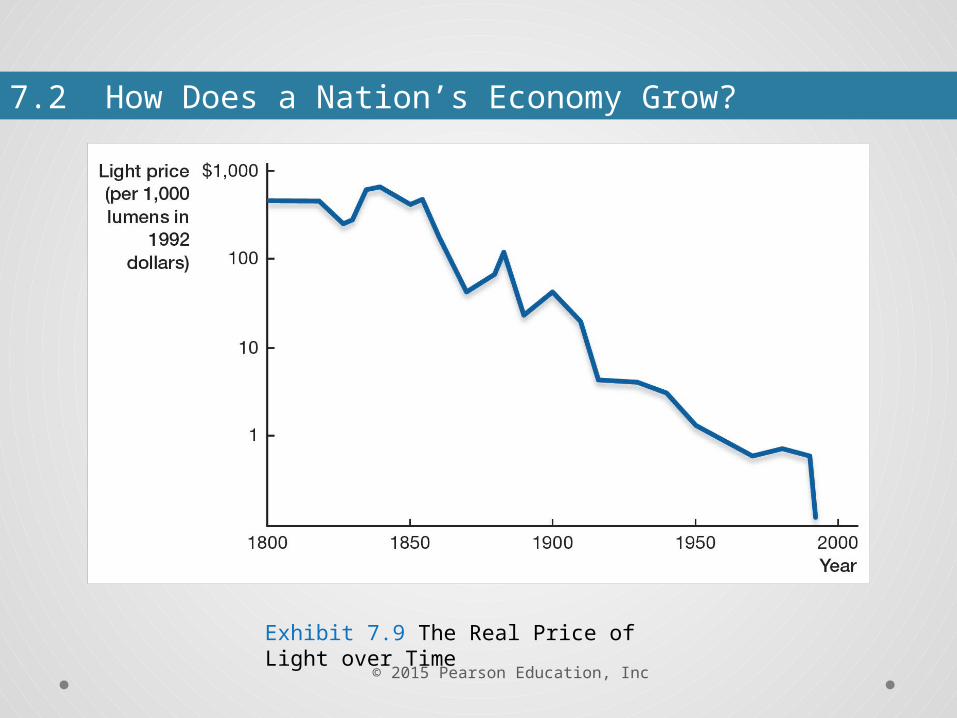
Technological change The process in which new technologies and new goods and services are invented, introduced, and used in the economy. Such change can generate sustained growth.
7.2 How Does a Nation’s Economy Grow?
© 2015 Pearson Education, Inc
Exhibit 7.9 The Real Price of Light over Time
7.2 How Does a Nation’s Economy Grow?
© 2015 Pearson Education, Inc
Technological change is more than a constant increase, such as 10 more units. Rather, it is exponential in that the rate of increase is approximately constant, such as 10%.
Why? New innovations and technologies build on the existing stock of knowledge—“building on the shoulders of giants”—and thus are not subject to diminishing returns.
7.2 How Does a Nation’s Economy Grow?

© 2015 Pearson Education, Inc
Evidence-Based Economics Example
Question: Why are you so much more prosperous than your great-great-grandparents were?
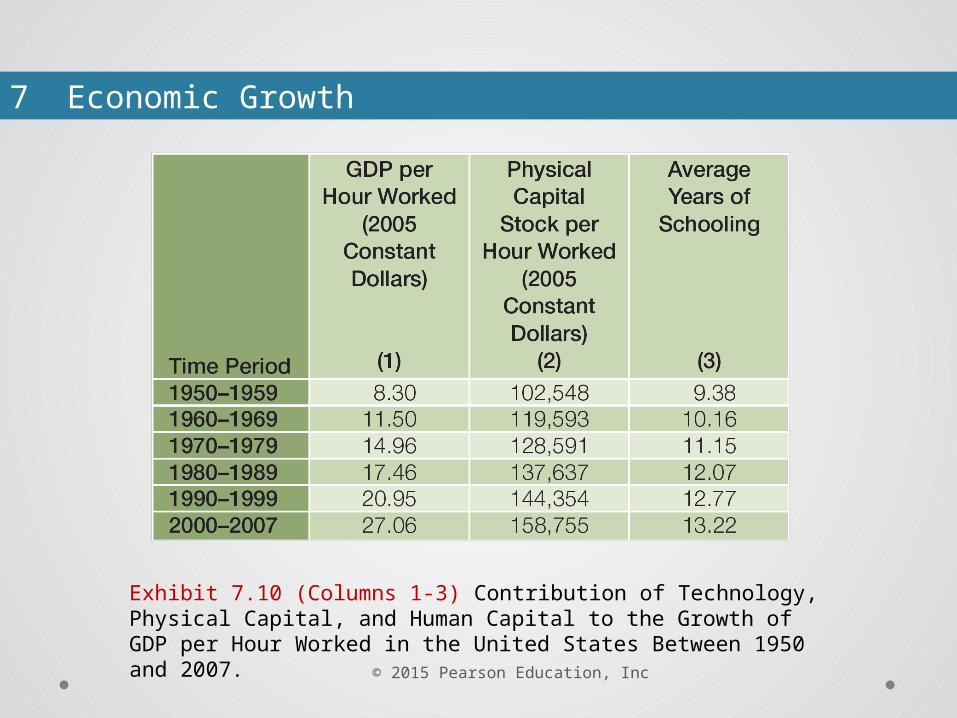
Data: The following table presents estimates of GDP per hour worked, physical capital stock per hour worked, and average years of schooling for 10-year periods starting in 1950.
7 Economic Growth
© 2015 Pearson Education, Inc
Exhibit 7.10 (Columns 1-3) Contribution of Technology, Physical Capital, and Human Capital to the Growth of GDP per Hour Worked in the United States Between 1950 and 2007.
7 Economic Growth
© 2015 Pearson Education, Inc
7 Economic Growth
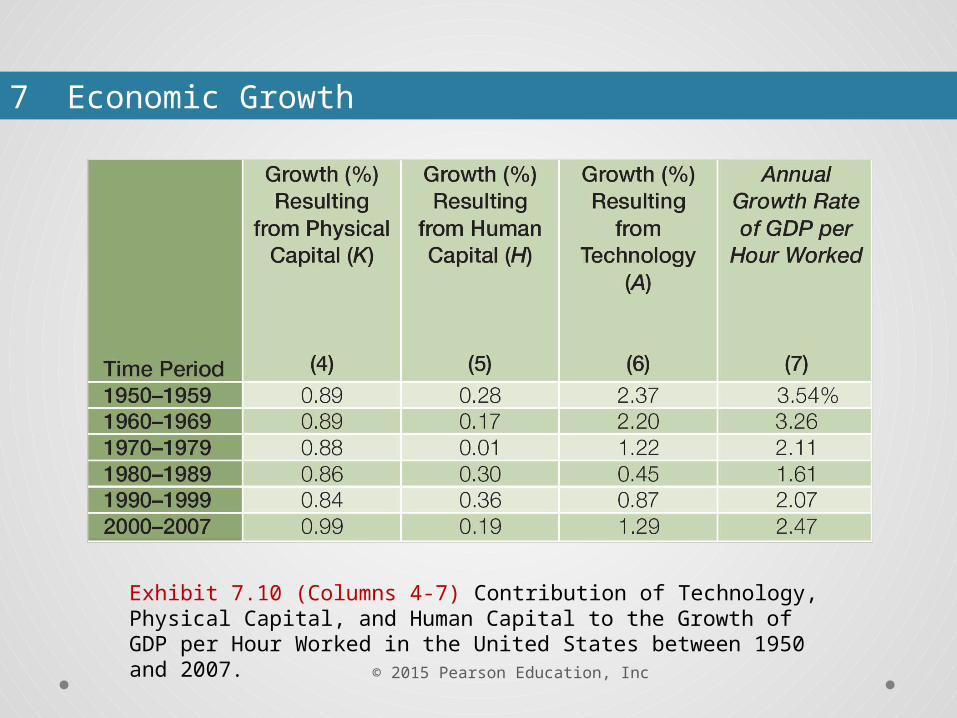
Exhibit 7.10 (Columns 4-7) Contribution of Technology, Physical Capital, and Human Capital to the Growth of GDP per Hour Worked in the United States between 1950 and 2007.
© 2015 Pearson Education, Inc
Data: These data can then be converted into growth contributions of physical capital (K), human capital (H), and technology (A) to the annual growth rate of GDP per worker.
7 Economic Growth
© 2015 Pearson Education, Inc
7 Economic Growth
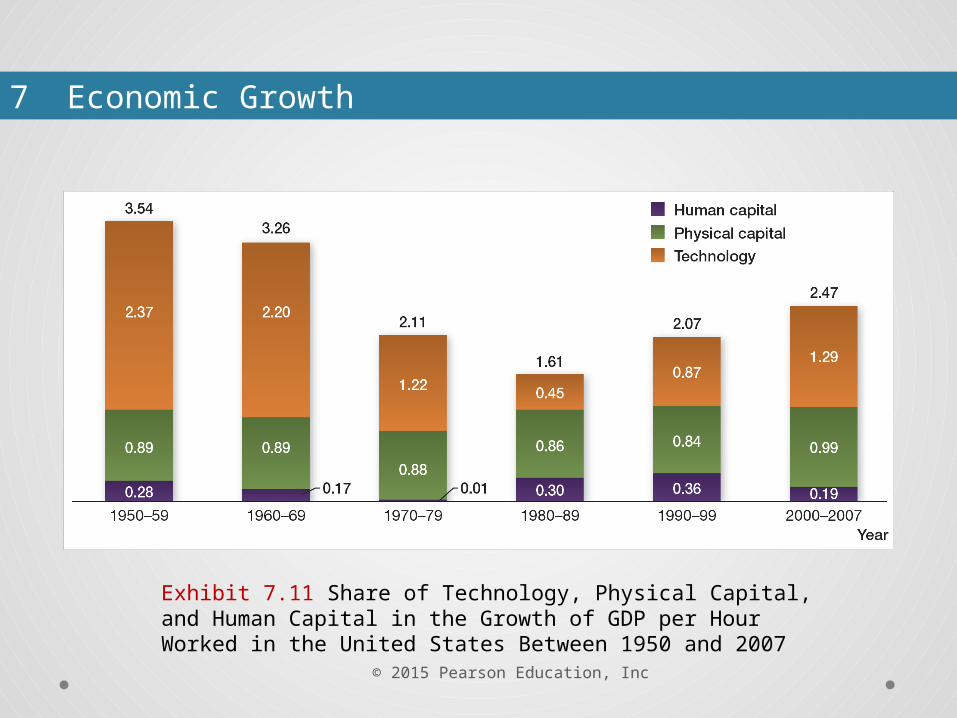
Exhibit 7.11 Share of Technology, Physical Capital, and Human Capital in the Growth of GDP per Hour Worked in the United States Between 1950 and 2007
© 2015 Pearson Education, Inc
Evidence-Based Economics Example
Question: Why are you so much more prosperous than your great-great-grandparents were?
Answer: In most decades, technology accounts for the bulk of growth in U.S. GDP per worker.
Caveat: If we understate the contribution of physical or human capital to GDP, the contribution of technology may be exaggerated.
7 Economic Growth
© 2015 Pearson Education, Inc
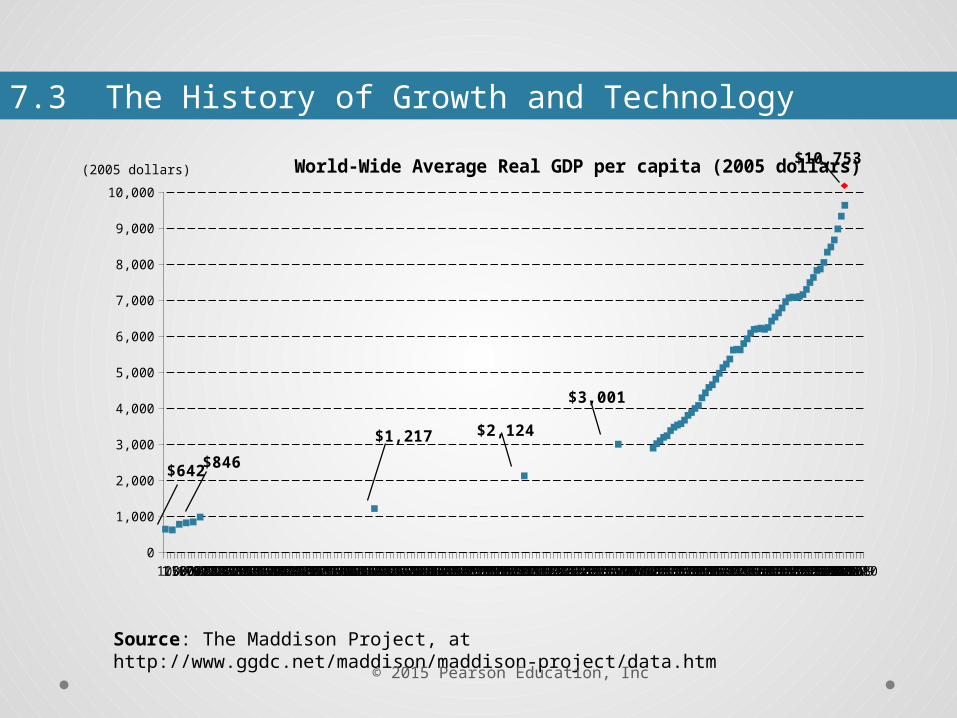
7.3 The History of Growth and Technology
The economic history of the world can be broken down into three distinct periods:
1. Pre-modern times: up to 1800
2. Industrial Revolution: 1800 to 1820
3. Post-Industrial Revolution: 1820 to present
© 2015 Pearson Education, Inc
Source: The Maddison Project, at http://www.ggdc.net/maddison/maddison-project/data.htm
11000150016001700182018211822182318241825182618271828182918301831183218331834183518361837183818391840184118421843184418451846184718481849185018511852185318541855185618571858185918601861186218631864186518661867186818691870187118721873187418751876187718781879188018811882188318841885188618871888188918901891189218931894189518961897189818991900190119021903190419051906190719081909191019111912191319141915191619171918191919201921192219231924192519261927192819291930193119321933193419351936193719381939194019411942194319441945194619471948194919501951195219531954195519561957195819591960196119621963196419651966196719681969197019711972197319741975197619771978197919801981198219831984198519861987198819891990199119921993199419951996199719981999200020012002200320042005200620072008200920100
1,000
2,000
3,000
4,000
5,000
6,000
7,000
8,000
9,000
10,000
World-Wide Average Real GDP per capita (2005 dollars)
$642
$1,217 $2,124
$10,753(2005 dollars)
$3,001
$846
7.3 The History of Growth and Technology

© 2015 Pearson Education, Inc
Thomas Malthus, writing in 1798, argued that humankind was destined to live at the subsistence level—the minimum level of income per person necessary to survive.
According to the Malthusian cycle, any increase in income per capita above the subsistence level would lead to higher fertility rates.
7.3 The History of Growth and Technology
© 2015 Pearson Education, Inc
The higher fertility rates would fuel higher population growth, which in turn would drive income per capita back down to the subsistence level.
Without any technological advances, pre-modern times were stuck in the Malthusian cycle of little to no sustained growth in income per capita.
7.3 The History of Growth and Technology
© 2015 Pearson Education, Inc
Two trends led Britain and then other countries to break out of the Malthusian cycle.
First, the introduction of new machines and methods of production (Industrial Revolution) created the technological progress necessary for sustained growth.
The Industrial Revolution started in production and then moved on to transportation.
7.3 The History of Growth and Technology
© 2015 Pearson Education, Inc
Second, the movement of people from rural agriculture to urban manufacturing led to a drop in fertility rates (demographic transition).
7.3 The History of Growth and Technology
© 2015 Pearson Education, Inc
The post-industrial Revolution period has experienced sustained growth in income per capita due to dramatic innovations in transportation, communications, electricity, and computers.
7.3 The History of Growth and Technology
© 2015 Pearson Education, Inc
7.4 Growth, Inequality, and Poverty
GDP per capita is a measure of the average living standard of a nation but not the income of all individuals in that nation.
We therefore must look at the income inequality of a nation.
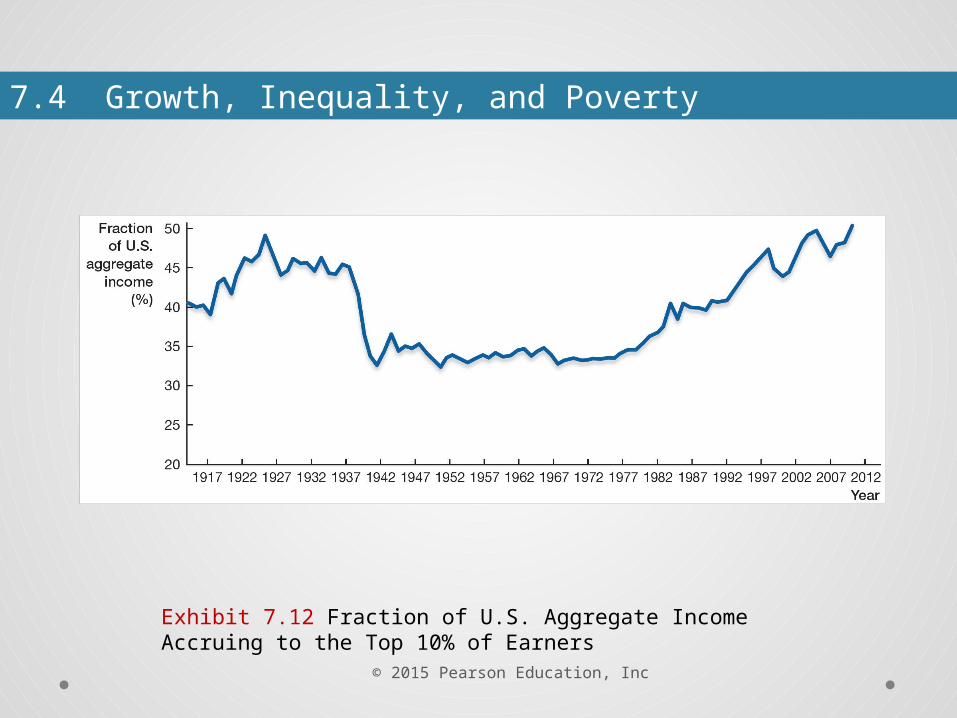
The following graph shows a measure of income inequality of the United States from 1910 to present.
© 2015 Pearson Education, Inc
Exhibit 7.12 Fraction of U.S. Aggregate Income Accruing to the Top 10% of Earners
7.4 Growth, Inequality, and Poverty
© 2015 Pearson Education, Inc
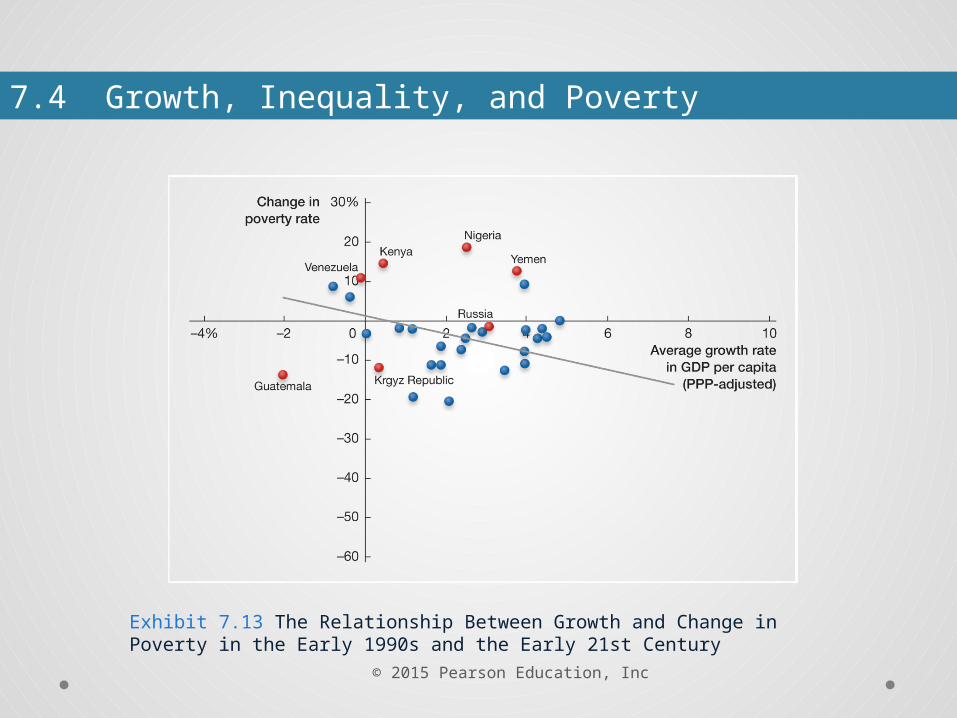
What, then, is the relationship between economic growth and inequality?
The following graph plots the relationship between growth in GDP per capita and changes in the poverty rate (defined as the percentage of the population living under $1.25 per day).
7.4 Growth, Inequality, and Poverty
© 2015 Pearson Education, Inc
Exhibit 7.13 The Relationship Between Growth and Change in Poverty in the Early 1990s and the Early 21st Century
7.4 Growth, Inequality, and Poverty
© 2015 Pearson Education, Inc
Although the negative relationship does not prove that growth causes declining poverty, it does show that economic growth can provide an effective way of reducing poverty.
7.4 Growth, Inequality, and Poverty


![ch07 [EDocFind.com]](https://img.pdfslide.us/doc/110x75/577d2f341a28ab4e1eb116e2/ch07-edocfindcom.jpg)