Embed Size (px)
Citation preview
��� ���Gathering Feedback for Better Teaching
By Tom Kane, Harvard University

2
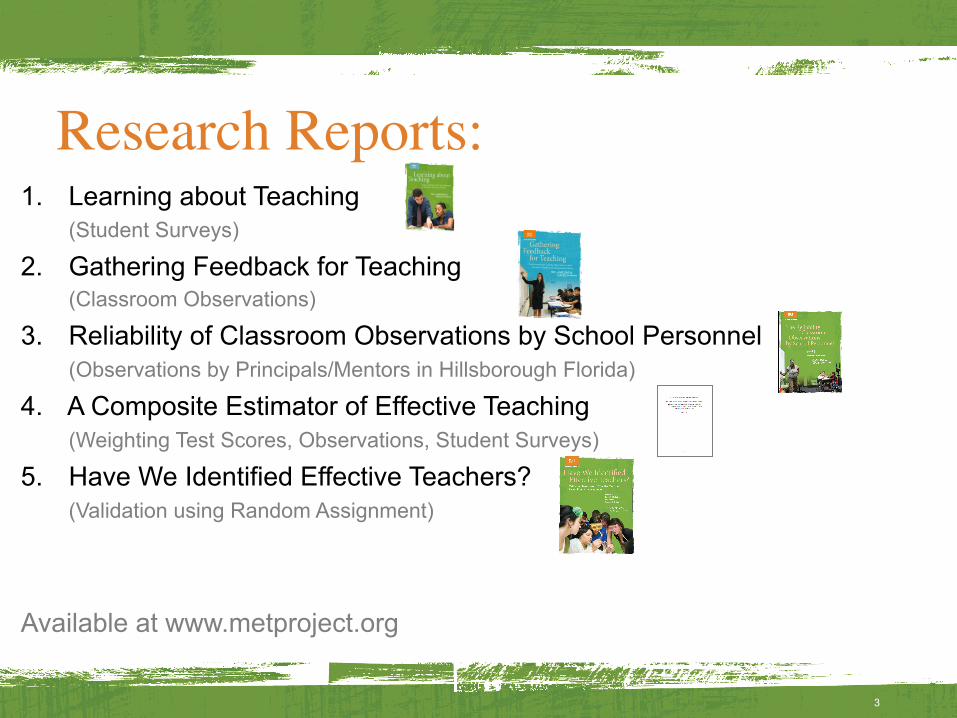
Research Reports: 1. Learning about Teaching
(Student Surveys)
2. Gathering Feedback for Teaching (Classroom Observations)
3. Reliability of Classroom Observations by School Personnel (Observations by Principals/Mentors in Hillsborough Florida)
4. A Composite Estimator of Effective Teaching (Weighting Test Scores, Observations, Student Surveys)
5. Have We Identified Effective Teachers? (Validation using Random Assignment)
Available at www.metproject.org
3
Finding: 1. Current assessments of pedagogical content
knowledge are not related to effectiveness.
4
Finding: 2. Reliable classroom observations require…
• certified observers and • more than one observer per teacher.
5
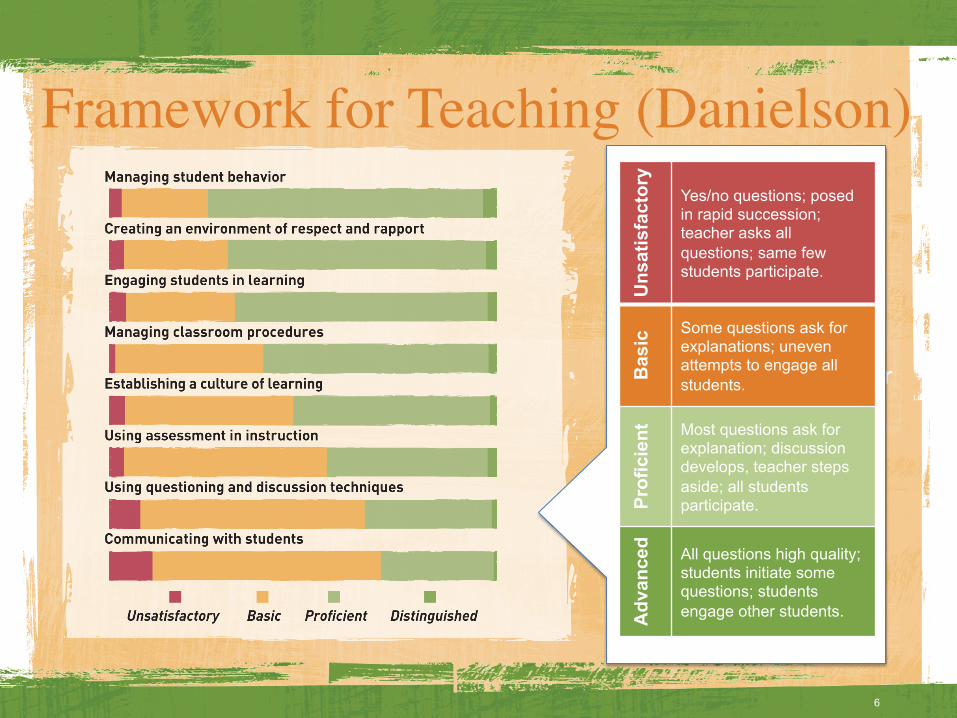
Actual scores for 7500 lessons.
6
Framework for Teaching (Danielson)
Uns
atis
fact
ory
Yes/no questions; posed in rapid succession; teacher asks all questions; same few students participate.
Bas
ic Some questions ask for
explanations; uneven attempts to engage all students.
Prof
icie
nt
Most questions ask for explanation; discussion develops, teacher steps aside; all students participate.
Adv
ance
d
All questions high quality; students initiate some questions; students engage other students.

7
More than 1 observer
One more lesson +.07
One more observer +.16

Finding: 3. Student surveys are…
• a low-cost way to cover untested grades and subjects, • related to a teacher’s student achievement gains and • the most reliable measures we tested.
8
9
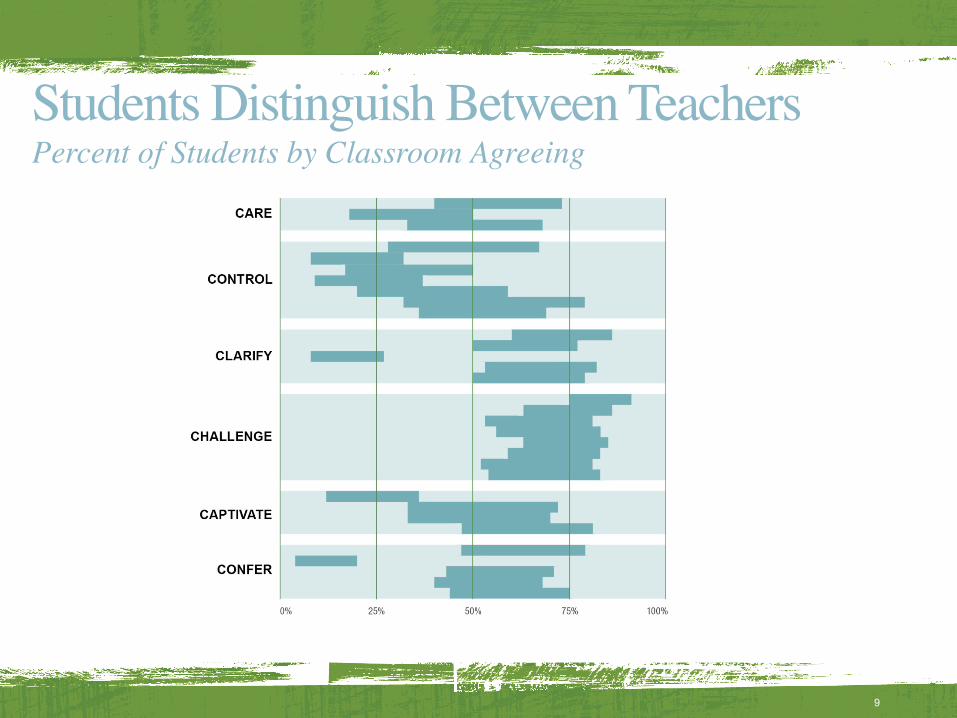
Students Distinguish Between Teachers���Percent of Students by Classroom Agreeing
10
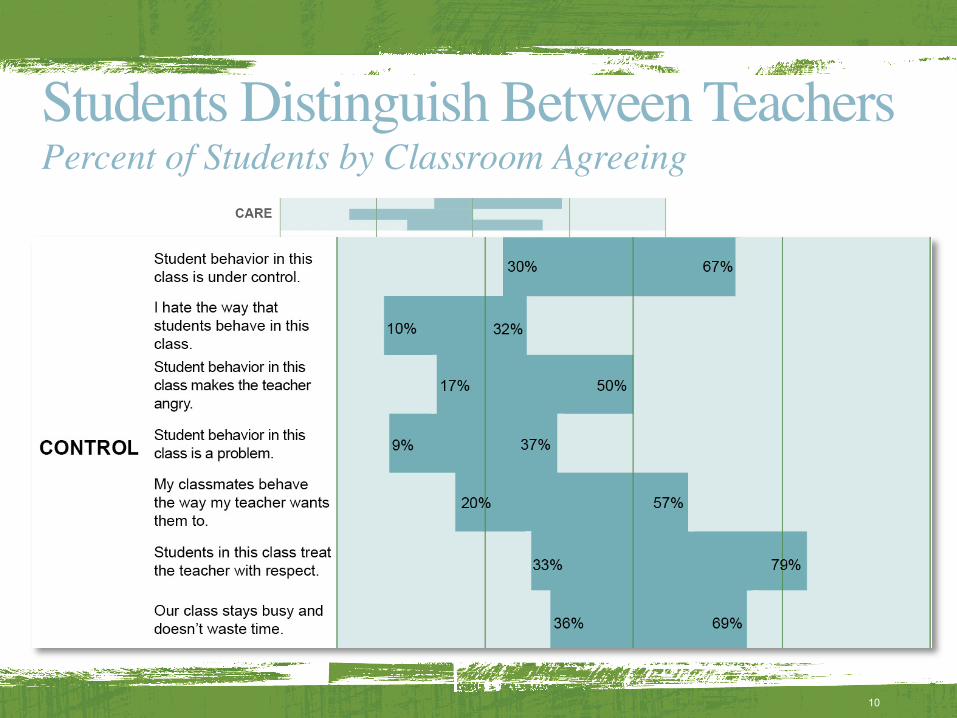
Students Distinguish Between Teachers���Percent of Students by Classroom Agreeing
11
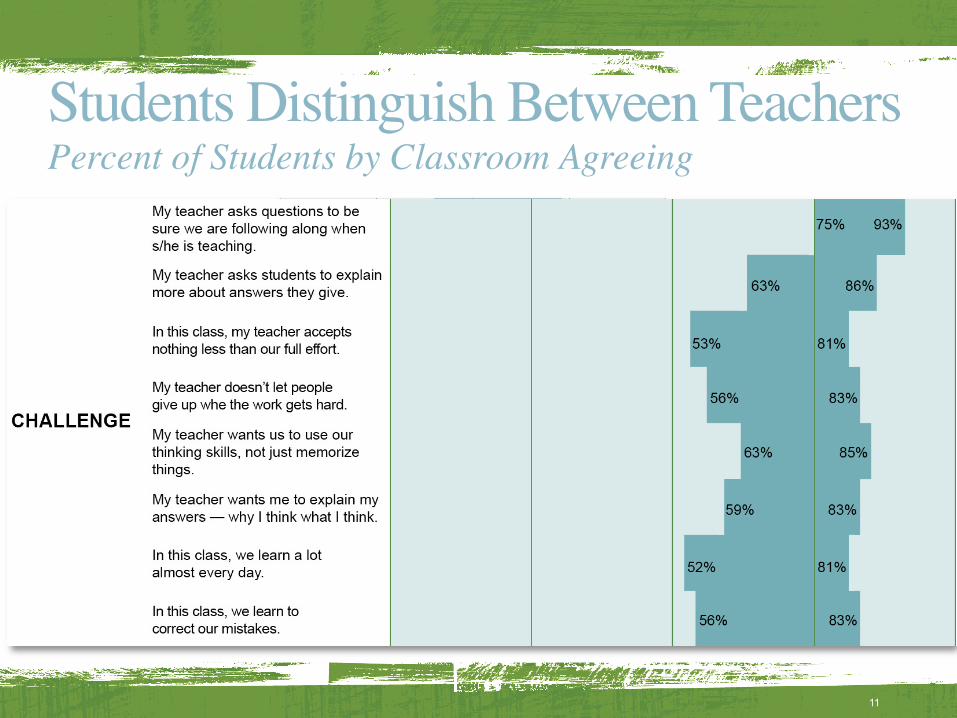
Students Distinguish Between Teachers���Percent of Students by Classroom Agreeing

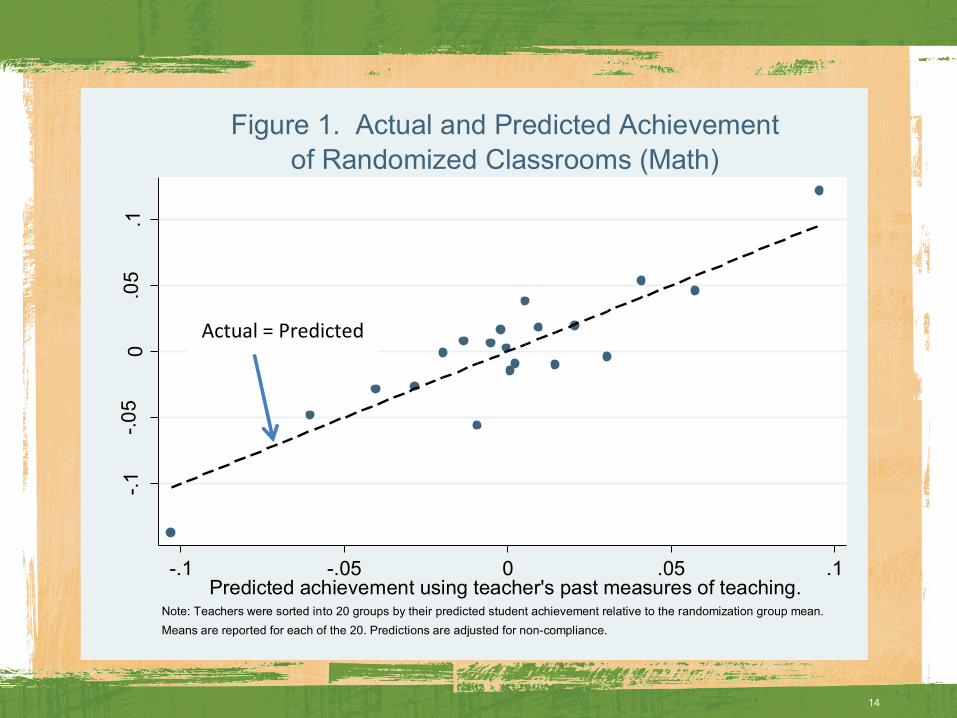
Finding: 4. The teachers identified as more effective caused
students to learn more. • We know because we randomly assigned teachers to
different students.
12

13
14
-.1-.0
50
.05
.1
Act
ual A
chie
vem
ent a
fter R
ando
m A
ssig
nmen
t
-.1 -.05 0 .05 .1Predicted achievement using teacher's past measures of teaching.
Note: Teachers were sorted into 20 groups by their predicted student achievement relative to the randomization group mean. Means are reported for each of the 20. Predictions are adjusted for non-compliance.
of Randomized Classrooms (Math)Figure 1. Actual and Predicted Achievement
Actual = Predicted

15
-.1-.0
50
.05
.1
Act
ual A
chie
vem
ent a
fter R
ando
m A
ssig
nmen
t
-.1 -.05 0 .05 .1Predicted achievement using teacher's past measures of teaching.
Note: Teachers were sorted into 20 groups by their predicted student achievement relative to the randomization group mean.Means are reported for each of the 20. Predictions are adjusted for non-compliance.
of Randomized Classrooms (ELA)Figure 2. Actual and Predicted Achievement
Actual = Predicted
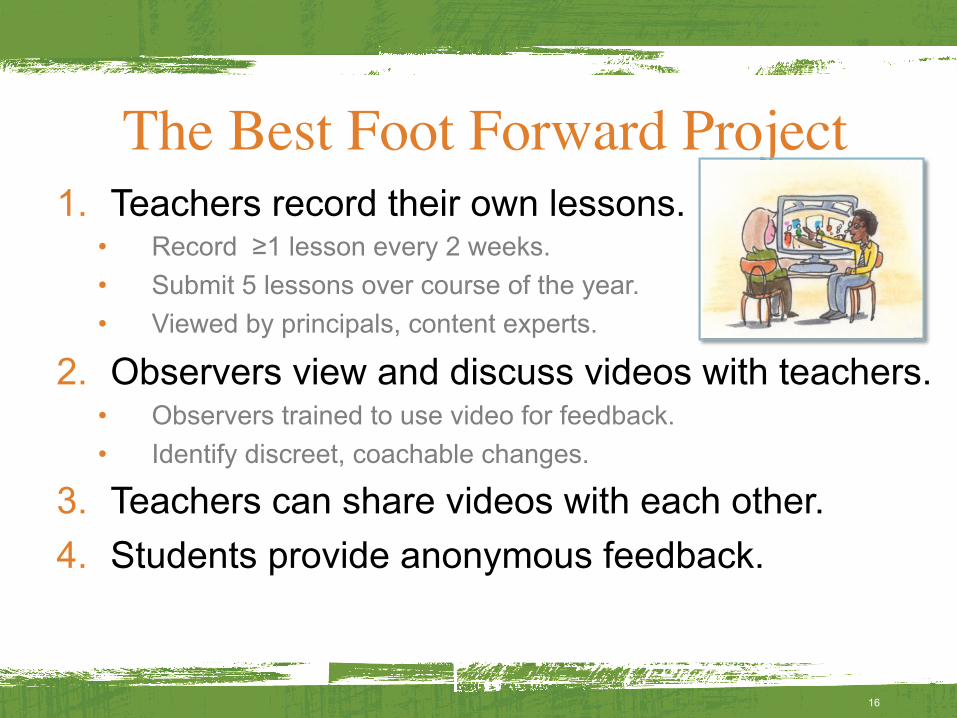
The Best Foot Forward Project 1. Teachers record their own lessons.
• Record ≥1 lesson every 2 weeks. • Submit 5 lessons over course of the year. • Viewed by principals, content experts.
2. Observers view and discuss videos with teachers. • Observers trained to use video for feedback. • Identify discreet, coachable changes.
3. Teachers can share videos with each other. 4. Students provide anonymous feedback.
16