Embed Size (px)
Citation preview
Cross-Screen Impact of
Free-to-Play
Peter Warman | CEO Newzoo | [email protected] Offenbach, November 2012
Let’s lean back for a moment.
© 2012 Newzoo www.newzoo.com


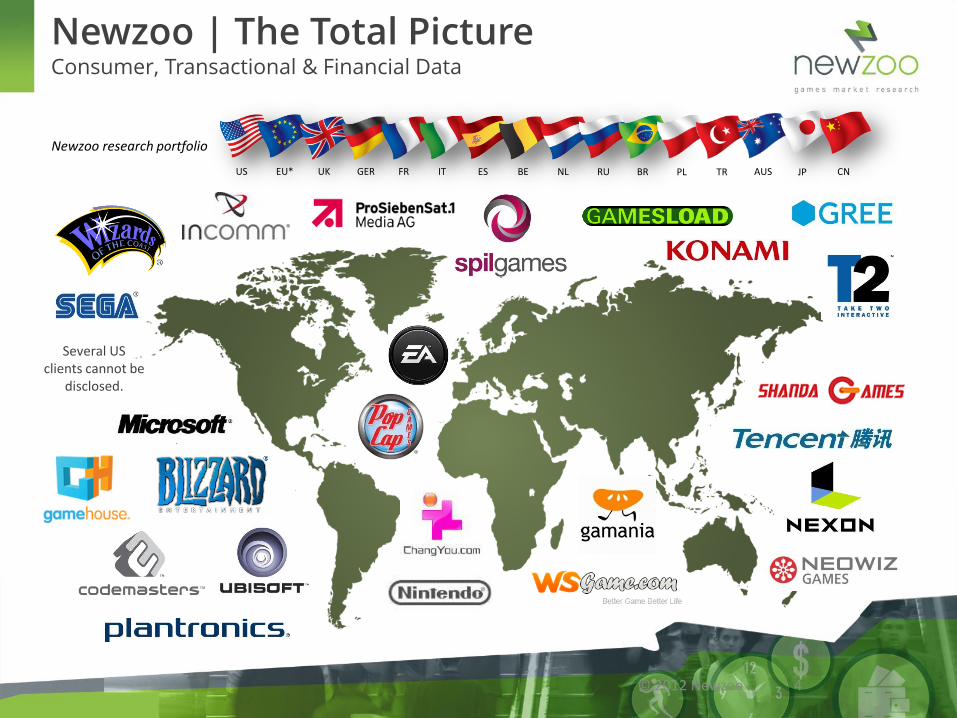
US EU* UK GER FR IT ES BE NL RU BR PL TR AUS JP CN
Newzoo research portfolio
Newzoo | The Total Picture Consumer, Transactional & Financial Data
© 2012 Newzoo 4
Several US clients cannot be
disclosed.
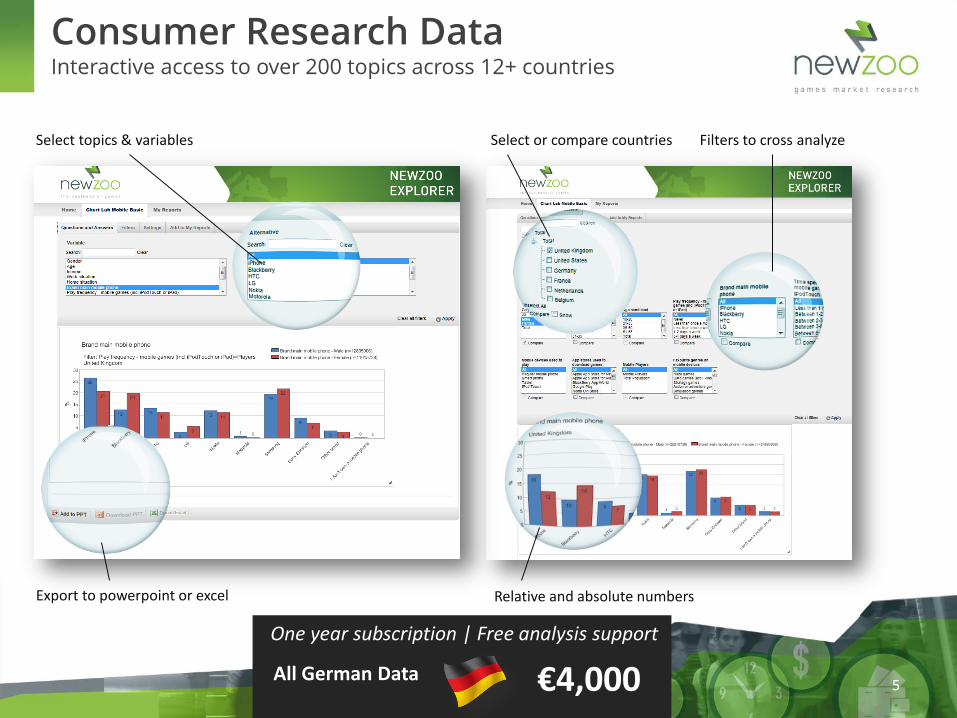
Consumer Research Data Interactive access to over 200 topics across 12+ countries
Export to powerpoint or excel
Select topics & variables Select or compare countries Filters to cross analyze
Relative and absolute numbers
5
One year subscription | Free analysis support
€4,000 All German Data
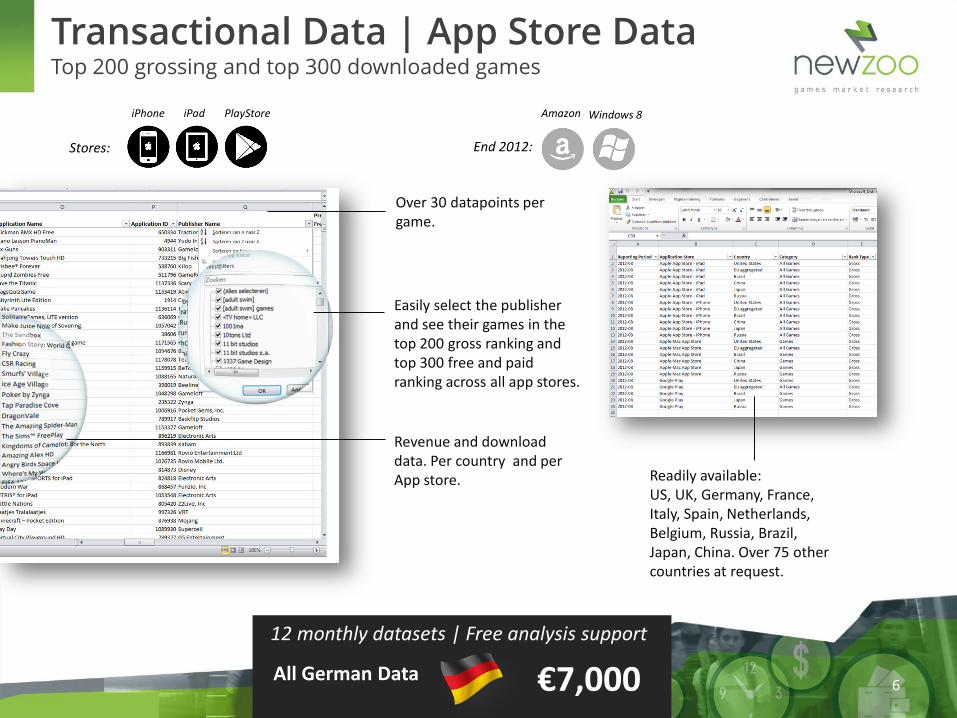
Transactional Data | App Store Data Top 200 grossing and top 300 downloaded games
Easily select the publisher and see their games in the top 200 gross ranking and top 300 free and paid ranking across all app stores.
Revenue and download data. Per country and per App store.
Over 30 datapoints per game.
Stores:
iPhone iPad PlayStore Amazon Windows 8
End 2012:
6
Readily available: US, UK, Germany, France, Italy, Spain, Netherlands, Belgium, Russia, Brazil, Japan, China. Over 75 other countries at request.
12 monthly datasets | Free analysis support
€7,000 All German Data
investors
“social gaming is dead” “social gaming was a bubble. Its gone now.”
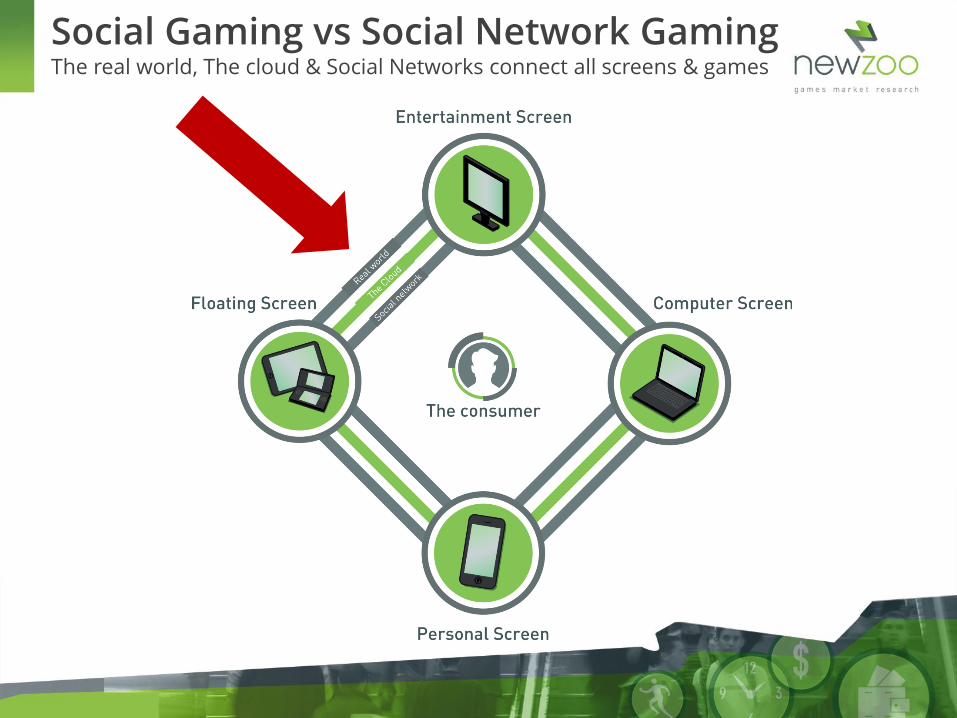
Social Gaming vs Social Network Gaming The real world, The cloud & Social Networks connect all screens & games
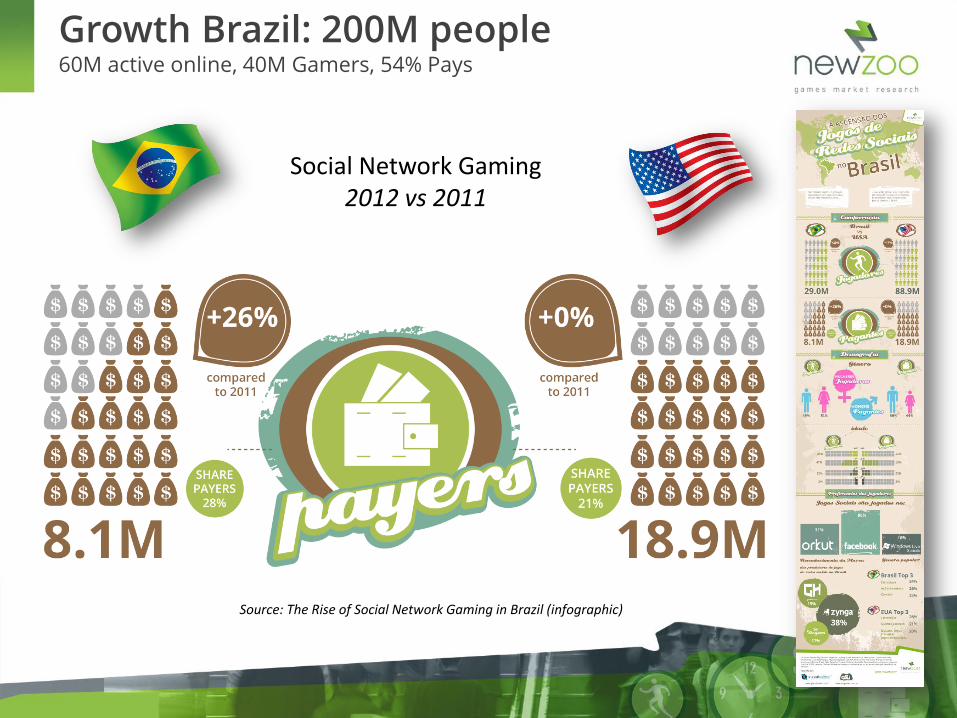
Growth Brazil: 200M people 60M active online, 40M Gamers, 54% Pays
Social Network Gaming 2012 vs 2011
Source: The Rise of Social Network Gaming in Brazil (infographic)
10
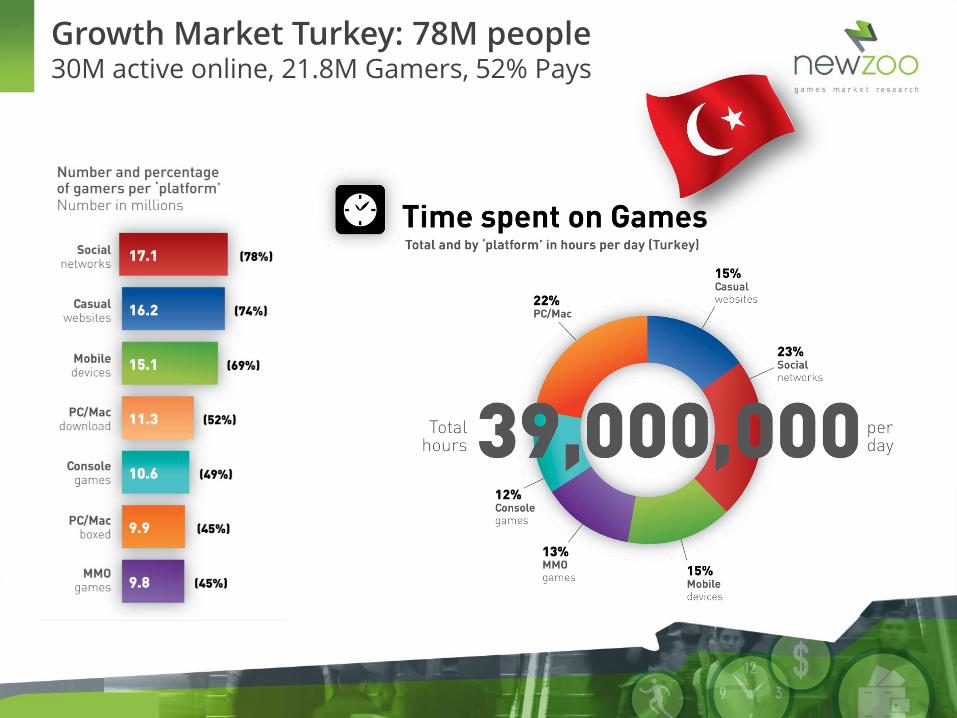
Growth Market Turkey: 78M people 30M active online, 21.8M Gamers, 52% Pays
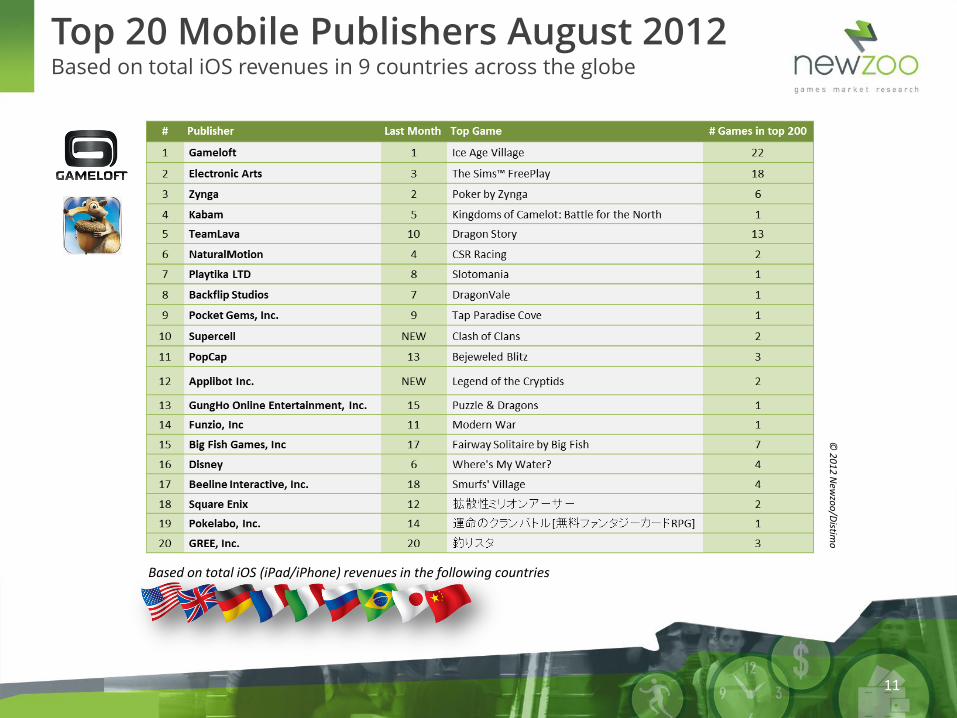
Top 20 Mobile Publishers August 2012 Based on total iOS revenues in 9 countries across the globe
Based on total iOS (iPad/iPhone) revenues in the following countries
© 2
01
2 N
ewzo
o/D
istimo
11
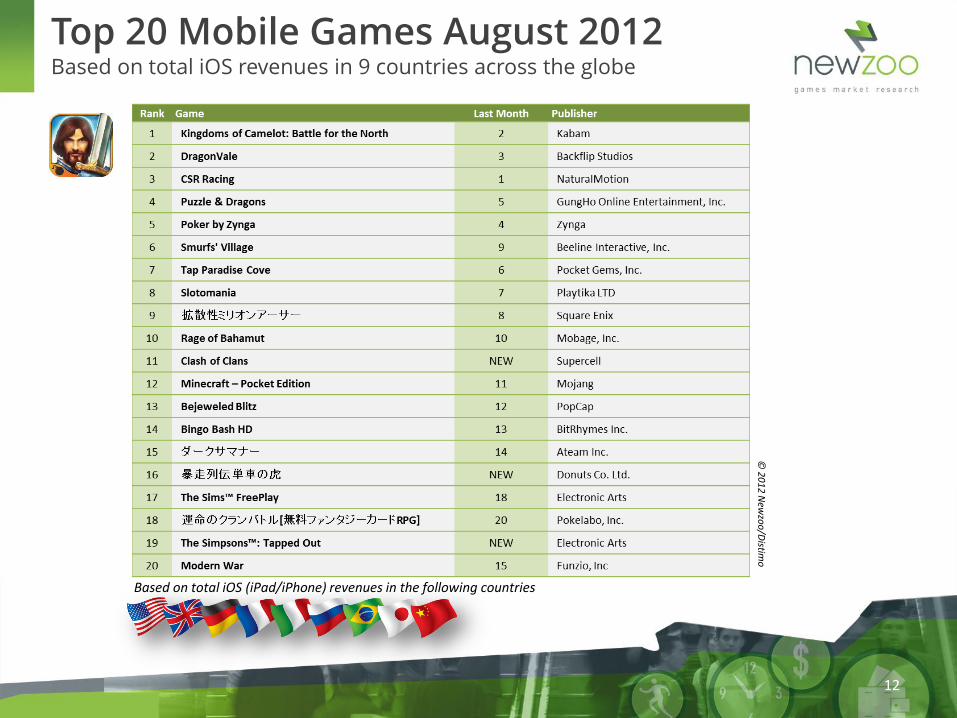
Top 20 Mobile Games August 2012 Based on total iOS revenues in 9 countries across the globe
Based on total iOS (iPad/iPhone) revenues in the following countries
© 2
01
2 N
ewzo
o/D
istimo
12
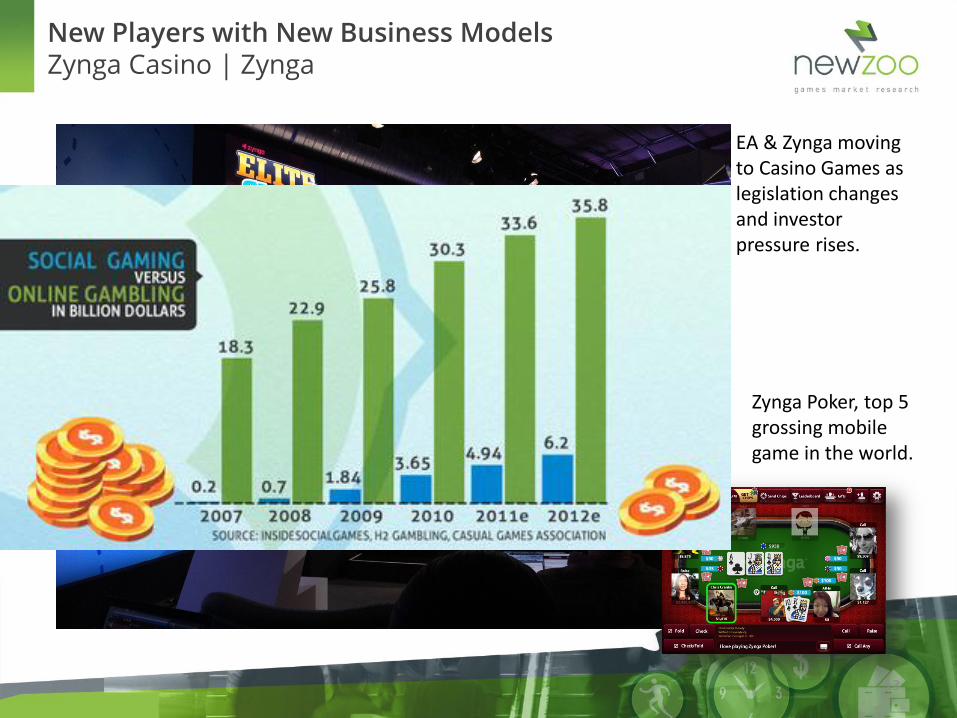
EA & Zynga moving to Casino Games as legislation changes and investor pressure rises.
Zynga Poker, top 5 grossing mobile game in the world.
New Players with New Business Models Zynga Casino | Zynga
13


I promised that we would... Lean back

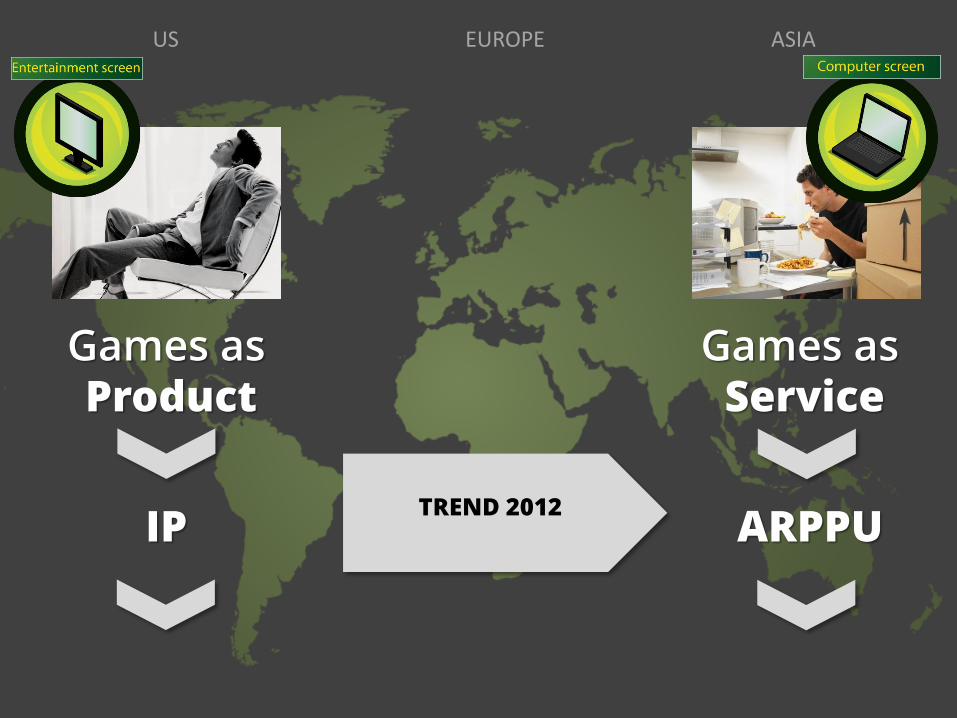
Games as Product
Games as Service
IP ARPPU
US EUROPE ASIA
TREND 2012
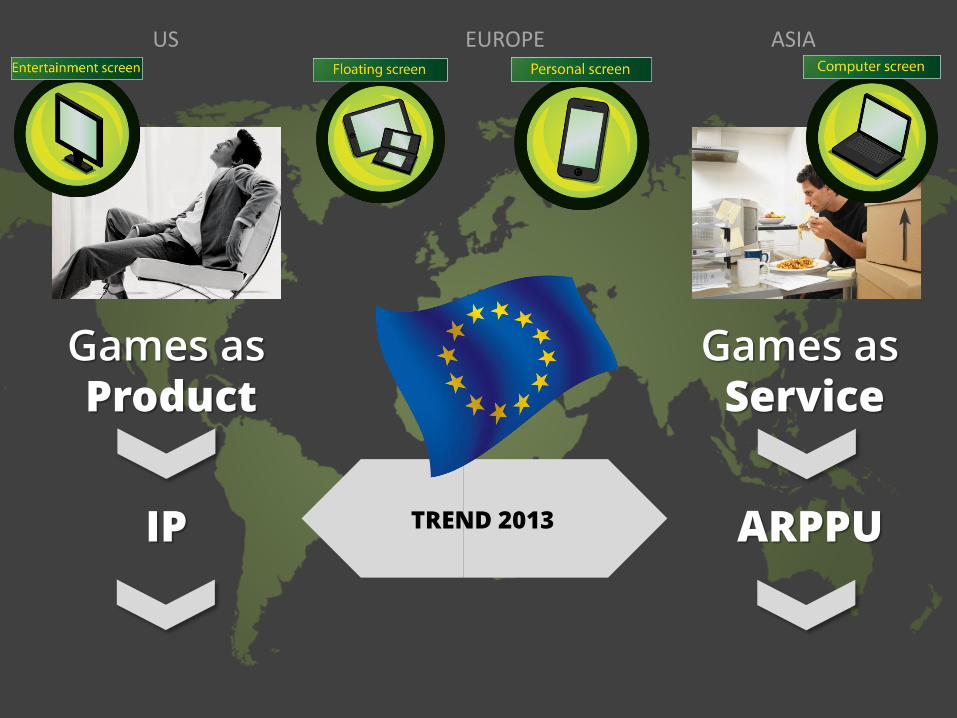
Games as Product
Games as Service
IP ARPPU
US EUROPE ASIA
TREND 2013
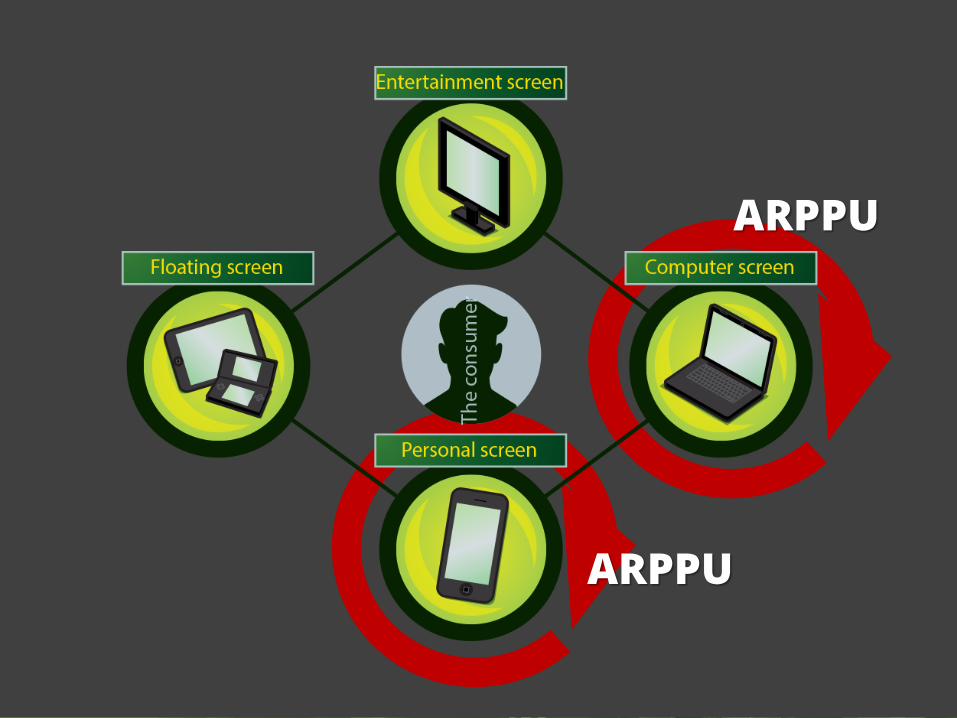
ARPPU
ARPPU
ARPPU
ARPPU
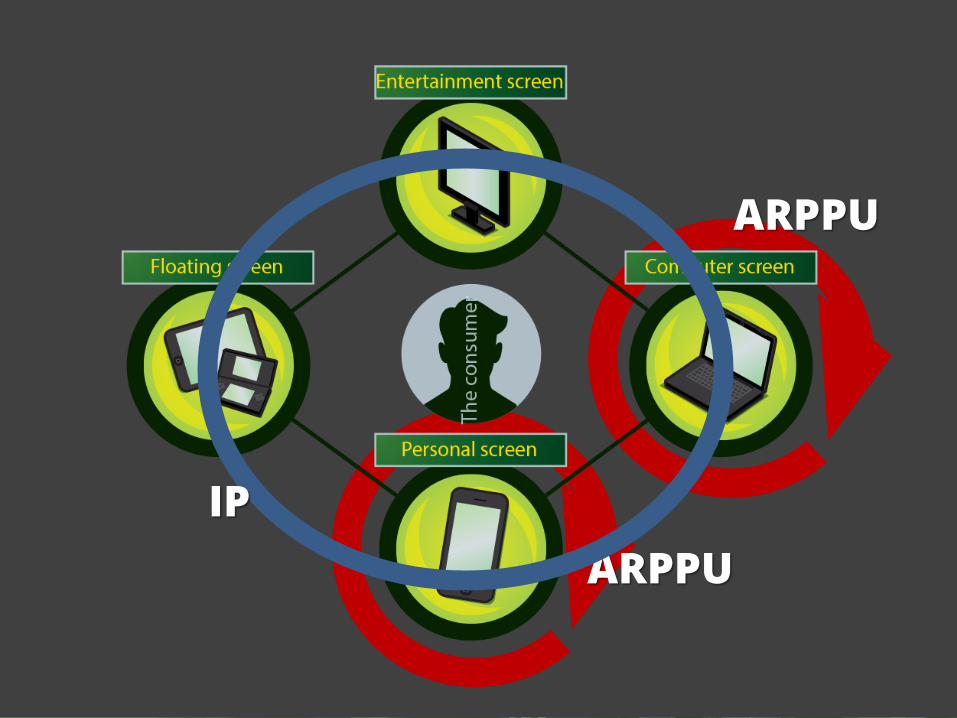
IP
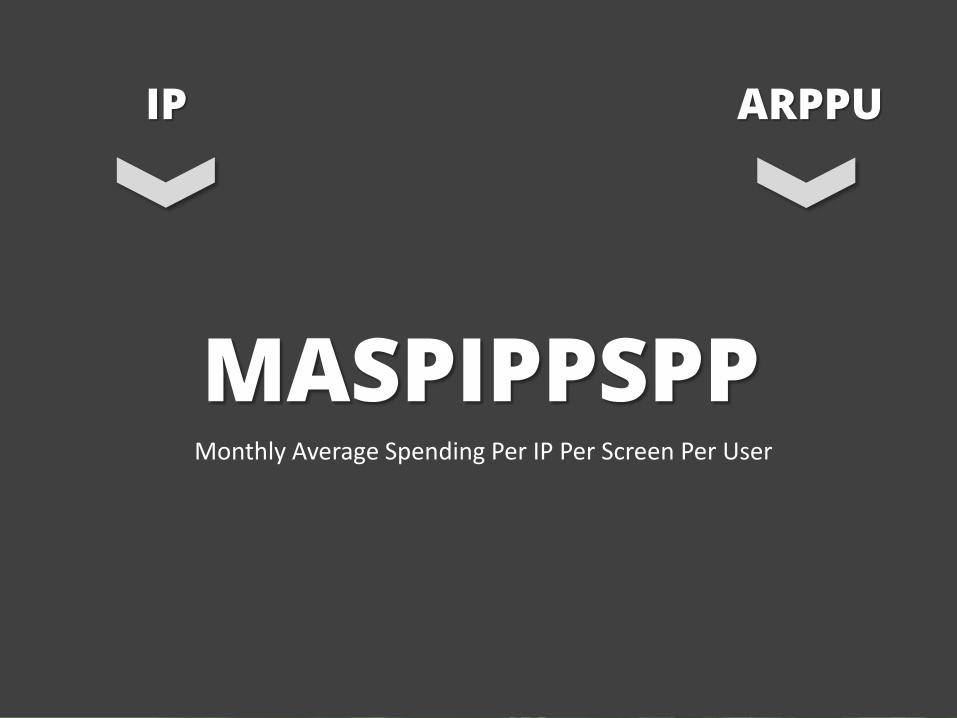
IP ARPPU
MASPIPPSPP Monthly Average Spending Per IP Per Screen Per User

Lean back and….. Look at the Global/Total Picture
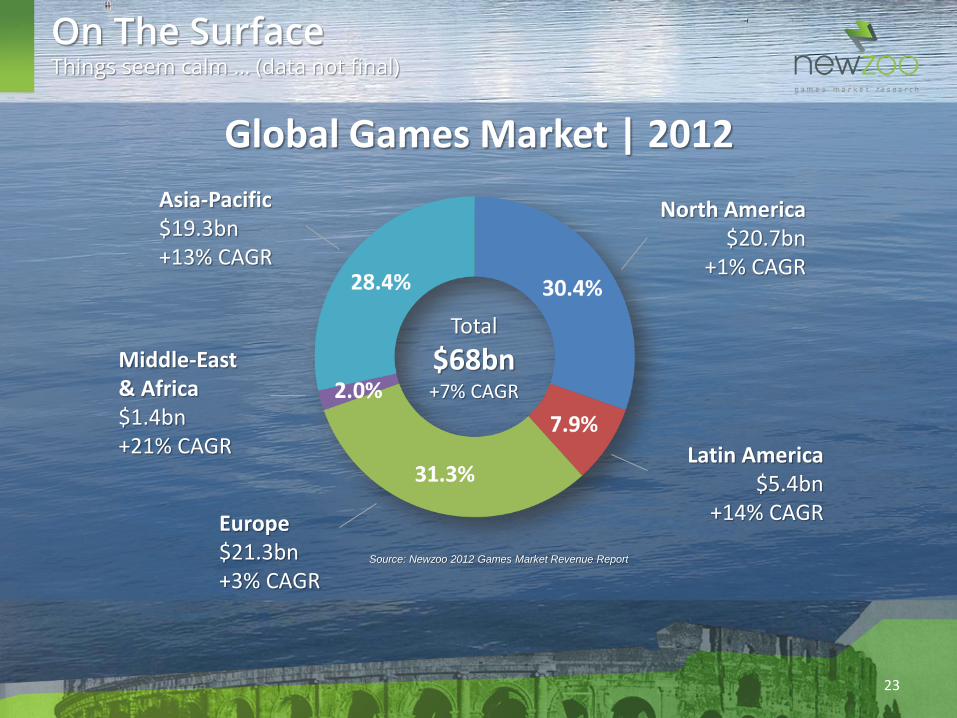
On The Surface Things seem calm … (data not final)
North America $20.7bn
+1% CAGR
Europe $21.3bn +3% CAGR
Latin America $5.4bn
+14% CAGR
Middle-East & Africa $1.4bn +21% CAGR
Asia-Pacific $19.3bn +13% CAGR
Total
$68bn +7% CAGR
Source: Newzoo 2012 Games Market Revenue Report
Global Games Market | 2012
23
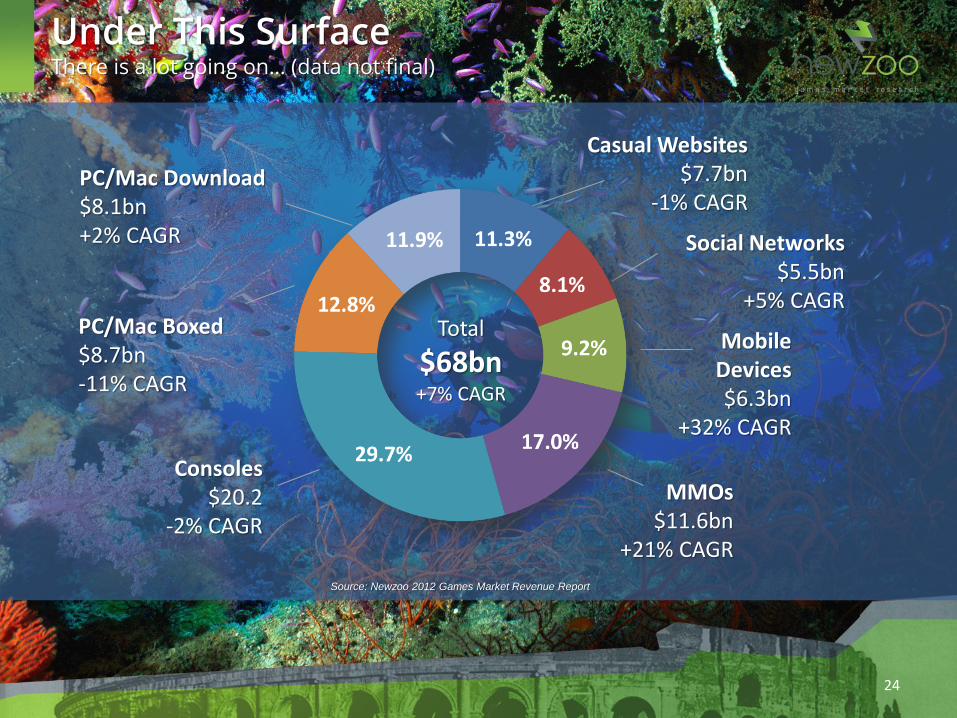
Under This Surface There is a lot going on… (data not final)
Mobile Devices $6.3bn
+32% CAGR
MMOs $11.6bn
+21% CAGR
Consoles $20.2
-2% CAGR
PC/Mac Download $8.1bn +2% CAGR
Casual Websites $7.7bn
-1% CAGR
PC/Mac Boxed $8.7bn -11% CAGR
Social Networks $5.5bn
+5% CAGR Total
$68bn +7% CAGR
Source: Newzoo 2012 Games Market Revenue Report
24


Lean back and….. Think about how to monitor change
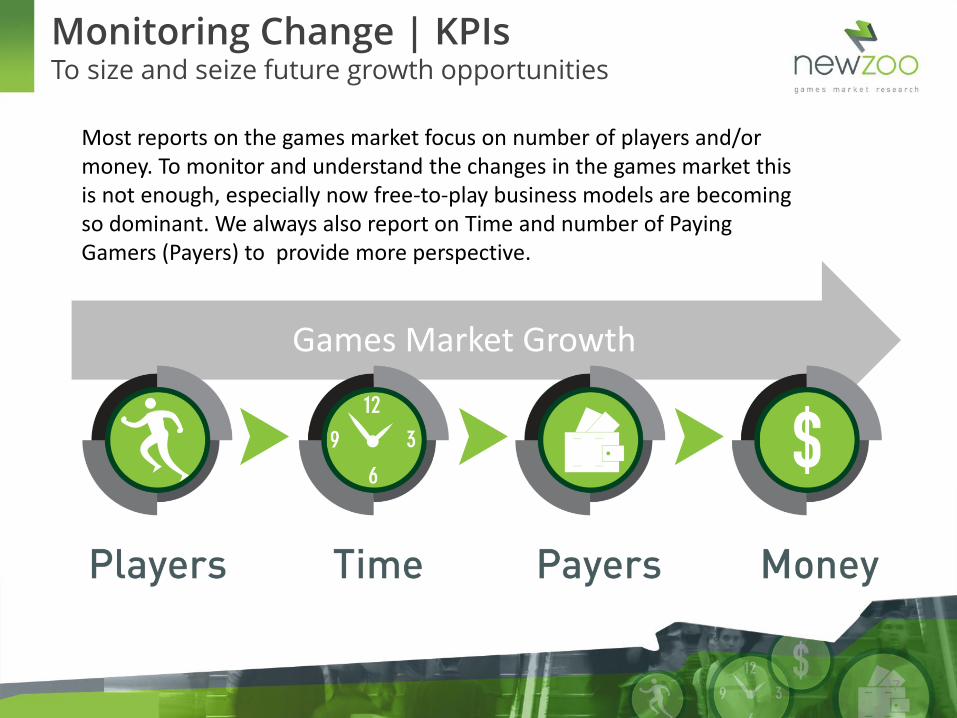
Monitoring Change | KPIs To size and seize future growth opportunities
Games Market Growth
Most reports on the games market focus on number of players and/or money. To monitor and understand the changes in the games market this is not enough, especially now free-to-play business models are becoming so dominant. We always also report on Time and number of Paying Gamers (Payers) to provide more perspective.
27
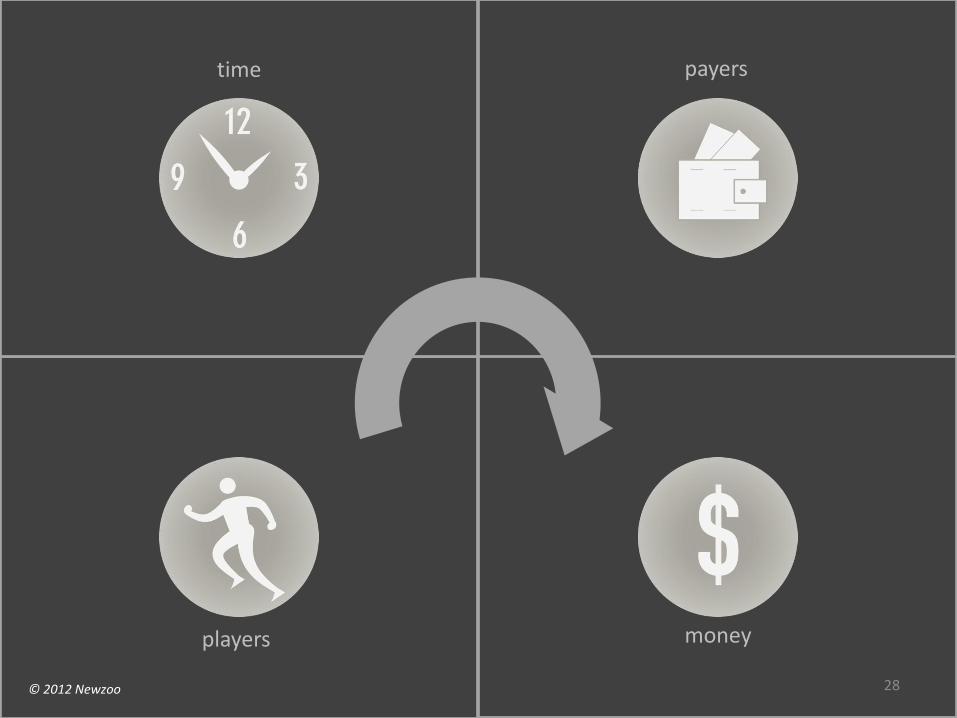
players
time payers
money
© 2012 Newzoo 28
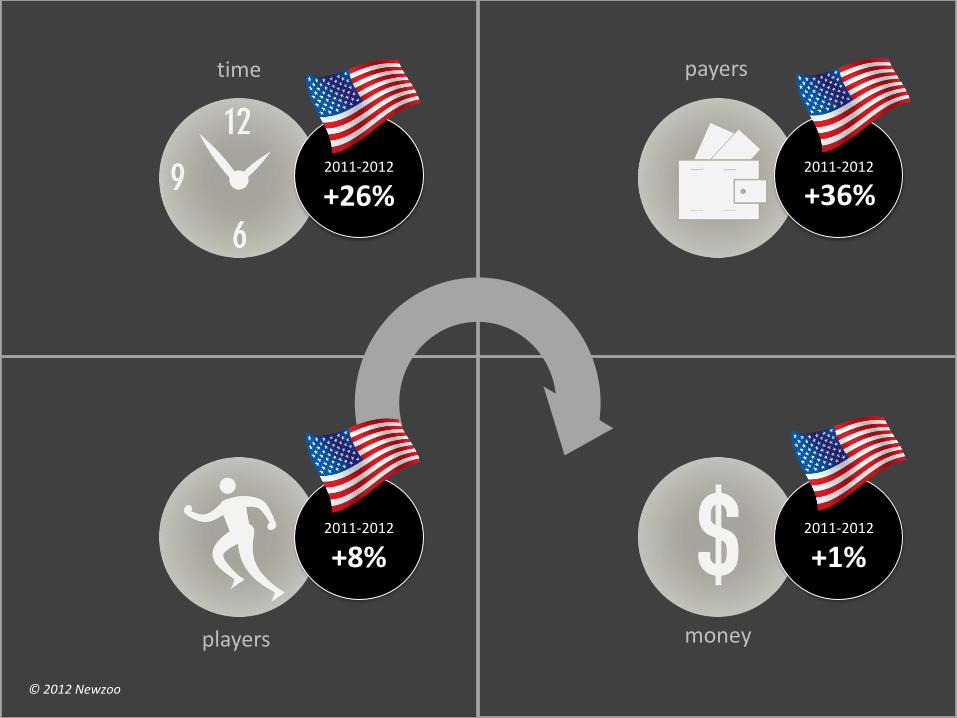
Key Growth Indicators | With Key Trends In Between
29
players
time payers
money
© 2012 Newzoo
2011-2012
+8%
2011-2012
+26%
2011-2012
+1%
2011-2012
+36%
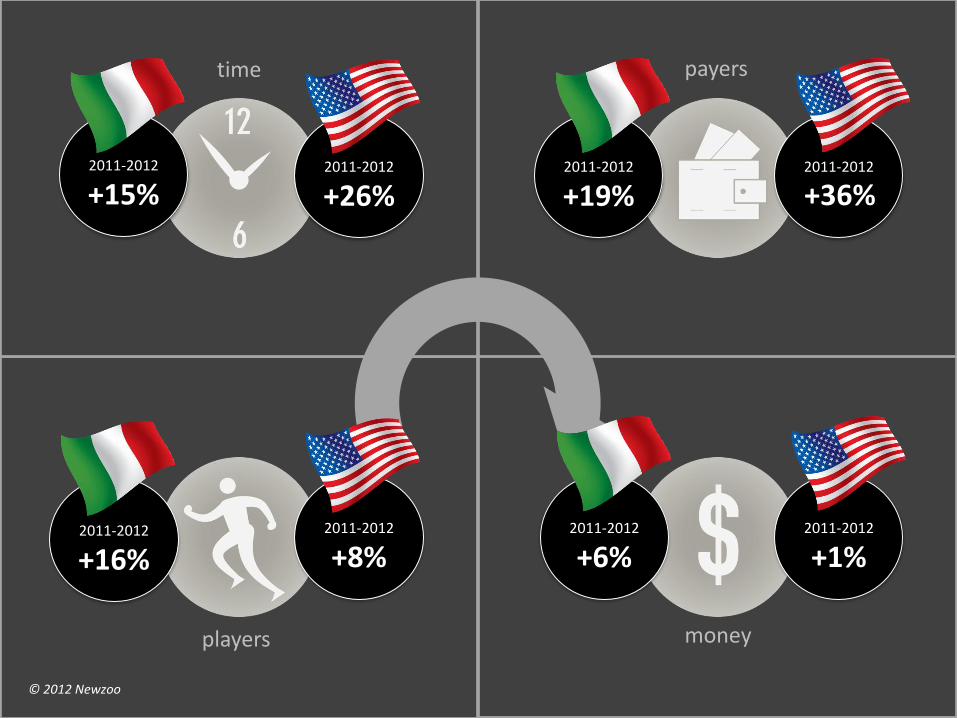
Key Growth Indicators | With Key Trends In Between
30
players
time payers
money
© 2012 Newzoo
2011-2012
+8%
2011-2012
+26%
2011-2012
+1%
2011-2012
2011-2012
+15%
2011-2012
+16%
2011-2012
+19%
2011-2012
+6%
+36%
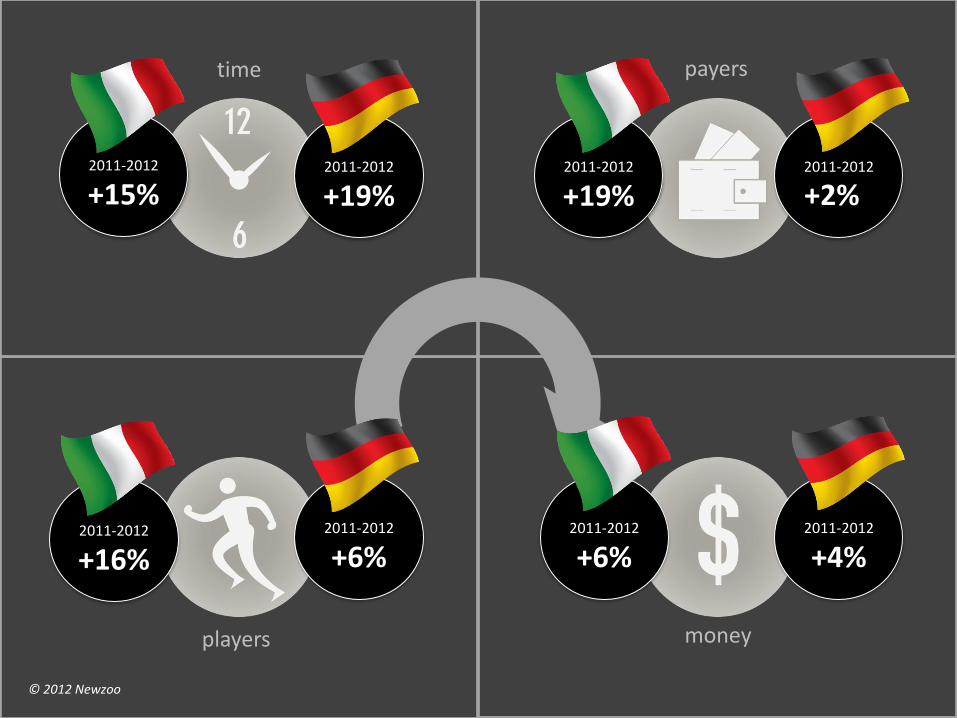
Key Growth Indicators | With Key Trends In Between
31
players
time payers
money
© 2012 Newzoo
2011-2012
+6%
2011-2012
+19%
2011-2012
+4%
2011-2012
2011-2012
+15%
2011-2012
+16%
2011-2012
+19%
2011-2012
+6%
+2%

Lean back and….. Try to understand change
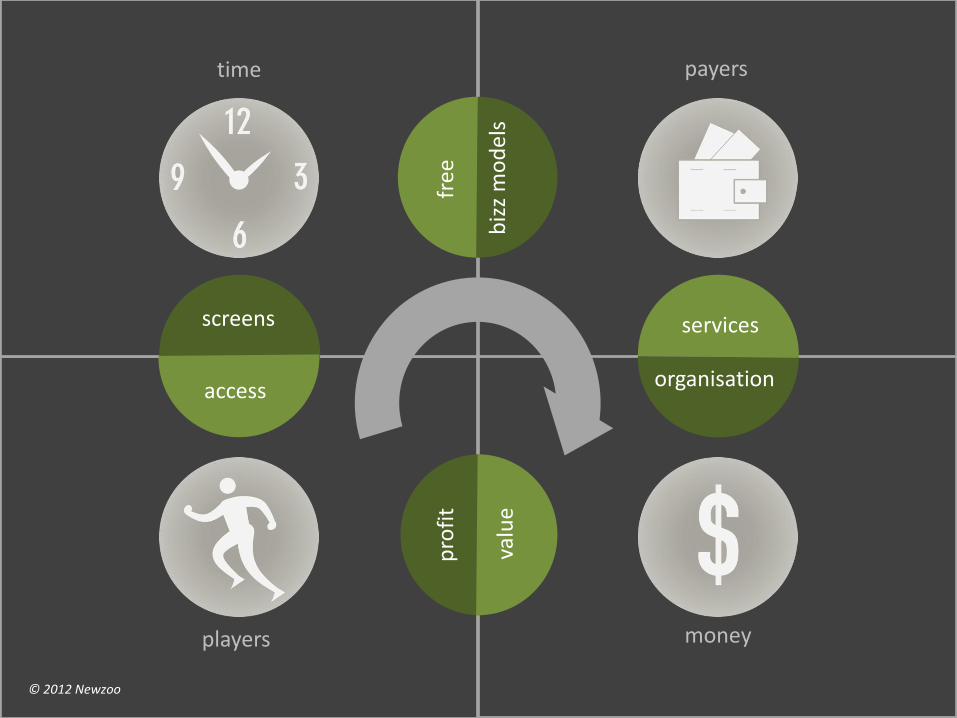
Key Growth Indicators | With Key Trends In Between
33
players
time payers
money
© 2012 Newzoo
access
screens
free
biz
z m
od
els
organisation
services
pro
fit
valu
e
34
Luxembourg, here we are This place is about more than money….
© 2012 Newzoo
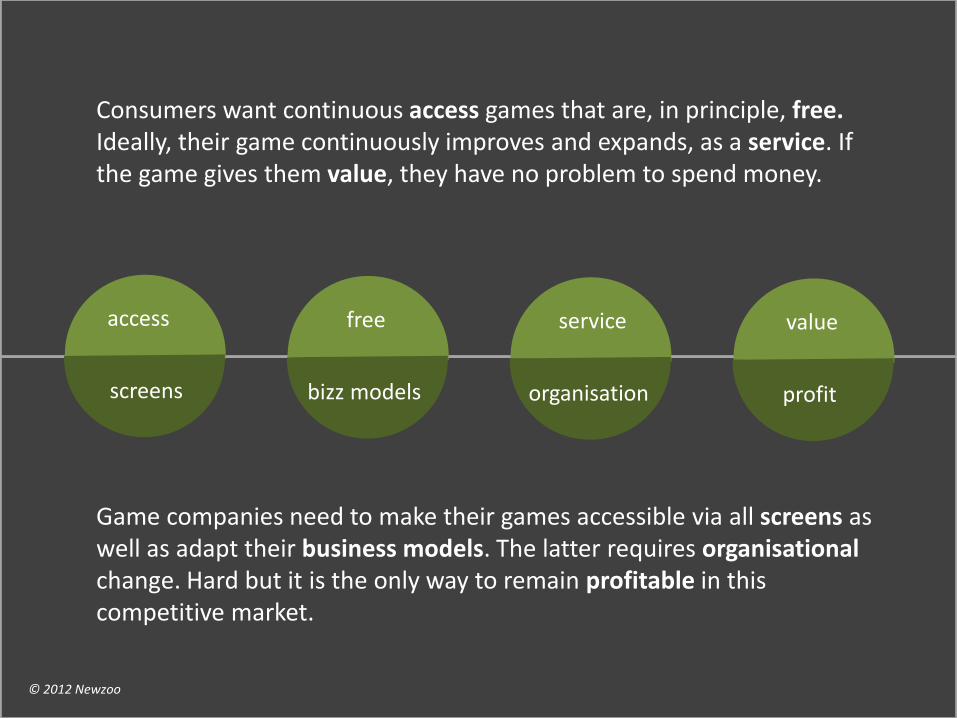
screens
access
bizz models
free
organisation
service
profit
value
Consumers want continuous access games that are, in principle, free. Ideally, their game continuously improves and expands, as a service. If the game gives them value, they have no problem to spend money.
Game companies need to make their games accessible via all screens as well as adapt their business models. The latter requires organisational change. Hard but it is the only way to remain profitable in this competitive market.
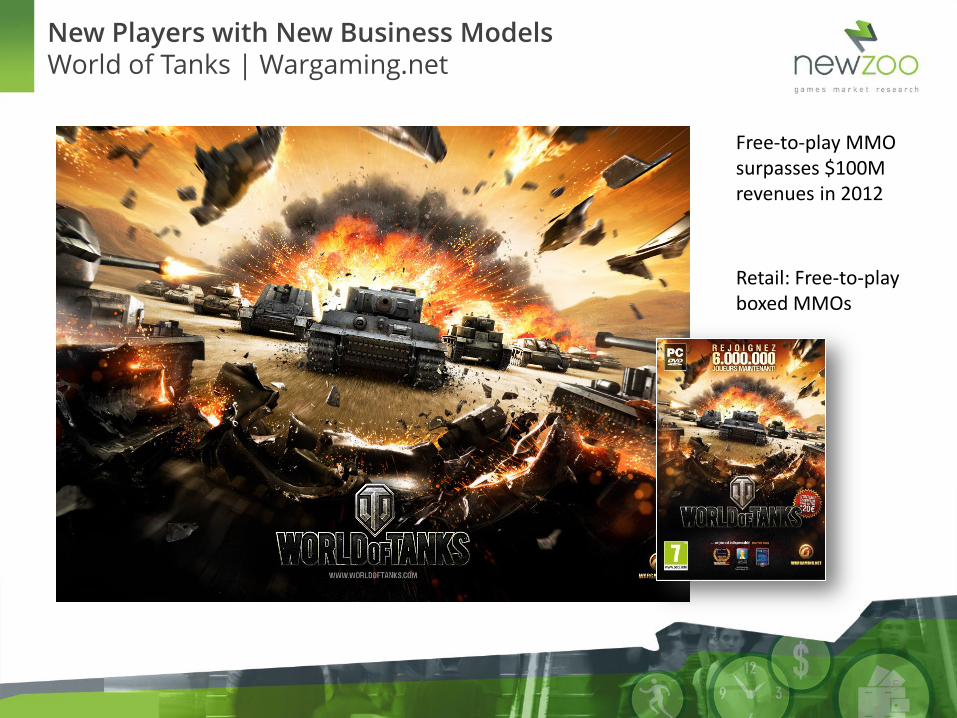
New Players with New Business Models World of Tanks | Wargaming.net
Free-to-play MMO surpasses $100M revenues in 2012
Retail: Free-to-play boxed MMOs
35
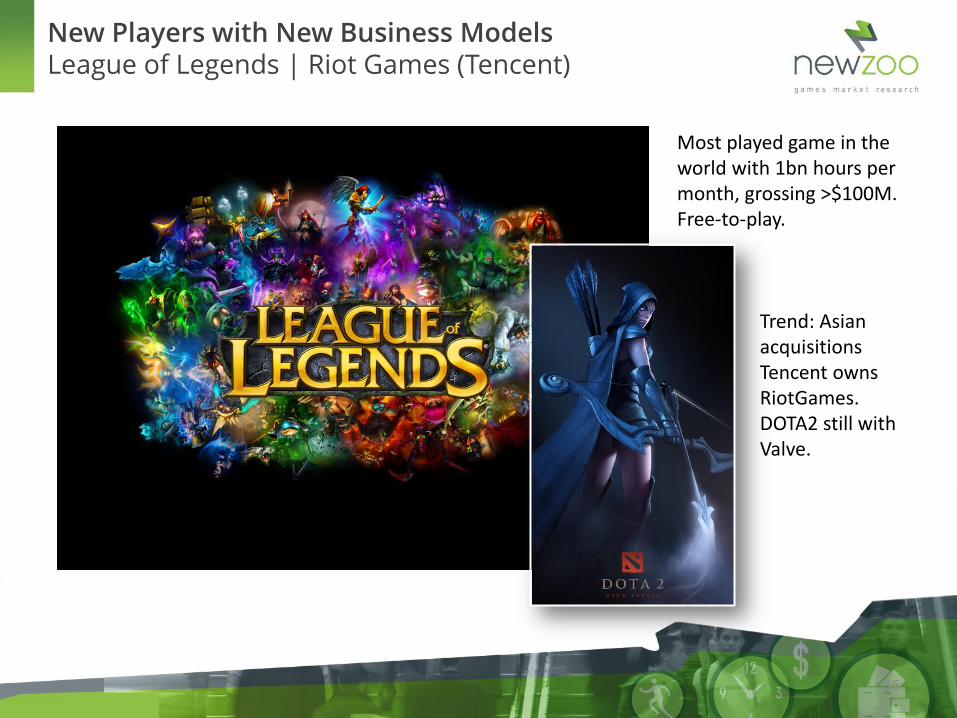
Most played game in the world with 1bn hours per month, grossing >$100M. Free-to-play.
Trend: Asian acquisitions Tencent owns RiotGames. DOTA2 still with Valve.
New Players with New Business Models League of Legends | Riot Games (Tencent)
36
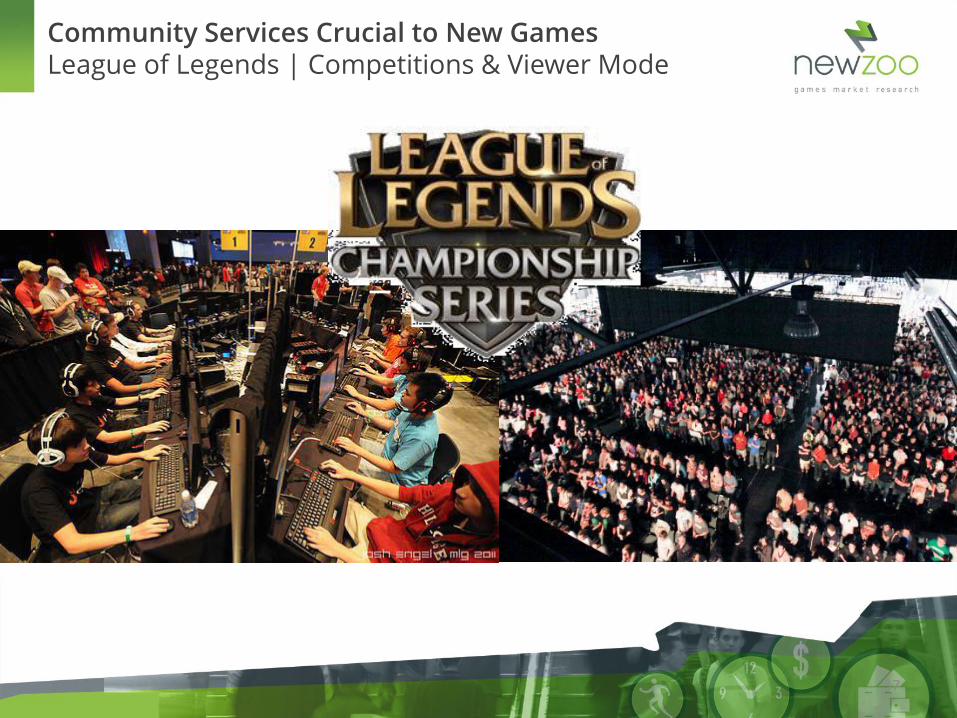
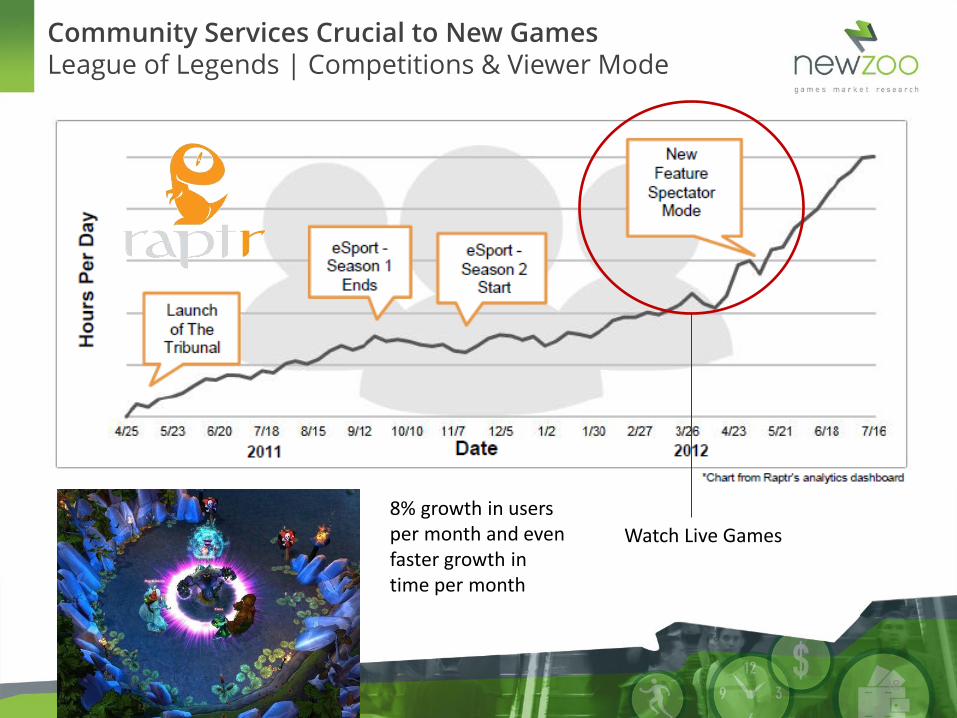
Community Services Crucial to New Games League of Legends | Competitions & Viewer Mode
37
38
8% growth in users per month and even faster growth in time per month
Community Services Crucial to New Games League of Legends | Competitions & Viewer Mode
Watch Live Games
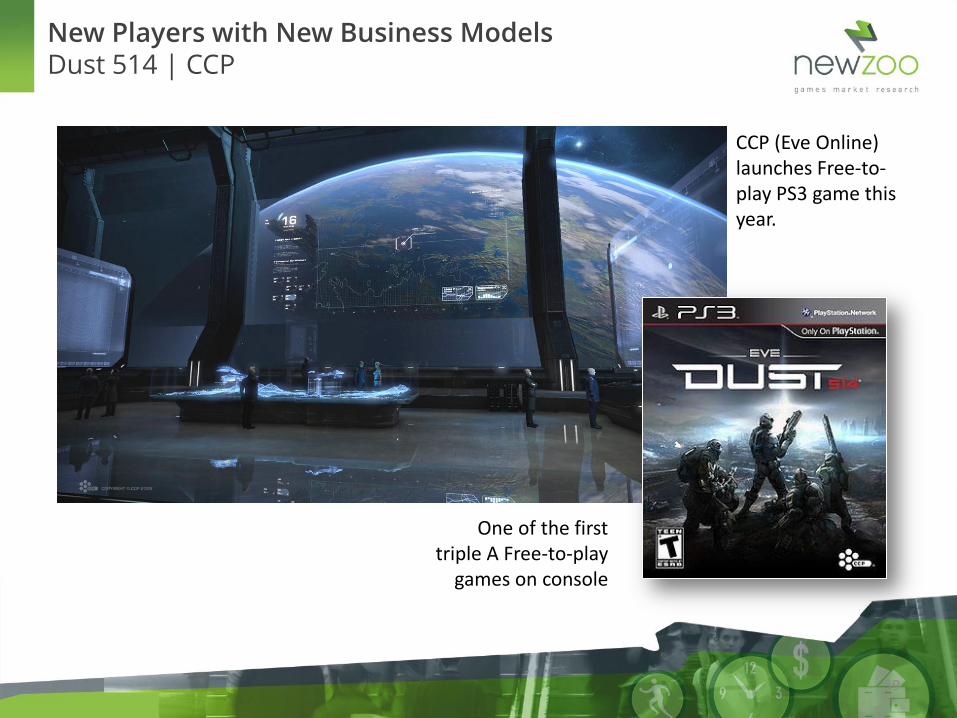
CCP (Eve Online) launches Free-to-play PS3 game this year.
One of the first triple A Free-to-play
games on console
New Players with New Business Models Dust 514 | CCP
39
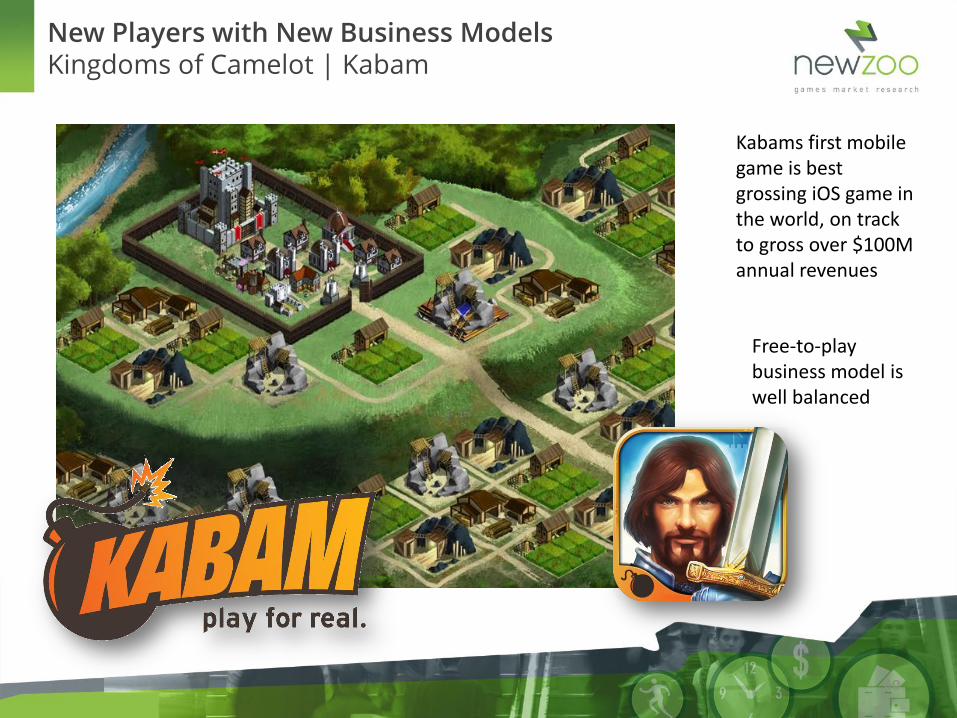
Kabams first mobile game is best grossing iOS game in the world, on track to gross over $100M annual revenues
Free-to-play business model is well balanced
New Players with New Business Models Kingdoms of Camelot | Kabam
40
© 2012 Newzoo/Distimo
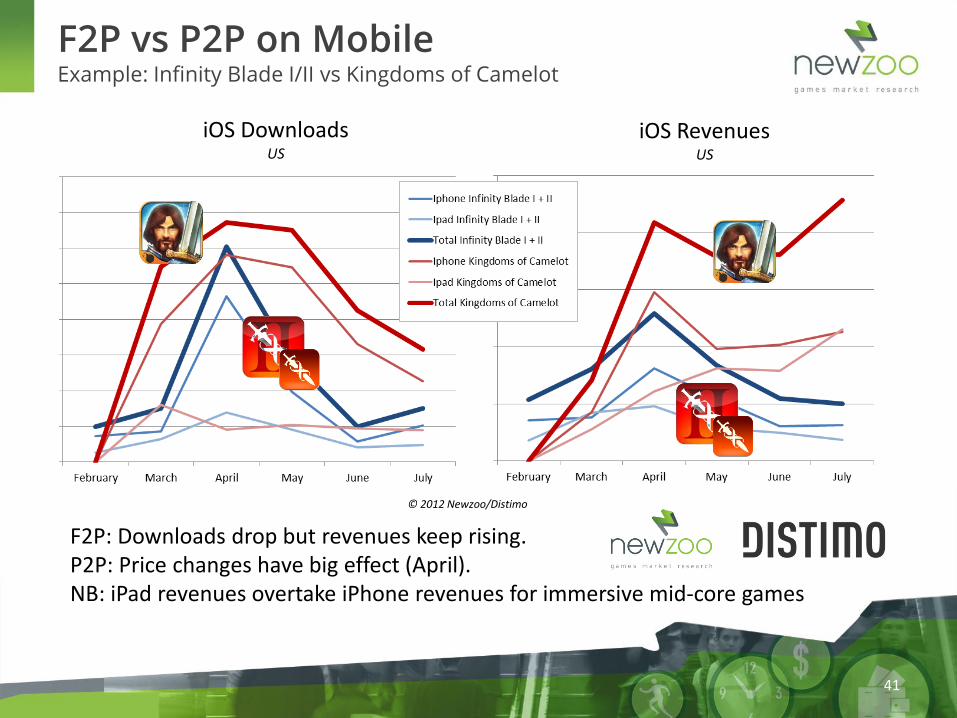
F2P vs P2P on Mobile Example: Infinity Blade I/II vs Kingdoms of Camelot
iOS Downloads US
iOS Revenues US
41
F2P: Downloads drop but revenues keep rising. P2P: Price changes have big effect (April). NB: iPad revenues overtake iPhone revenues for immersive mid-core games

Lean back and….. Think about what free-to-play means
“free-to-play is not a business model but a way
to run your business” - Peter Warman, CEO Newzoo
Quote of the month Why big publishers struggle amidst all the change
Just check out how Star Wars the Old Republic was launched compared to League of Legends (Wikipedia)
43
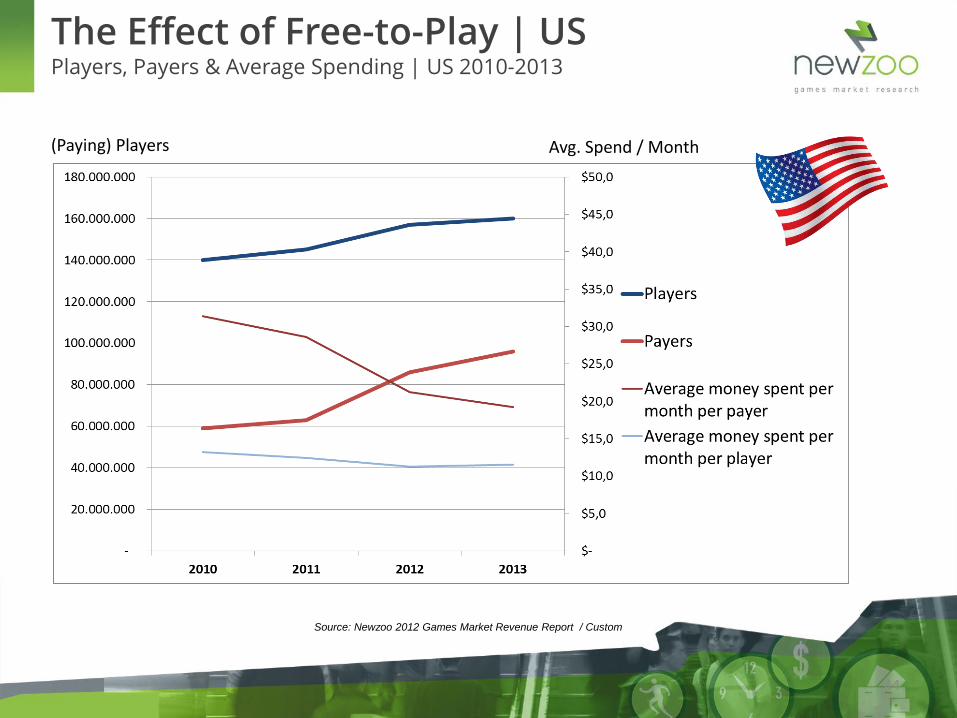
Source: Newzoo 2012 Games Market Revenue Report / Custom
(Paying) Players Avg. Spend / Month
The Effect of Free-to-Play | US Players, Payers & Average Spending | US 2010-2013
44
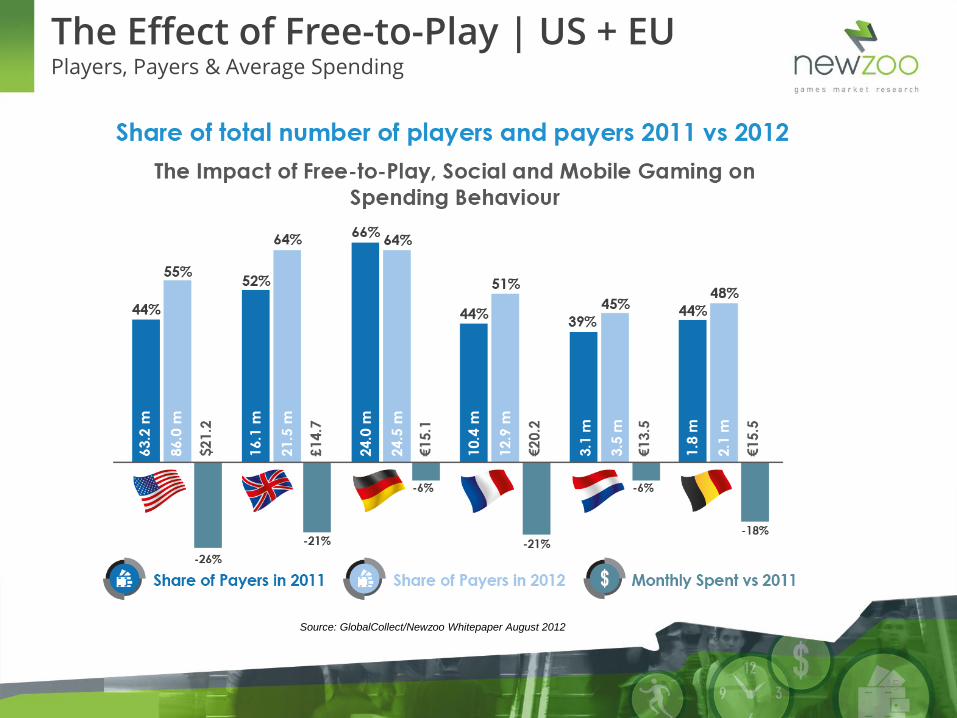
Source: GlobalCollect/Newzoo Whitepaper August 2012
The Effect of Free-to-Play | US + EU Players, Payers & Average Spending
45
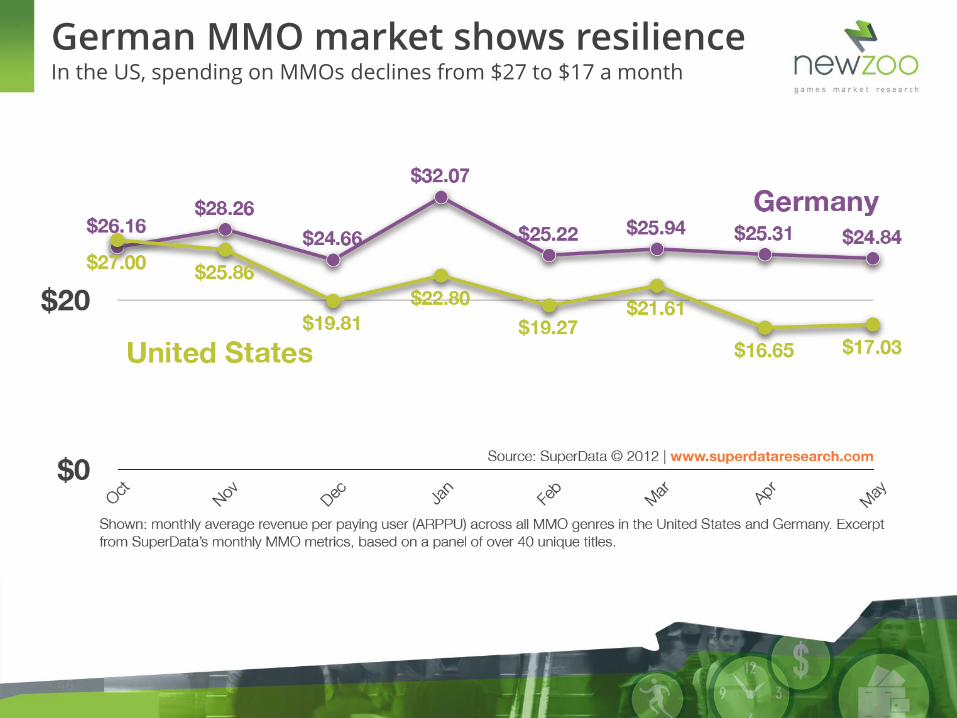
German MMO market shows resilience In the US, spending on MMOs declines from $27 to $17 a month
46
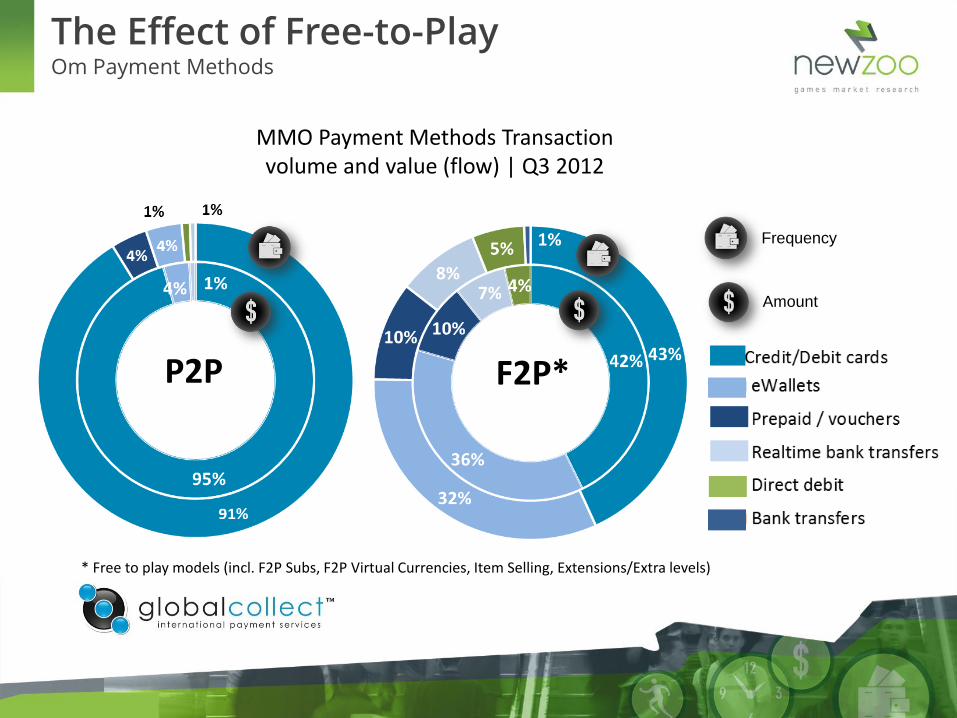
P2P F2P*
MMO Payment Methods Transaction volume and value (flow) | Q3 2012
Frequency
Amount
* Free to play models (incl. F2P Subs, F2P Virtual Currencies, Item Selling, Extensions/Extra levels)
The Effect of Free-to-Play Om Payment Methods

Lean back and….. Think about Amazon
49
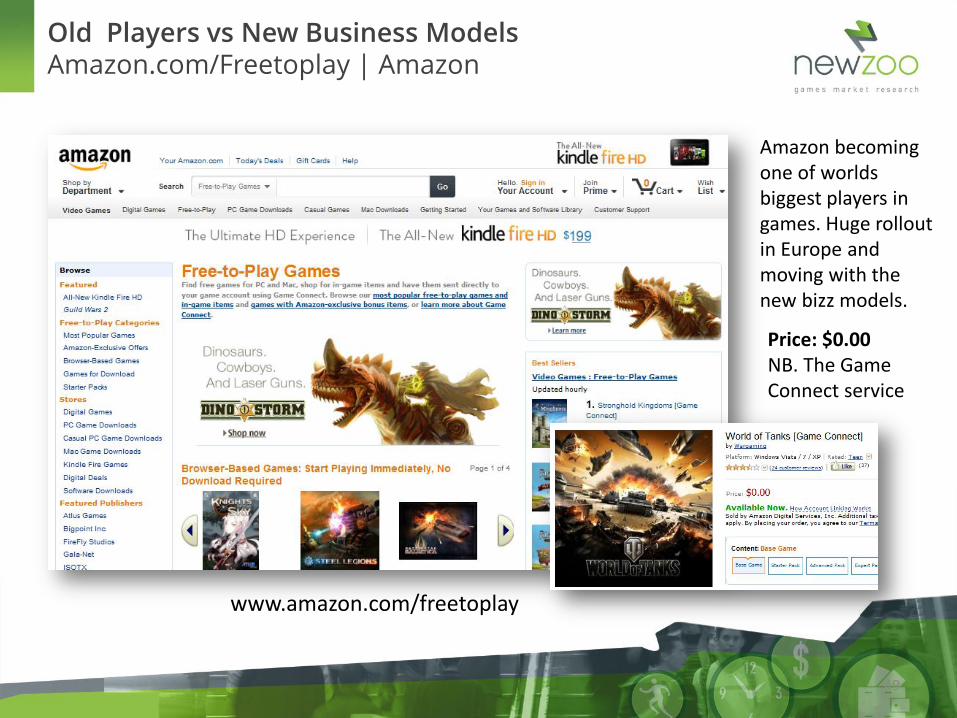
www.amazon.com/freetoplay
Amazon becoming one of worlds biggest players in games. Huge rollout in Europe and moving with the new bizz models.
Price: $0.00 NB. The Game Connect service
Old Players vs New Business Models Amazon.com/Freetoplay | Amazon
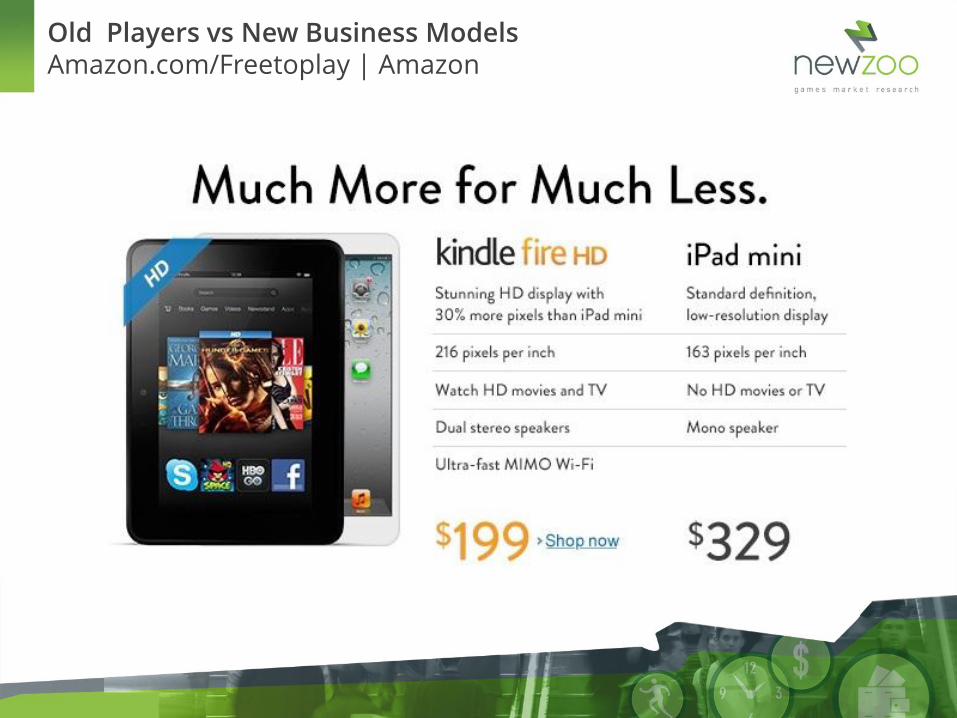
Old Players vs New Business Models Amazon.com/Freetoplay | Amazon

Lean back and….. Think how we can predict, size and seize future opportunities
52
*
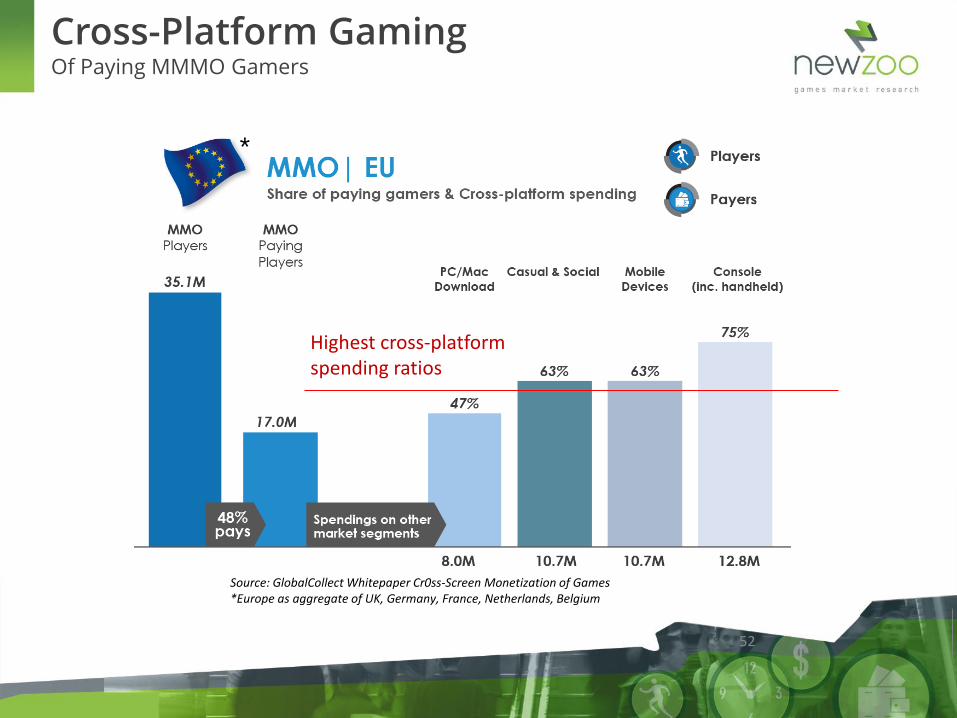
Source: GlobalCollect Whitepaper Cr0ss-Screen Monetization of Games *Europe as aggregate of UK, Germany, France, Netherlands, Belgium
Highest cross-platform spending ratios
Cross-Platform Gaming Of Paying MMMO Gamers
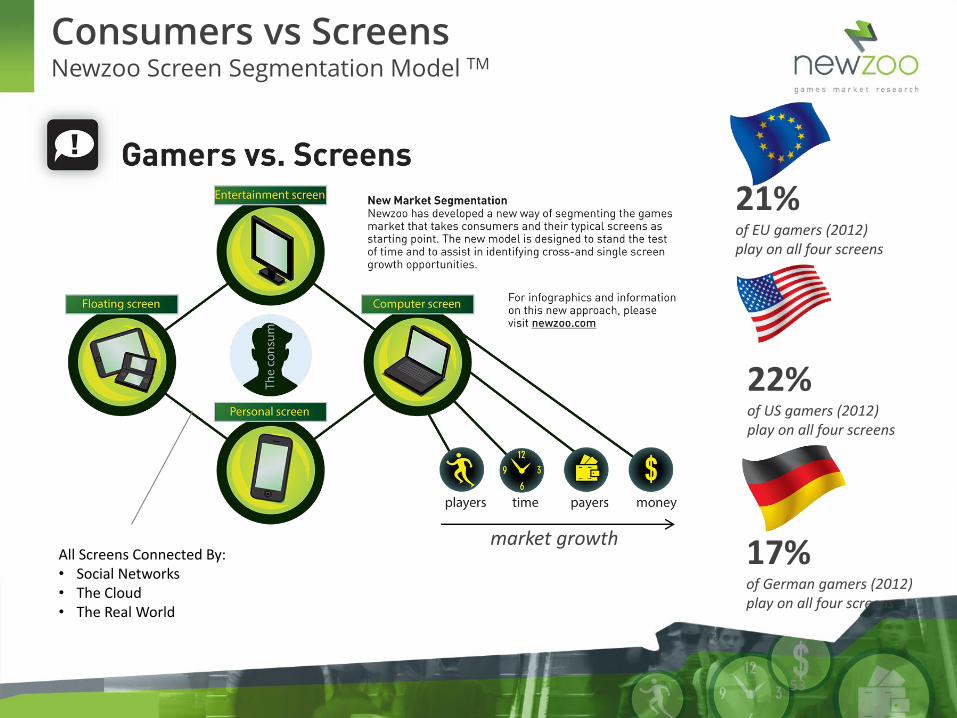
Consumers vs Screens Newzoo Screen Segmentation Model TM
22% of US gamers (2012) play on all four screens
21% of EU gamers (2012) play on all four screens
market growth All Screens Connected By: • Social Networks • The Cloud • The Real World
17% of German gamers (2012) play on all four screens
53
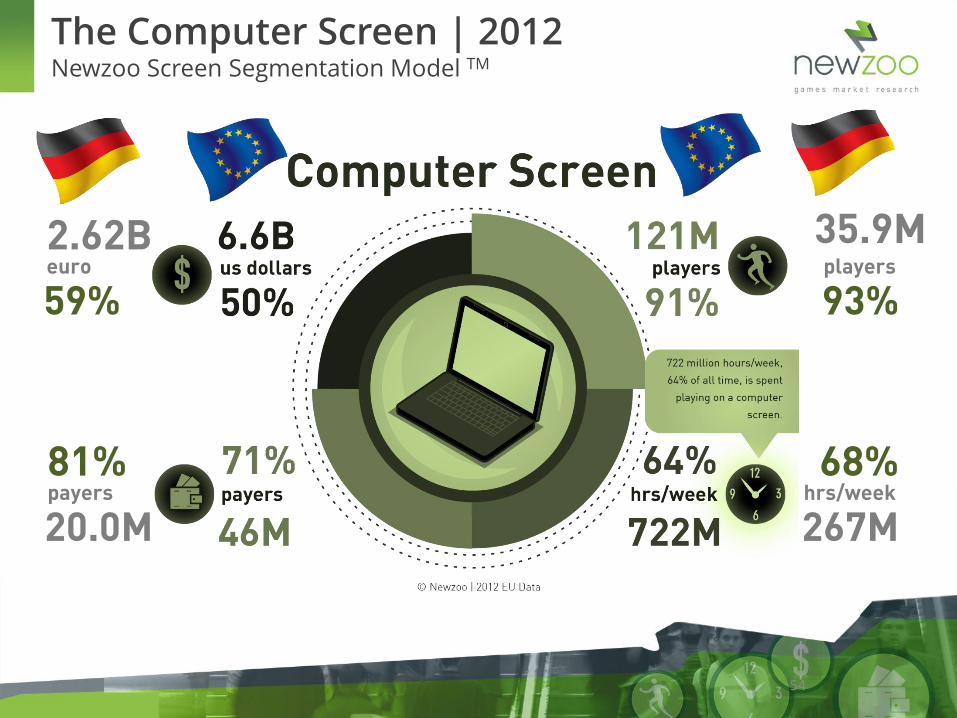
2.62B euro
59%
81% payers
20.0M
35.9M players
93%
68% hrs/week
267M
The Computer Screen | 2012 Newzoo Screen Segmentation Model TM
54
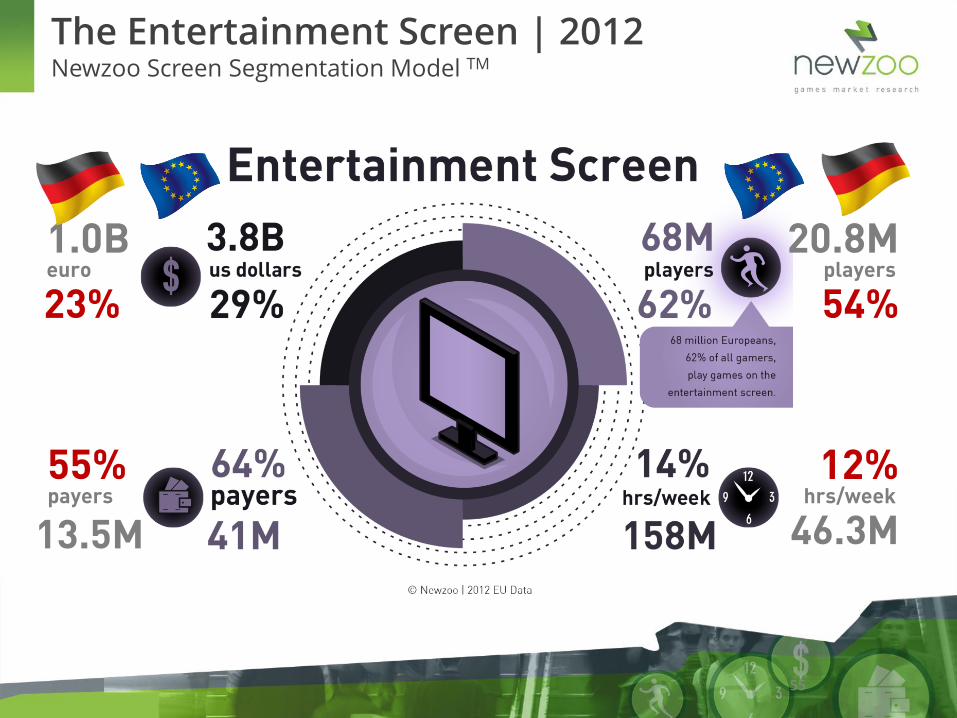
1.0B euro
23%
55% payers
13.5M
20.8M players
54%
12% hrs/week
46.3M
The Entertainment Screen | 2012 Newzoo Screen Segmentation Model TM
55
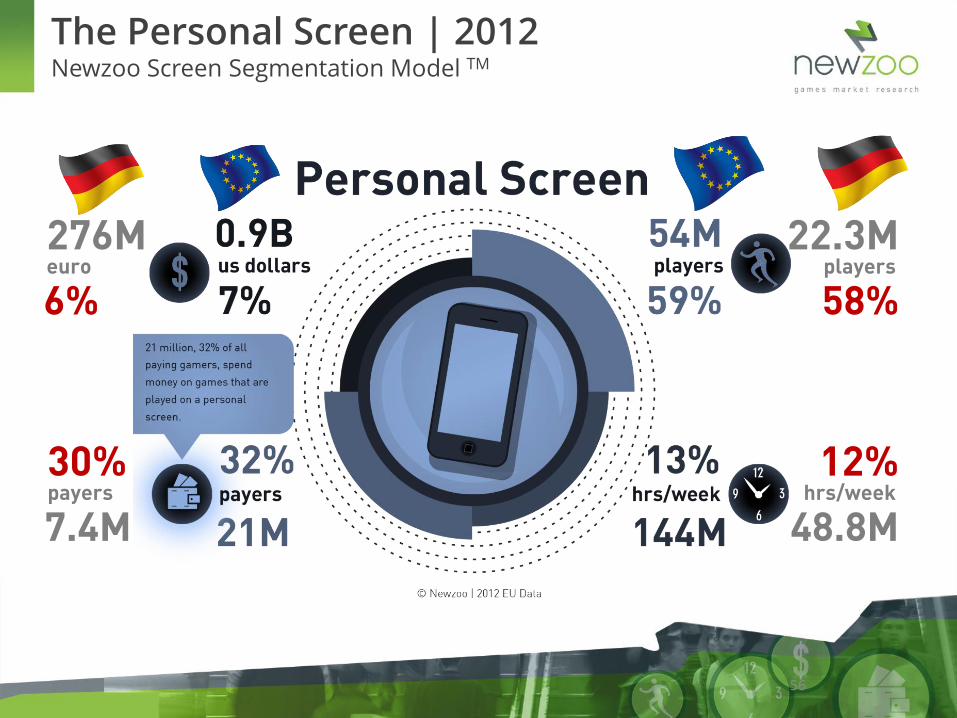
276M euro
6%
30% payers
7.4M
22.3M players
58%
12% hrs/week
48.8M
The Personal Screen | 2012 Newzoo Screen Segmentation Model TM
56
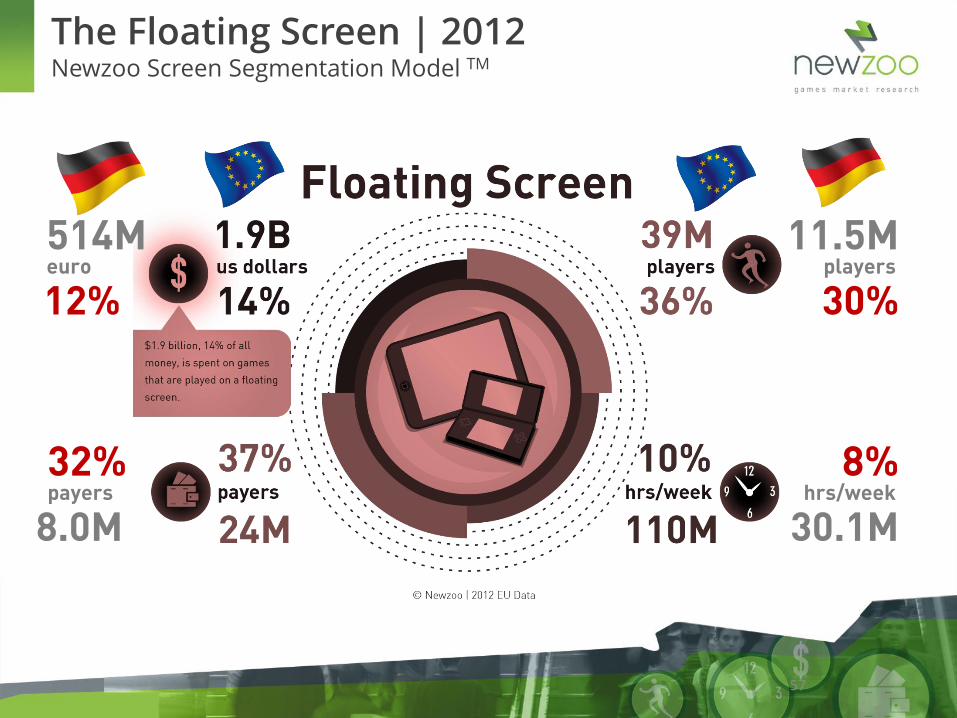
514M euro
12%
32% payers
8.0M
11.5M players
30%
8% hrs/week
30.1M
The Floating Screen | 2012 Newzoo Screen Segmentation Model TM
57

Lean back and….. Compare two similar games
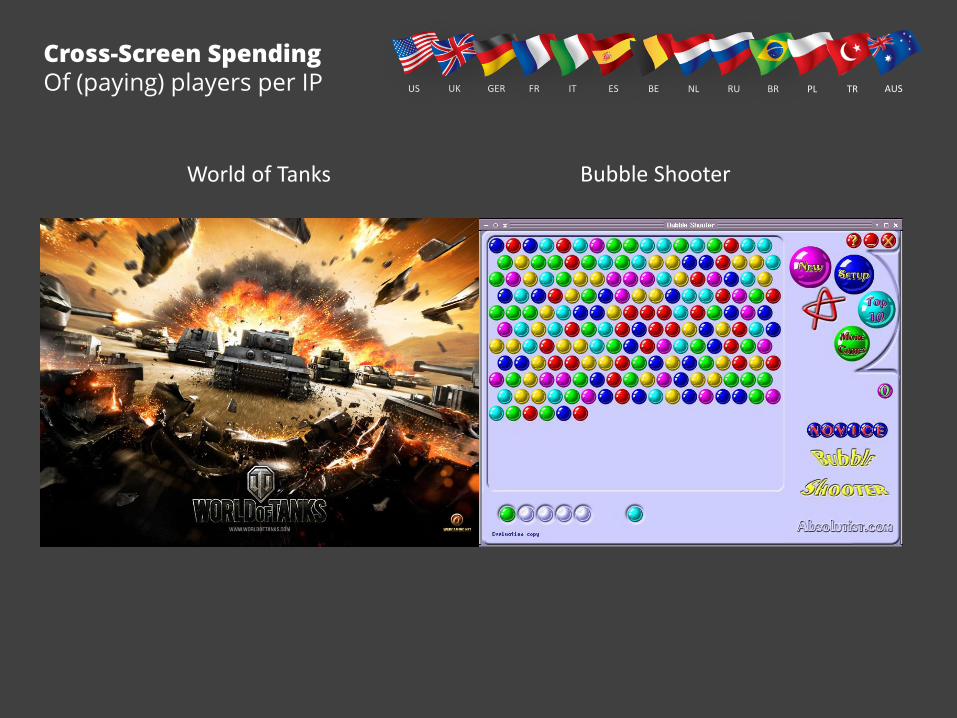
World of Tanks Bubble Shooter
US UK GER FR IT ES BE NL RU BR PL TR AUS
Cross-Screen Spending Of (paying) players per IP
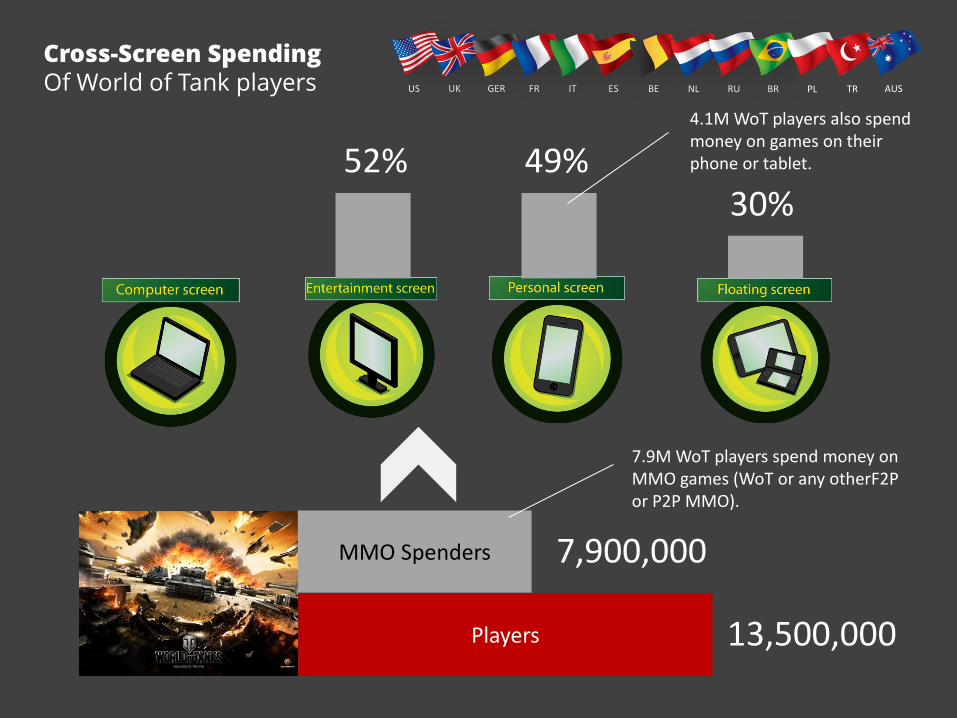
Players
MMO Spenders
US UK GER FR IT ES BE NL RU BR PL TR AUS
13,500,000
7,900,000
52% 49% 30%
Cross-Screen Spending Of World of Tank players
4.1M WoT players also spend money on games on their phone or tablet.
7.9M WoT players spend money on MMO games (WoT or any otherF2P or P2P MMO).
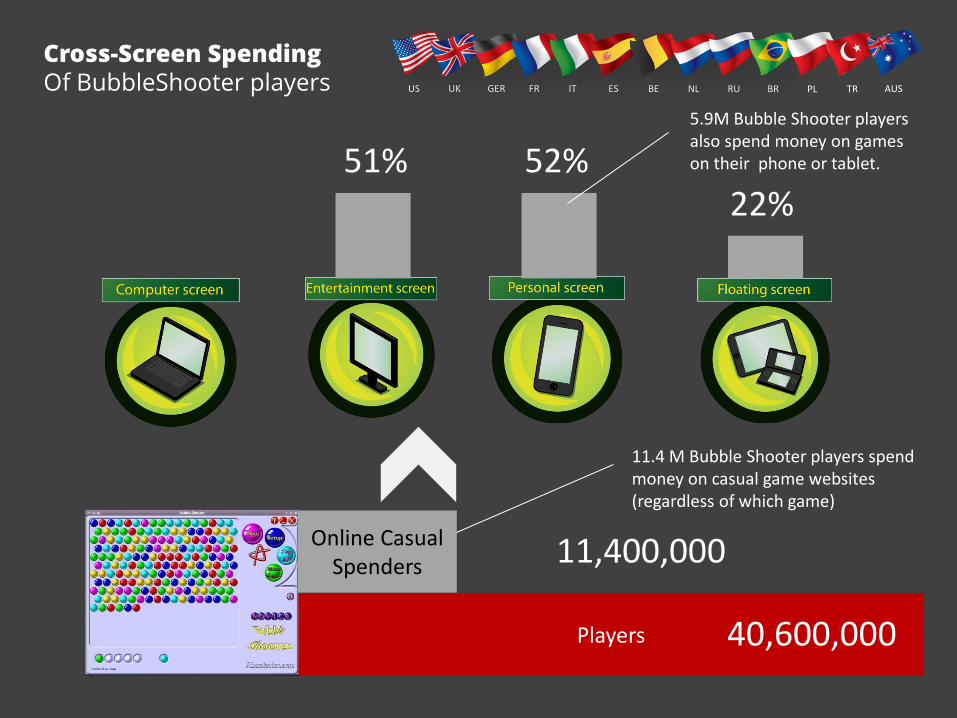
Players
Online Casual Spenders
US UK GER FR IT ES BE NL RU BR PL TR AUS
40,600,000
11,400,000
51% 52% 22%
Cross-Screen Spending Of BubbleShooter players
5.9M Bubble Shooter players also spend money on games on their phone or tablet.
11.4 M Bubble Shooter players spend money on casual game websites (regardless of which game)
“your paying players spend a maximum of 30%
of their budget on your single screen game”
- Peter Warman, CEO Newzoo
Key Take-Away Paying players spend money across screens
62

Lean back and….. Think about mobile….
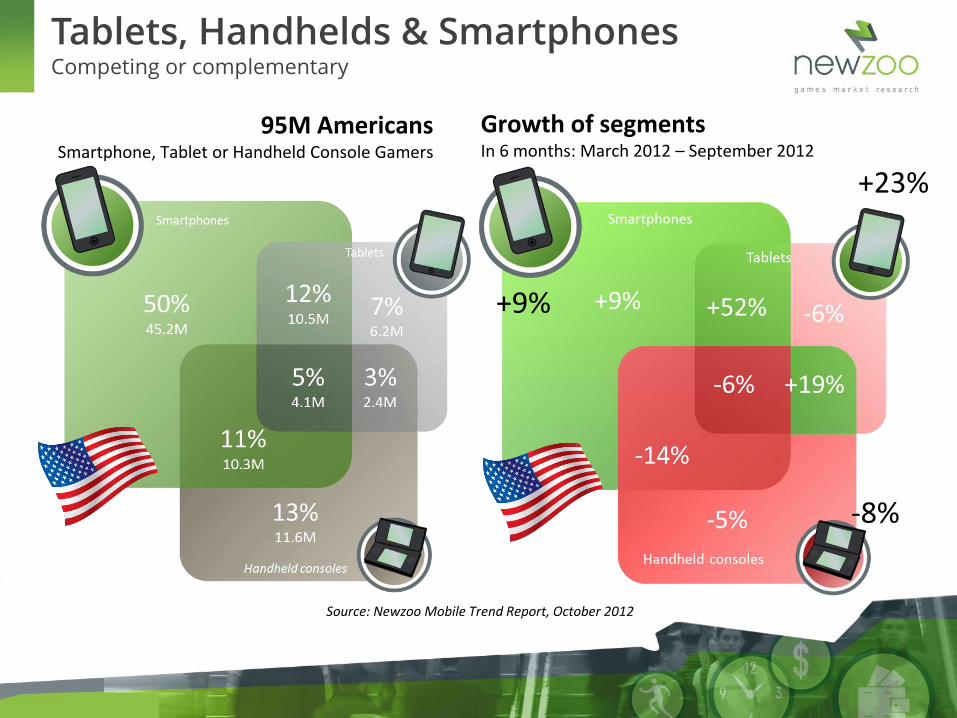
Tablets, Handhelds & Smartphones Competing or complementary
64
Source: Newzoo Mobile Trend Report, October 2012
95M Americans Smartphone, Tablet or Handheld Console Gamers
Growth of segments In 6 months: March 2012 – September 2012
+9%
+23%
-8%
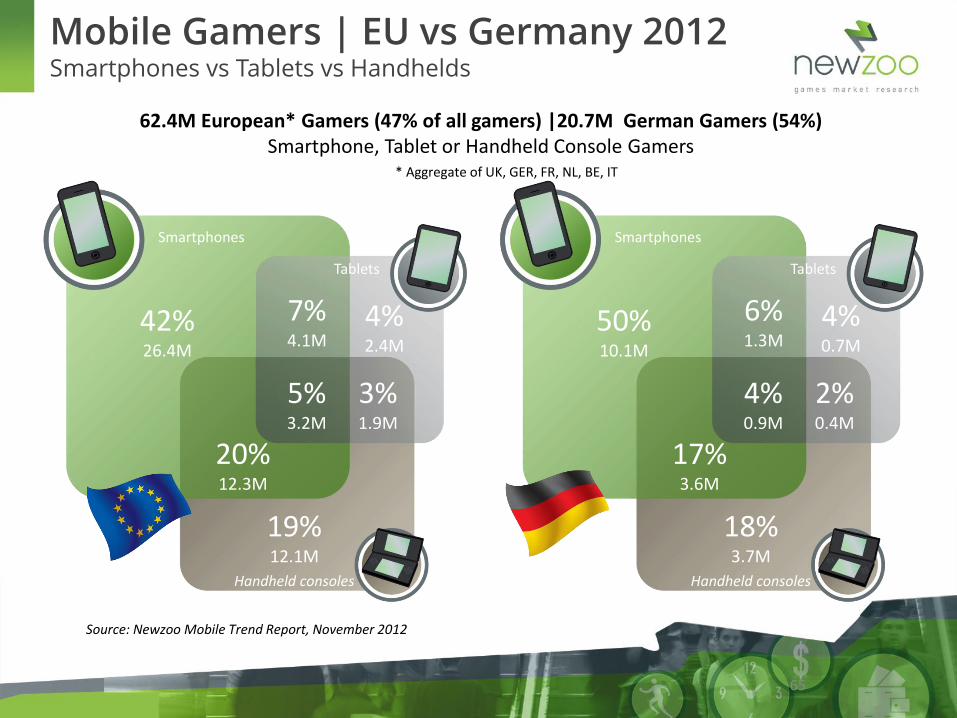
Mobile Gamers | EU vs Germany 2012 Smartphones vs Tablets vs Handhelds
Source: Newzoo Mobile Trend Report, November 2012
62.4M European* Gamers (47% of all gamers) |20.7M German Gamers (54%) Smartphone, Tablet or Handheld Console Gamers
Smartphones
Tablets
Handheld consoles
50% 10.1M
18% 3.7M
4% 0.7M
6% 1.3M
2% 0.4M
17% 3.6M
4% 0.9M
Smartphones
Tablets
Handheld consoles
42% 26.4M
19% 12.1M
4% 2.4M
7% 4.1M
3% 1.9M
20% 12.3M
5% 3.2M
65
* Aggregate of UK, GER, FR, NL, BE, IT
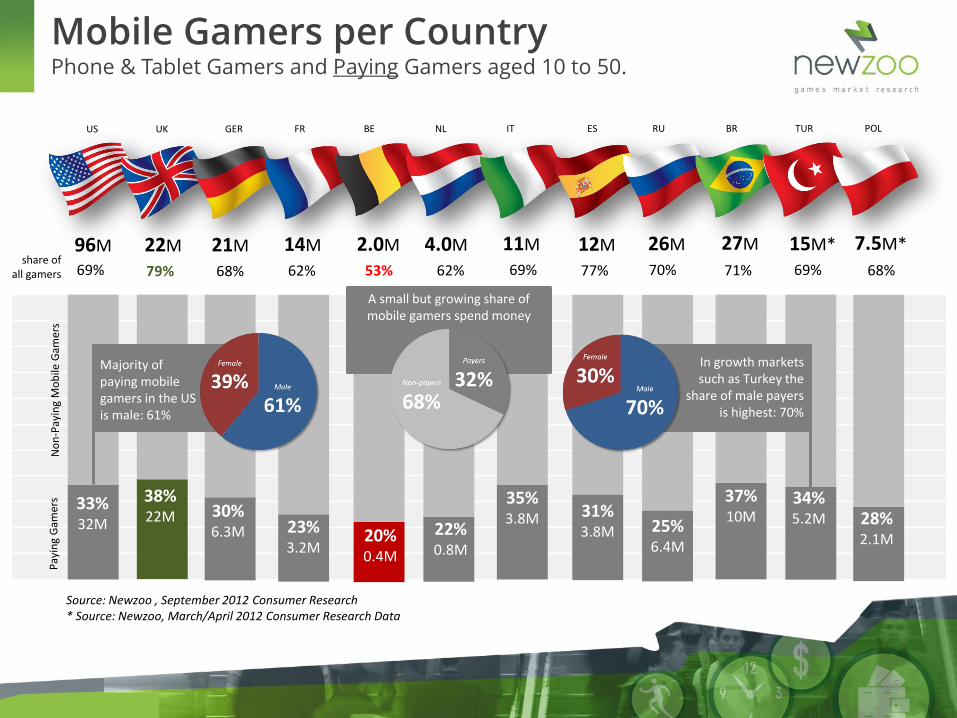
27M
Mobile Gamers per Country Phone & Tablet Gamers and Paying Gamers aged 10 to 50.
96M
Pay
ing
Gam
ers
22M 21M 14M 2.0M 4.0M 11M 12M 26M
79% 68% 62% 53% 62% 69% 77% 70% 71%
66
Source: Newzoo , September 2012 Consumer Research * Source: Newzoo, March/April 2012 Consumer Research Data
33% 32M
15M* 7.5M*
69% 68%
38% 22M 30%
6.3M 23% 3.2M
20% 0.4M
22% 0.8M
35% 3.8M 31%
3.8M 25% 6.4M
37% 10M 28%
2.1M
69%
34% 5.2M
No
n-P
ayin
g M
ob
ile G
amer
s
share of all gamers
Majority of paying mobile gamers in the US is male: 61%
In growth markets such as Turkey the
share of male payers is highest: 70%
A small but growing share of mobile gamers spend money
US UK GER FR BE NL IT ES RU BR TUR POL
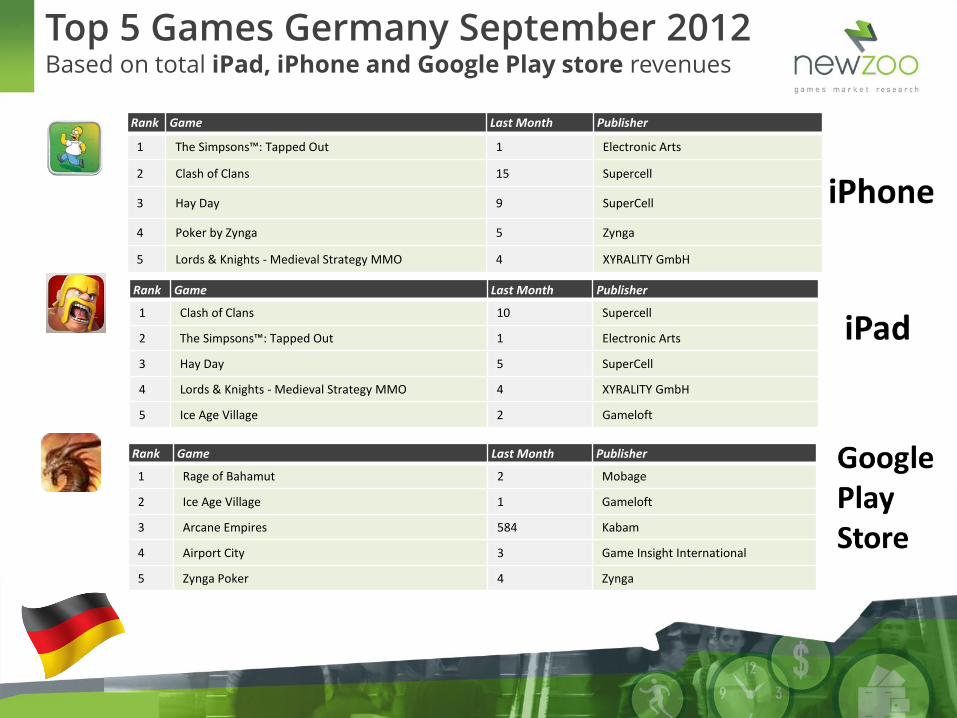
Rank Game Last Month Publisher
1 The Simpsons™: Tapped Out 1 Electronic Arts
2 Clash of Clans 15 Supercell
3 Hay Day 9 SuperCell
4 Poker by Zynga 5 Zynga
5 Lords & Knights - Medieval Strategy MMO 4 XYRALITY GmbH
Top 5 Games Germany September 2012 Based on total iPad, iPhone and Google Play store revenues
Rank Game Last Month Publisher
1 Clash of Clans 10 Supercell
2 The Simpsons™: Tapped Out 1 Electronic Arts
3 Hay Day 5 SuperCell
4 Lords & Knights - Medieval Strategy MMO 4 XYRALITY GmbH
5 Ice Age Village 2 Gameloft
Rank Game Last Month Publisher
1 Rage of Bahamut 2 Mobage
2 Ice Age Village 1 Gameloft
3 Arcane Empires 584 Kabam
4 Airport City 3 Game Insight International
5 Zynga Poker 4 Zynga

Lean back and….. Think how we can help each other

my wish is

Come visit our new office (when its done)

And lean back for a monent (with coffee or beer)
We need each other (to make sure these guys understand our stuff)

Cross-Screen Impact of
Free-to-Play
Peter Warman | CEO Newzoo | [email protected] Offenbach, November 2012
Lean forward vs lean back
© 2012 Newzoo www.newzoo.com