Embed Size (px)
DESCRIPTION
Citation preview

DATA INTERPRETATION
Basics of Data Interpretation

www.vasista.net
Data Interpretation can be defined as "the application of statistical procedures to analyze specific observed or assumed facts from a particular study".
Data interpretation is something that is pretty common in education circles.
They come as questions in tests to understand how much a student has understood the subject at hand. In school, college, university and higher educational levels, data interpretation is common.
Introduction

www.vasista.net
In various entrance exams for colleges too, data interpretation is used as a means to understand a student's grasp of the subject.
It is very important to understand how to interpret data in order to do well in these tests.
It is especially important in case of students planning to study finance and mathematics.
Introduction

www.vasista.net
The act of organizing and interpreting data to get meaningful information.
It involves scientific methods for organizing, summarizing and analyzing data.
Valid conclusion & Making Reasonable decisions based on the analysis.
Meaning of Data Interpretation
www.vasista.net
Skill Requires to Crack…
Ability Persistence Willingness

www.vasista.net
The data pertaining to any situation can be presented in one or more of the following ways:
Methods of Presenting Data
1
•Numerical Data Tables
2
•Cartesian Graphs
3
•Bar Diagrams
4
•Age Pyramids
5
•Pie-Charts
6
•Combined Data Presentation
7
•Three – Dimensional Diagrams
8
•Triangular Diagrams
9
•Venn- Diagrams
10
•Caselet Form

www.vasista.net
Any statistical data pertaining to any kind of situation can be generally represented in the form of Table.
It is the easiest and the most accurate ways of presenting data.
In a table, data is arranged systematically in columns and rows.
Numerical Data Tables
VASISTA(Fig. In Rs. lakh) 1994 1993 1992 1991
Share capital 310 205 98 98
Sales 6435 4725 2620 3270
Profit Before tax 790 525 170 315
Dividends 110 60 30 30
Retained earnings 400 245 70 140

www.vasista.net
Title of the Table: It gives the description of the contents of the table and precisely
defines the kind of data and the period for which it occurred.
Column Heading:This defines the information contained in various columns and also
specifies the unit of measurement in some cases.
Head Note:Unit of measurement is specified in the head note.
Foot Notes:Used point out any exceptions in arriving at the data.
Numerical Data Tables

www.vasista.net
1. Time Series Tables
2. Spatial or Geographical Series Table
3. Frequency Distribution Table
4. Cumulative Frequency Table
Classification of Numerical Data Tables

www.vasista.net
A series of values of a variable arranged according to the successive periods of time in a tabular form is called a time series tables.
Here, the data is presented with reference to a time period, year, month, week or day, may be either ascending or descending period of time.
Time Series Tables
Student Joining Statistics
2004 370
2005 398
2006 458
2007 677
2008 1023
2009 756
2010 399

www.vasista.net
Spatial or Geographical Series TableA series of values of some variable arranged according to location
or a geographical basis in a tabular form.
Country National per capita in Dollars
Canada 7930
USA 7880
Germany 7510
France 6730
UK 4180
Russia 2800
India 140

www.vasista.net
Frequency Distribution Table
When summarizing large masses of raw data it is often useful to distribute the data into classes or categories and to determine the number of individuals belonging to each class, called class frequency.
A tabular arrangement of data by classes, together with the corresponding class frequencies is called Frequency Distribution Table.
Masses of 100 Males Students in VASISTA University
Mass (Kg) Number of Students
60-62 5
63-65 18
66-68 42
69-71 27
72-74 8
Total 100

www.vasista.net
Cumulative Frequency TableCumulative frequency of a class interval is the sum of frequencies of all classes up to that
class (including the frequency of that particular class).
Consider the following cumulative frequency table which shows the marks obtained by 30 students in an examination
Marks obtained by 30 students in an examination
Marks Frequency Cumulative Frequency
10-20 4 4
20-30 9 4 + 9 = 13
30-40 5 4 + 9 + 5 = 18
40-50 6 4 + 9 + 5 + 6 = 24
50-60 6 4 + 9 + 5 + 6 + 6 = 30

www.vasista.net
Example-01
The following table gives data of number of cars produced and sold by three companies. It also gives the number of cars that can be produced by the three companies. Capacity utilization is defined as the ratio of production to capacity and sale efficiency is the ratio of sales to production.
Year 1988 1998
Company Capacity Production Sales Capacity Production Sales
HM 46000 27000 26000 40000 21050 20080
PAL 36000 29850 28770 183900 67400 67100
MUL 107500 102500 101200 485000 425000 417000

www.vasista.net
Problem-01
The capacity utilization was the highest for which of the following category of cars?
a. HM 1998
b. MUL 1998
c. MUL 1988
d. HM 1998The only way to solve the question is to calculate the
percentage of capacity utilization.% of capacity utilization = (Production/Capacity) x 100
Ans: C

www.vasista.net
Problem-02
The sales of three companies put together has risen by what percentage from 1998 to 1998?
a. 223%
b. 115%
c. 310%
d. 285%
Sales of 1988Sales of 1998
Increase in percentage = (Sales 1998-Sales1988/Sales 1988) x 100
Ans: A

www.vasista.net
Problem-03
The highest growth percentage in sales over the period was…. Between three companies.
a. 135% PAL
b. 312% for MUL
c. 230% for PAL
d. 405% for MULFrom the table , we can find that max. number increases in
MUL Hence percentage increasesIncrease in percentage = (Sales 1998-Sales1988/Sales
1988) x 100Ans: C

www.vasista.net
Problem-01
The capacity utilization was the highest for which of the following category of cars?
a. HM 1998
b. MUL 1998
c. MUL 1988
d. HM 1998The only way to solve the question is to calculate the
percentage of capacity utilization.% of capacity utilization = (Production/Capacity) x 100
Ans: C

www.vasista.net
Problem-04
If all cars that remained unsold at the end of the year were auctioned, which company had the biggest auction in terms of the number of cars put for sale?
a. HM 1998
b. MUL 1998
c. PAL 1988
d. MUL 1998The difference in the production and sales is maximum for
MUL 1998(425000-417000) = 8000
Ans: B
www.vasista.net
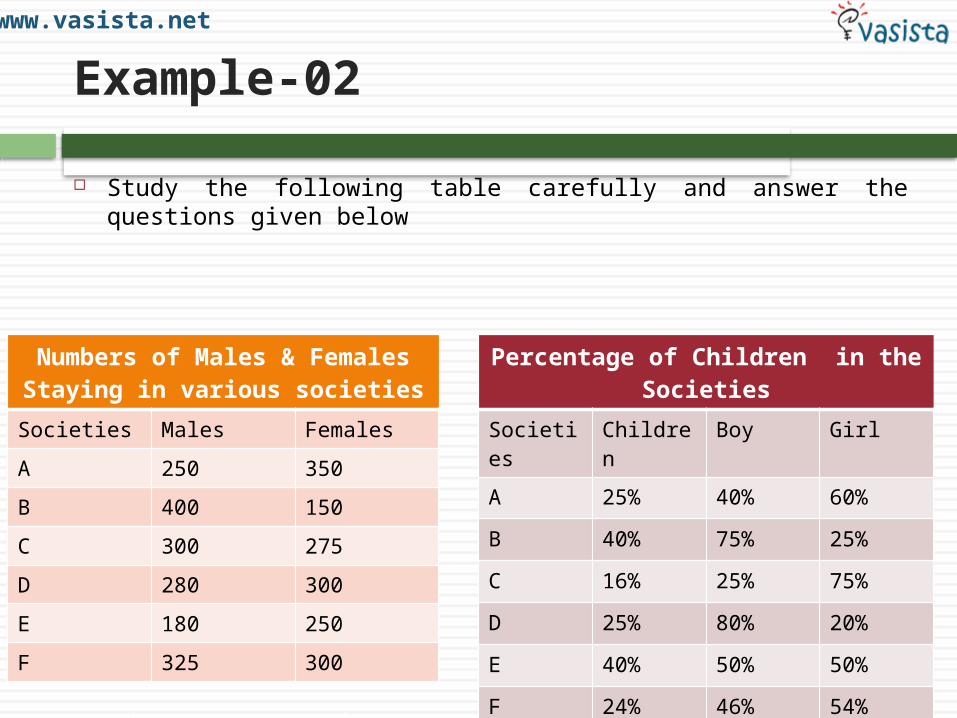
Example-02
Study the following table carefully and answer the questions given below
Numbers of Males & Females Staying in various societies
Societies Males Females
A 250 350
B 400 150
C 300 275
D 280 300
E 180 250
F 325 300
Percentage of Children in the Societies
Societies Children Boy Girl
A 25% 40% 60%
B 40% 75% 25%
C 16% 25% 75%
D 25% 80% 20%
E 40% 50% 50%
F 24% 46% 54%

www.vasista.net
Problem-01
What is the respective ratio of the number of adult females to the total number of female children staying in all the societies together
a. 243 :82
b. 112 : 71
c. 82 : 243
d. 71 : 112
e. None of these
You need to find the female and male kids
Ans: A

www.vasista.net
Problem-02
What is the total number of female children staying in all the societies together?
a. 314
b. 433
c. 410
d. 343
e. None of these
Ans: C

www.vasista.net
Problem-03
What is the respective ratio of the total number of adult males in societies A and B together to the total number of adult males in societies E and F together?
a. 75:79
b. 14:17
c. 79:75
d. 17:14
e. None of these
Ans: D

www.vasista.net
Problem-04
What is the total number of members staying in all the societies together?
a. 3520
b. 3360
c. 4100
d. 3000
e. None of these
Ans: B

www.vasista.net
Problem-05
What is the difference between the number of male children in society B and the number of male children in society F?
a. 84
b. 14
c. 96
d. 26
e. None of these
Ans: C

www.vasista.net
A Cartesian graph indicates the variation of a quantity with respect to two parameters calibrated on the X and Y axis respectively.
Useful for determining trends and rates of exchange.
CARTESIAN GRAPHS

www.vasista.net
• Single Dependent – Variable Graph
• More than one Dependent Variable Graph
• Graph having Two Scales
• Range Graph
CLASSIFICAITON OF CARTESIAN GRAPHS
www.vasista.net
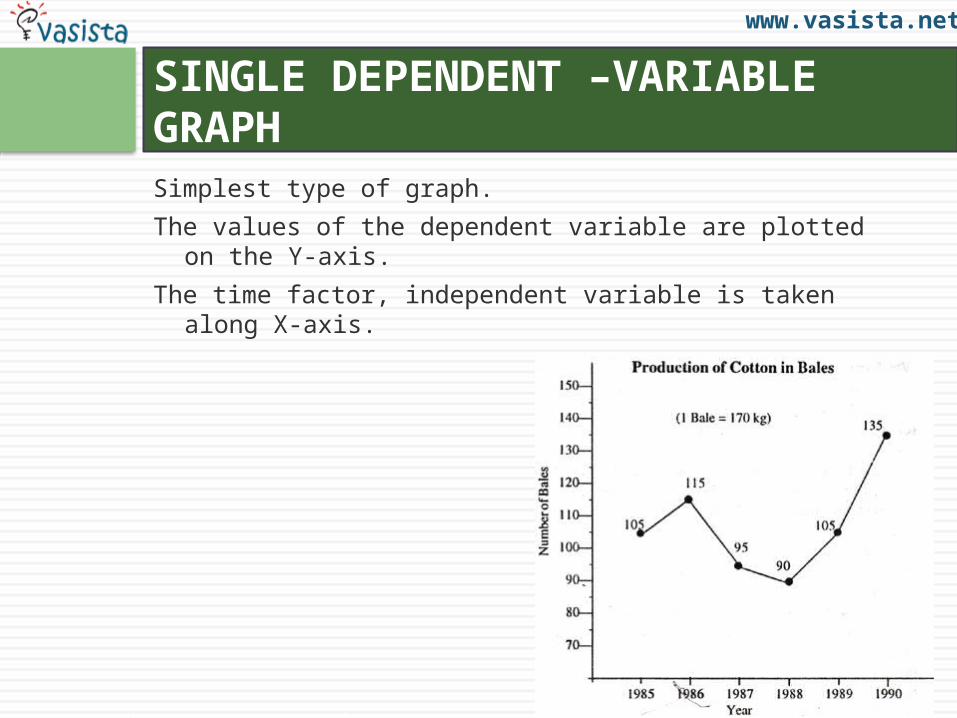
Simplest type of graph.
The values of the dependent variable are plotted on the Y-axis.
The time factor, independent variable is taken along X-axis.
SINGLE DEPENDENT –VARIABLE GRAPH


![Understand the Basics of Genetic Testing [Read-Only] the Basics of GeneticUnderstanding the Basics of Genetic Testing in ... and Polymorphism ... Understand_the_Basics_of_Genetic_Testing](https://img.pdfslide.us/doc/110x75/5af7d2897f8b9a190c91a8ce/understand-the-basics-of-genetic-testing-read-only-the-basics-of-geneticunderstanding.jpg)