Embed Size (px)
Citation preview

Historical and Personal Perspective on Scientific and 3Rs Challenges of Modelling
Multiple SclerosisDavid Baker
www.ms-res.org
BAKER NC3Rs 2016

3Rs RESEARCHER:- RESEARCHING 3Rs ISSUES
RESERCHER: RESEARCHING SCIENCE USING 3Rs TO ADDRESS ISSUES
TRANSLATIONAL NEUROSCIENCE –BENCH TO BEDSIDE- GOOD SCIENCE WITH 3Rs BENEFIT
BIOLOGY OF MULTIPLE SCLEROSIS-MS IS A BAD DISEASE - KNOW YOUR DISEASE
FAILURE TO TRANSLATE: HUMAN PROBLEMS IN THE TRANSLATIONAL PROCESS
SCIENCE-BASED APPROACH TO 3Rs
BAKER NC3Rs 2016 PLAN-OBJECTIVES
BIOLOGY OF ANIMAL MODEL - EAE IS A SEVERE DISEASE - KNOW YOUR DISEASE
MODELS MOVING FORWARD-UNMET CHALLENGES

Multiple sclerosis (MS) is a chronic (auto)immune-mediated CNS-
confined demyelinating disease affecting 2,500,000 people worldwide
Disease onset is usually between 20 and 40 years of age
(F:M ratio, 2:1)
MS is clinically characterized by a relapsing-remitting course usually
followed by a progressive disability
MS is pathologically heterogeneous – inflammation, demyelination and
neurodegeneration (axonal loss and neuronal damage)
Spontaneous repair occurs but MS invariably progresses (ambulatory
problems in 70-80% people with MS at 25 years from onset)
As a consequence of nerve damage eople can develop many
troublesome symptoms and reduce quality of Life
KNOW YOUR DISEASE-BIOLOGY OF MS

NERVE LOSS
PROGRESSIVE MSRELAPSING-REMITTING MS
DISABILITY
Frequent inflammation, demyelination,axonal transections, plasticity and
remyelination
Inflammation, Persistent Demyelination & Gliosis
Infrequent inflammation, Gliosis, Chronic Neurodegeneration
CLINICAL THRESHOLD
INFLAMMATION
Symptoms
Clinical Effects are Due to Altered Nerve Conduction
CLINICAL COURSE
Immune-Mediated
Beta-interferons, Alemtuzumab (CD52),
Cladribine, Bone Marrow Transplantation,
Fingolimod (S1P1-modulator) , Rituximab
(CD20) are ACTIVE
Neurodegeneration
Beta-interferon, Alemtuzumab,
Cladribine, Rituximab
Bone Marrow Transplantation,
Fingolimod are INACTIVE
KNOW YOUR DISEASE-BIOLOGY OF MS

White Blood Cells
No Repair
• INFLAMMATORY, DEMYELINATING, NEURODEGENERATIVE DISEASE OF CNS
•MULTIFOCAL OLIGODENDROCYTE LOSS
MS
plaques
Myelin (blue)
stain
KNOW YOUR DISEASE-BIOLOGY OF MS

NORMAL AGING
ATROPHY RATE 0.1% p.a.
MULTIPLE SCLEROSIS
ATROPHY RATE 0.4-1.0 %
MS is a Neurodegenerative
Disease
KNOW YOUR DISEASE-BIOLOGY OF MS
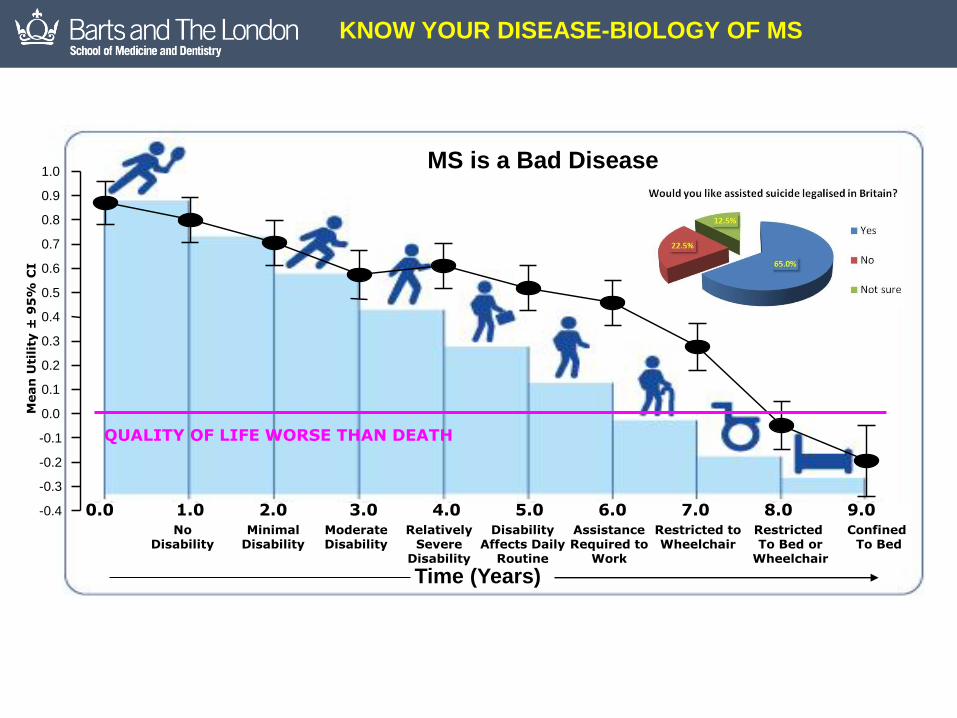
MS is a Bad Disease
AssistanceRequired to
Work
DisabilityAffects Daily
Routine
Restricted toWheelchair
RelativelySevere
Disability
ModerateDisability
MinimalDisability
NoDisability
Restricted To Bed or
Wheelchair
Confined To Bed
0.0 1.0 3.02.0 4.0 5.0 6.0 7.0 8.0 9.0
Time (Years)
QUALITY OF LIFE WORSE THAN DEATH
0.4
Mean
Uti
lity
±9
5%
CI
-0.4
-0.3
-0.2
-0.1
0.0
0.1
0.2
0.3
0.5
0.6
0.7
0.8
0.9
1.0
KNOW YOUR DISEASE-BIOLOGY OF MS

PERIPHERAL IMMUNITY Slow RELAPSE RATE
NEURODEGENERATION Slow PROGRESSION
SYMPTOM CONTROL Improve QUALITY OF LIFE
REPAIR Reverse Deficits
OUTCOME OF CONTROLDISEASE PROCESS
KNOW YOUR MODELLING DESIRES

RRR
eplacementefinementeduction
of Animals in Research
THE 3Rs CENTRAL TO USE OF ANIMALS IN EU

RRR
eplacementefinementeduction
National Centre of3Rs
of Animals in Research
THE 3Rs CENTRAL TO USE OF ANIMALS IN EU

www.ms-res.org
Drug-The Game
DRUG DEVELOPMENT
WORKS & SAFE IN PEOPLE WITH DISEASEPHASE III
APPROVALPOST-MARKETING SURVELLIENCE PHASE IV
10-15 Years$1-2 billion
Warning Video
ANIMALS CENTRAL TO DRUG DEVELOPMENT

No Clinical Disease-No Spinal Cord Infiltration- No Cytokine X, Y or ZLimp tail
Impaired
righting reflex
hindlimb paralysis
Moribund
partial paralysis
Normal
Remission
0
1
2
3
4
5
(1)
Clinical Score
Day 7
Spinal cord homogenate in Freund’s complete adjuvant
Day 0
Spasticity & Tremors
Develop
KNOW YOUR MODEL-BIOLOGY OF EAE
Video is Coming Next
43

MULTIPLE SCLEROSIS MODELS
KNOW YOUR MODEL-BIOLOGY OF EAE

Normal Remission 1
Remission 2 Remission 4
NfH
(µ
g/m
g t
ota
l p
rote
in)
Number of AttacksN RM1 RM2 RM3
50
100
150
200
250
300
350
400Axonal Content Assessed By Neurofilament ELISA
www.msbrainhealth.org
No-evidence of Disease Activity (NEDA)
KNOW YOUR MODEL-BIOLOGY OF EAE
Stop Relapses Save Brain

1868 Jean Martin Charcot Describes Multiple Sclerosis1885 Louis Pasteur Rabies Vaccine1888 Encephalitis due to Rabies Vaccine
1925 Encephalitis in rabbits due to repeated inoculation of spinal cord1933 Encephalitis in macaques with repeated inoculation
1942 Freunds Adjuvant developed1947 Induction of EAE
1960 Adoptive Transfer of EAE
1962 Induction of EAE with myelin 1970 Induction of EAE with myelin peptides
1981 Adoptive Transfer of Relapsing EAE in Mice
1995 Induction of EAE in Transgenic Mice1996 Induction of EAE in Knockout Mice
2001 EAE in Fluorescent Mice
Hartley Guinea pig hyper-acute EAEJuvenile Strain 13 guinea pig EAELewis Rat (non-demyelinating EAE)
SJL, PL, ABH Mouse EAE
1994 Induction of EAE with MOG C57BL/6 EAE, DA Rat EAE, Marmoset EAE
KNOW YOUR MODEL-BIOLOGY OF EAE
HISTORICAL PERSPECTIVE
1993 Spontaneous EAE in TCR Transgenic Mice

• PRE-CLINICAL FAILURE
• Model does not reflect human disease biology
• Drug does not target biology relevant to human application
• Lack of appreciation of human disease
• Dogma & overstating effect
• Model used in a way that does not reflect human indication
• Drug doses are not used in at physiological doses
• Drugs are not delivered in a way appropriate to how used in humans
• Studies are not transparent & not reproducible (Ineffective Study Design)
• CLINICAL FAILURE
• Lack of clear understanding of human pathology
• Drug is seldom investigated by scientists developing the Idea.
• Over-interpretation of significance of pre-clinical studies
• Drug is not used at a dose relevant to the pre-clinical studies
• Population does not respond as predicted. (Ineffective Trial Design)
• Dose-limiting side-effects
• Study Underpowered, too short or unrealistic expectations
• Measurement Instruments Inadequate Clinical Outcomes and Surrogate Markers
• Wrong Group of pwMS studied (IneffectiveTrial Design)
• Commercial Interests
Mechanism is all Important.
Relevance of Slight Delay of a Few Days, Slight Diminution
Prophylactic/Therapy
“Toxicity leading to Stress”
“Route & Timing”
Reporting Issues
KNOW THE LIMITATIONS-FAILURE TO TRANSLATE
Two thousand drugs tested in EAE, only ten classes of drugs approved
Time Post Induction (Days)
10 11 12 13 14 15 16 17 18 19 20 21 22 23 24 25
Mean C
linic
al S
core
0.0
0.5
1.0
1.5
2.0
2.5
3.0
3.5
4.0
Vehicle n= 10/10
Test Drug n = 10/10
Test Drug 2 n=0/10
or n = 7/10

ARRIVE Guidelines (UK)
Kilkenny C, Browne WJ, Cuthill IC, Emerson M
& Altman DG. Improving bioscience research
reporting: the ARRIVE guidelines for reporting
animal research. PLoS Biol. 2010;
8(6):e1000412 (2010)
National Research Council (USA). Institute for
Laboratory Animal Research. Guidance for
the Description of Animal
Research in Scientific Publications. National
Academies Press, Washington (DC) (2011).
Guidelines on EAE Studies
Baker D, Amor S. Publication guidelines for
refereeing and reporting on animal use in
experimental autoimmune encephalomyelitis. J
Neuroimmunol. 2012 242:78-83
LIMIT YOUR LIMITATIONS-EXPERIMENTAL DESIGN
RANDOMISATION
BLINDING
SAMPLE-SIZE
DATA HANDLING
REPLICATION
NINDS GUIDELINE Nature 2012; 490:187
>10%
>20%
>1%

Parametric
(47%)t- test
(46%)
Non
Parametric
39%Not
Reported
(14%)
Parametric
(65%)
t test (67%)
Non-Parametric (4%)
Not
Reported
(31%)
All EAE Publications 6 months
1:12:2011-31:5:2012 n=175
All EAE Publications 2 Years
1:1:2010-11:9:2012 n=26
All PUBMED PUBLICATIONS
BIG 6 PUBLICATIONS
Nature, Nat Med, Nat Immunol,
Nat. Neurosci, Science, Cell
T-test Criteria
Continuous
Normally Distributed
Equal Variances
LIMIT YOUR LIMITATIONS-EXPERIMENTAL DESIGN

Figure legend. Clinical scores of two independent
EAE experiments at d23 post disease induction.
Individual scores as well as the mean score of two
independent experiments are shown. Control: n=10,
vehicle: n=13, xxxxx-345: n=11. Control versus
vehicle: P=0.620, control versus xxxxx-345: P=0.017,
vehicle versus xxxxx-345 P=0.029. * indicate P
values <0.05 and ** indicate P values <0.005 based
on a non-paired Student’s t test. Error bars are s.e.m
Nature Paper
2015Drug-treated animals the scores appear to be: 0, 0
,0, 0.5, 0.5, 2, 2.5, 3, 3.5, 3.5, 3.5 n=11
Vehicle scores appear to be: 0.5, 2.5, 2.5, 2.5, 2,75,
2.75, 3, 3.5, 3.5, 3.5, 3.5, 3.5, 3.5 n=13.
Do a t test drug verses vehicle p=0.029
The assumptions of a t test (a) Data is normally
distributed. You test this and it passes the test
p=0.152,
(b) data groups have equal variances
Test for that and it fails P<0.05.
(c) Data is Parametric. Fail. It is non-parametric.
t test is not a valid test
Mann Whitney test. P=0.082.........Ooooops.
LIMIT YOUR LIMITATIONS-EXPERIMENTAL DESIGN

Limp tail
Paralysed
No reported Detail of
Randomisation,
Blinding or Sample Size
Scores of Animals
C57BL/6 malesMOG peptide with PTX
SJL mice
malesPLP peptide without
PTX
C57BL/6 malesMOG peptide without
PTX
Krementsov DN et al. 2015 FASEB J 29:3446
LIMIT YOUR LIMITATIONS-QUALITY CONTROL

LIMIT YOUR LIMITATIONS-QUALITY CONTROL

• PRE-CLINICAL FAILURE
• Model does not reflect human disease biology
• Drug does not target biology relevant to human application
• Lack of appreciation of human disease
• Dogma & overstating effect
• Model used in a way that does not reflect human indication
• Drug doses are not used in at physiological doses
• Drugs are not delivered in a way appropriate to how used in humans
• Studies are not transparent & not reproducible (Ineffective Study Design)
• CLINICAL FAILURE
• Lack of clear understanding of human pathology
• Drug is seldom investigated by scientists developing the Idea.
• Over-interpretation of significance of pre-clinical studies
• Drug is not used at a dose relevant to the pre-clinical studies
• Population does not respond as predicted. (Ineffective Trial Design)
• Dose-limiting side-effects
• Study Underpowered, too short or unrealistic expectations
• Measurement Instruments Inadequate Clinical Outcomes and Surrogate Markers
• Wrong Group of pwMS studied (IneffectiveTrial Design)
• Commercial Interests
Mechanism is all Important.
Relevance of Slight Delay of a Few Days, Slight Diminution
Prophylactic/Therapy
“Building Site Effect”
“Route & Timing”
“Placebo Effect”
Less Circuitry so Less Compensation Capacity
Non-Responders
Immune (T/B cell) or Neurodegeneration
Professional Trialists
Reporting Issues
Two thousand drugs tested only ten classes of drugs approved
KNOW THE LIMITATIONS-FAILURE TO TRANSLATE

• CD4 T cell depletion inhibits EAE
• CD4 T cell deletion inhibits virtually every T and B Cell mediated autoimmunity
• CD4 T cell deletion does not inhibit multiple sclerosis(Lindsey et al. 1994 Neurol 44:413 : 810; van Oosten et al. 1998 Mut Scler 1:339)
.
• CD4 T cell deletion does not inhibit other human autoimmune diseases
Problem with the Study
Planned <60% Depletion
Naïve CD45RA preferentially affected
Primed CD45RO T cells relatively unaffected (Llewellyn-Smith et al. 1997 Neurol 48:810; 48)
MS IS NOT CONTROLLED BY T CELL DEPLETION
No effect on Gadolinium enhancing lesions
Time post-disease onset (days)
-1 0 1 2 3 4 5 6 7 8
Me
an
Ne
uro
logic
al S
co
re
0.0
0.5
1.0
1.5
2.0
2.5
3.0
3.5
4.0
250µg YTS191
25µg YTS191
5µg YTS191
Vehicle
250µg YTA3
85% deletion
60%
deletion
20%
deletion
If 60% T cell Depletion does not Stop EAE,
Why would it be expected to stop MS?
The CD4 trial in MS was Probably doomed before it even started
Day 0 Day 1 Day 3 Day 7 Day 14 Day 21
% o
f C
on
tro
l
0
10
20
30
40
50
60
70
80
90
100
110
120
130
Untreated
250µg CD4 mAb
50µg CD4 mAb
25µg CD4 mAb
5µg CD4 mAb
KNOW THE LIMITATIONS-FAILURE TO TRANSLATE
Degree of CD4 depletion was important with regard to treatment efficacy.
There was a significant 41% reduction in relapses.

PERIPHERAL IMMUNITY Slow RELAPSE RATE
NEURODEGENERATION Slow PROGRESSION
SYMPTOM CONTROL Improve QUALITY OF LIFE
REPAIR Reverse Deficits
OUTCOME OF CONTROLDISEASE PROCESS
KNOW YOUR DISEASE/MODEL-CHALLENGES
Adaptive Immune-Dependent Neurodegeneration
Innate Immune-Dependent Neurodegeneration
Post-Demyelination Repair Chronic Demeylination in Gliosis Repair
Symptomatic Motor SensorySymptomatic Cognitive
Relapsing T B cell Immunity

Red = abundant CB1 receptors Black = moderately abundant CB1 receptors
PHARMACEUTICAL CANNABIS
BENCH TO BESIDE – SYMPTOM CONTROL
Time Post-Injection (Min)
0 10 20 30 40 50 60 70 80 90 100 110 120
Ch
an
ge
in
Hin
dlim
b S
tiff
ne
ss
(%
) ± S
EM
-50
-40
-30
-20
-10
0
10
20
Sativex
Vehicle

PERIPHERAL IMMUNITY Slow RELAPSE RATE
NEURODEGENERATION Slow PROGRESSION
SYMPTOM CONTROL Improve QUALITY OF LIFE
REPAIR Reverse Deficits
OUTCOME OF CONTROLDISEASE PROCESS
KNOW YOUR MODEL-BIOLOGY OF EAE

This extreme close-up with a scanning
electron microscope shows
oligodendrocytes cultured in a well among
the tapered glass micropillars.
Mei et al. Nat. Med., 2014 20:954
A cluster of antimuscarinic compounds
scored high in cell differentiation and
membrane wrapping in the high-
throughput screen.
EAE
CUPRIZONE FEEDING
(OLIGODENDROCYTE TOXIN)
MONONUCLEAR
CELL INFILTRATE
In vivoModels
Focal Model
BENCH TO BESIDE – REPAIR

PERIPHERAL IMMUNITY Slow RELAPSE RATE
NEURODEGENERATION Slow PROGRESSION
SYMPTOM CONTROL Improve QUALITY OF LIFE
REPAIR Reverse Deficits
OUTCOME OF CONTROLDISEASE PROCESS
KNOW YOUR MODEL-BIOLOGY OF EAE

Optic Neuritis is
Often First Sign of MS
Most accessible part of
Human CNS
Courtesy of Roy Weller
BENCH TO BESIDE – NEUROPROTECTION

EYE
OPTIC NERVE
VISUALCORTEX
The eye is the window to the brain…
OCCIPITALLOBE
The Visual SystemX
Damage
in MS
Optic Neuritis
Common First
Sign of MS
Occurs in Over
50% of MS
X
OPTIC NEURITIS IN MULTIPLE SCLEROSIS
BENCH TO BESIDE – NEUROPROTECTION

Develops Spontaneous/Induced Optic Neuritis.Subclinical Spinal Cord DiseaseLess Severe than Classical EAE
Fluorescent Retinal Cells Detection of Nerve Loss in Living Eye
Repeated Monitoring Not Requiring Histology
Disease is Concentrated in the Visual SystemHuman Relevant Outcome Measures
Visual Acuity, Electrophysiology (Demyelination Nerve Loss), Imaging the Living Eye
BENCH TO BESIDE – NEUROPROTECTION

Day 0 (before disease)
Day 21 (after disease)
After Optic Nerve Head
OCT imageHistology image
Eye from Living AnimalEye from Dead Animal
Outer
Nuclear
Layer
Photo-
Receptors
Ganglion
Cell Layer
Inner
Nuclear
Layer
Before
Carbamazepine
Me
an
Nu
mb
er
of R
etin
al G
an
glio
n C
ells
/mm
2
800
900
1000
1100
1200
1300
1400
1500
1600
1700
1800
1900
Non-Induced
Optic Neuritis + Control
Optic Neuritis + Sodium Channel Blocker
OxcarbazepineBaseline
* *
A
D
CB
Carbamazepine
Me
an
Nu
mb
er
of R
etin
al G
an
glio
n C
ells
/mm
2
800
900
1000
1100
1200
1300
1400
1500
1600
1700
1800
1900
Non-Induced
Optic Neuritis + Control
Optic Neuritis + Sodium Channel Blocker
OxcarbazepineBaseline
* *
A
D
CB
VehicleNa Channel
Blocker
Carbamazepine
Mean N
um
ber
of R
etinal G
anglio
n C
ells
/mm
2
800
900
1000
1100
1200
1300
1400
1500
1600
1700
1800
1900
Non-Induced
Optic Neuritis + Control
Optic Neuritis + Sodium Channel Blocker
OxcarbazepineBaseline
* *
A
D
CB
Low Power
Normal
Inhibition of Retinal Ganglion Cell Loss
Reduced Nerve Damage
Normal mouse
Mea
n r
etin
a ce
ll d
ensi
ty (
cells
/mm
2)
1000
1100
1200
1300
1400
1500
1600
1700
1800
1900
OPTIC NEURITIS+ Vehicle
OPTIC NEURITIS +drug
Na Channel
BlockerVehicle
Al-Izki S et al. 2014
BENCH TO BESIDE – NEUROPROTECTION

Neuroprotection in Optic Neuritis in Humans
Gabilondo I et al. 2015
Raftopoulos R et al. 2016
30-35% Less Nerve Loss
BENCH TO BESIDE – NEUROPROTECTION

PERIPHERAL IMMUNITY Slow RELAPSE RATE
NEURODEGENERATION Slow PROGRESSION
SYMPTOM CONTROL Improve QUALITY OF LIFE
REPAIR Reverse Deficits
OUTCOME OF CONTROLDISEASE PROCESS
KNOW YOUR MODEL-BIOLOGY OF EAE
SEVERITY EXPERIENCED BY ANIMALS INCREASES

IMPACT-PAPERS INFLUENCING EUROPEAN POLICY ON ANIMAL RESEARCH
MAKE SURE YOU BASE YOUR 3Rs ON SCIENCE
Wolfensohn S, Hawkins P, Lilley E, Anthony D, Chambers C, Lane S, Lawton M,
Voipio HM, Woodhall G. Reducing suffering in experimental autoimmune
encephalomyelitis (EAE). J Pharmacol Toxicol Methods. 2013; 67(3):169-76.

WEIGHT LOSS CORRELATES WITH SEVERITY BUT IS NOT AN INDICATOR OF MORTALITY
C57BL/6 Strain (MOG peptide-Induced)Animals with Weak Signs (Limp tail, Impaired righting reflex) 2.1 ± 3.7% loss n=3/88Animals with Strong Signs (Hindlimb paralysis) 17.1 ± 4.7% loss n=36/88Animals with EAE-related Mortality or Euthanasia Not Applicable n=0/88
HA Strain (Spinal cord Homogenate Induced)Animals with Weak Signs (Limp tail, Impaired righting reflex) 22.1 ± 8.1% loss n=11/54Animals with Strong Signs (Hindlimb paralysis) 28.8 ± 4.2% loss n=20/54Animals with EAE-related Mortality or Euthanasia 28.8 ± 7.0% loss n=23/54
Biozzi ABH Strain Spinal Cord Homogeneate Induced)Animals with Weak Signs (Limp tail, Impaired righting reflex) 26.4 ± 4.6% loss n=9/65Animals with Strong Signs (Hindlimb paralysis) 30.8 ± 3.5% loss n=60/65Animals with EAE-related Mortality or Euthanasia 31.8 ± 3.0% loss n=12/1978
MAKE SURE YOU BASE YOUR 3Rs ON SCIENCE
WEIGHT LOSS CORRELATES WITH SEVERITY BUT IS NOT AN INDICATOR OF MORTALITY

WEIGHT LOSS CORRELATES WITH SEVERITY BUT IS NOT AN INDICATOR OF MORTALITY_________________________________________________________________________
Weight Distribution of Surviving ABH Mice_________________________________________________________________________
Weight loss Frequency
> 5% 300/300 (100%)>10% 295/300 (98%)>15% 290/300 (97%)>20% 272/300 (91%)>25% 213/300 (82%)>30% 105/300 (35%)>35% 10/300 ( 3%)>40% 0/300 (0%)
_________________________________________________________________________Weight collected pre-1993 Weight loss is maximum related EAE verses day 11/Maximum weight
MAKE SURE YOU BASE YOUR 3Rs ON SCIENCE
• Use lower doses of antigen
• Reduce all stressors
• Reduce noise levels
• Raise ambient temperature – use heating blankets, extra litter and nesting material,
Do not isolate sick animals – house with well animals, so they can huddle with the other mice to keep warm
• Reduce study duration if possible
• Apply a humane end point appropriate to the study
MAKE SURE YOU BASE YOUR 3Rs ON SCIENCE

TEMPERATURE AS AN ENDPOINT• QUANTITATIVE• NON-SUBJECTIVE• CAN BE DONE NON-INVASIVELY• DETECTABLE (HOURS) PRIOR TO DEATH
• CAN BE DONE REMOTELY WITHOUT ANIMAL HANDLING-TELEMETRY CHIP• CAN BE DONE IN HOME CAGE –TELEMETRY CHIP• CAN REMOTELY ALARMED TO TRIGGER ENDPOINT-SOFTWARE EXSISTS
MAKE SURE YOU BASE YOUR 3Rs ON SCIENCE

TELEMETRY CHIP 1BATTERY POWERED-TRANSMITTING CHIPSURGICALLY IMPLANTED DISPOSABLE (£130-£1,000/chip)REMOTE DETECTOR-DETECTS MULTIPLE ANIMALS
TELEMETRY CHIP 2BASE POWERED-PASSIVE CHIPNON-SURGICALLY IMPLANTED (£10-£15-chip)BASE STATION UNDER HOME CAGE-SINGLE ANIMALS AT MULTIPLE TIME POINTS
1.6g - 6months
MAKE SURE YOU BASE YOUR 3Rs ON SCIENCE

UCL-INSTITUTE OF NEUROLOGY
Queen Square
UCL-INSTITUTE OF NEUROLOGY
Queen Square
UCL-INSTITUTE OF NEUROLOGY
Queen Square THANK YOU FOR LISTENING
Slides Available on www.ms-res.org
(Slideshare)