Embed Size (px)
Citation preview
ASSIGNMENT ON PHARMACEUTICAL COMPANY
ByNEHA SINHA(08)
SAMEER TIGGA(35)TANYA PALLAVI(62)

OVERVIEW OF THE SECTOR
THE EARLIEST DRUGSTORES DATE BACK TO MIDDLE AGES. ARABIAN PHARMACISTS IN BAGHDAD IN 754 TODAYS MAJOR PHARMACEUTICAL COMPANIES FOUNDED IN
LATE 19TH AND 20TH CENTURIES. KEY DISCOVERIES OF 1920S AND 1930S-INSULIN AND
PENICILLIN SWITZERLAND, GERMANY, ITALY HAD STRONG INDUSTRIES
WITH U.K, U.S, BELGIUM, AND NETHERLANDS FOLLOWING SUIT. INDIA TOOK OVER AS THE PRIMARY CENTER OF
PHARMACEUTICAL PRODUCTION WITHOUT PATENT PROTECTION
INDIAN SCENARIO
THE FIRST INDIAN PHARMACEUTICAL COMPANY-BENGAL CHEMICALS AND PHARMACEUTICAL WORKS, ESTABLISHED IN KOLKATA IN 1930.
INDIANPHARMACEUTICAL SECTOR HAS ESTIMATED MARKET VALUE OF U.S $ 8 BILLION.
4TH RANK IN TERMS OF TOTAL PHARMACEUTICAL PRODUCTION 13TH IN TERMS OF VALUE
GROWING AT THE AVERAGE RATE OF 7.2 % AND EXPECTED TOO GROW TO U.S $ 12 BILLION BY 2010
3900 NEW GENERIC PRODUCTS HAVE BEEN LAUNCHEED IN THE PAST TWO YEARS
THERE IS AN INCREASED PRICE SENSITIVITY IN THE PHARMACEUTICAL MARKET
COMPANIES ARE TRYING TO CAPTURE THE MARKET BY INTRODUCING HIGH QUALITY AND LOW PRICE MEDICINES AND DRUGS
INDUSTRY REVENUES
2006-PRESCRIPTION DRUGS TOPPED $643 BILLION
UNITED STATES ACCOUNTS FOR ALMOOST HALF OF THE GLOBAL PHARMACEUTICAL MARKET WITH 289 BILLION IN ANNUAL SALES , FOLLOWED BY EU AND JAPAN
EMERGING MARKET-CHINA RUSSIA SOUTH KOREA AND MEXICO GROWING A HUGE 81%
PHARMACEUTICAL INDUSTRY TOPPED THE LIST OF THE MOST PROFITABLE INDUSTRIES, WITH A RETURN OF 17% ON REVENUE.
CAPITAL INVESTMENT IN TECHNOLOGY: Owing to the availability of advanced technology at low costs, the companies can produce drugs at lower costs. COST EFFECTIVE: The filing cost of ANDAS and DMFs is comparatively low for the Indian companies. MANPOWER: There is a large pool of technical experts available at modest salaries. CONTRACT RESEARCH & CONTRACT MANUFACTURING: There is a good scope for contract research and contract manufacturing. INFRASTRUCTURE: There is a well-developed infrastructure for the pharmaceutical industry. GENERIC DRUGS: In the last few years, the generic drug-manufacturing segment has received huge investments, in the process making it more competitive and efficient.
INDUSTRY STRENGTHS

RANBAXY
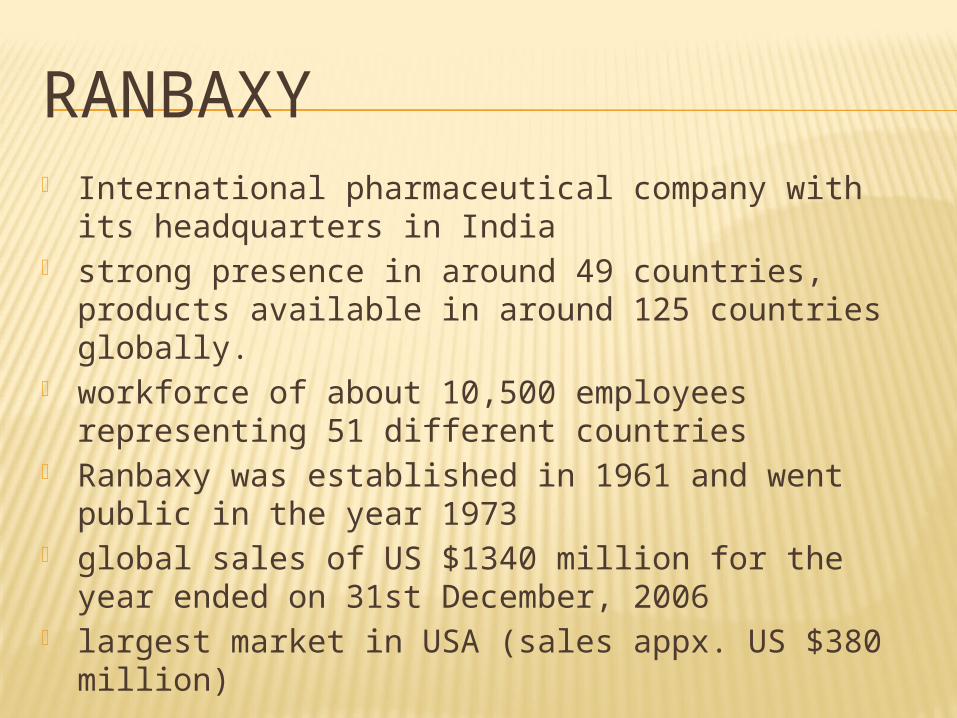
RANBAXY International pharmaceutical company with its
headquarters in India strong presence in around 49 countries, products
available in around 125 countries globally. workforce of about 10,500 employees representing
51 different countries Ranbaxy was established in 1961 and went public in
the year 1973 global sales of US $1340 million for the year ended
on 31st December, 2006 largest market in USA (sales appx. US $380 million)

SHARE HOLDING PATTERN OF RANBAXY
HR SNAPSHOT OF RANBAXY
HR SNAPSHOT OF RANBAXY
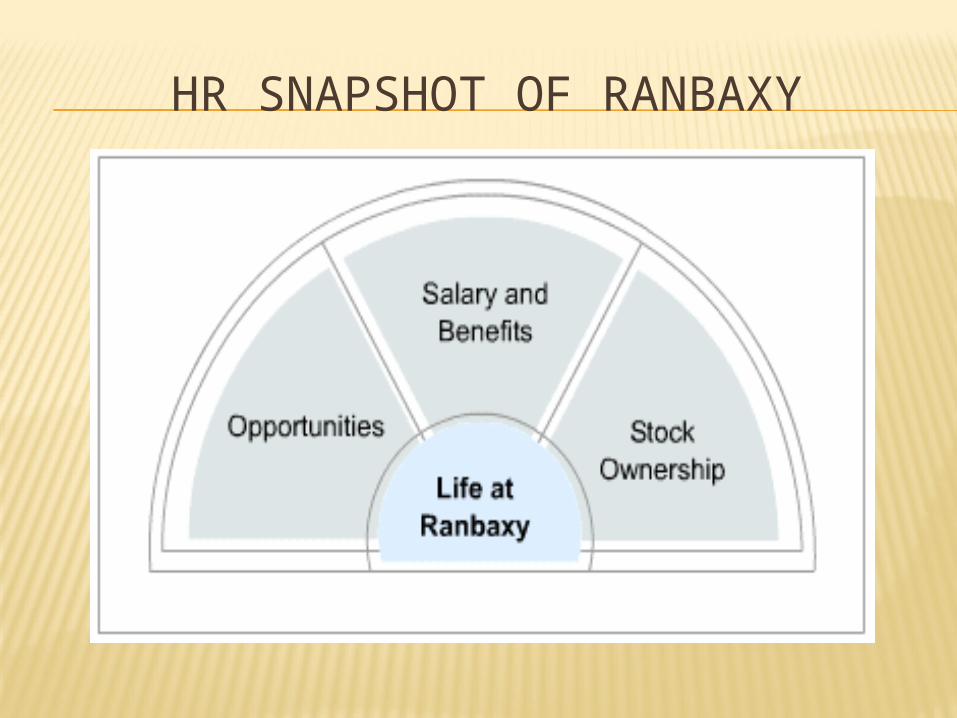
Life at Ranbaxy A career at Ranbaxy means an
opportunity for ample learning & growth. It offers avenues to work across the globe along side the finest minds. The Company offers a challenging assignment, a world class working environment, professional management, competitive salaries, stock options along with exceptional rewards.
HR SNAPSHOT OF RANBAXY
Total Number of employees Number of employees as of dec 31 2008 - 12174 CHAIRMAN MALVINDER MOHAN SINGH The Management Trainee Program The Management Trainee Program is a perfect
example of their commitment towards developing and nurturing young talent. Ranbaxy recruits the best minds from Business Schools and prepares them for the challenges of business.

DR REDDY’S
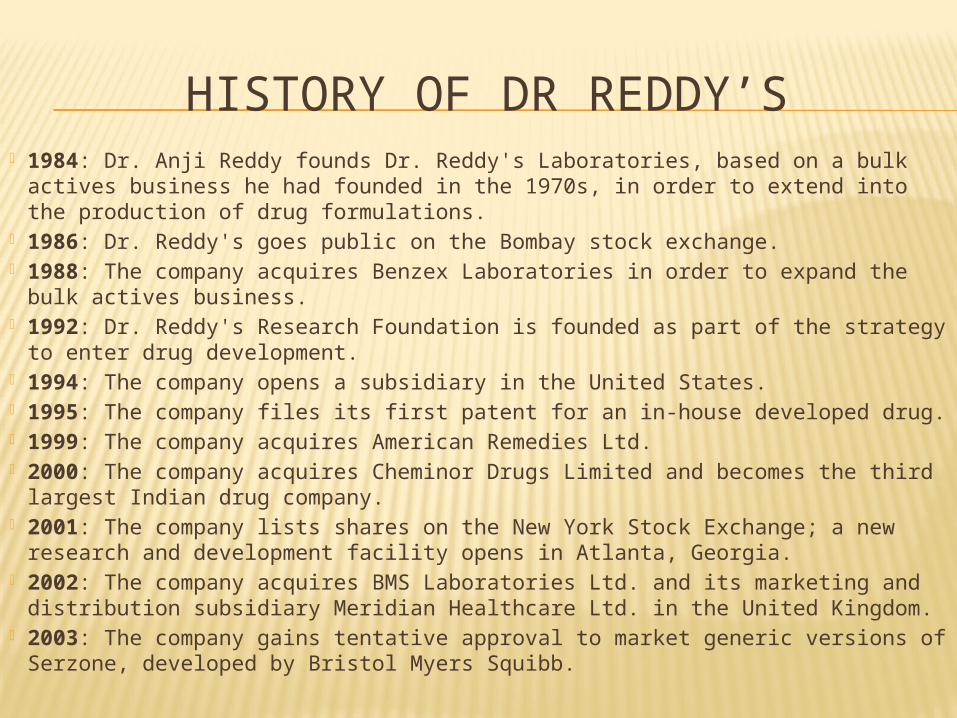
HISTORY OF DR REDDY’S 1984: Dr. Anji Reddy founds Dr. Reddy's Laboratories, based on a bulk
actives business he had founded in the 1970s, in order to extend into the production of drug formulations.
1986: Dr. Reddy's goes public on the Bombay stock exchange. 1988: The company acquires Benzex Laboratories in order to expand the
bulk actives business. 1992: Dr. Reddy's Research Foundation is founded as part of the strategy
to enter drug development. 1994: The company opens a subsidiary in the United States. 1995: The company files its first patent for an in-house developed drug. 1999: The company acquires American Remedies Ltd. 2000: The company acquires Cheminor Drugs Limited and becomes the
third largest Indian drug company. 2001: The company lists shares on the New York Stock Exchange; a new
research and development facility opens in Atlanta, Georgia. 2002: The company acquires BMS Laboratories Ltd. and its marketing and
distribution subsidiary Meridian Healthcare Ltd. in the United Kingdom. 2003: The company gains tentative approval to market generic versions of
Serzone, developed by Bristol Myers Squibb.
FINANCIAL PROFILE OF DR REDDY’S
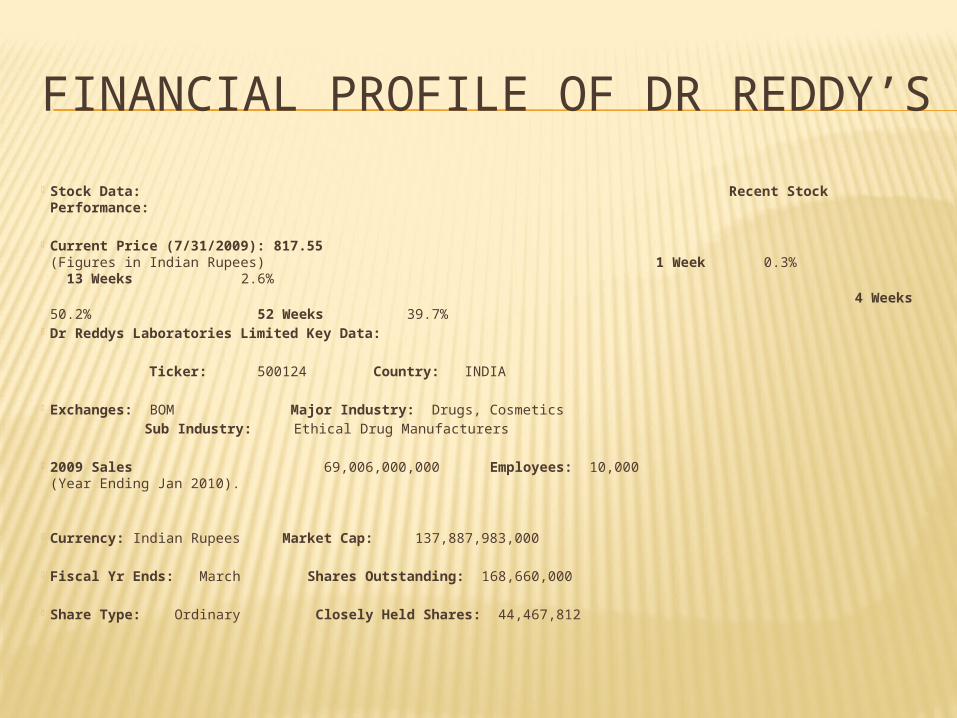
Stock Data: Recent Stock Performance: Current Price (7/31/2009): 817.55
(Figures in Indian Rupees) 1 Week 0.3% 13 Weeks 2.6%
4 Weeks 50.2% 52 Weeks 39.7%
Dr Reddys Laboratories Limited Key Data: Ticker: 500124 Country: INDIA Exchanges: BOM Major Industry: Drugs, Cosmetics Sub Industry: Ethical Drug Manufacturers 2009 Sales 69,006,000,000 Employees: 10,000
(Year Ending Jan 2010). Currency: Indian Rupees Market Cap: 137,887,983,000 Fiscal Yr Ends: March Shares Outstanding: 168,660,000 Share Type: Ordinary Closely Held Shares: 44,467,812
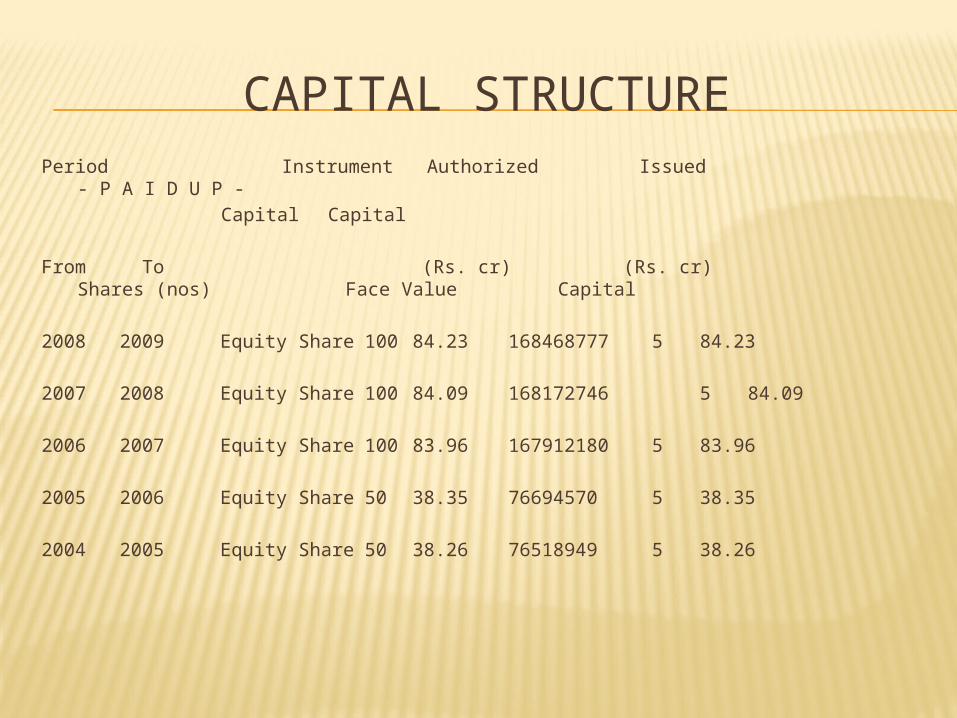
CAPITAL STRUCTUREPeriod Instrument Authorized Issued - P A I D
U P -Capital Capital
From To (Rs. cr) (Rs. cr) Shares (nos) Face Value Capital
2008 2009 Equity Share 100 84.23 168468777 584.23
2007 2008 Equity Share 100 84.09 168172746 584.09
2006 2007 Equity Share 100 83.96 167912180 583.96
2005 2006 Equity Share 50 38.35 76694570 538.35
2004 2005 Equity Share 50 38.26 76518949 538.26
SHARE HOLDING PATTERN
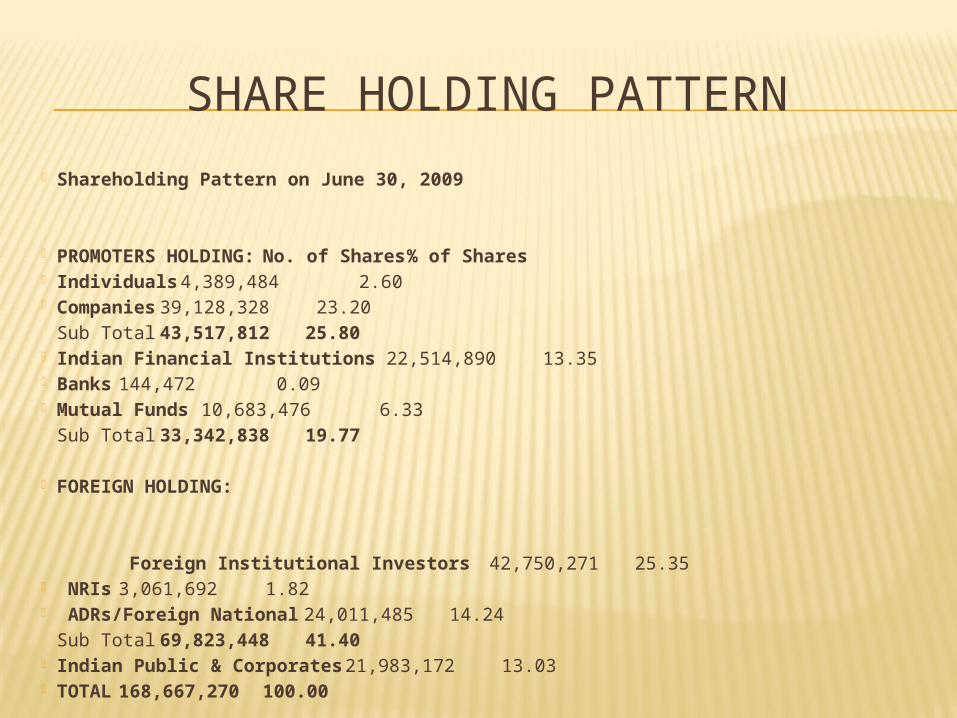
Shareholding Pattern on June 30, 2009 PROMOTERS HOLDING: No. of Shares % of Shares Individuals 4,389,484 2.60 Companies 39,128,328 23.20
Sub Total 43,517,812 25.80 Indian Financial Institutions 22,514,890 13.35 Banks 144,472 0.09 Mutual Funds 10,683,476 6.33
Sub Total 33,342,838 19.77
FOREIGN HOLDING:
Foreign Institutional Investors42,750,271 25.35 NRIs 3,061,692 1.82 ADRs/Foreign National 24,011,485 14.24
Sub Total 69,823,448 41.40 Indian Public & Corporates 21,983,172 13.03 TOTAL 168,667,270 100.00
FINANCIAL FUNDAMENTAL
In July 3, 2009 The stock of Dr Reddy’s Laboratories moved up by 9 per cent on Thursday on BSE.
The stock opened at Rs 1,093, and touched a high of Rs 1,206 intra-day, before settling at Rs 1,189.20. On NSE, the stock appreciated by 9.35 per cent to Rs 1,193.60. It touched a high of Rs 1,206.85 on NSE.
The stock clocked a turnover of 1,93,783 shares on BSE, while on NSE, 5,03,725 shares changed hands on Thursday.
HR SNAPSHOT OF DR REDDY’S

CHAIRMAN EXECUTIVE MD & CHIEF OPERATING OFFICER
(Dr. Anji Reddy) VICE CHAIRMAN & CEO (Satish Reddy)
(G V Prasad)
DR REDDY’S BOARD OF DIRECTORS
HR SNAPSHOT OF DR REDDY’S
The Management Council is the top tier of our company's management structure.
The management of Dr. Reddy's has developed and implemented policies, procedures and practices that attempt to translate our company's vision, mission and purpose into reality. The management also identifies, measures, monitors and controls the risks factors in the business and ensures safe, sound and efficient operation.
HR SNAPSHOT OF DR REDDY’S
NO. OF EMPLOYEES: 10000 We recruit bright and eager minds from
premier Business and Technical schools. We look for those who dare to dream. Love ambiguity and challenge. Are tickled by the thought of growing across experience.
CIPLA
HISTORY OF CIPLA In 1935, he set up The Chemical, Industrial & Pharmaceutical Laboratories, which
came to be popularly known as Cipla. He gave the company all his patent and proprietary formulas for several drugs and medicines, without charging any royalty. On August 17, 1935, Cipla was registered as a public limited company with an authorised capital of Rs 6 lakhs.
The search for suitable premises ended at 289, Bellasis Road (the present corporate office) where a small bungalow with a few rooms was taken on lease for 20 years for Rs 350 a month.
Cipla was officially opened on September 22, 1937 when the first products were ready for the market. The Sunday Standard wrote: "The birth of Cipla which was launched into the world by Dr K A Hamied will be a red letter day in the annals of Bombay Industries. The first city in India can now boast of a concern, which will supersede all existing firms in the magnitude of its operations. India has lagged behind in the march of science but she is now awakening from her lethargy. The new company has mapped out an ambitious programme and with intelligent direction and skillful production bids fair to establish a great reputation in the East. "
CIPLA
The present businesses of Cipla can be broadly classified into: Domestic branded formulation sales (74% of total sales; 19-
20% operating profit margin) Domestic unbranded formulation sales (7% of total sales; over
10% operating profit margin) Exports (19% of total sales; around 38-40% operating profit
margin). Breakup of exports is as follows: Europe (25%) US (32%) Africa (17%) Middle East (14%) Asia (7%) and Australia (5%)
The business environment for Cipla has become highly competitive in the last few years. The major factors affecting Cipla are as folows:
New Drug R&D costs are prohibitive, which has made MNCs to spread their R&D costs through Mergers / Acquisitions.
In Indian Pharmaceutical Sector prices of over 60% of the Drugs/Formulations is controlled by the government through DPCO. For Cipla DPCO coverage is around 55%
Low entry barriers in the bulk drugs market has led to a situation of over-capacity, which has made major domestic players, shift their focus towards formulations segment. As a result Cipla , which is earning nearly 80-85 percent of its sales from formulations is facing increasing competition.
With the focus on post 2005 era, MNCs are strengthening their position in India through marketing tie-ups with local majors and fully owned subsidiaries. This can lead to even higher degree of competition.
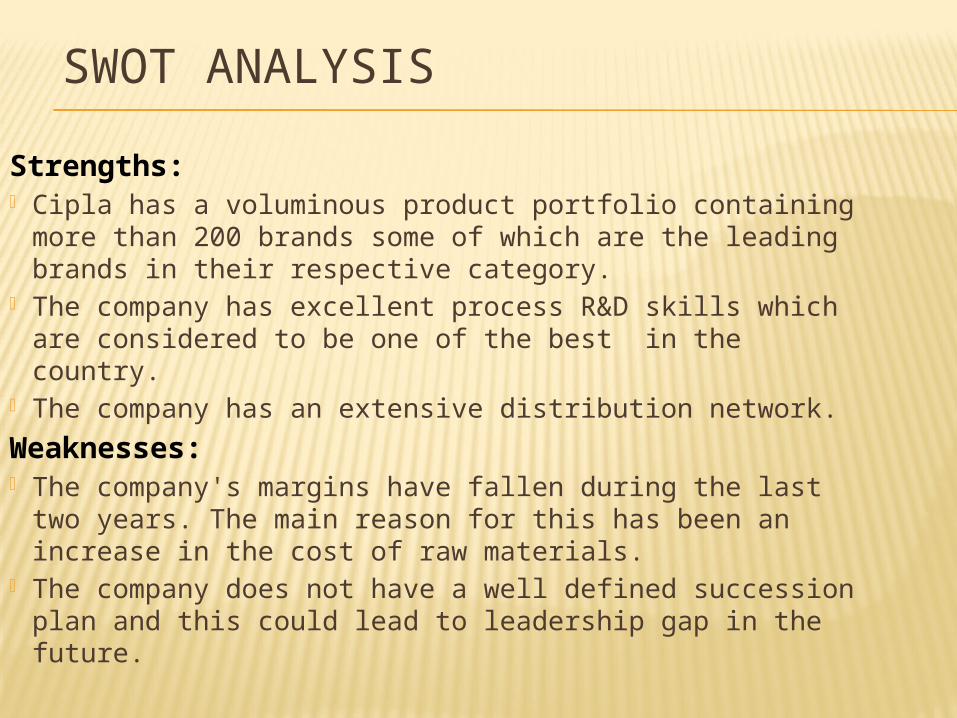
SWOT ANALYSIS
Strengths: Cipla has a voluminous product portfolio containing
more than 200 brands some of which are the leading brands in their respective category.
The company has excellent process R&D skills which are considered to be one of the best in the country.
The company has an extensive distribution network.
Weaknesses: The company's margins have fallen during the last two
years. The main reason for this has been an increase in the cost of raw materials.
The company does not have a well defined succession plan and this could lead to leadership gap in the future.
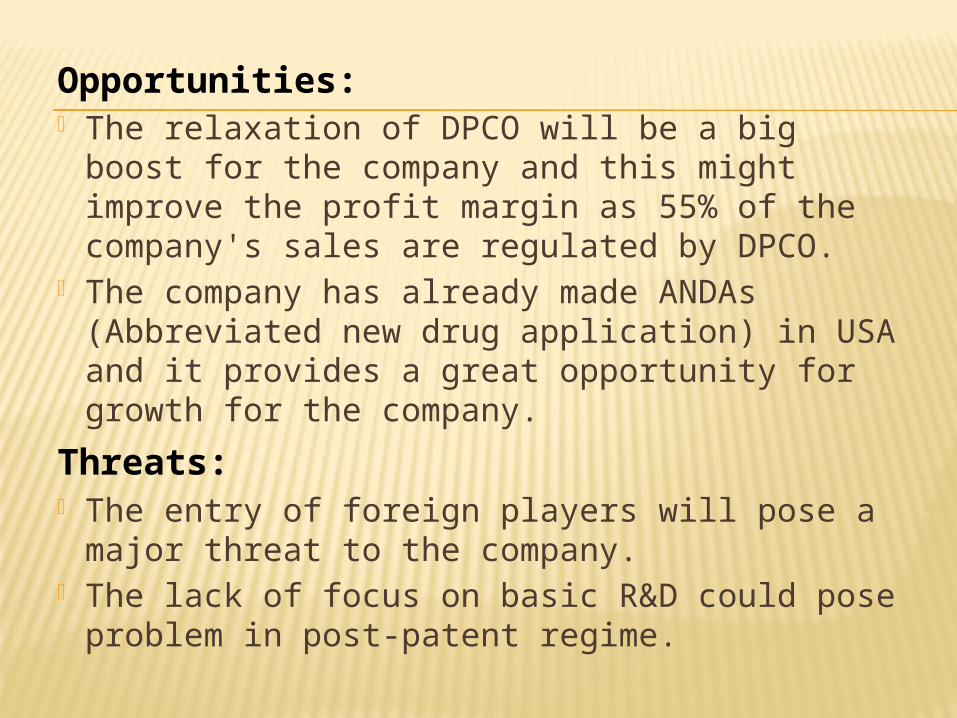
Opportunities: The relaxation of DPCO will be a big boost for
the company and this might improve the profit margin as 55% of the company's sales are regulated by DPCO.
The company has already made ANDAs (Abbreviated new drug application) in USA and it provides a great opportunity for growth for the company.
Threats: The entry of foreign players will pose a major
threat to the company. The lack of focus on basic R&D could pose
problem in post-patent regime.
FINANCIAL PROFILE OF CIPLA
Exports for the financial year ended March 31, 2009 amounted to more than Rs. 27,500 million. Cipla exports raw materials, intermediates, prescription drugs, OTC products and veterinary products. Cipla also offers technology for products and processes. Technical know-how/fees received during the year 2008-09 amounted to about Rs. 2200 million
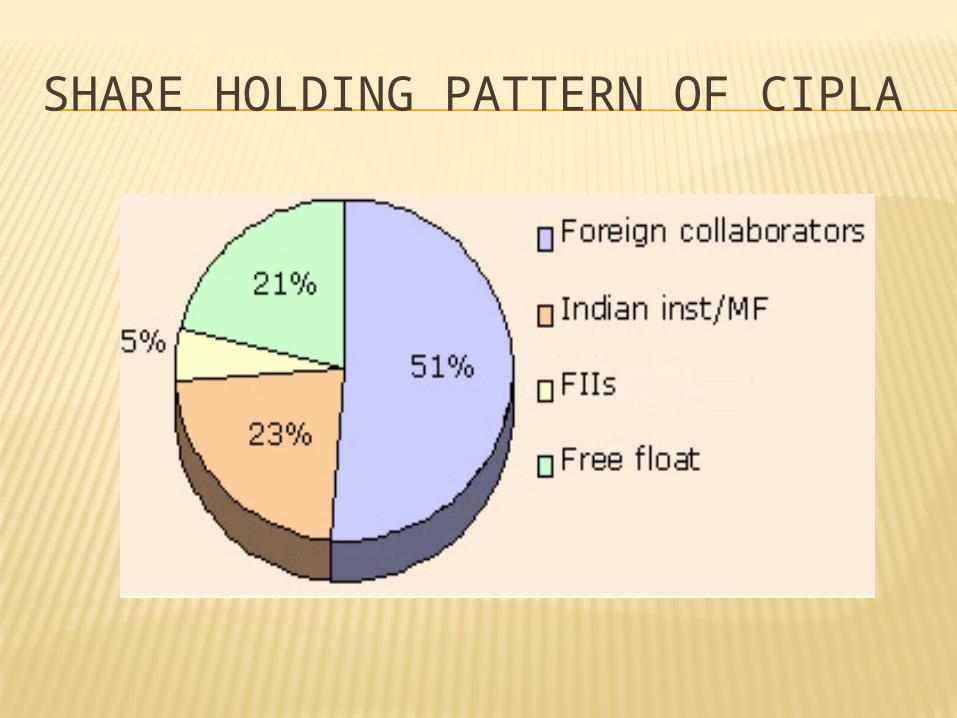
SHARE HOLDING PATTERN OF CIPLA
HR SNAPSHOT OF CIPLA
INTERNATIONAL COMPARISON
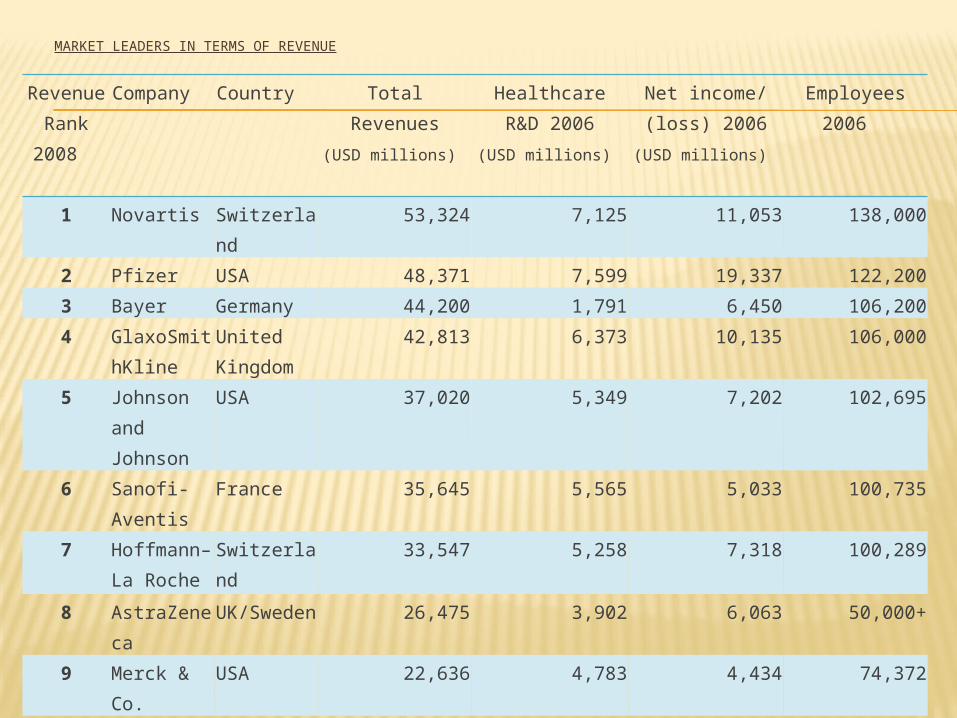
MARKET LEADERS IN TERMS OF REVENUE
Revenue Rank 2008
Company Country Total Revenues (USD millions)
Healthcare R&D 2006 (USD millions)
Net income/ (loss) 2006 (USD millions)
Employees 2006
1 Novartis Switzerland 53,324 7,125 11,053 138,000
2 Pfizer USA 48,371 7,599 19,337 122,2003 Bayer Germany 44,200 1,791 6,450 106,200
4 GlaxoSmithKline
United Kingdom
42,813 6,373 10,135 106,000
5 Johnson and Johnson
USA 37,020 5,349 7,202 102,695
6 Sanofi-Aventis
France 35,645 5,565 5,033 100,735
7 Hoffmann–La Roche
Switzerland 33,547 5,258 7,318 100,289
8 AstraZeneca UK/Sweden 26,475 3,902 6,063 50,000+
9 Merck & Co. USA 22,636 4,783 4,434 74,372
10 Abbott Laboratories
USA 22,476 2,255 1,717 66,800
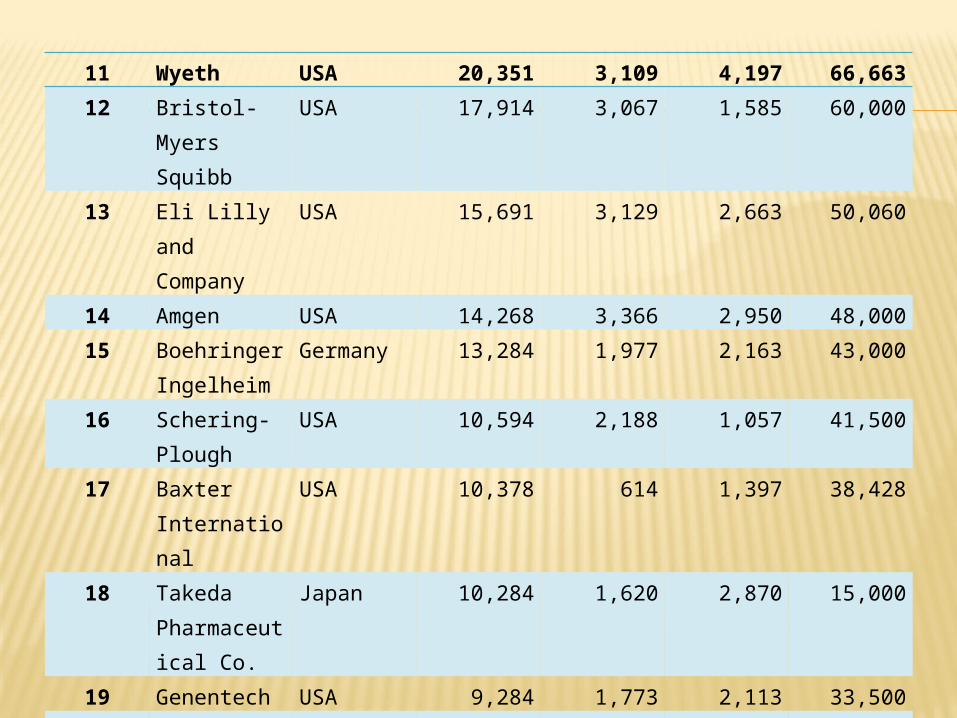
11 Wyeth USA 20,351 3,109 4,197 66,66312 Bristol-Myers
SquibbUSA 17,914 3,067 1,585 60,000
13 Eli Lilly and Company
USA 15,691 3,129 2,663 50,060
14 Amgen USA 14,268 3,366 2,950 48,00015 Boehringer
IngelheimGermany 13,284 1,977 2,163 43,000
16 Schering-Plough
USA 10,594 2,188 1,057 41,500
17 Baxter International
USA 10,378 614 1,397 38,428
18 Takeda Pharmaceutical Co.
Japan 10,284 1,620 2,870 15,000
19 Genentech USA 9,284 1,773 2,113 33,50020 Procter &
GambleUSA 8,964 n/a 10,340 29,258
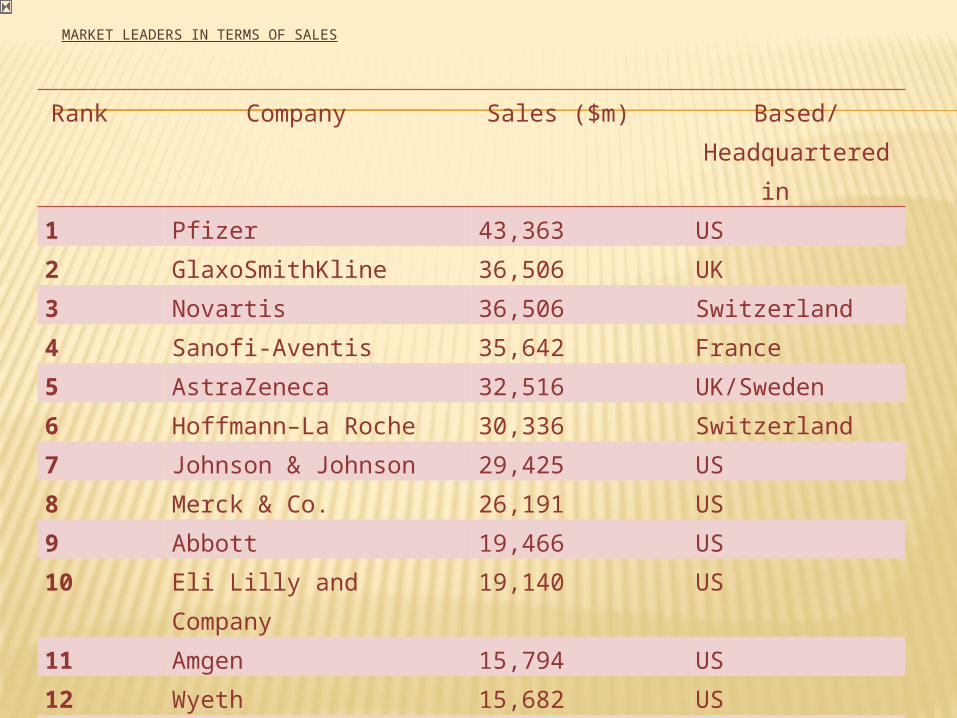
MARKET LEADERS IN TERMS OF SALES
Rank Company Sales ($m) Based/Headquartered in
1 Pfizer 43,363 US
2 GlaxoSmithKline 36,506 UK
3 Novartis 36,506 Switzerland
4 Sanofi-Aventis 35,642 France
5 AstraZeneca 32,516 UK/Sweden
6 Hoffmann–La Roche 30,336 Switzerland
7 Johnson & Johnson 29,425 US
8 Merck & Co. 26,191 US
9 Abbott 19,466 US
10 Eli Lilly and Company 19,140 US
11 Amgen 15,794 US
12 Wyeth 15,682 US
13 Teva 15,274 Israel
14 Bayer 15,660 Germany
15 Takeda 13,819 Japan
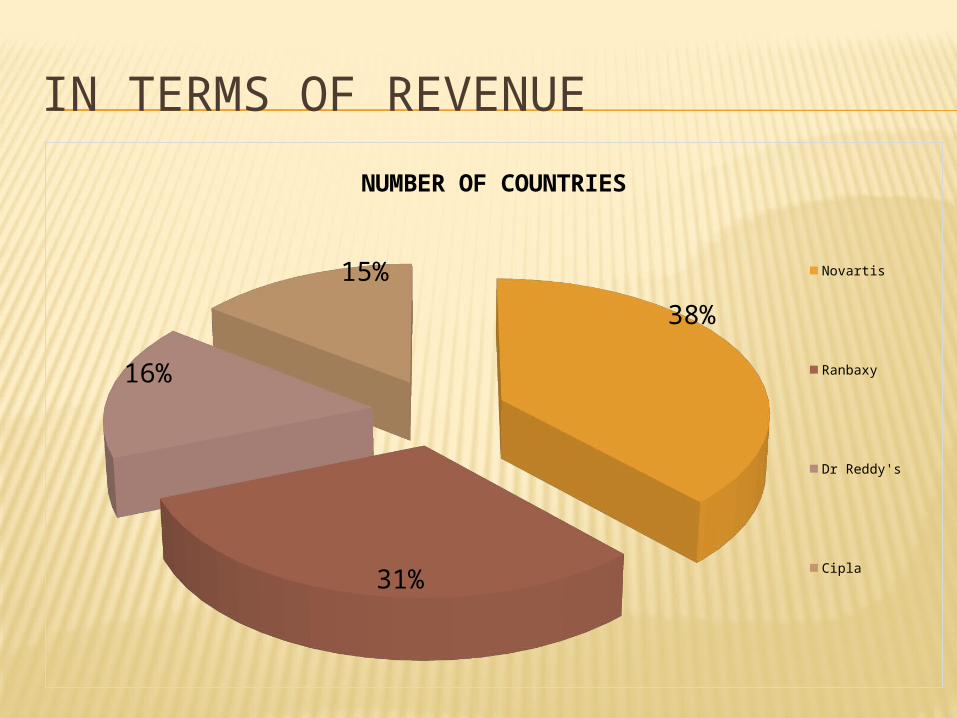
IN TERMS OF REVENUE
38%
31%
16%
15%
NUMBER OF COUNTRIES
Novartis Ranbaxy
Dr Reddy's Cipla
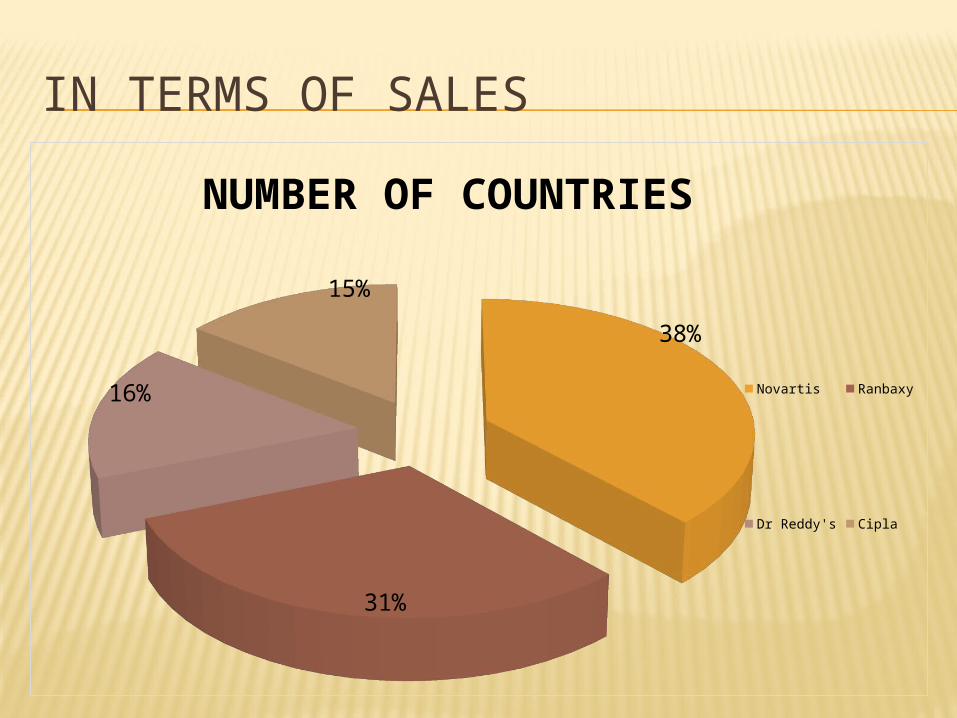
IN TERMS OF SALES
38%
31%
16%
15%
NUMBER OF COUNTRIES
Novartis Ranbaxy
Dr Reddy's Cipla
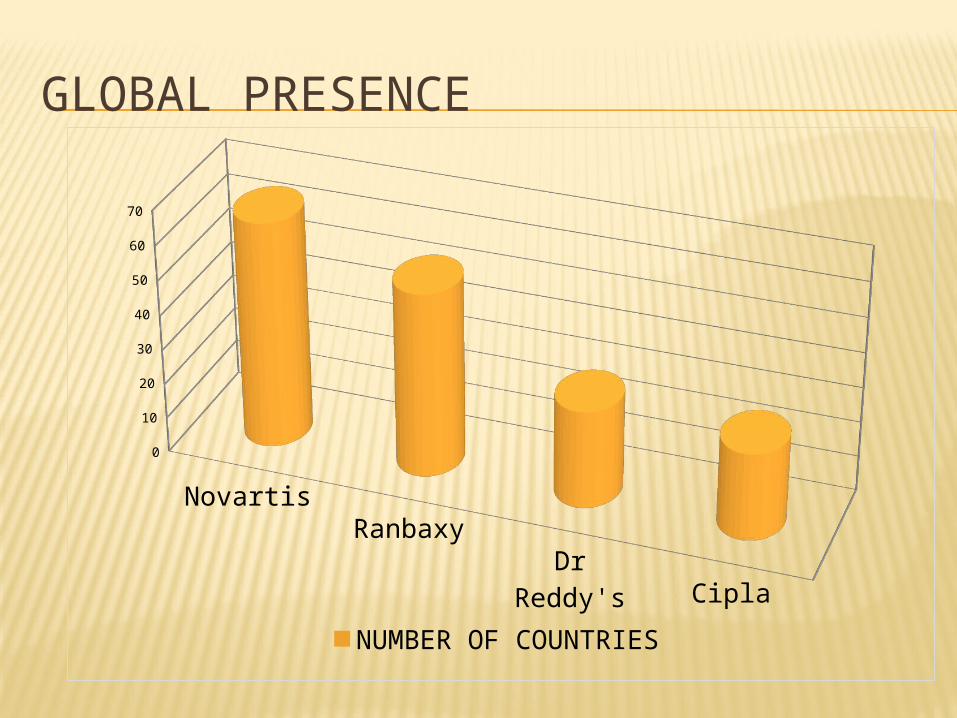
GLOBAL PRESENCE
NovartisRanbaxy
Dr Reddy'sCipla
0
10
20
30
40
50
60
70
NUMBER OF COUNTRIES

ANY QUESTION

THANK YOU