Embed Size (px)
Citation preview
FAO – July 4th 2012
Assesment of N flows
in Livestock Farming Systems:
Main issues and proposed options
J.L. Peyraud, P Cellier
A collective expert assessment was conducted in 2011
A request from Ministry of Agriculture
and Ministry of the Environment
• A synthesis of updated knowledge on N flows in livestock
farming systems, from the animal to the regional scale,
with a specific focus on farm level
• All forms of N (nitrate, ammonia, nitrous oxide, others) and
the link with impact had to be considered
• Identify possible actions to improve livestock farming
systems sustainability (e.g. techniques, management, re-
design of systems, economic and policy incentives

Plan
• N flows in livestock farming systems
• Options to improve N efficiency and to reduce
environmental impacts
• Indicators
• Conclusions

Numerous and interdependant N flows: A variety of inputs and output to/from the farm
0
Manure
42
Crops Prod.
30
Anim
Prod.
Feeds
50
Litter
2
96
Fertilizer 80 Manure 6 N Fixation 9 Seeds 1
Dairy and crops
80 ha, 82 LU, 25 ha cereals
Adapted from Jarvis et al (2011) with data from typical french farms

96
Fertilizer 80 Manure 6 N Fixation 9 Seeds 1
42 Fields
5 130
63
79
Animaux Bâtiment Stockage
Effluents Herds
Manure
Storage
71 68 Feeds
50
Litter
2
96
0
Manure
Crops prod.
30
Anim
Prod
Numerous and interdependant N flows: Lots of internal fluxes to consider
Animal
housing
Adapted from Jarvis et al (2011) with data from typical french farms
Dairy and crops
80 ha, 82 LU, 25 ha cereals
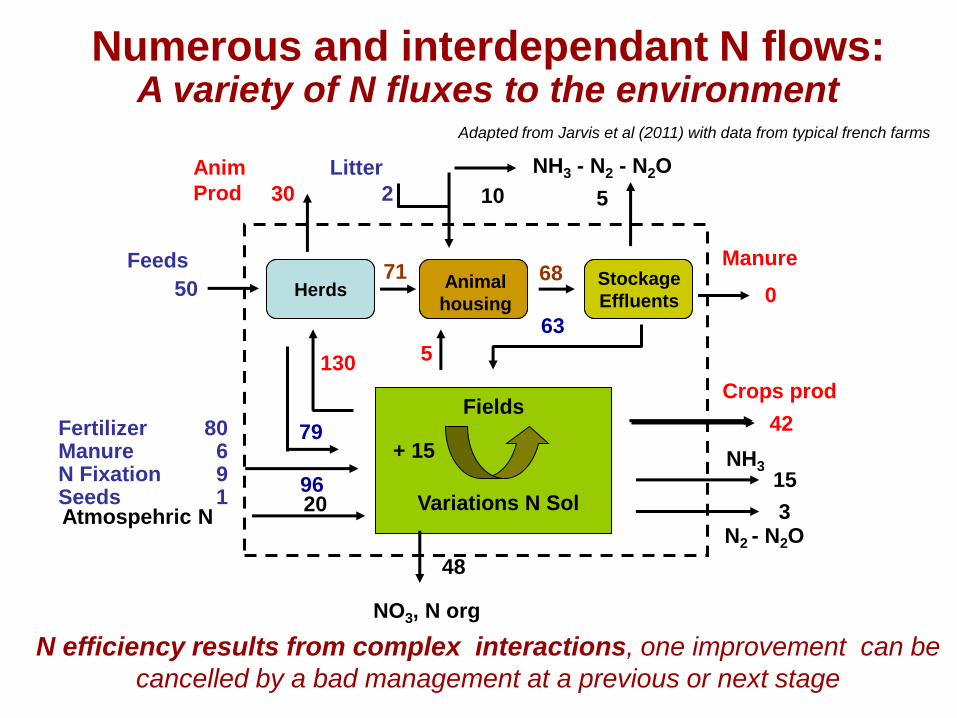
N efficiency results from complex interactions, one improvement can be
cancelled by a bad management at a previous or next stage
96
Fertilizer 80 Manure 6 N Fixation 9 Seeds 1
42
Crops prod Fields
5 130
63
79
Animaux Bâtiment Stockage
Effluents Herds
Stockage
Effluents
71 68 Feeds
50
Litter
2
0
Manure
30
Anim
Prod 10 5
NH3 15
N2 - N2O 3
48
NH3 - N2 - N2O
NO3, N org
Atmospehric N 20 Variations N Sol
+ 15
Animal
housing
Adapted from Jarvis et al (2011) with data from typical french farms
Numerous and interdependant N flows: A variety of N fluxes to the environment
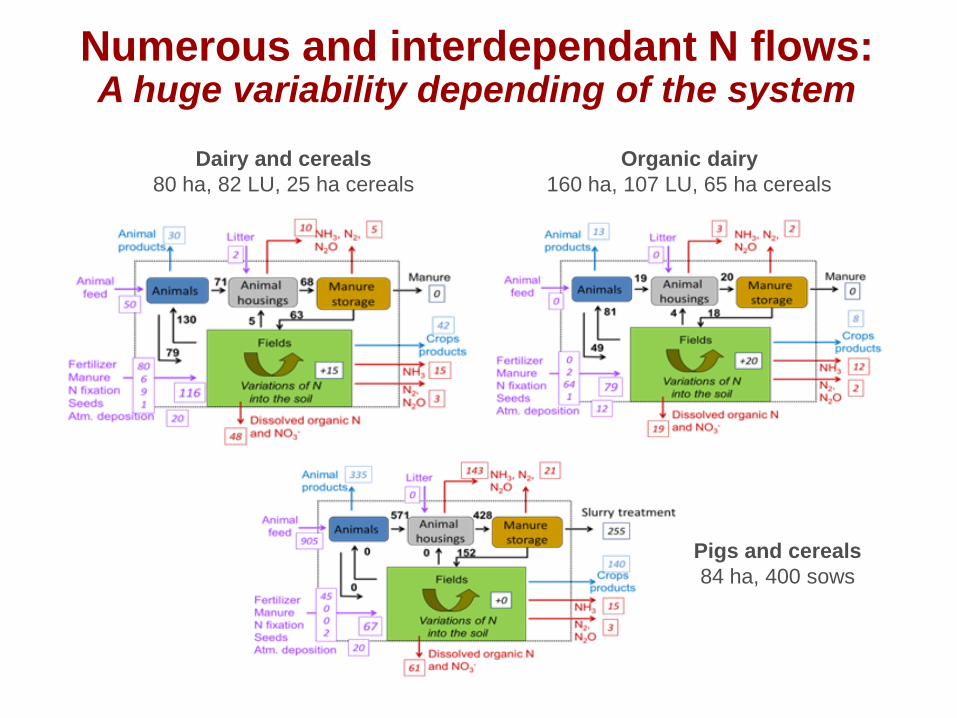
Numerous and interdependant N flows: A huge variability depending of the system
Dairy and cereals
80 ha, 82 LU, 25 ha cereals
Organic dairy
160 ha, 107 LU, 65 ha cereals
Pigs and cereals
84 ha, 400 sows

• N flows in livestock farming systems
• Options to improve N efficiency and to reduce
environmental impacts
• Indicators
• Conclusions
Manure
Herds
Soils
Crops
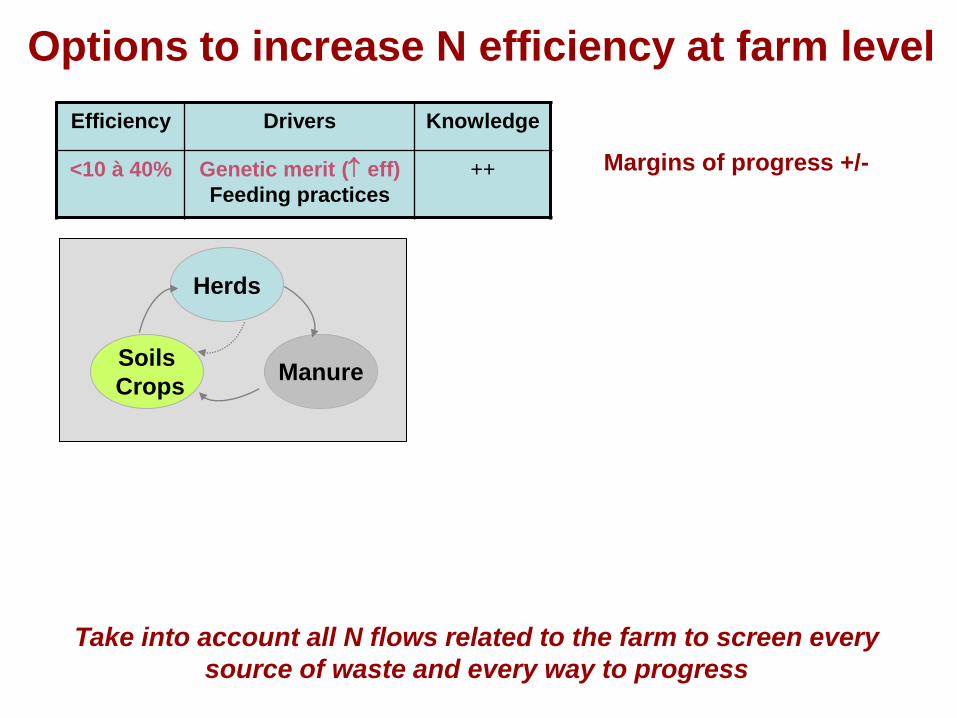
Efficiency Drivers Knowledge
<10 à 40% Genetic merit ( eff)
Feeding practices
++
Options to increase N efficiency at farm level
Take into account all N flows related to the farm to screen every
source of waste and every way to progress
Margins of progress +/-
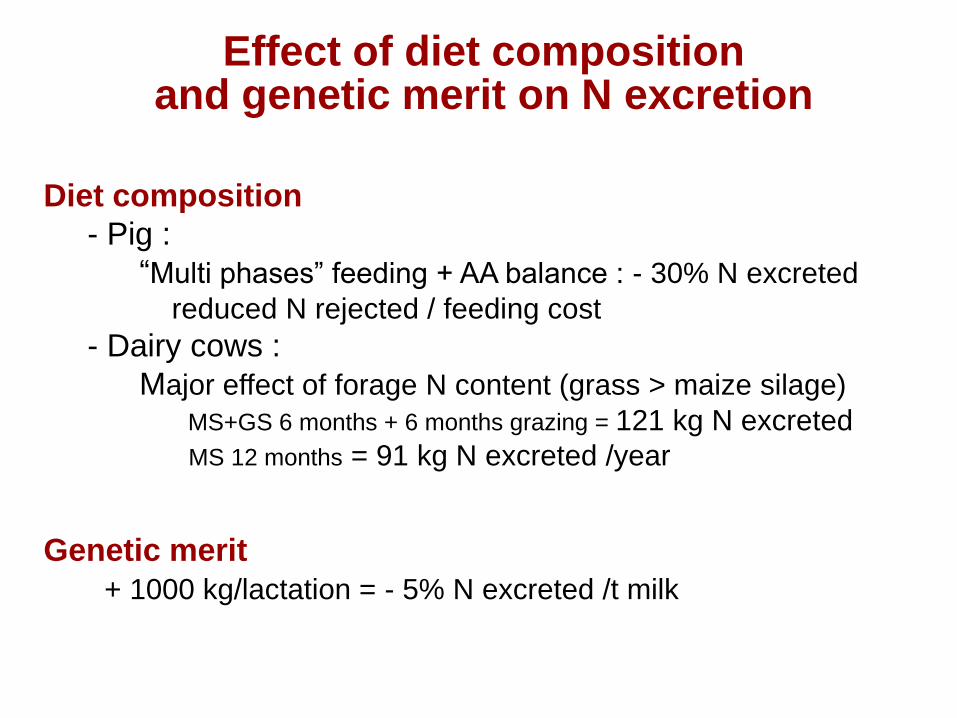
Diet composition
- Pig :
“Multi phases” feeding + AA balance : - 30% N excreted
reduced N rejected / feeding cost
- Dairy cows :
Major effect of forage N content (grass > maize silage)
MS+GS 6 months + 6 months grazing = 121 kg N excreted
MS 12 months = 91 kg N excreted /year
Genetic merit
+ 1000 kg/lactation = - 5% N excreted /t milk
Effect of diet composition and genetic merit on N excretion

Manure
Herds
Soils
Crops
Efficiency Drivers Knowledge
<10 à 40% Genetic merit ( eff)
Feeding practices
++
Losses Drivers Knowledge
20 to 80%
NH3 25-55%
Housing > grazing
Housing>spreading
>storage
Treatments
Large
uncertainty
(emission)
Options to increase N efficiency at farm level
Margins of progress +/-
Margins of progress ++
Take into account all N flows related to the farm to screen every
source of waste and every way to progress
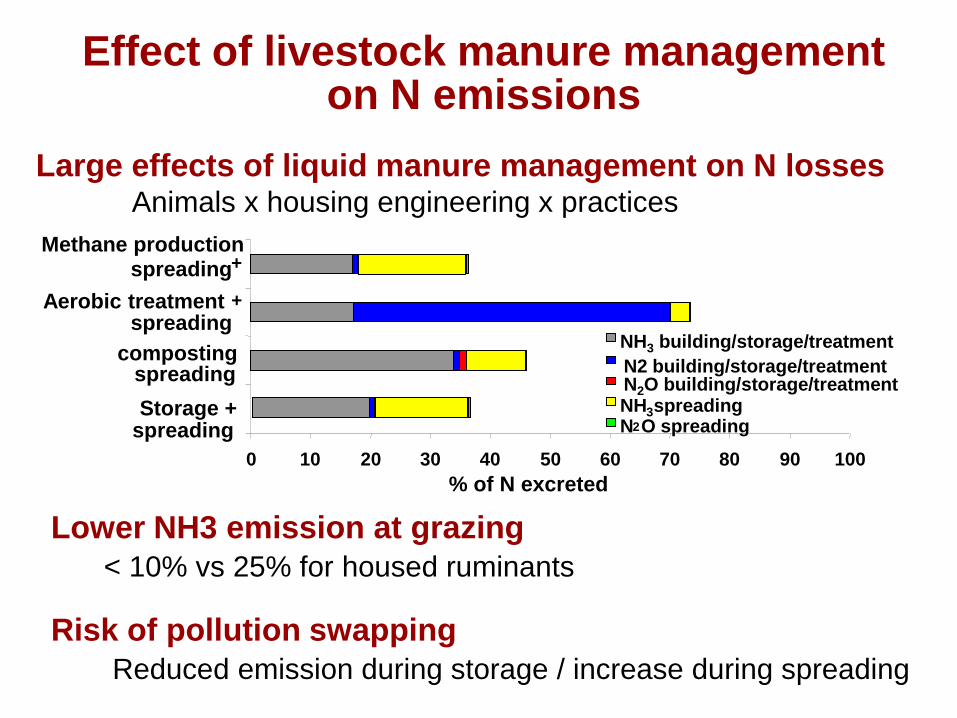
0 10 20 30 40 50 60 70 80 90 100
Storage + spreading
composting spreading
Aerobic treatment spreading
Methane production + spreading
% of N excreted
NH3 building/storage/treatment
N2 building/storage/treatment N2O building/storage/treatment NH 3 spreading N 2 O spreading
+
Large effects of liquid manure management on N losses Animals x housing engineering x practices
Effect of livestock manure management on N emissions
Lower NH3 emission at grazing
< 10% vs 25% for housed ruminants
Risk of pollution swapping
Reduced emission during storage / increase during spreading

Manure
Herds
Soils
Crops
Efficiency Drivers Knowledge
<10 à 40% Genetic merit ( eff)
Feeding practices
++
Efficiency Drivers Knowledge
Medium
(> 40%)
High inputs ( eff)
Grassland, legumes,
crop rotation
+
Losses Drivers Knowledge
20 to 80%
NH3 25-55%
Housing > grazing
Housing>spreading
>storage
Treatments
Large
uncertainty
(emission)
Options to increase N efficiency at farm level
Take into account all N flows related to the farm to screen every
source of waste and every way to progress
Margins of progress +/-
Margins of progress ++
Margins of progress ++
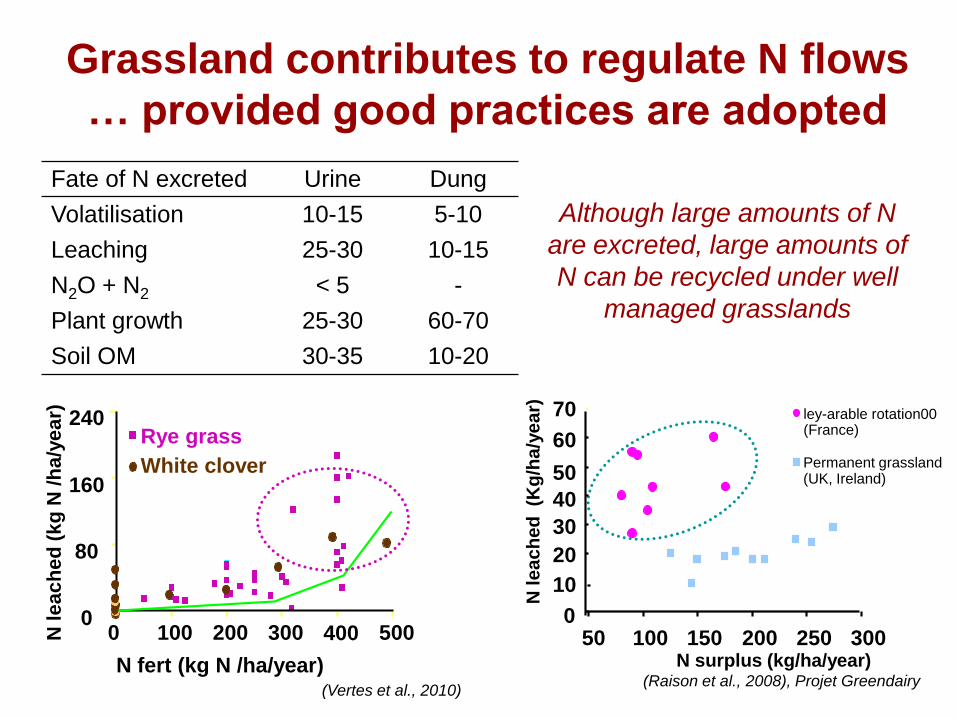
N surplus (kg/ha/year)
N le
ac
he
d (K
g/h
a/y
ea
r)
0
10
20
30
40
50
60
70
50 100 150 200 250 300
ley-arable rotation00 (France)
Permanent grassland (UK, Ireland)
(Vertes et al., 2010)
Grassland contributes to regulate N flows
… provided good practices are adopted
0 100 200 300 400 500 0
80
160
240 Rye grass
White clover
N le
ac
he
d (
kg
N /h
a/y
ea
r)
N fert (kg N /ha/year)
Fate of N excreted Urine Dung
Volatilisation 10-15 5-10
Leaching 25-30 10-15
N2O + N2 < 5 -
Plant growth 25-30 60-70
Soil OM 30-35 10-20
Although large amounts of N
are excreted, large amounts of
N can be recycled under well
managed grasslands
(Raison et al., 2008), Projet Greendairy
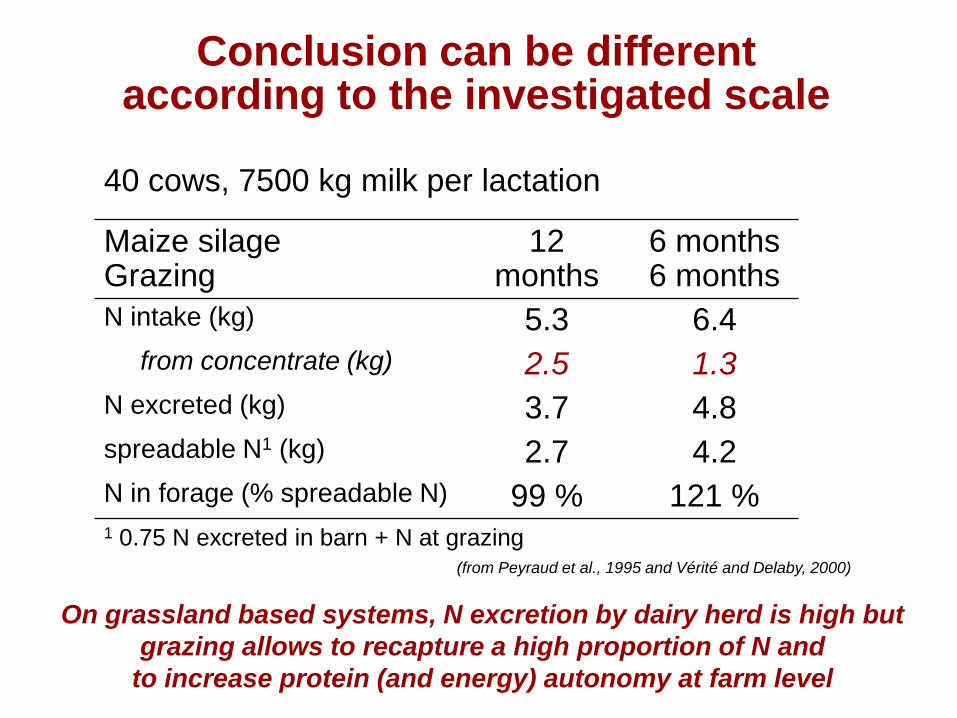
Conclusion can be different according to the investigated scale
Maize silage Grazing
12 months
6 months 6 months
N intake (kg) 5.3 6.4
from concentrate (kg) 2.5 1.3
N excreted (kg) 3.7 4.8
spreadable N1 (kg) 2.7 4.2
N in forage (% spreadable N) 99 % 121 %
(from Peyraud et al., 1995 and Vérité and Delaby, 2000)
1 0.75 N excreted in barn + N at grazing
40 cows, 7500 kg milk per lactation
On grassland based systems, N excretion by dairy herd is high but
grazing allows to recapture a high proportion of N and
to increase protein (and energy) autonomy at farm level
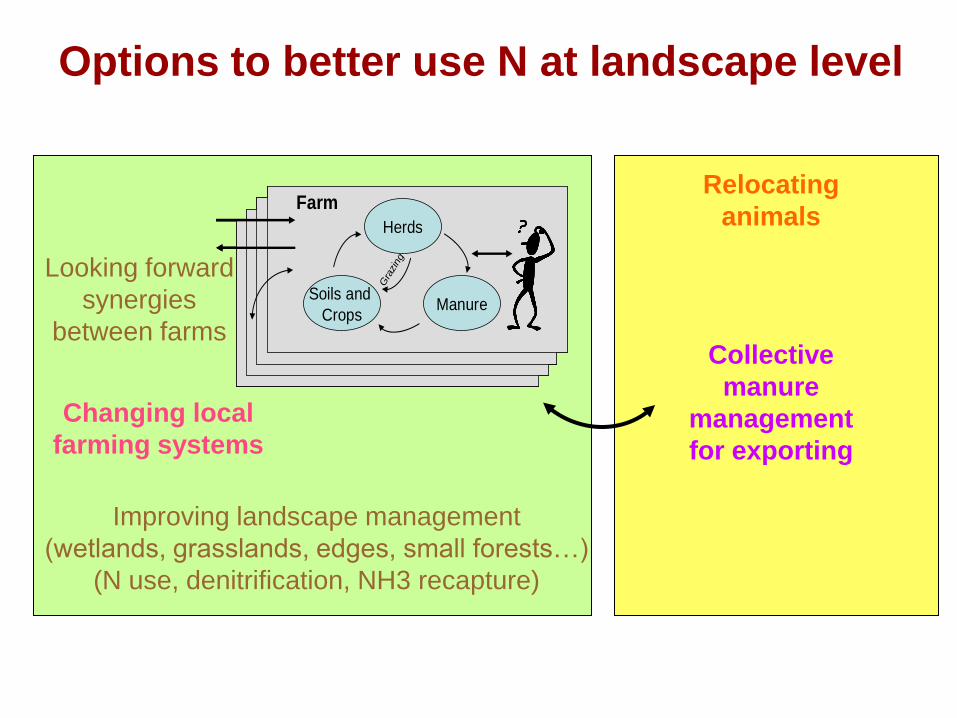
Improving landscape management
(wetlands, grasslands, edges, small forests…)
(N use, denitrification, NH3 recapture)
Collective
manure
management
for exporting
Relocating
animals
Looking forward
synergies
between farms
Changing local
farming systems
Options to better use N at landscape level
Herds
ManureSoils and
Crops
Farm
Gra
zing
Herds
ManureSoils and
Crops
Farm
Gra
zing
• N flows in livestock farming systems
• Options to improve N efficiency and to reduce
environmental impacts
• Indicators
• Conclusions
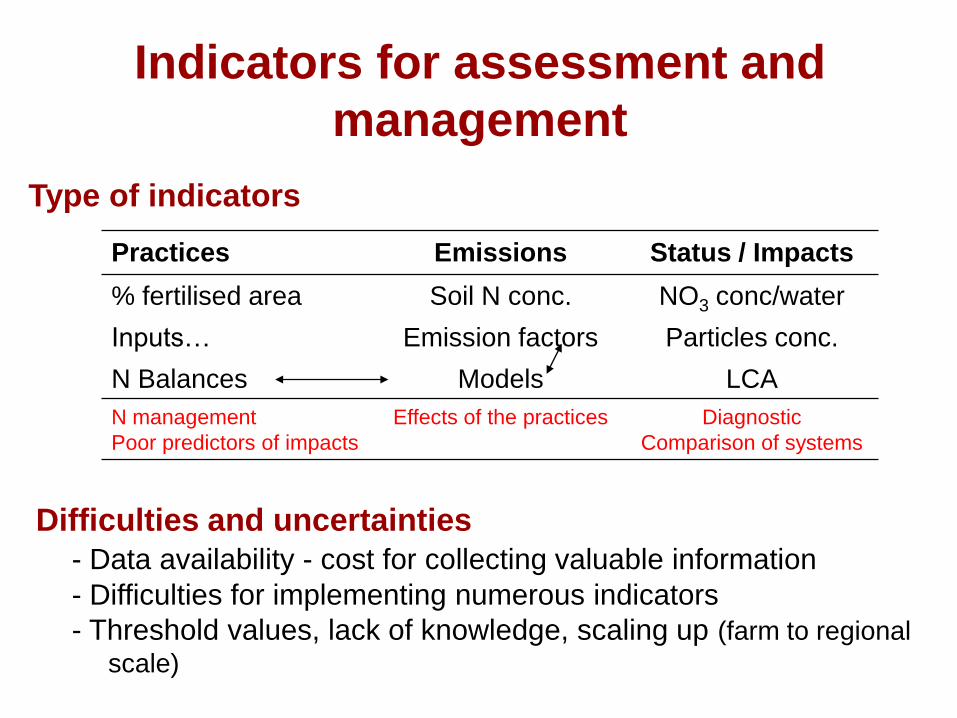
Indicators for assessment and
management
Practices Emissions Status / Impacts
% fertilised area Soil N conc. NO3 conc/water
Inputs… Emission factors Particles conc.
N Balances Models LCA
N management
Poor predictors of impacts
Effects of the practices Diagnostic
Comparison of systems
Difficulties and uncertainties
- Data availability - cost for collecting valuable information
- Difficulties for implementing numerous indicators
- Threshold values, lack of knowledge, scaling up (farm to regional
scale)
Type of indicators
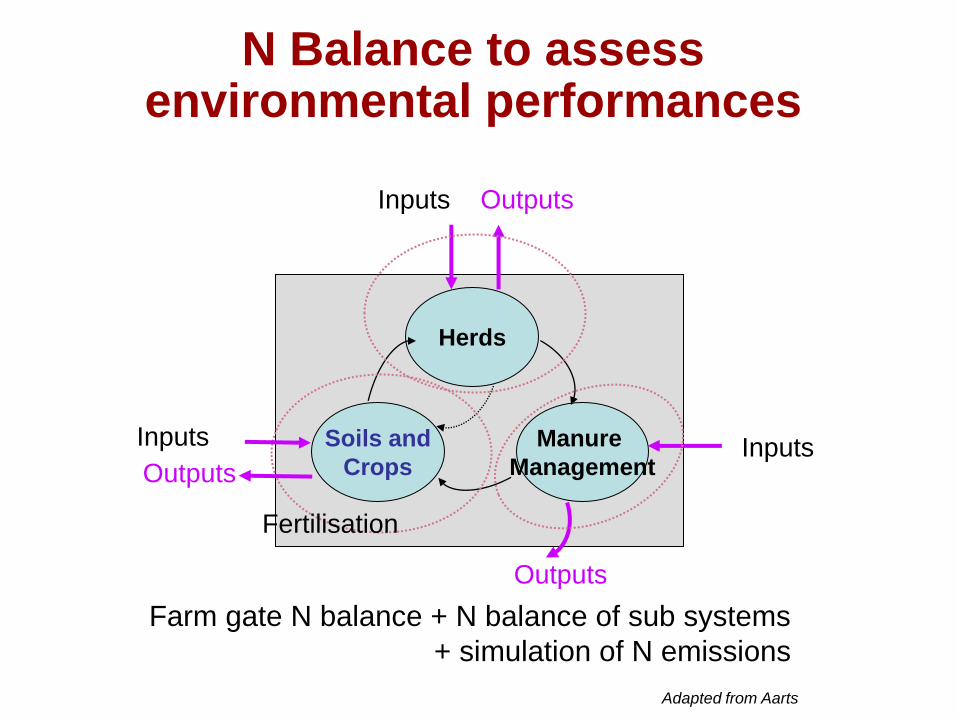
Manure
Management
Outputs Inputs
Outputs
Inputs
Herds
Soils and
Crops
Inputs
Outputs
Fertilisation
Adapted from Aarts
Farm gate N balance + N balance of sub systems
+ simulation of N emissions
N Balance to assess environmental performances
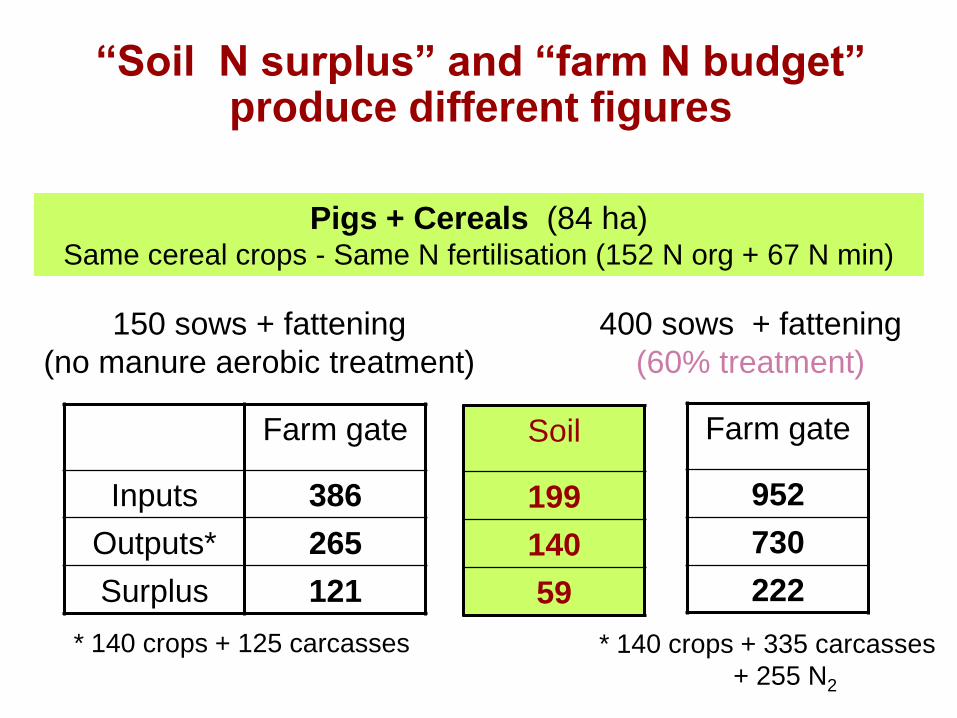
150 sows + fattening
(no manure aerobic treatment)
Pigs + Cereals (84 ha) Same cereal crops - Same N fertilisation (152 N org + 67 N min)
400 sows + fattening
(60% treatment)
Farm gate
Inputs 386
Outputs* 265
Surplus 121
Farm gate
952
730
222
Soil
199
140
59
“Soil N surplus” and “farm N budget” produce different figures
* 140 crops + 125 carcasses * 140 crops + 335 carcasses
+ 255 N2
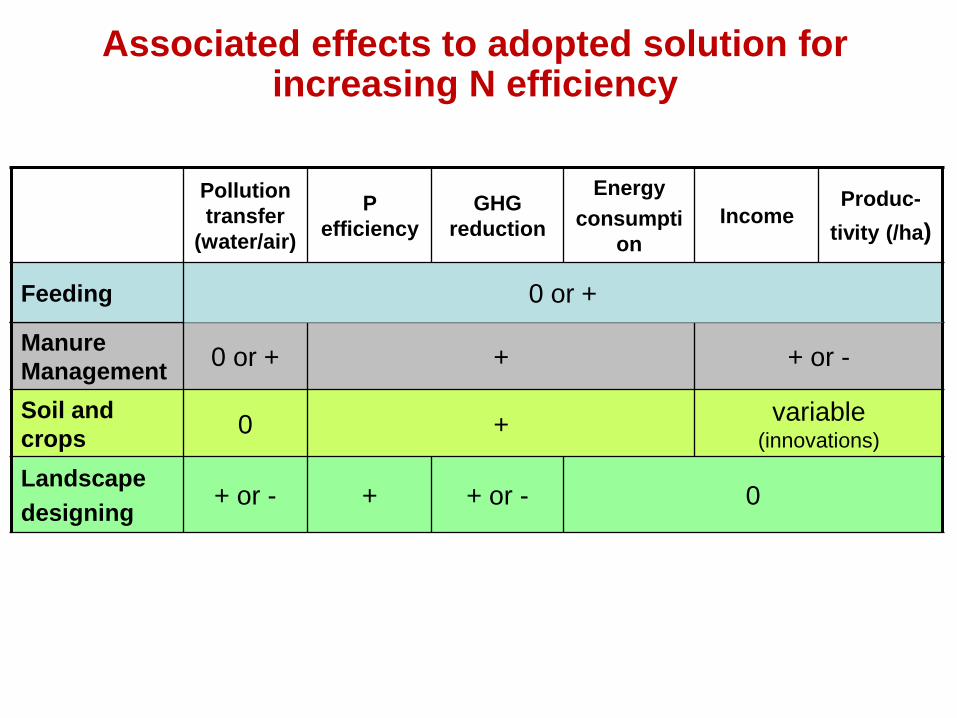
Associated effects to adopted solution for increasing N efficiency
Manure
Management 0 or + + + or -
Soil and
crops 0 +
variable (innovations)
Pollution
transfer
(water/air)
P
efficiency
GHG
reduction
Energy
consumpti
on
Income Produc-
tivity (/ha)
Feeding 0 or +
Landscape
designing + or - + + or - 0
• N flows in livestock farming systems
• Options to improve N efficiency and to reduce
environmental impacts
• Indicators
• Conclusions
Options were identified
Farm level
Reducing farm N surplus (manure > fields > herds)
- Animal feeding, animal genetics, precision livestock feeding
- Reduce NH3 losses but interdependant steps, risk of
pollutions transfer,
- Cropland and grassland management
Indicators to better manage the system : N balances,….
Landscape level
Need to take better account of local territorial vulnerability
but … this will need strong will from policy makers

• Documents on the web http://www.inra.fr/l_institut/expertise/expertises_realisees/expertise_flux_d_azote_
lies_aux_elevages
• Summary : 8 pages
• Extended summary : 67 pages
• Full report : 528 pages