Embed Size (px)
Citation preview
Measuring Adult Student Gains and Satisfaction After Earning an Undergraduate
Continuing Education Degree
Jim Fong, UPCEAAmanda Mason-Singh, Hobsons
Objective and MethodologyUPCEA’s Center for Research and Consulting (CRC), in partnership with Hobsons, has conducted multi-year studies on adult student gains and satisfaction after earning a bachelor’s degree from a U.S. college or university. The objective of the research has been to measure how the undergraduate degree has impacted adult learners’ careers and personal lives. The data represents only degree completers.
Between the two most recent studies, a total of 1,706 individuals were surveyed
In 2013, a benchmark study surveyed 988 adults interested in completing or starting a bachelor’s degree but had not or could not due to a variety of factors.
Key Findings
Summary: Fall 2013 Study
Salaries increase, especially after four years of having earned the degree. Smaller but more frequent raises are often hurdles to those considering a degree.
Financial aid and student support/advising were reported as being the most used campus services.
Greater job security, especially after four years of receiving the degree
Increase in likelihood to receive a promotion or have a career change
Improved confidence and job security (without necessarily having to change jobs)
More analysis needed on impact of degree type and other demographics
Study Demographics
What year did you graduate?
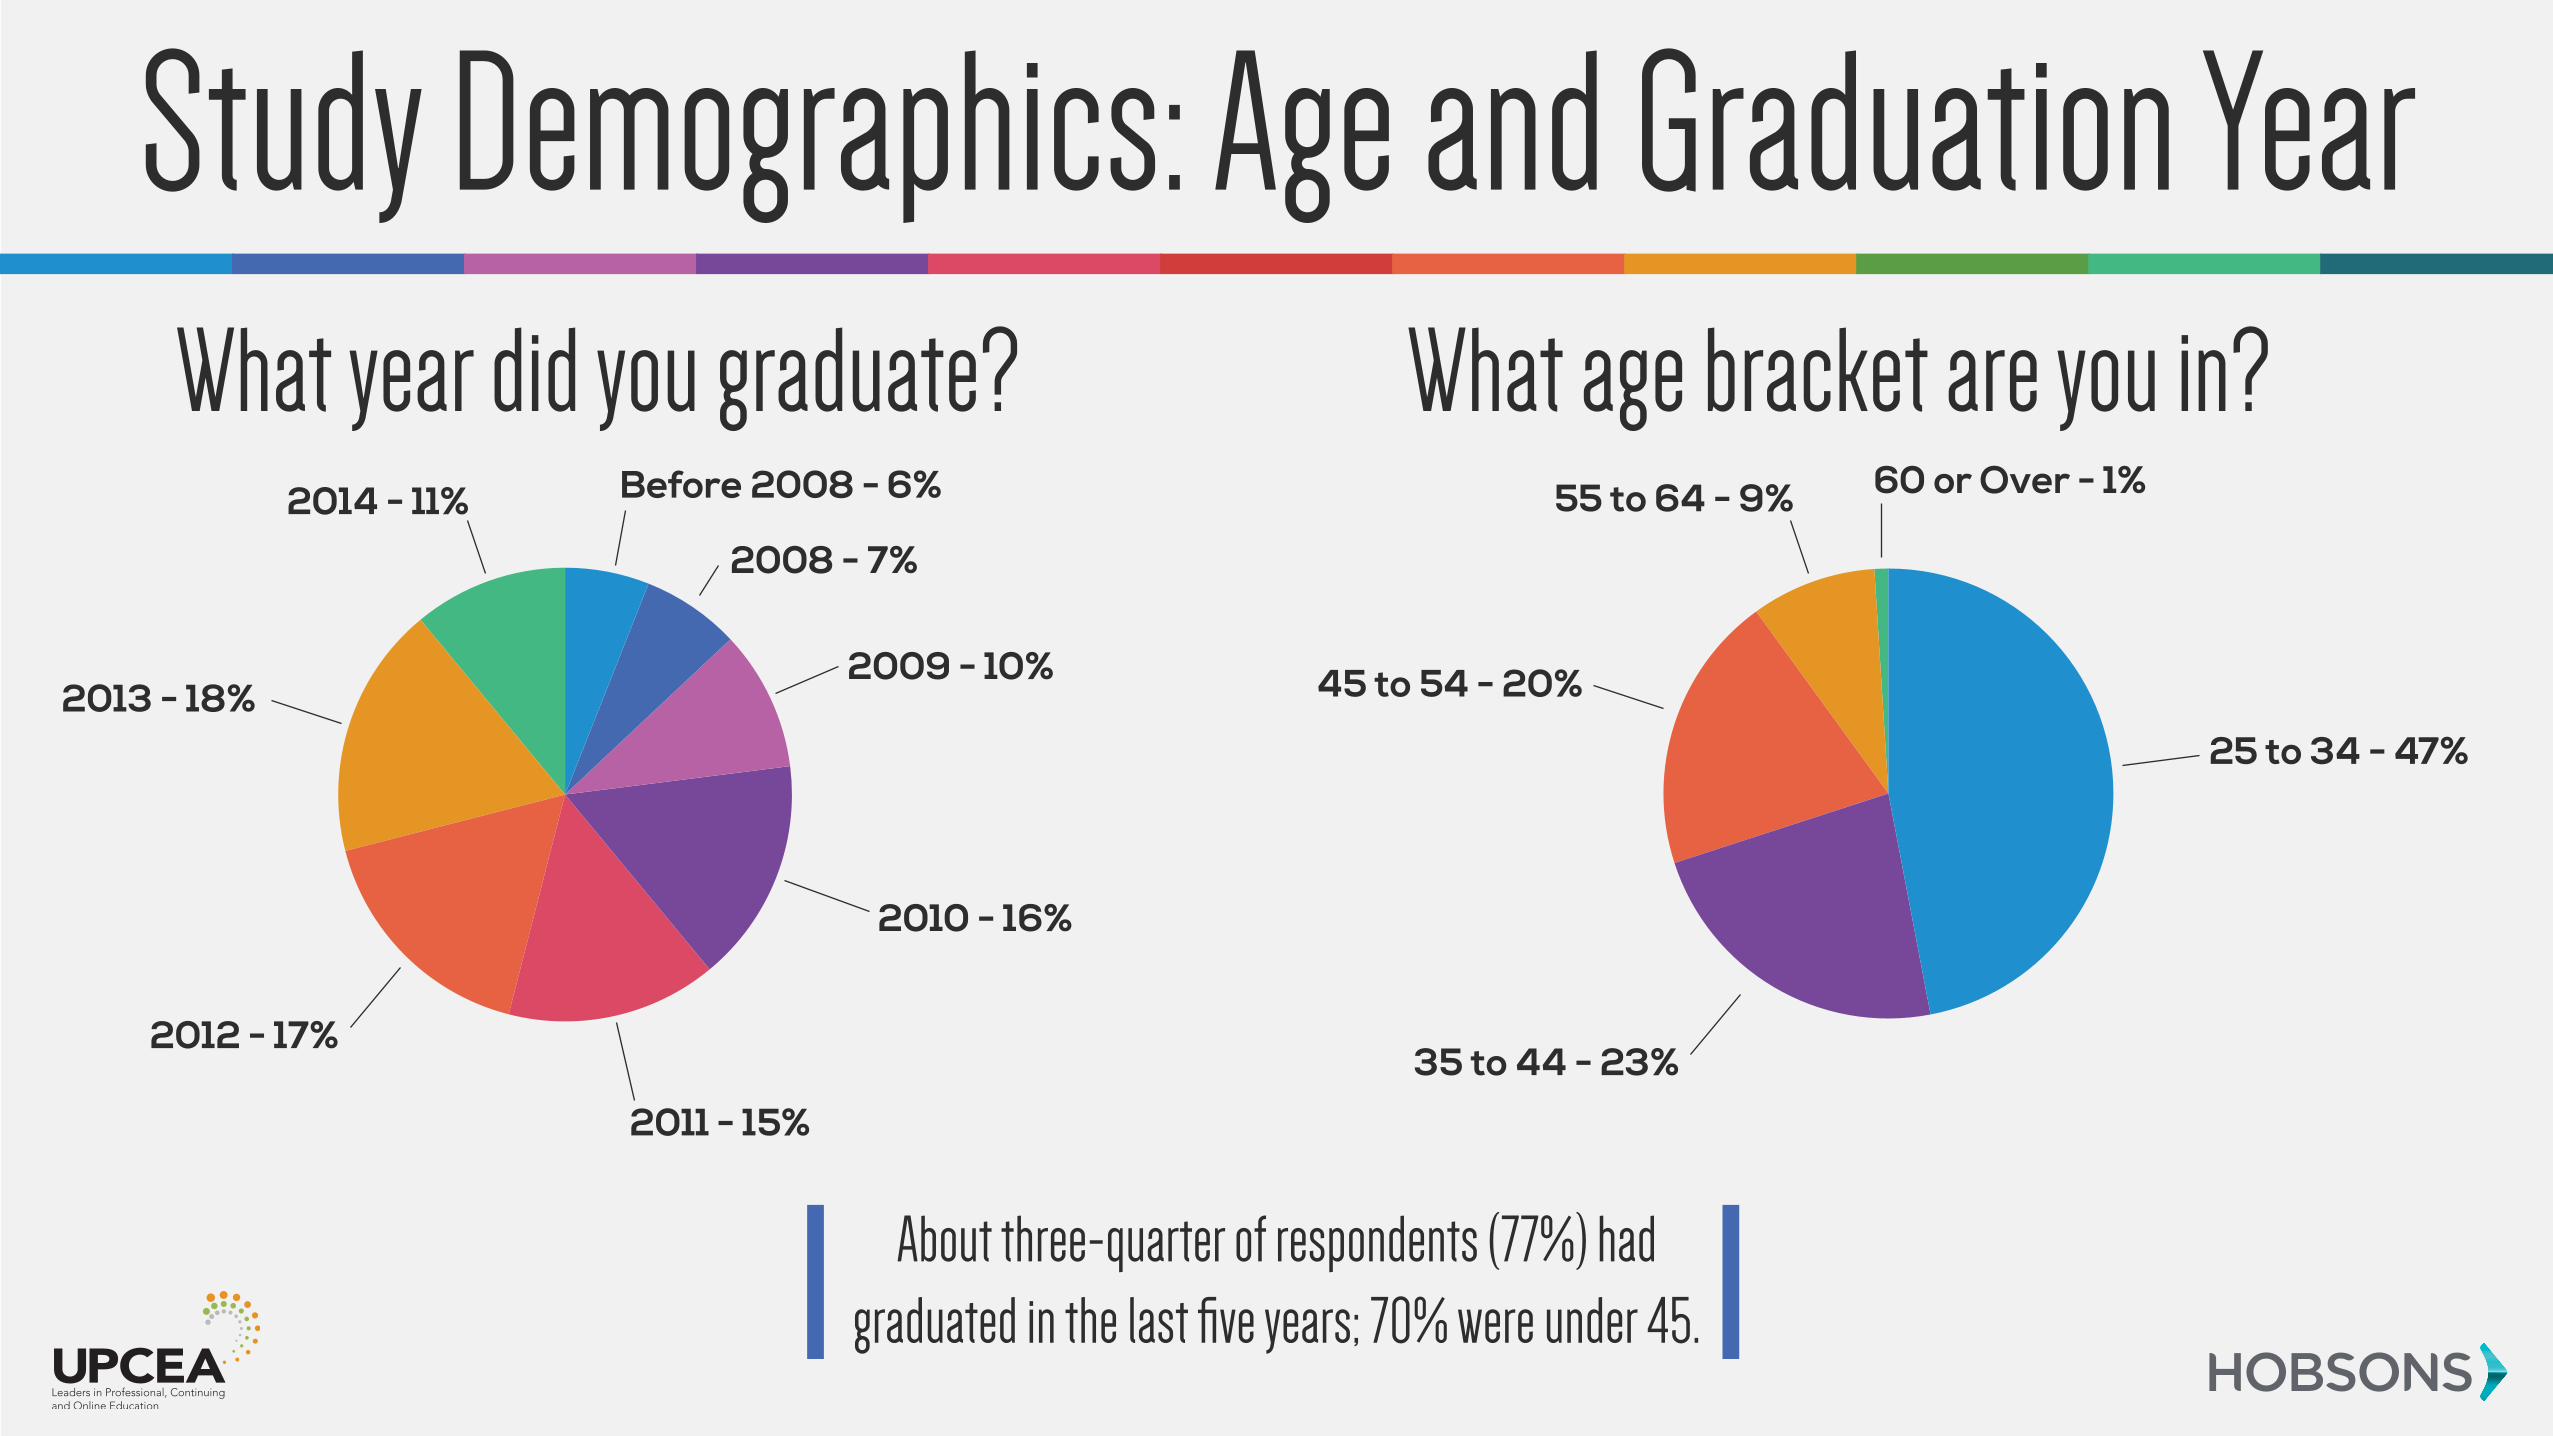
About three-quarter of respondents (77%) had graduated in the last five years; 70% were under 45.
What age bracket are you in?
Study Demographics: Age and Graduation Year
2012 - 17%35 to 44 - 23%
2013 - 18% 45 to 54 - 20%
2014 - 11% 55 to 64 - 9%Before 2008 - 6% 60 or Over - 1%
2008 - 7%
2009 - 10%
25 to 34 - 47%
2010 - 16%
2011 - 15%
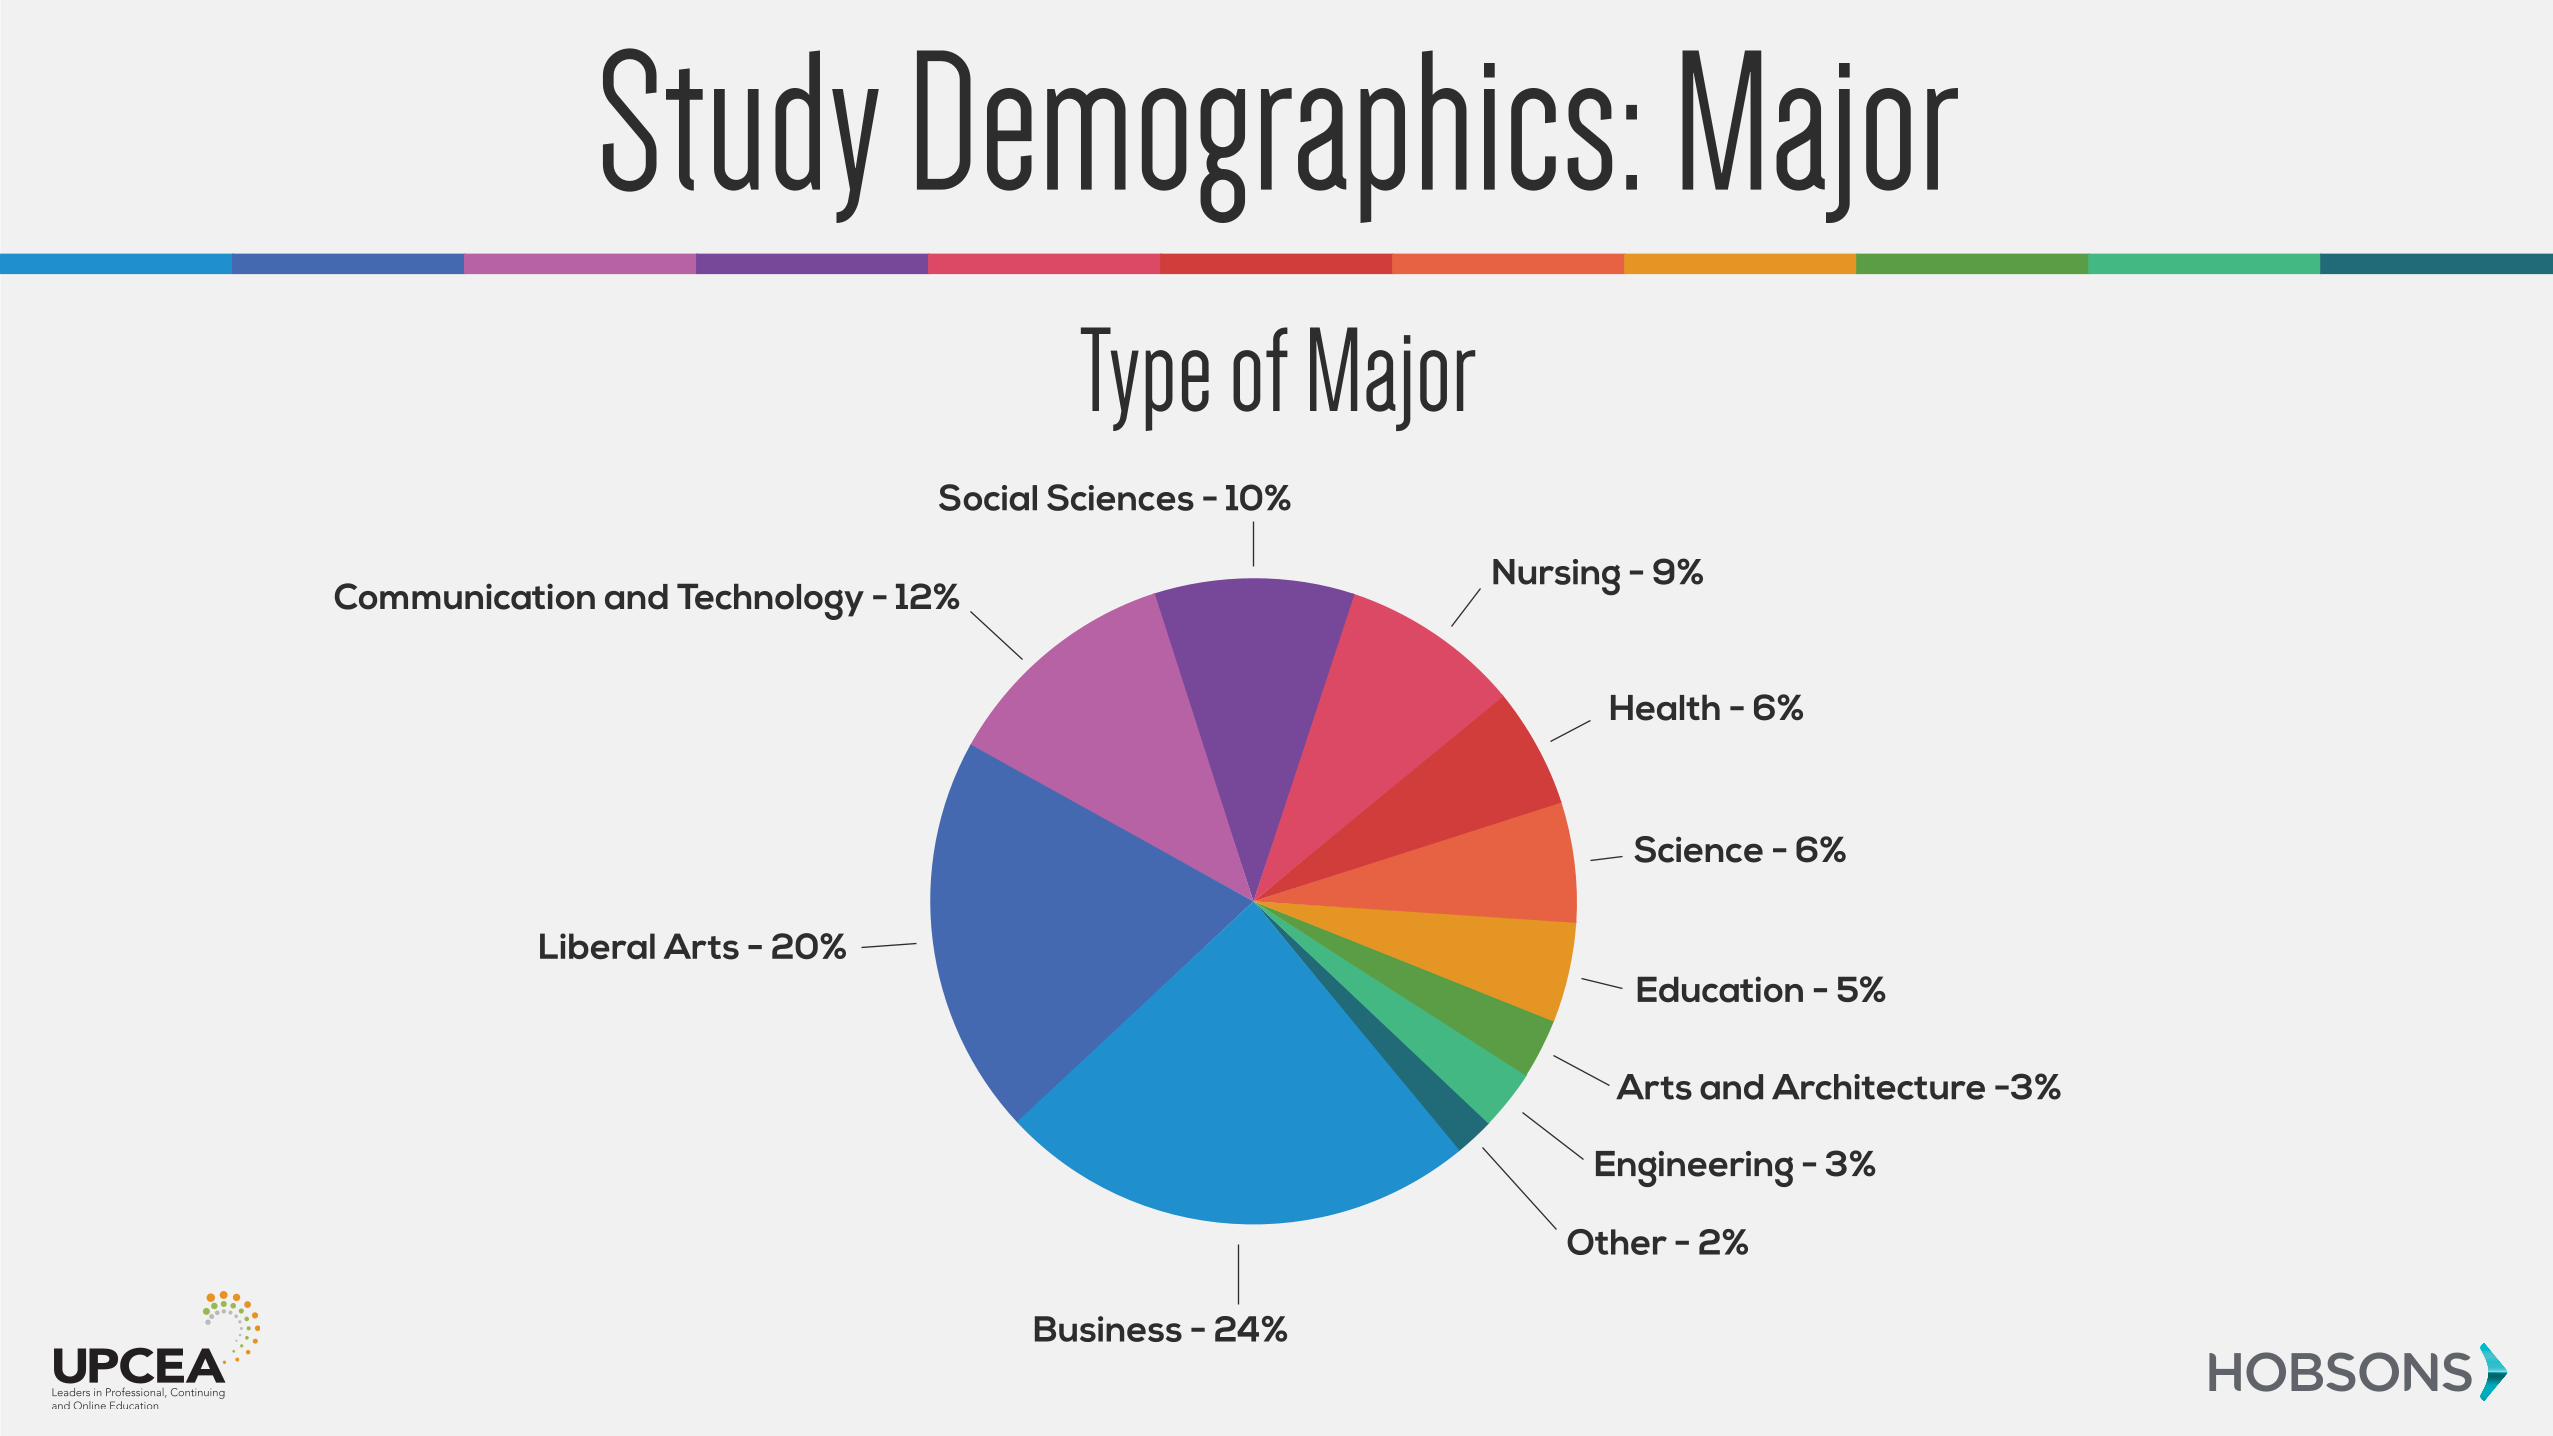
Type of Major
Study Demographics: Major
Business - 24%
Liberal Arts - 20%
Communication and Technology - 12%
Social Sciences - 10%
Nursing - 9%
Health - 6%
Science - 6%
Education - 5%
Arts and Architecture -3%
Engineering - 3%
Other - 2%
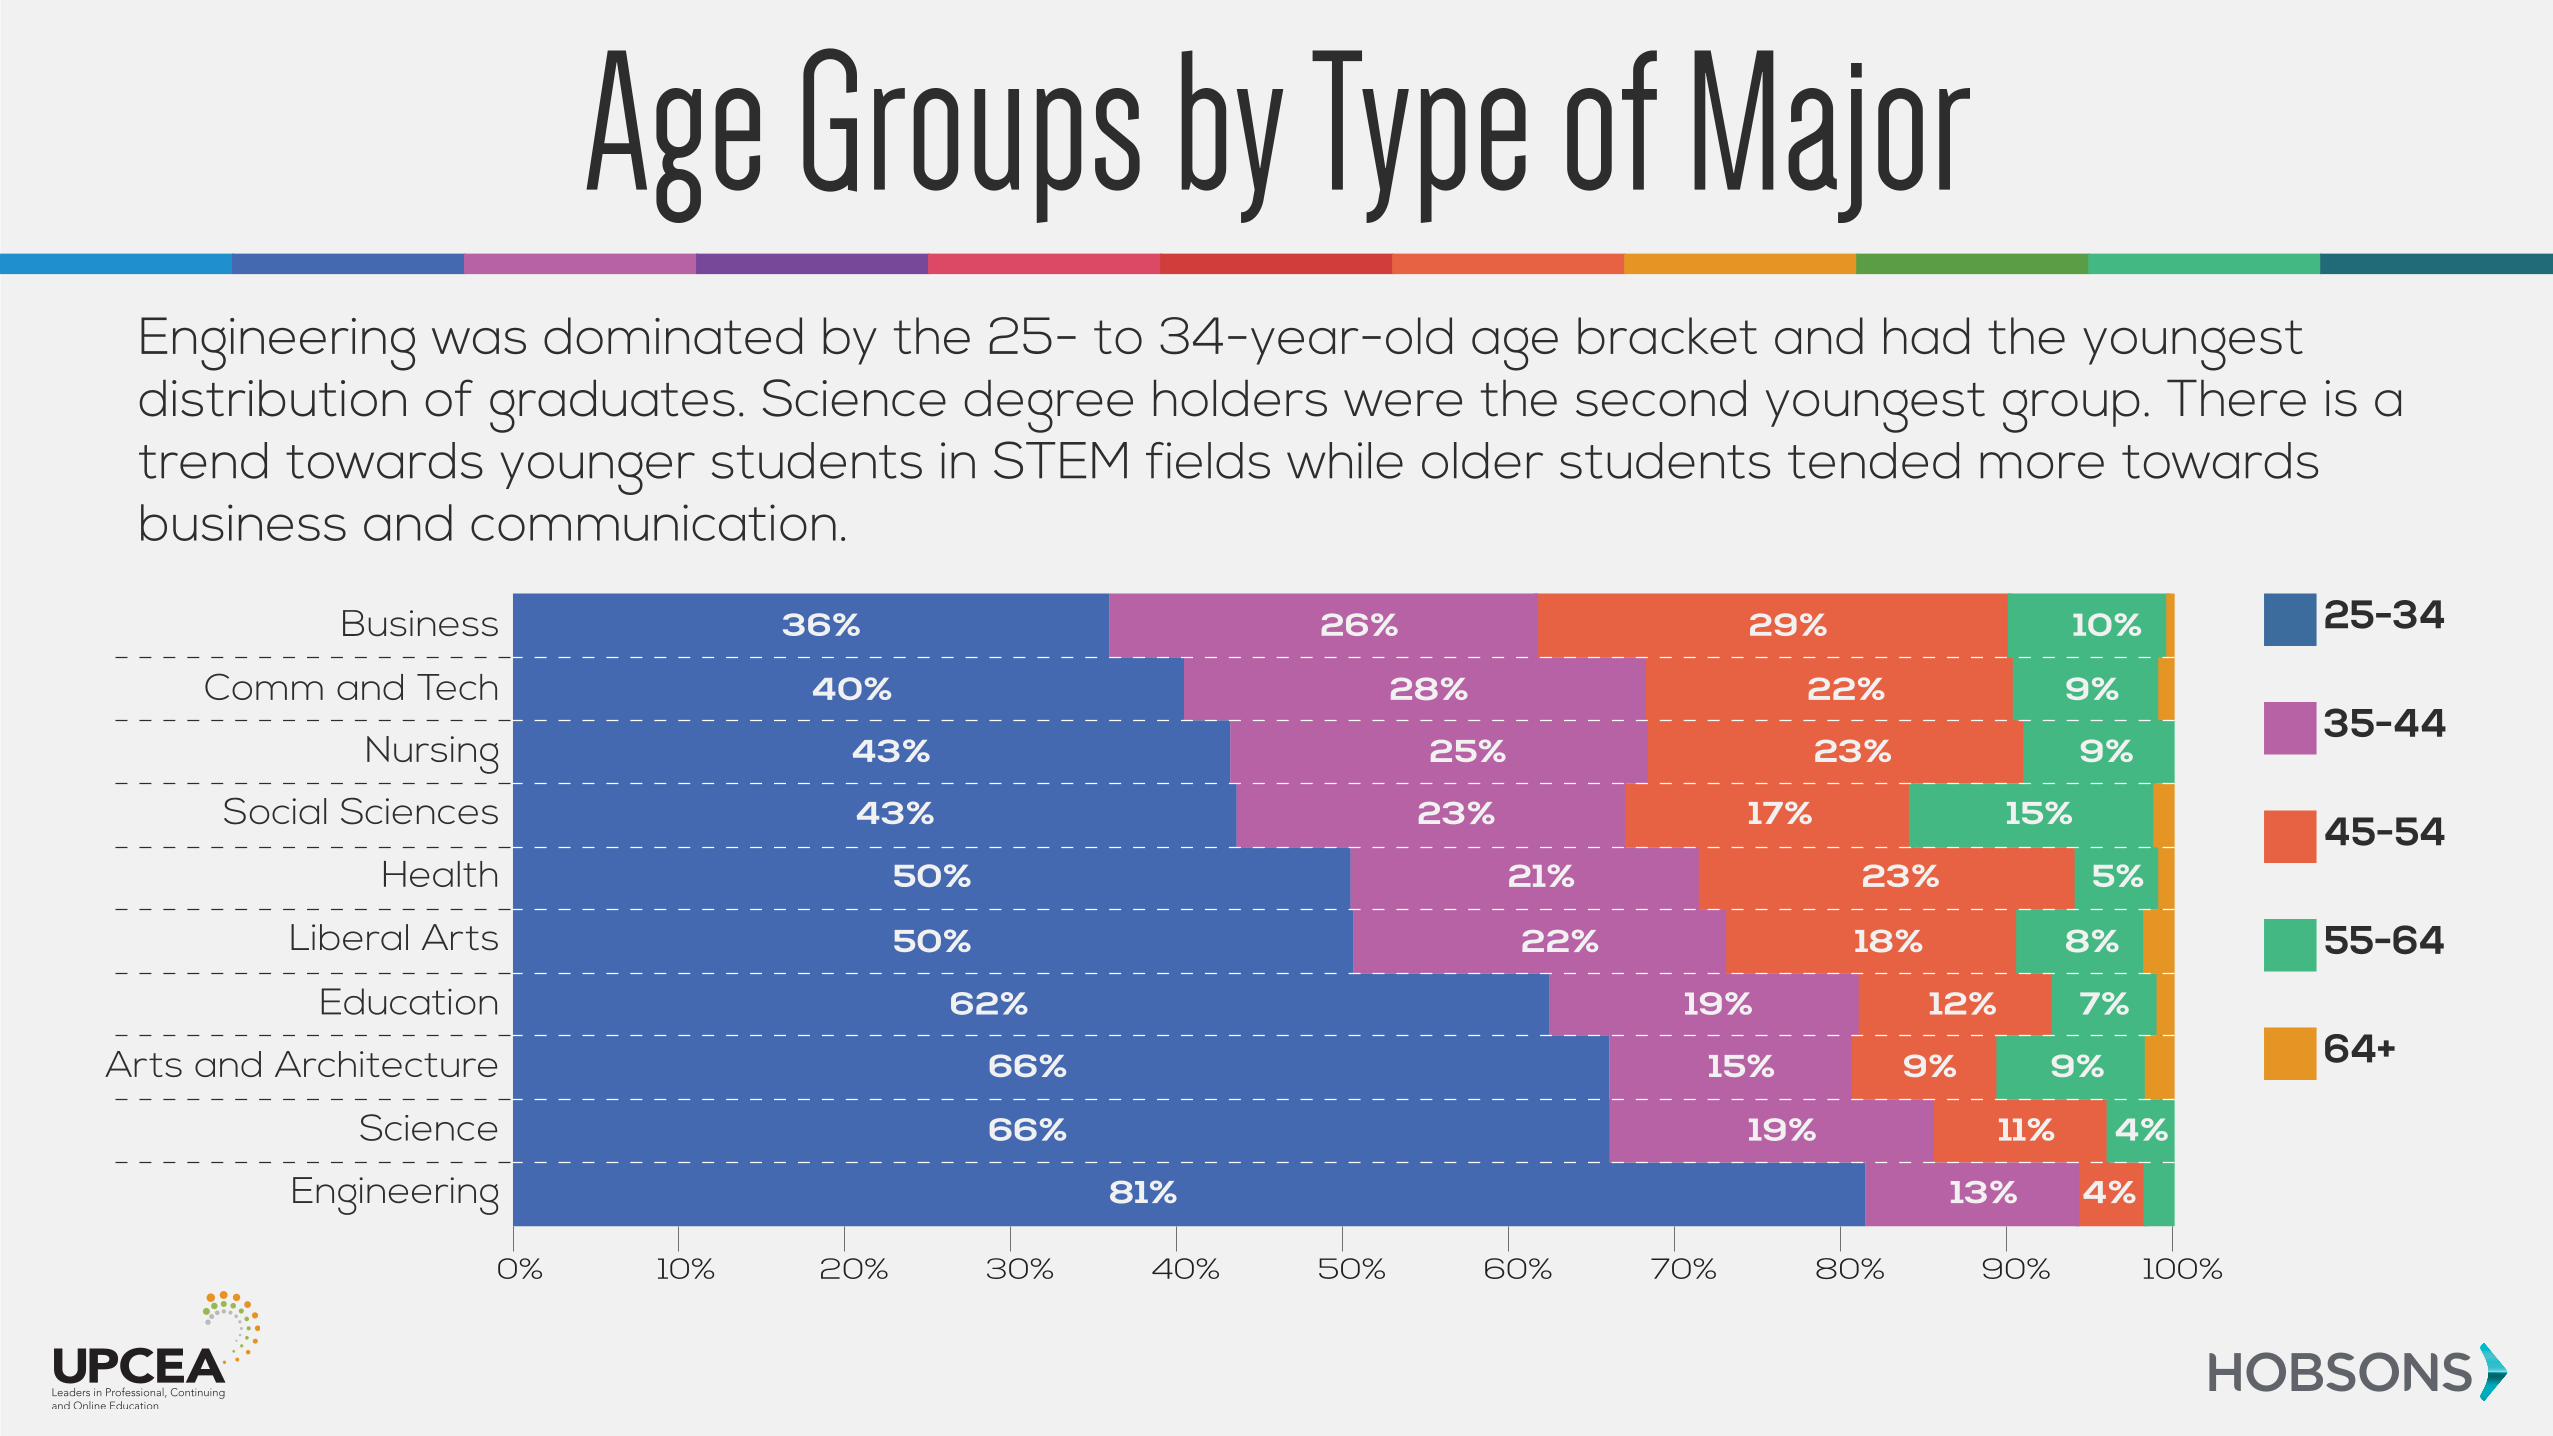
Engineering was dominated by the 25- to 34-year-old age bracket and had the youngest distribution of graduates. Science degree holders were the second youngest group. There is a trend towards younger students in STEM fields while older students tended more towards business and communication.
Age Groups by Type of Major
Business
Comm and Tech
Liberal Arts
Social Sciences
Nursing
Health
Science
Education
Arts and Architecture
Engineering
0%
36%
40%
43%
43%
50%
50%
62%
66%
66%
81%
29% 10%
22% 9%
23% 9%
17% 15%
23% 5%
18% 8%
12% 7%
9% 9%
11% 4%
4%
26%
28%
25%
23%
21%
22%
19%
15%
19%
13%
10% 20% 30% 40% 50% 60% 70% 80% 90% 100%
25-34
35-44
45-54
55-64
64+
Somewhat satisfied - 20%
Not very satisfied - 4%
Not at all satisfied - 1%
Extremely satisfied - 39%
Very satisfied - 36%
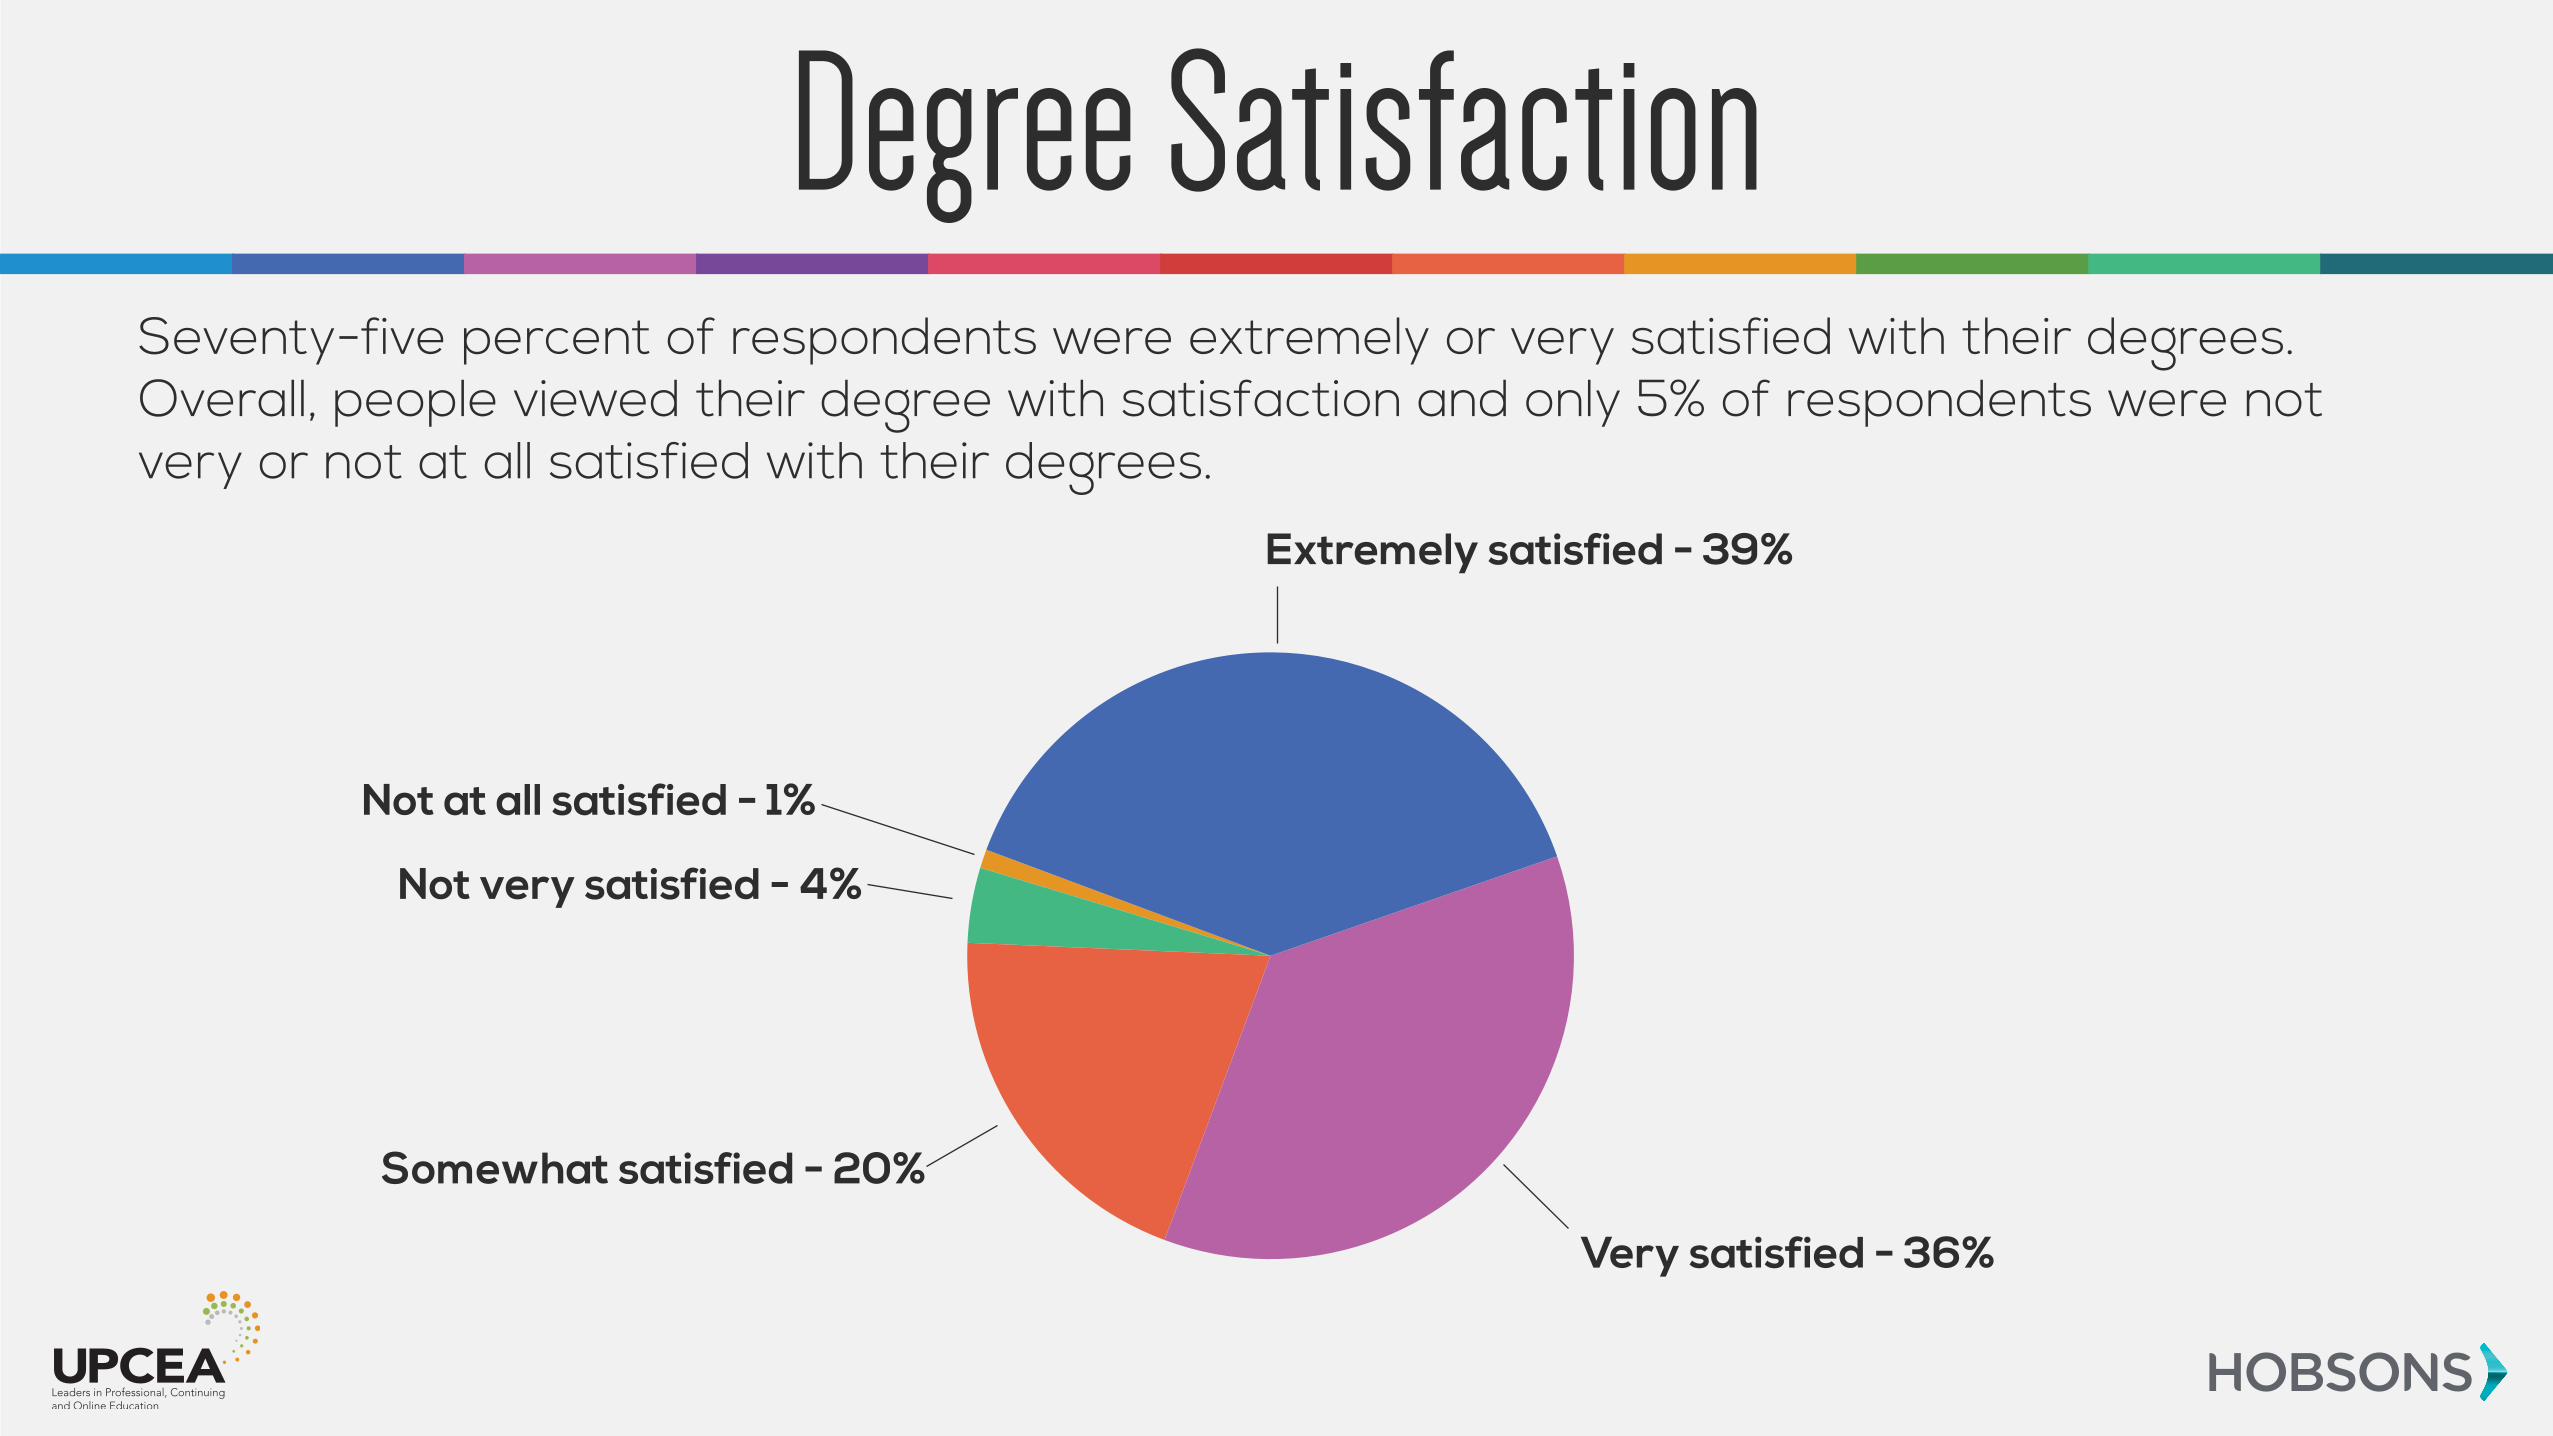
Seventy-five percent of respondents were extremely or very satisfied with their degrees. Overall, people viewed their degree with satisfaction and only 5% of respondents were not very or not at all satisfied with their degrees.
Degree Satisfaction
Nursing
Engineering
Business
Social Sciences
Comm and Tech
Health
Arts and Architecture
Education
Liberal Arts
Science
0% 10% 20% 30% 40% 50% 60% 70% 80% 90% 100%
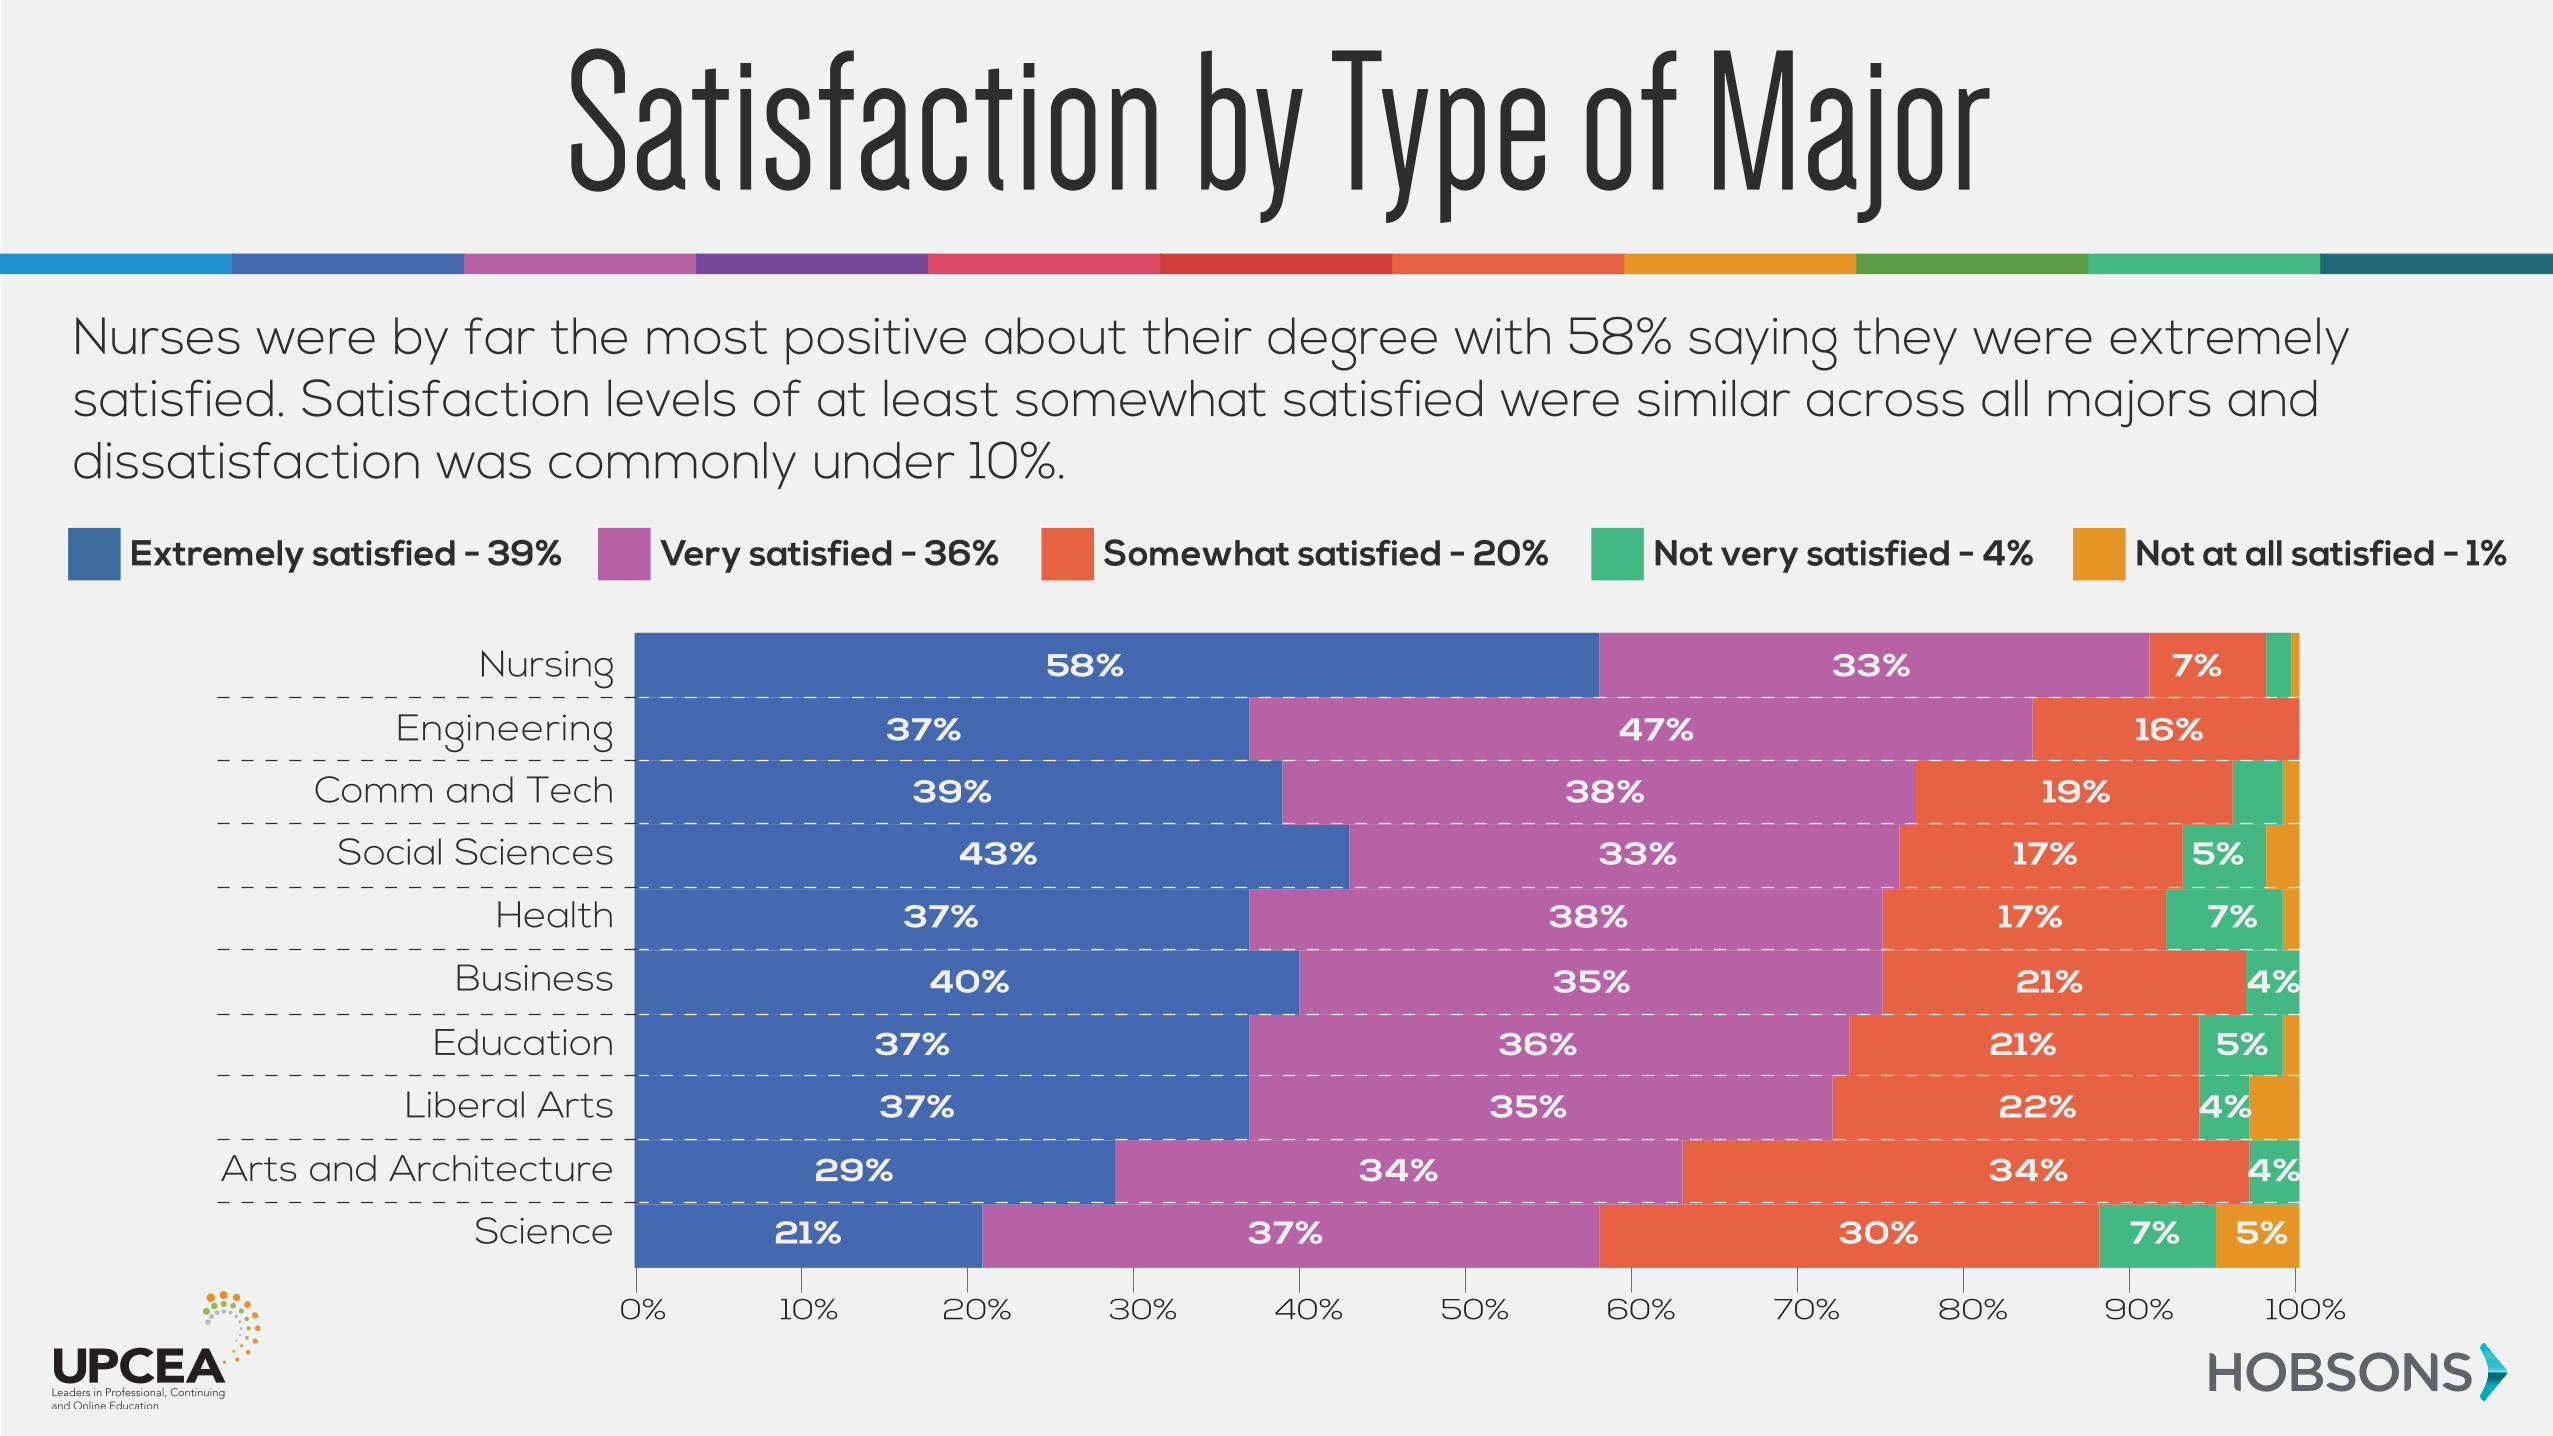
Nurses were by far the most positive about their degree with 58% saying they were extremely satisfied. Satisfaction levels of at least somewhat satisfied were similar across all majors and dissatisfaction was commonly under 10%.
Satisfaction by Type of Major
58%
37%
39%
43%
37%
40%
37%
37%
29%
21%
33% 7%
16%
19%
17% 5%
17% 7%
21% 4%
21% 5%
22% 4%
34% 4%
30% 7% 5%
47%
38%
33%
38%
35%
36%
35%
34%
37%
Extremely satisfied - 39% Very satisfied - 36% Somewhat satisfied - 20% Not very satisfied - 4% Not at all satisfied - 1%
People go to college most commonly to advance in their careers. The type of major they choose is important and results in more promotions and raises. Degrees in engineering and nursing are the most powerful in the workplace, gaining recipients the most career advancements.
Life After the Degree
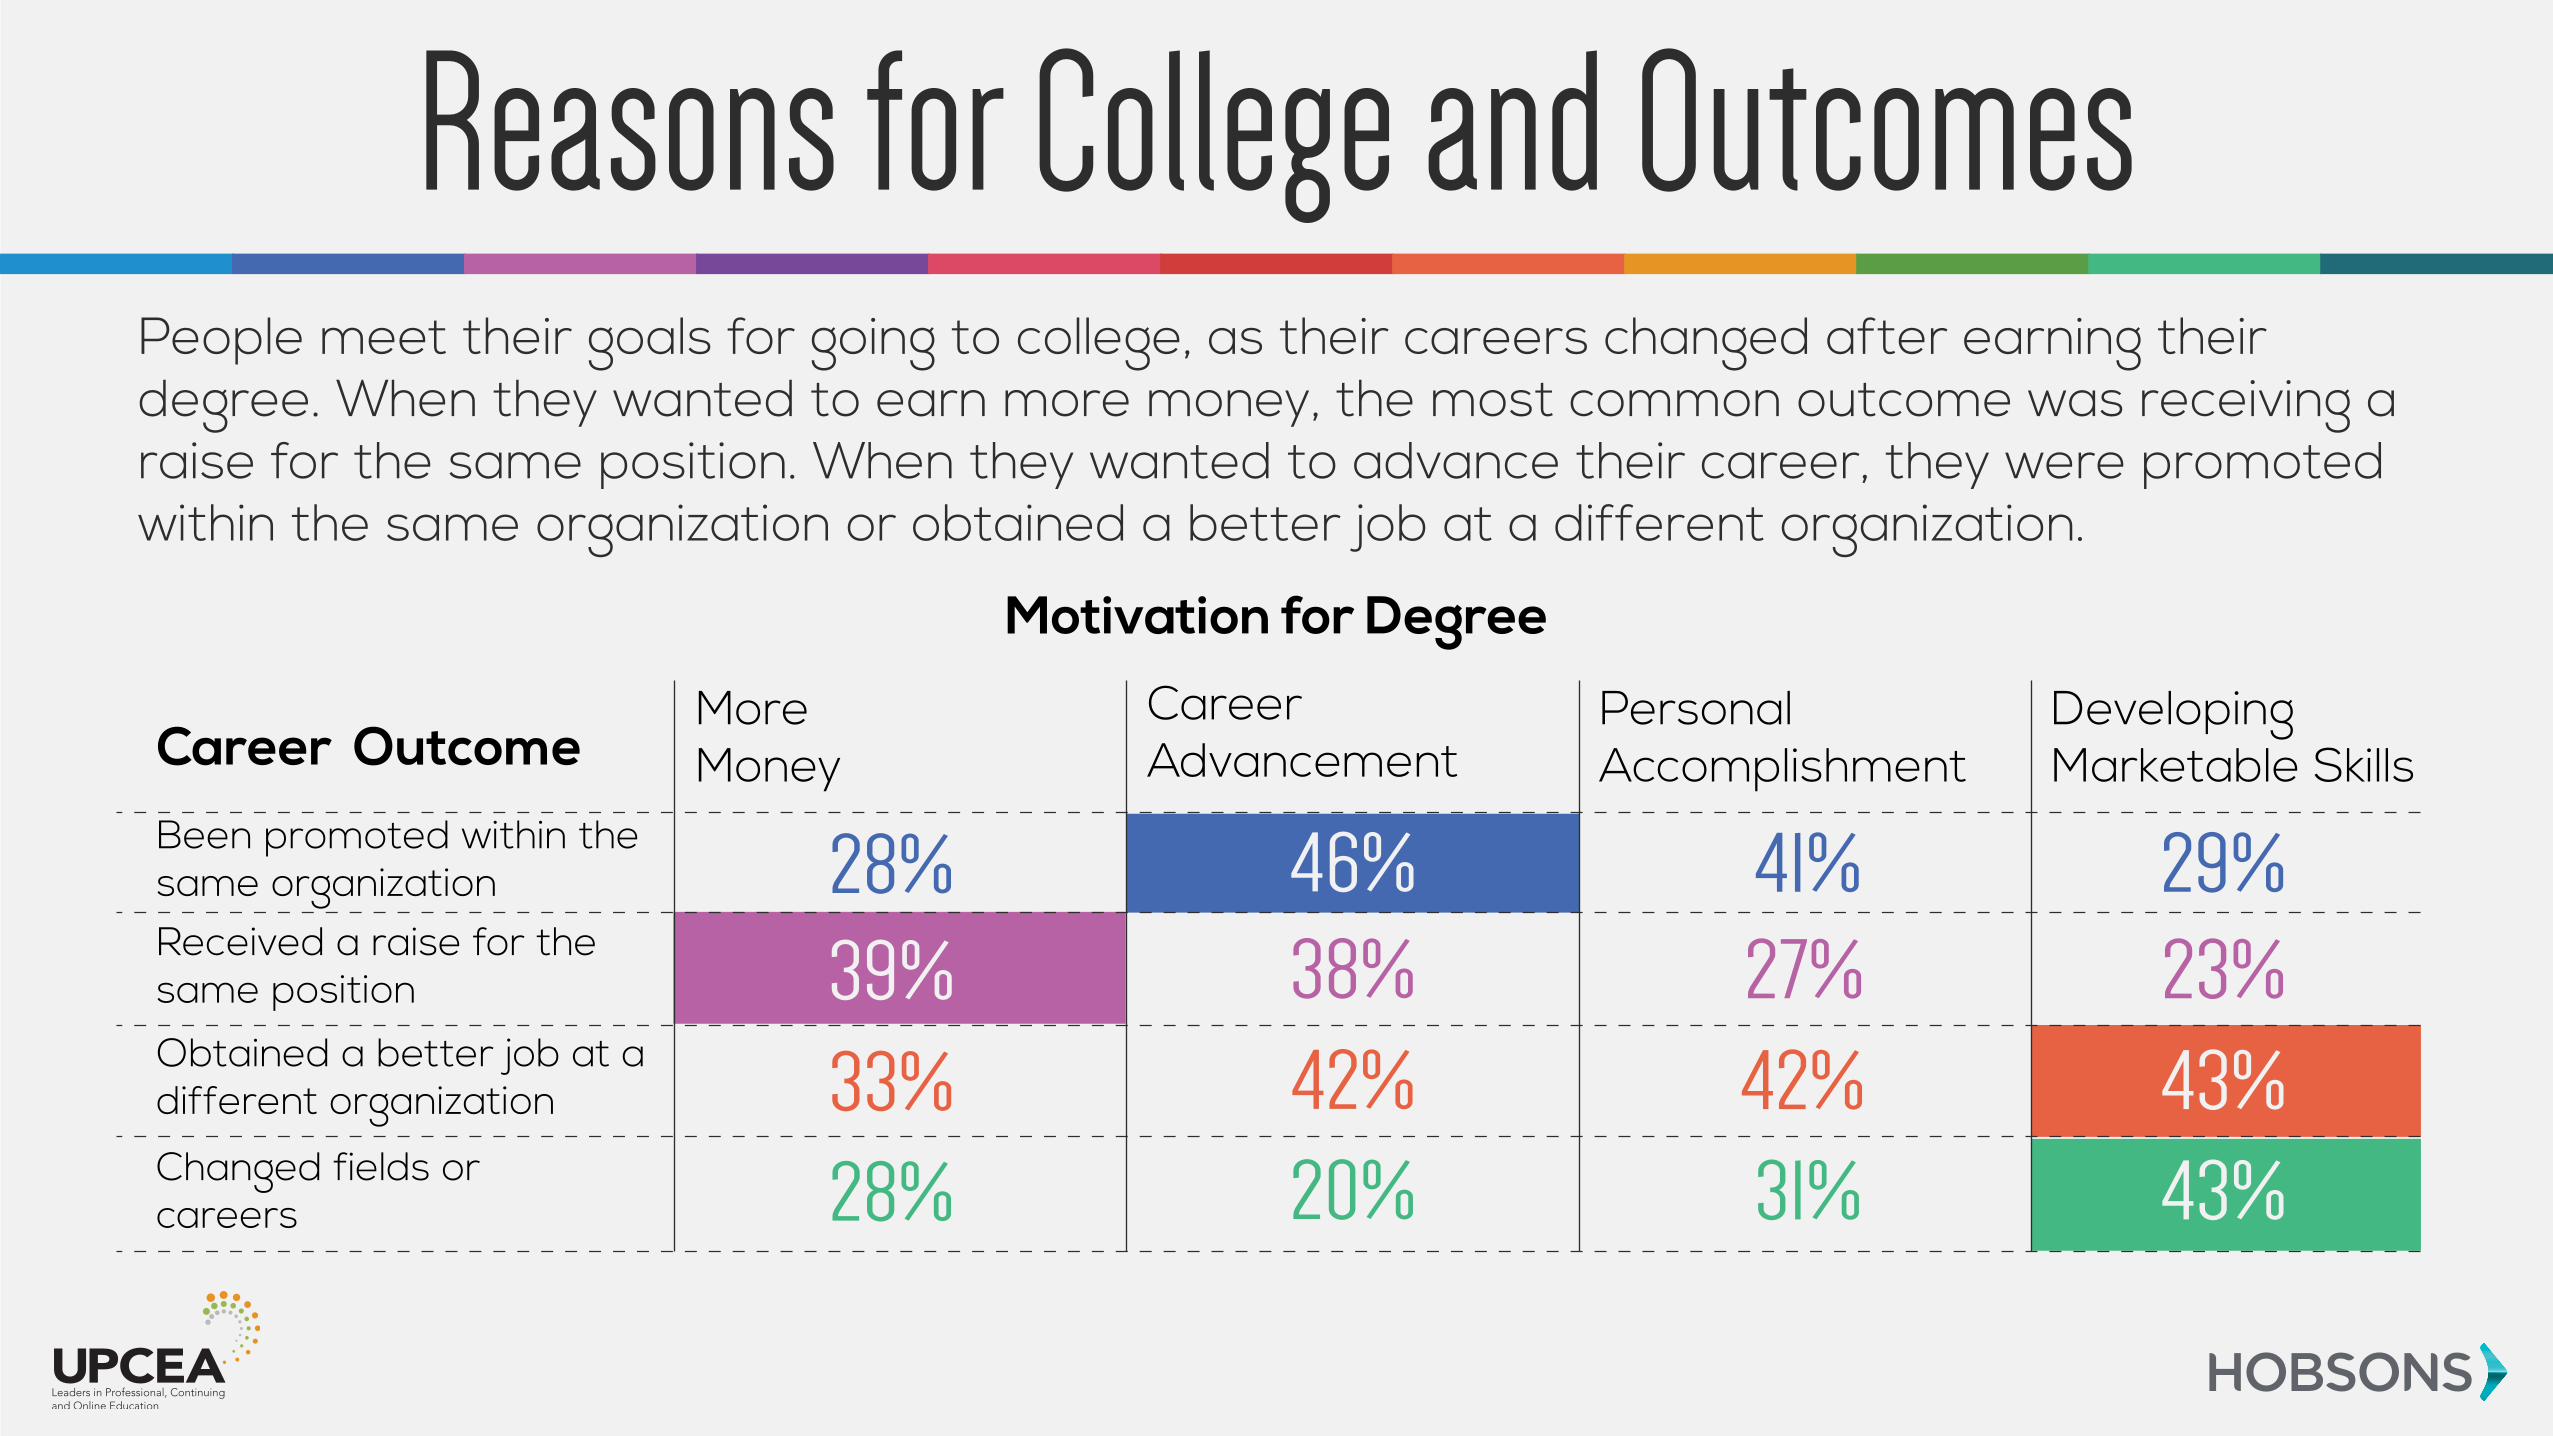
People meet their goals for going to college, as their careers changed after earning their degree. When they wanted to earn more money, the most common outcome was receiving a raise for the same position. When they wanted to advance their career, they were promoted within the same organization or obtained a better job at a different organization.
Reasons for College and Outcomes
Career OutcomeMore Money
Been promoted within the same organizationReceived a raise for the same position
Obtained a better job at a different organization
Changed fields orcareers
Career Advancement
Personal Accomplishment
Developing Marketable Skills
Motivation for Degree
28%39%
33% 42% 42% 43%
28% 20% 31% 43%
46% 41% 29%38% 27% 23%
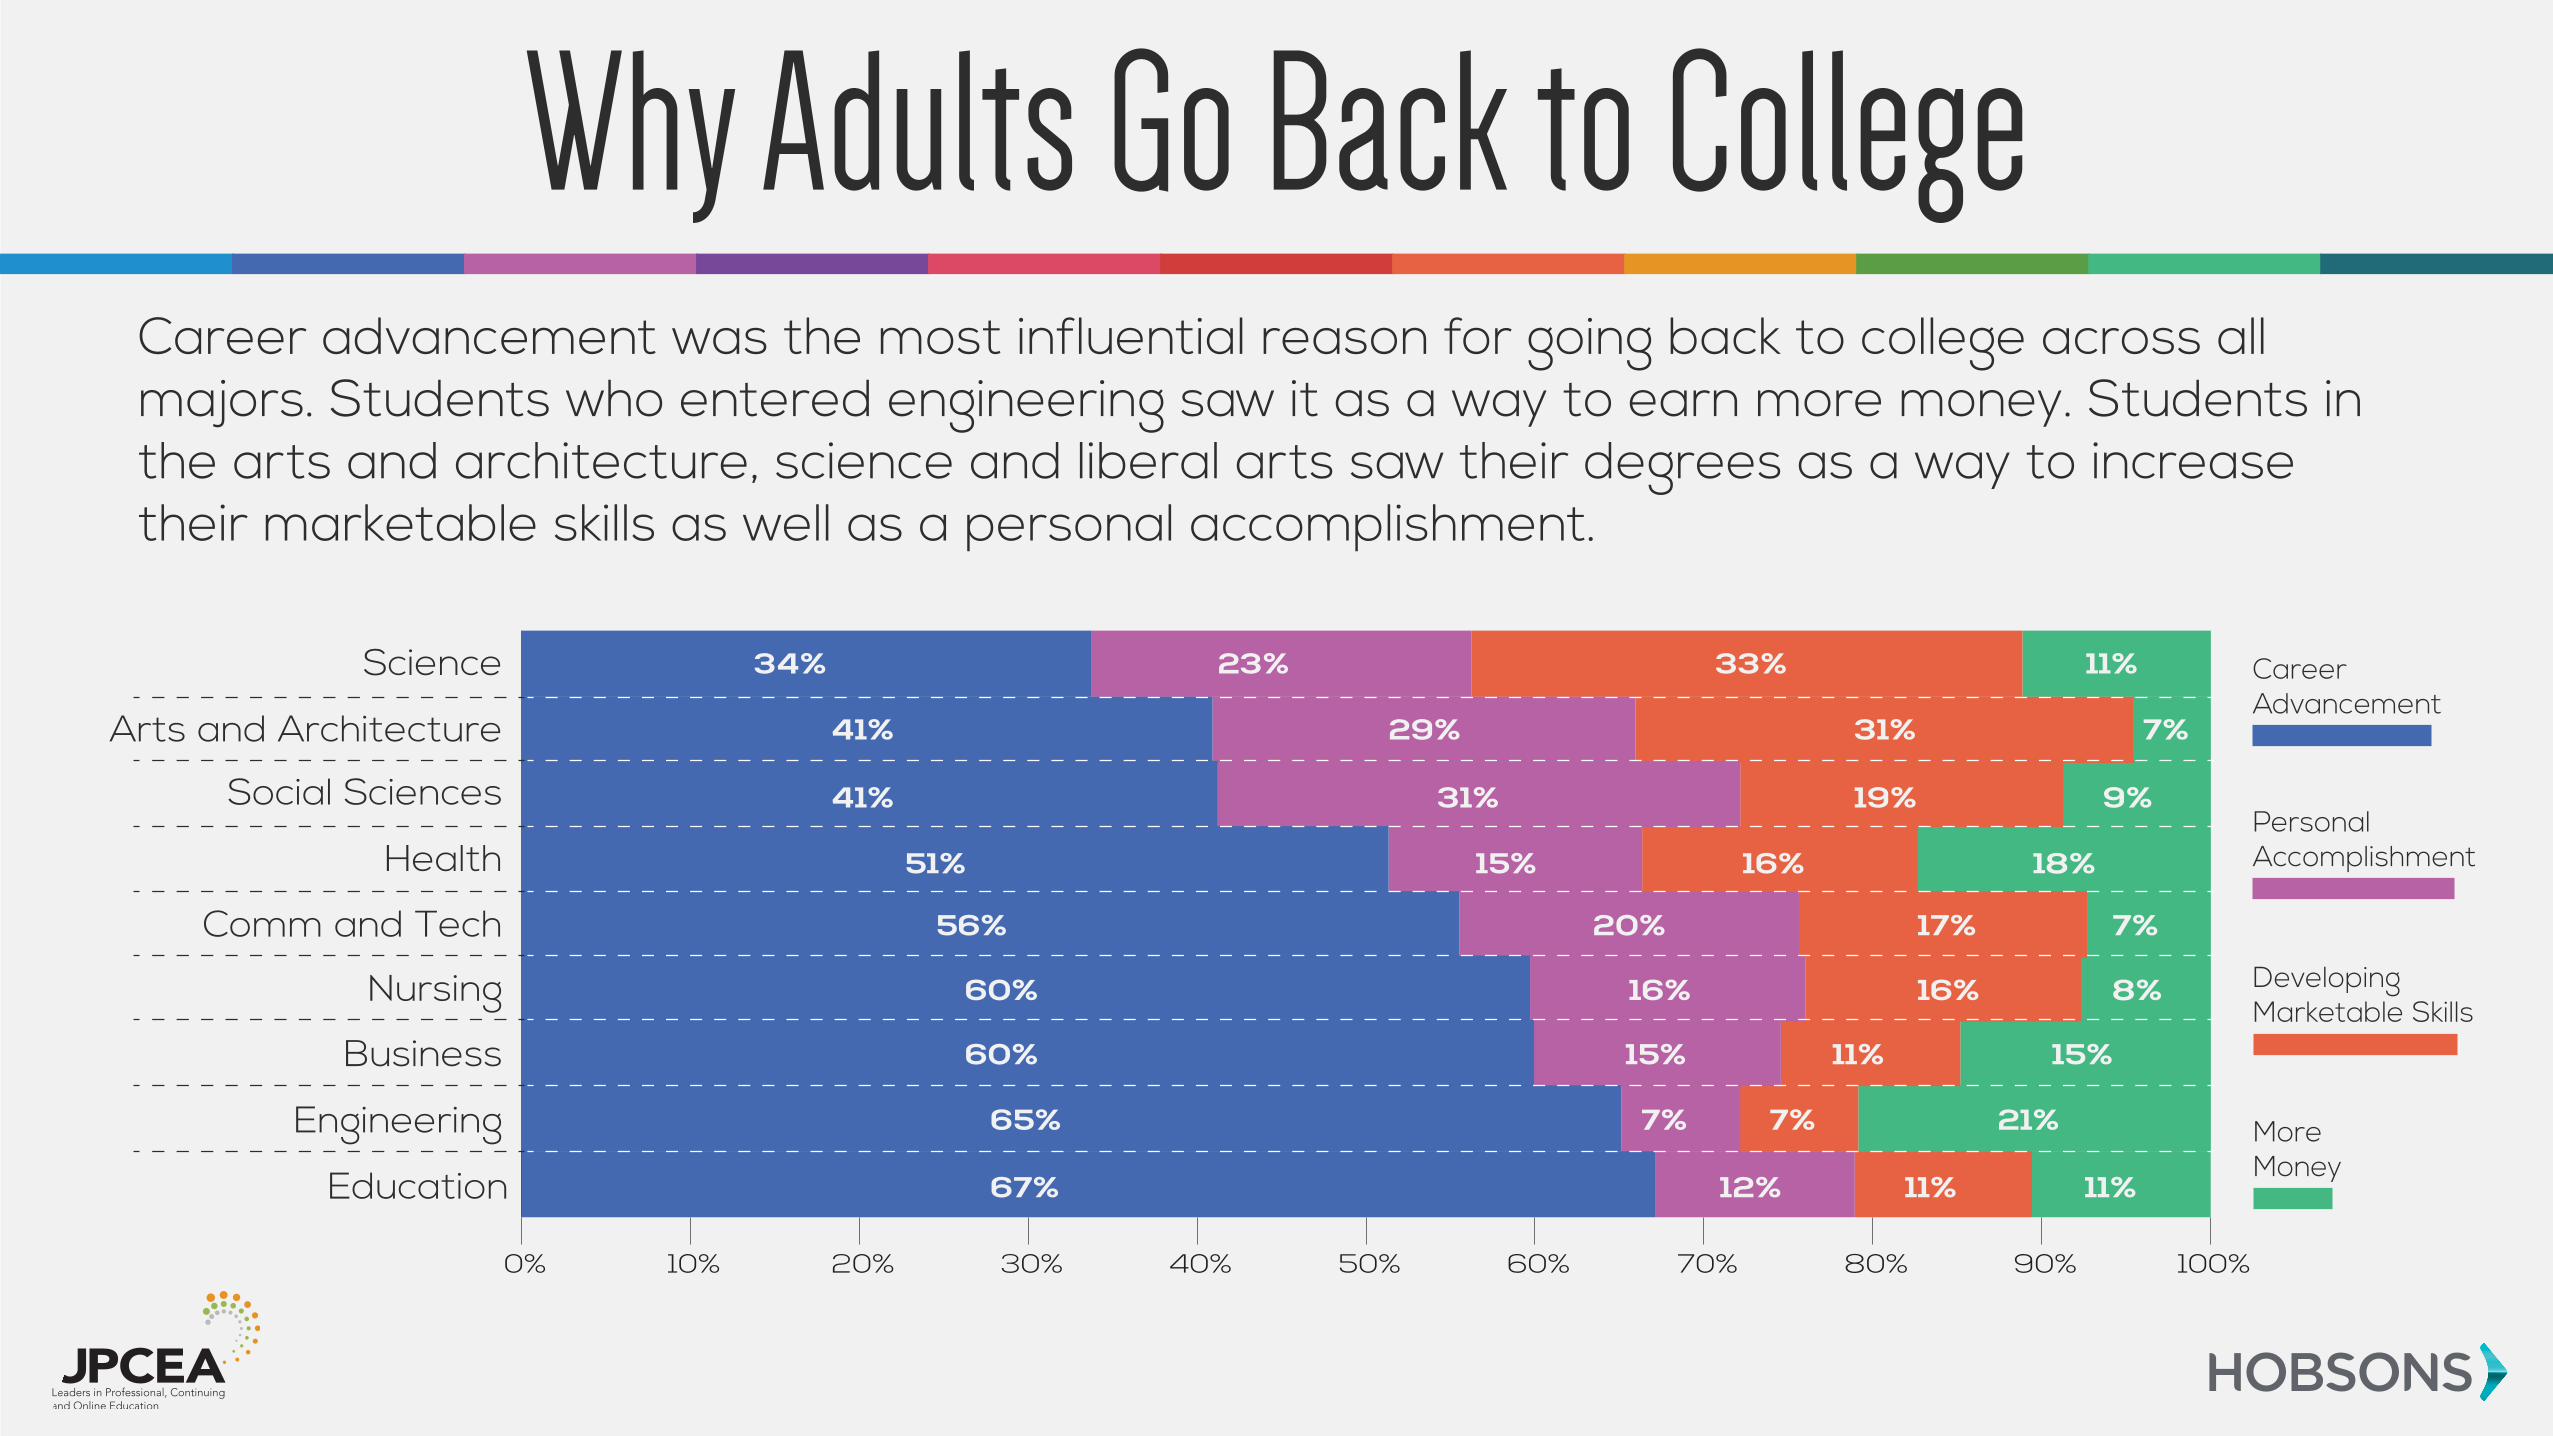
Career advancement was the most influential reason for going back to college across all majors. Students who entered engineering saw it as a way to earn more money. Students in the arts and architecture, science and liberal arts saw their degrees as a way to increase their marketable skills as well as a personal accomplishment.
Why Adults Go Back to College
Business
Comm and Tech
Social Sciences
Nursing
Health
Science
Education
Arts and Architecture
Engineering
0% 10% 20% 30% 40% 50% 60% 70% 80% 90% 100%
34% 33% 11%23%
41% 31% 7%29%
41% 19% 9%31%
51% 16% 18%15%
56% 17% 7%20%
60% 16% 8%16%
60% 11% 15%15%
65% 7% 21%7%
67% 11% 11%12%
Career Advancement
Personal Accomplishment
Developing Marketable Skills
MoreMoney
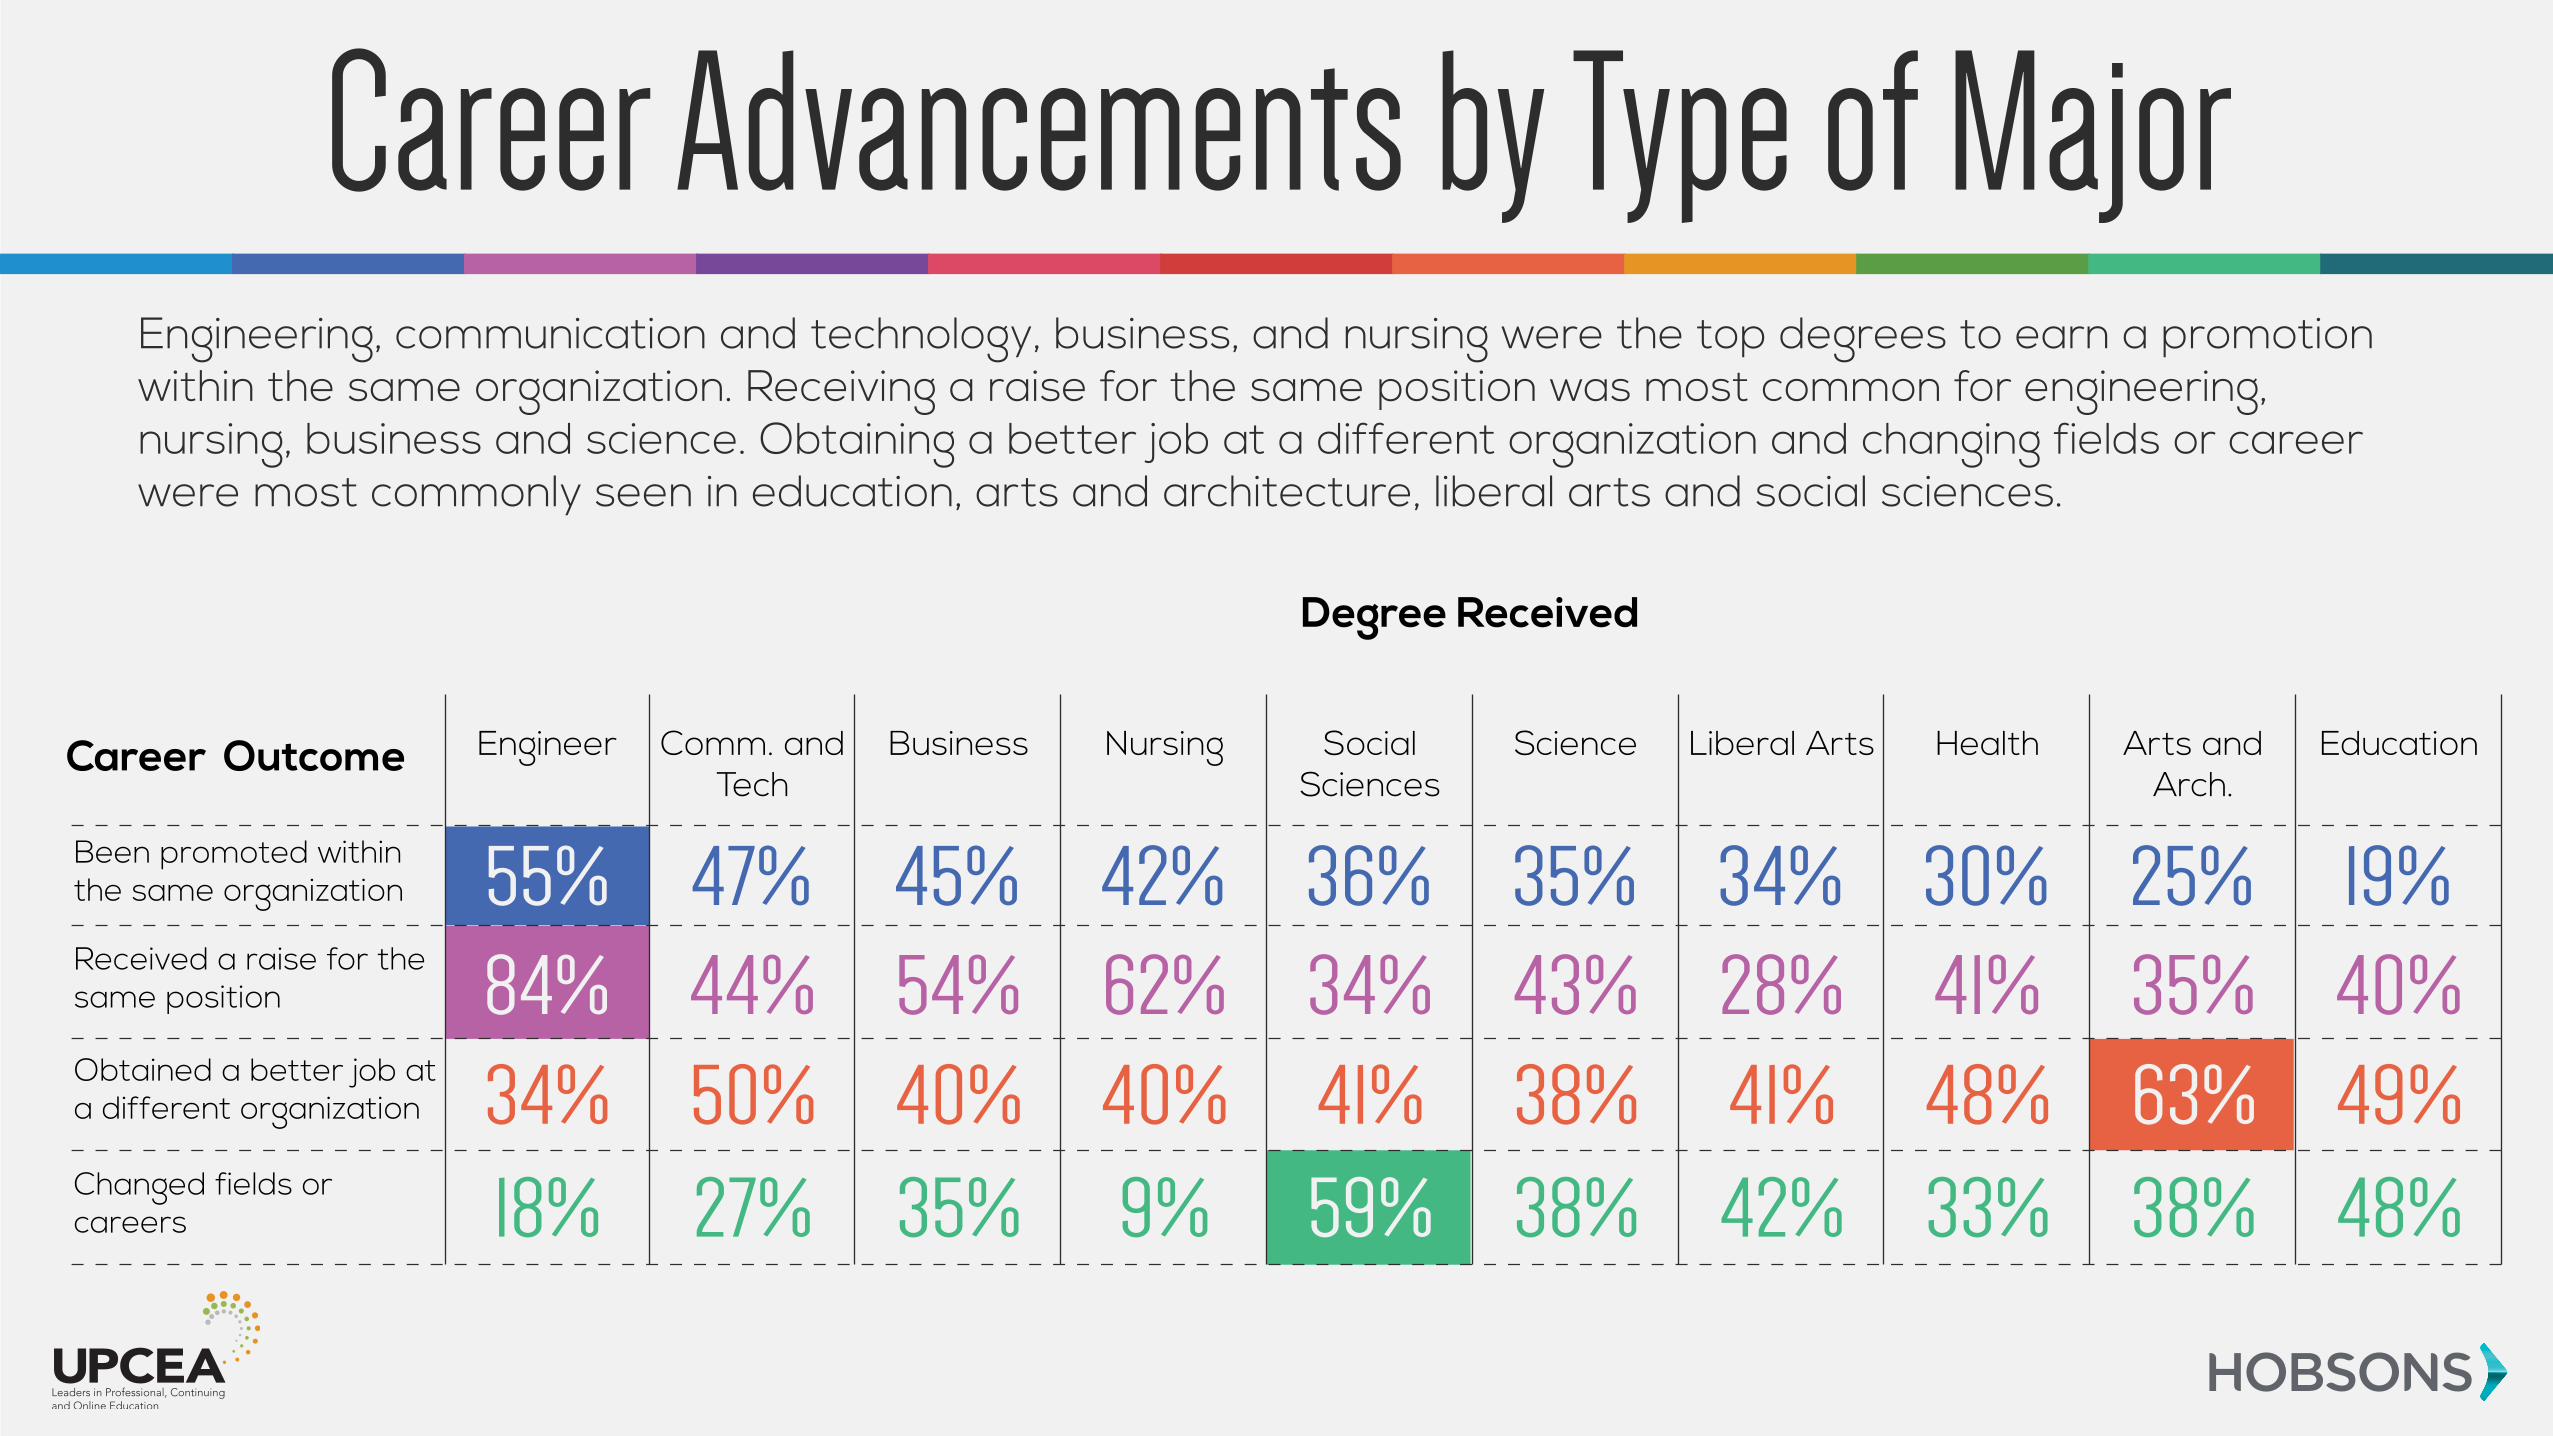
Engineering, communication and technology, business, and nursing were the top degrees to earn a promotion within the same organization. Receiving a raise for the same position was most common for engineering, nursing, business and science. Obtaining a better job at a different organization and changing fields or career were most commonly seen in education, arts and architecture, liberal arts and social sciences.
Career Advancements by Type of Major
Career Outcome
Degree Received
Engineer
Been promoted within the same organization
Received a raise for the same position
Obtained a better job at a different organization
Changed fields orcareers
55%84%
34%
18%
Comm. and Tech
47%44%
50%
27%
Business
45%54%
40%
35%
Nursing
42%62%
40%
9%
Social Sciences
36%34%
41%
59%
Science
35%43%
38%
38%
Liberal Arts
34%28%
41%
42%
Health
30%41%
48%
33%
Arts and Arch.
25%35%
63%
38%
Education
19%40%
49%
48%
Been promoted within the same organization
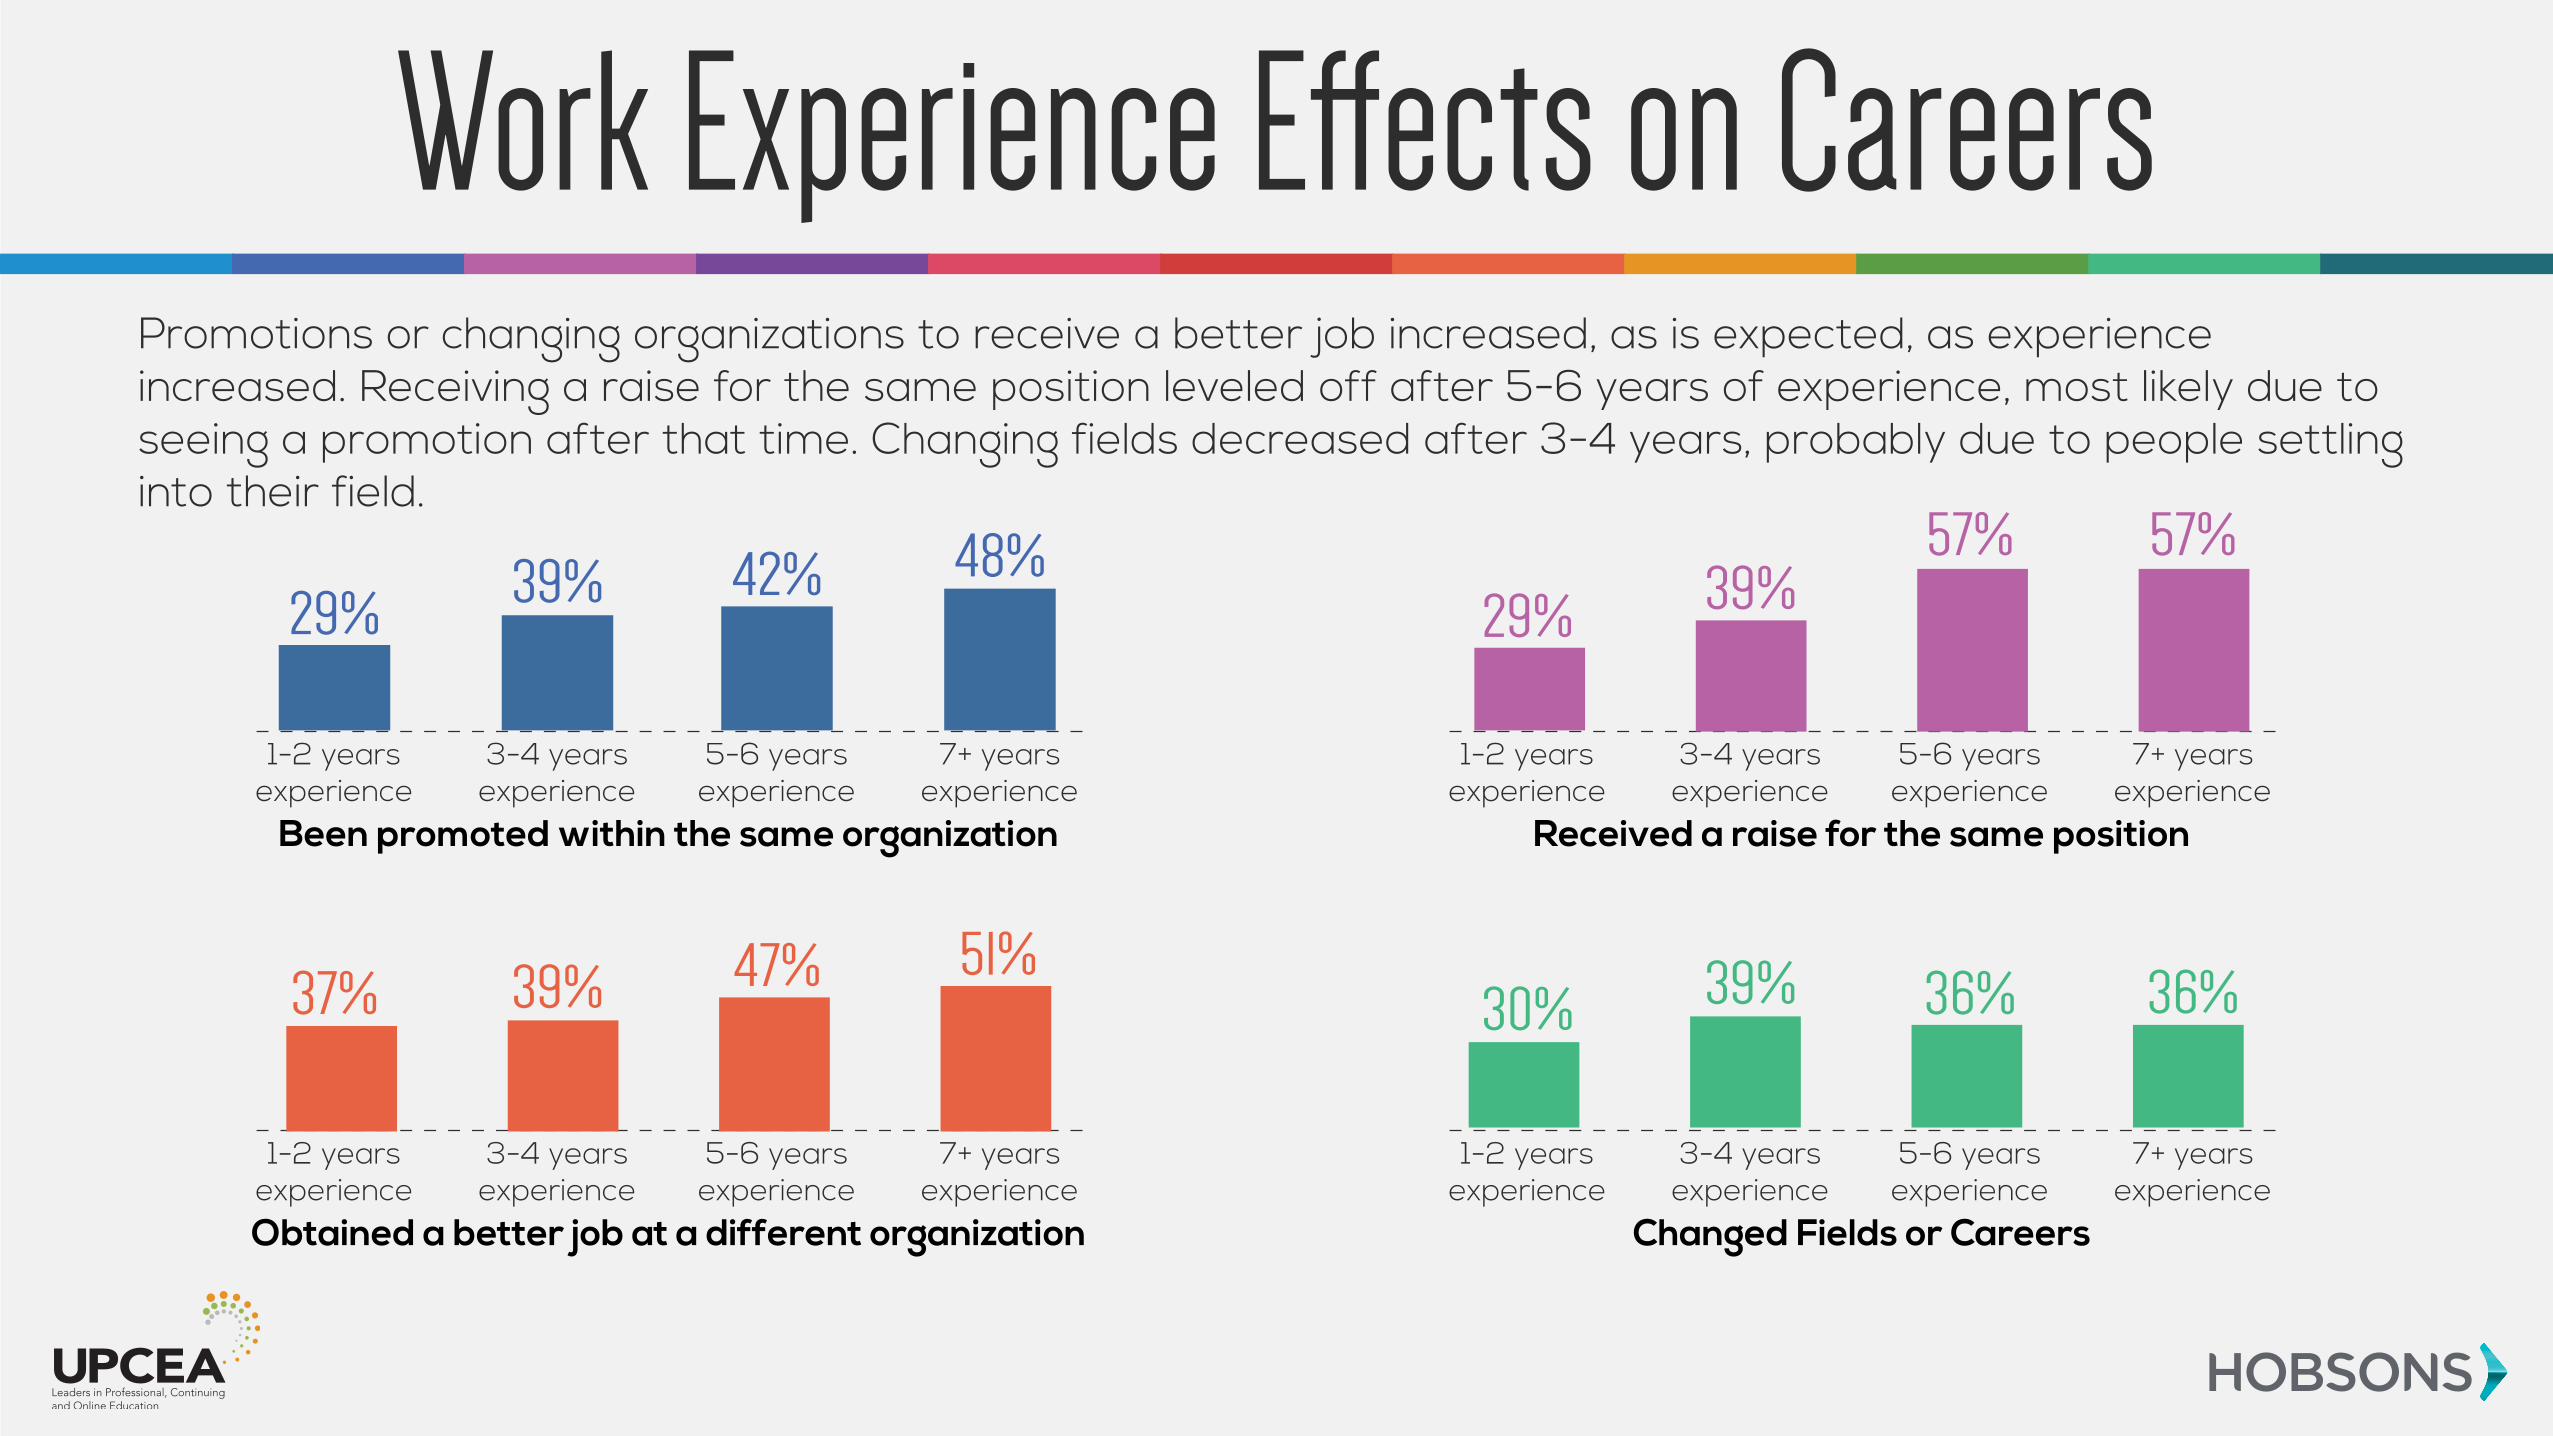
29%39% 42% 48%
Promotions or changing organizations to receive a better job increased, as is expected, as experience increased. Receiving a raise for the same position leveled off after 5-6 years of experience, most likely due to seeing a promotion after that time. Changing fields decreased after 3-4 years, probably due to people settling into their field.
Work Experience E�ects on Careers
1-2 years experience
3-4 years experience
5-6 years experience
7+ years experience
Obtained a better job at a different organization
37% 39% 47% 51%
1-2 years experience
3-4 years experience
5-6 years experience
7+ years experience
Received a raise for the same position
29% 39%57% 57%
1-2 years experience
3-4 years experience
5-6 years experience
7+ years experience
Changed Fields or Careers
30% 39% 36% 36%
1-2 years experience
3-4 years experience
5-6 years experience
7+ years experience
0%
100%
Been promoted within the same organization
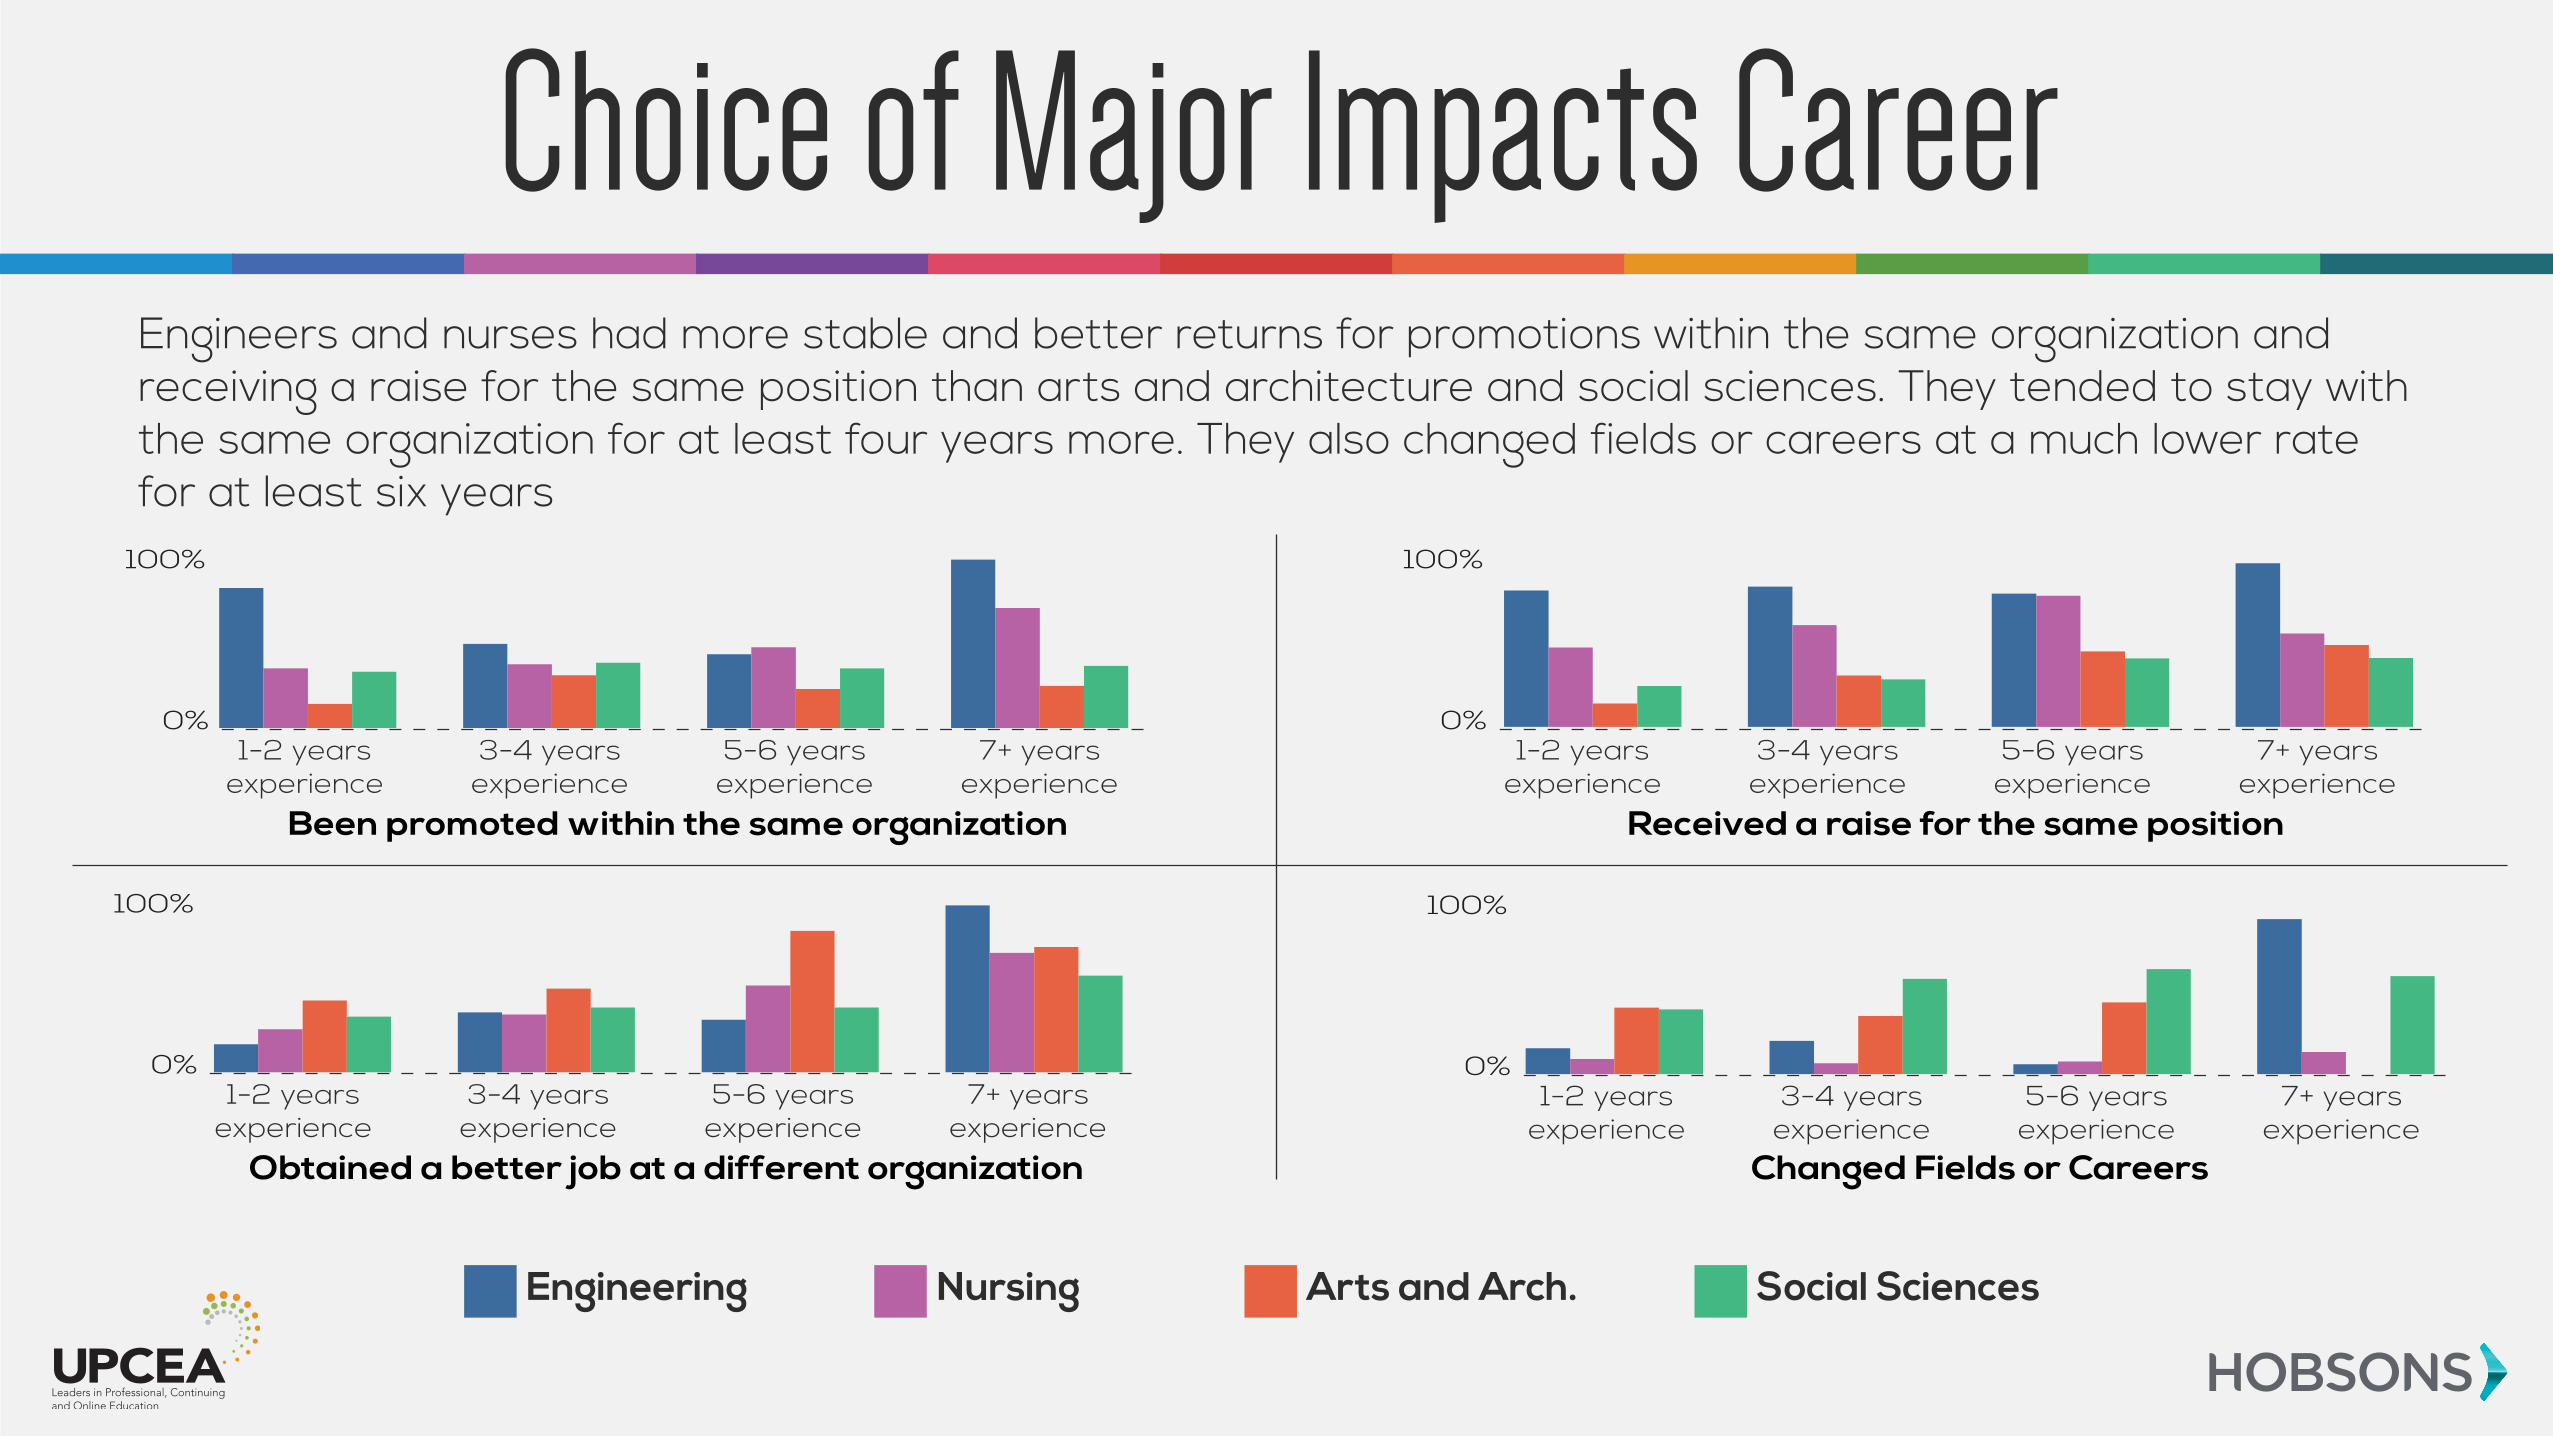
Engineers and nurses had more stable and better returns for promotions within the same organization and receiving a raise for the same position than arts and architecture and social sciences. They tended to stay with the same organization for at least four years more. They also changed fields or careers at a much lower rate for at least six years
Engineering
Choice of Major Impacts Career
1-2 years experience
3-4 years experience
5-6 years experience
7+ years experience
0%
100%
Received a raise for the same position
1-2 years experience
3-4 years experience
5-6 years experience
7+ years experience
0%
100%
Obtained a better job at a different organization
1-2 years experience
3-4 years experience
5-6 years experience
7+ years experience
0%
100%
Changed Fields or Careers
1-2 years experience
3-4 years experience
5-6 years experience
7+ years experience
Nursing Arts and Arch. Social Sciences
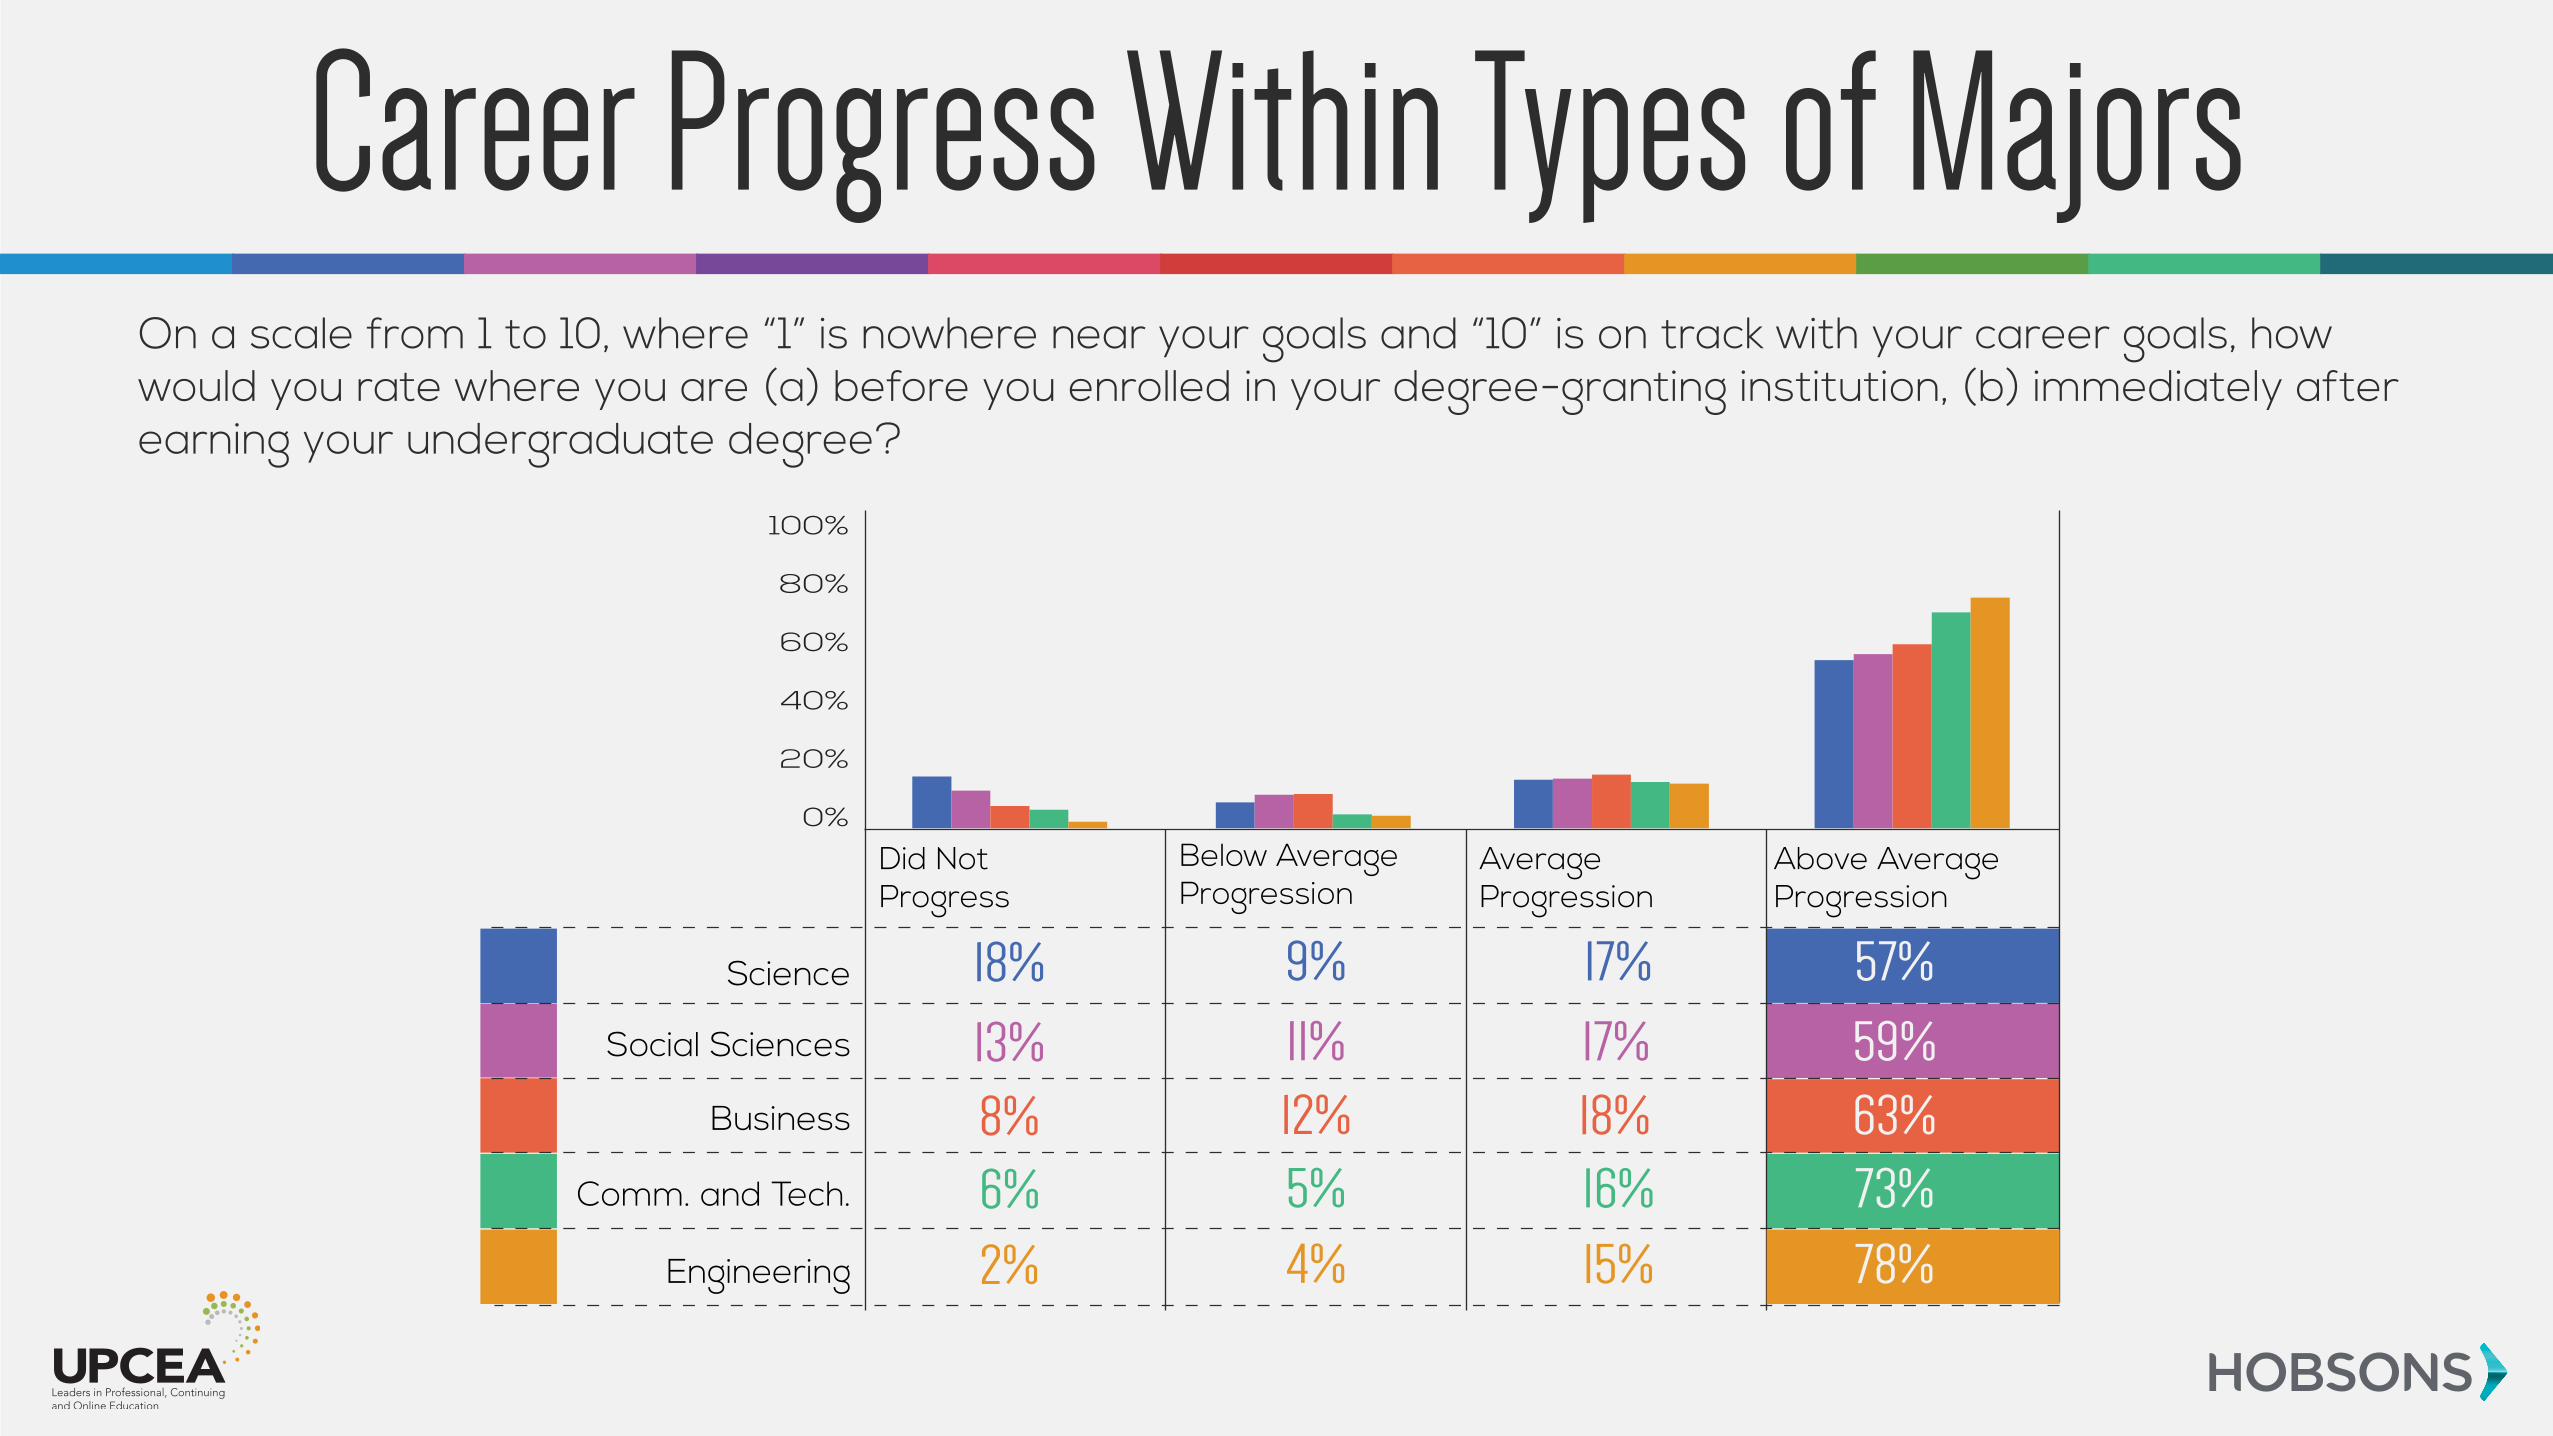
On a scale from 1 to 10, where “1” is nowhere near your goals and “10” is on track with your career goals, how would you rate where you are (a) before you enrolled in your degree-granting institution, (b) immediately after earning your undergraduate degree?
Career Progress Within Types of Majors
Did Not Progress
Science
Social Sciences
Business
Comm. and Tech.
Engineering
Below Average Progression
Average Progression
Above Average Progression
18%
13%
8% 12% 18% 63%
6% 5% 16% 73%
2% 4% 15% 78%
9% 17% 57%
11% 17% 59%
0%
100%
80%
60%
40%
20%
0%
100%
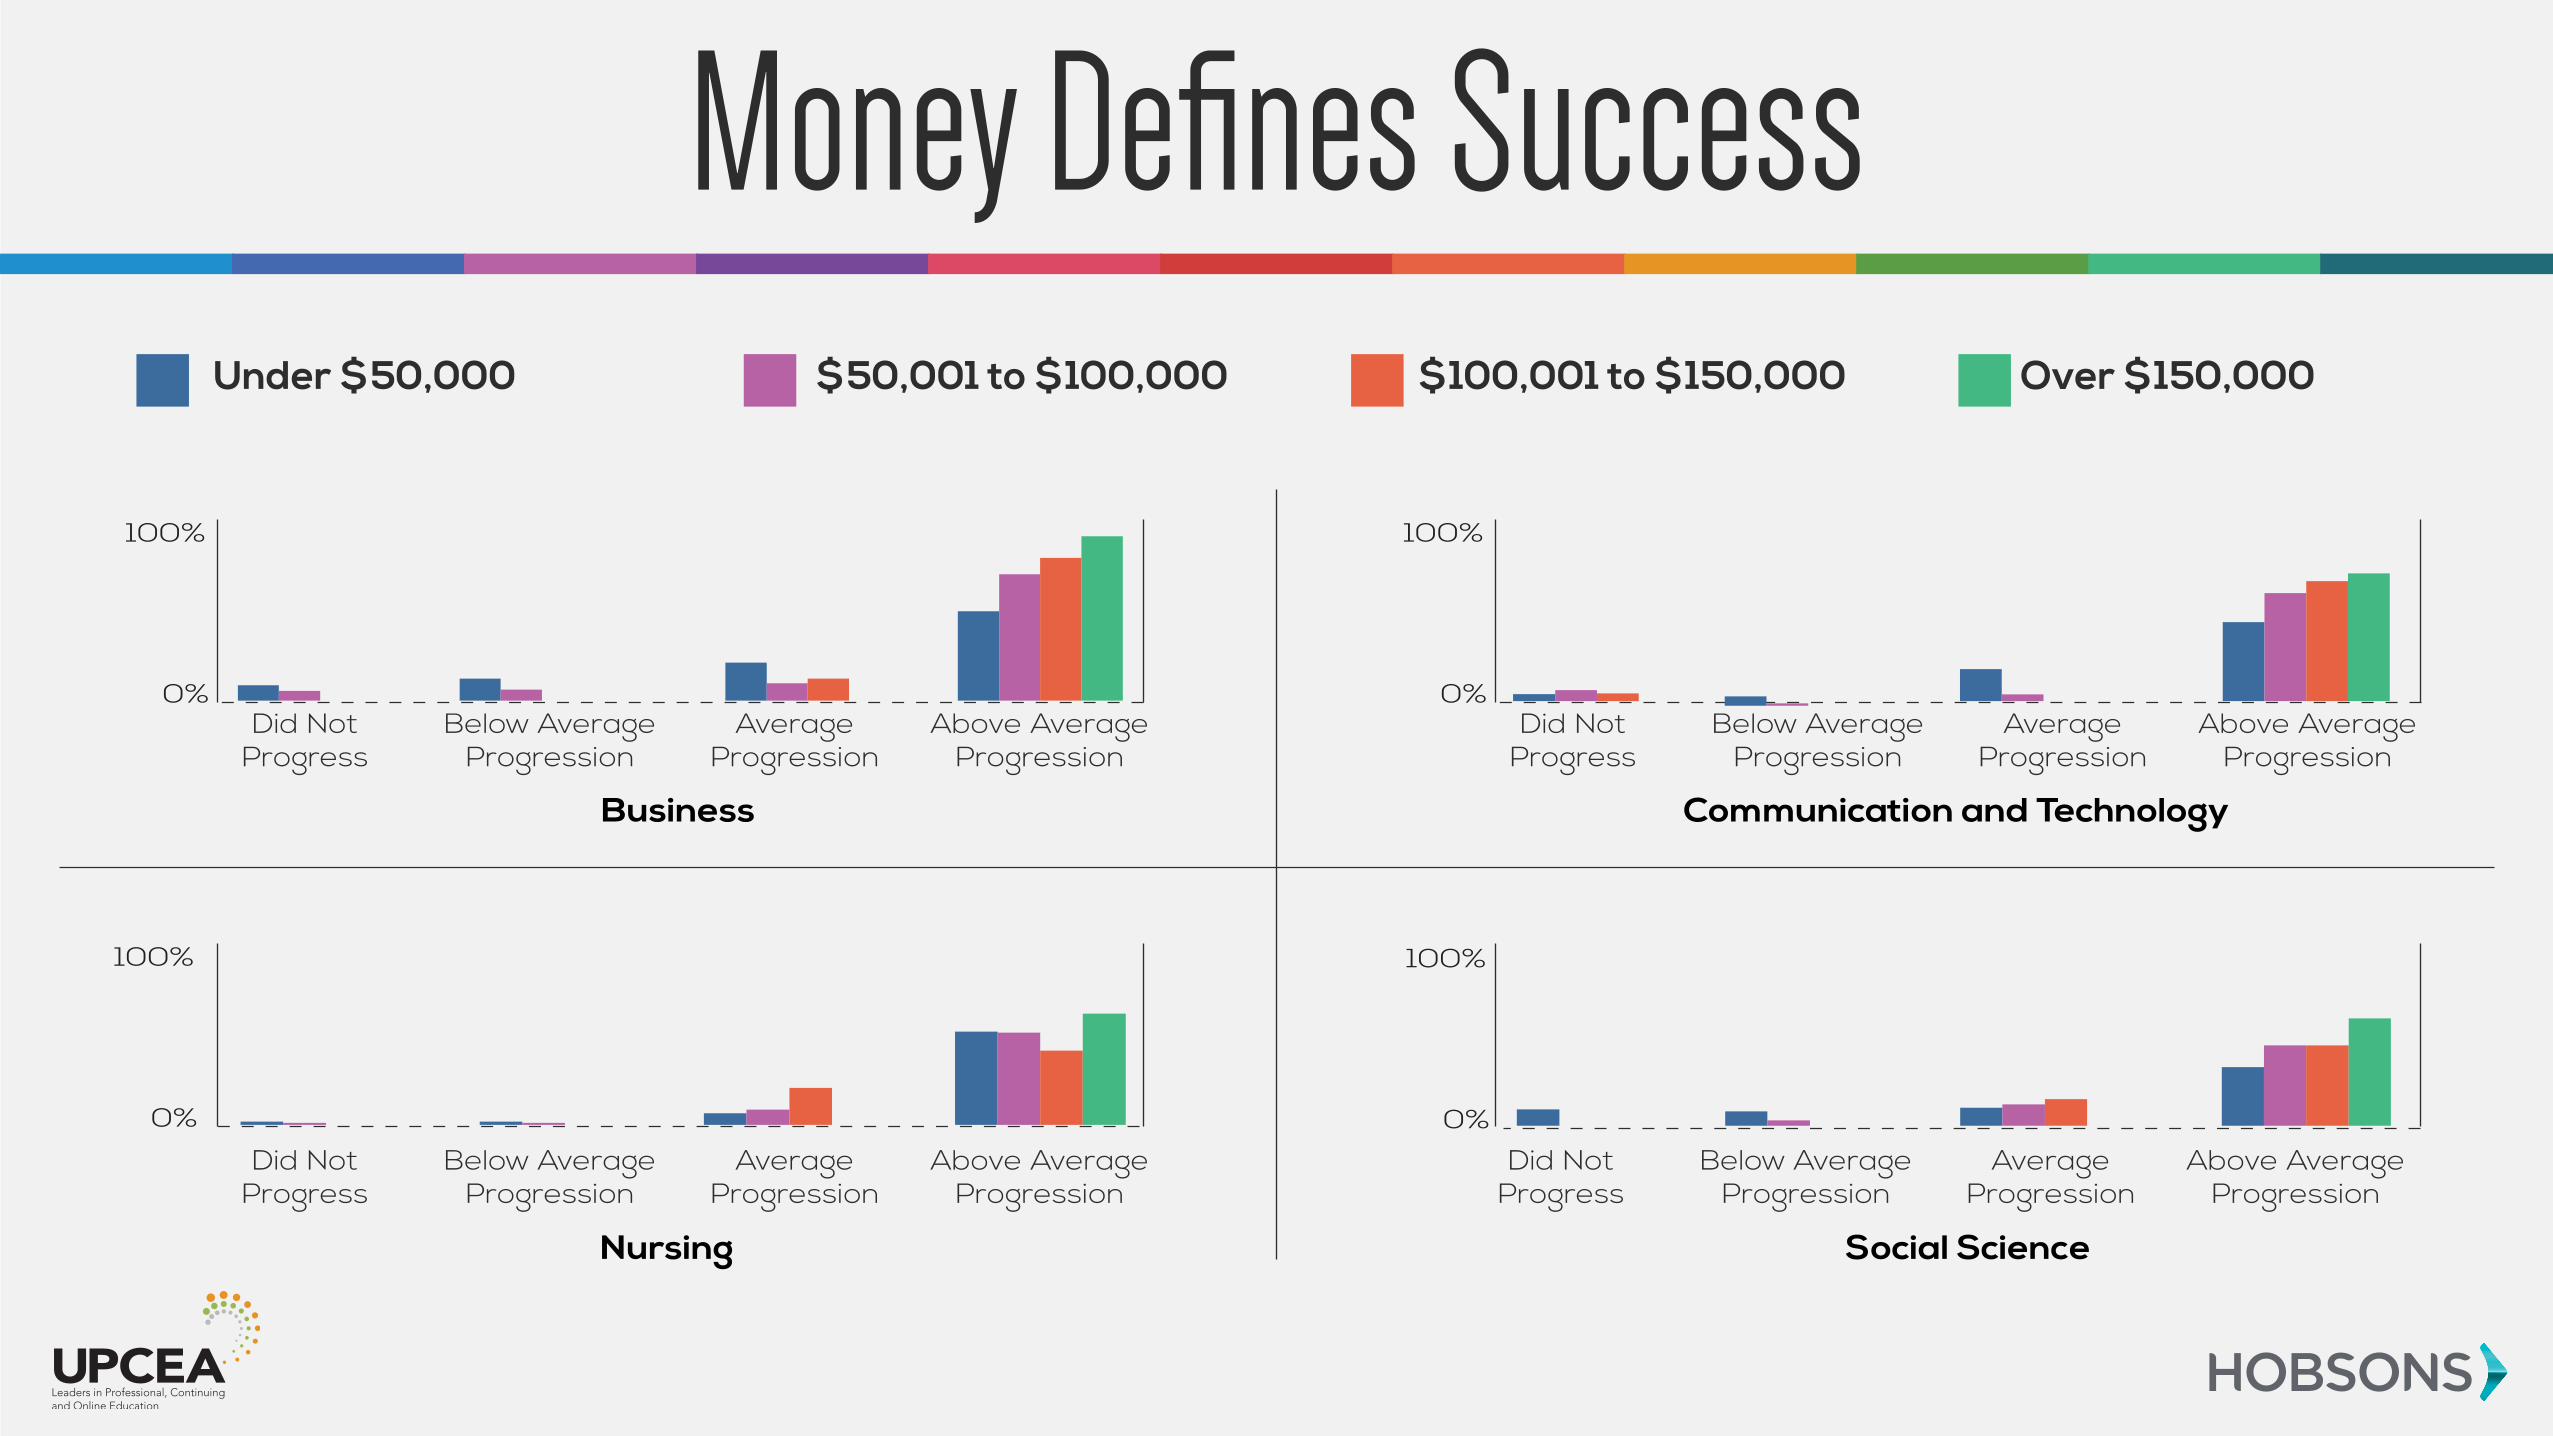
Business
Under $50,000
Money Defines Success
Did Not Progress
Below Average Progression
Average Progression
Above Average Progression
Did Not Progress
Below Average Progression
Average Progression
Above Average Progression
Did Not Progress
Below Average Progression
Average Progression
Above Average Progression
Did Not Progress
Below Average Progression
Average Progression
Above Average Progression
0%
100%
Communication and Technology
0%
100%
Nursing
0%
100%
Social Science
$50,001 to $100,000 $100,001 to $150,000 Over $150,000
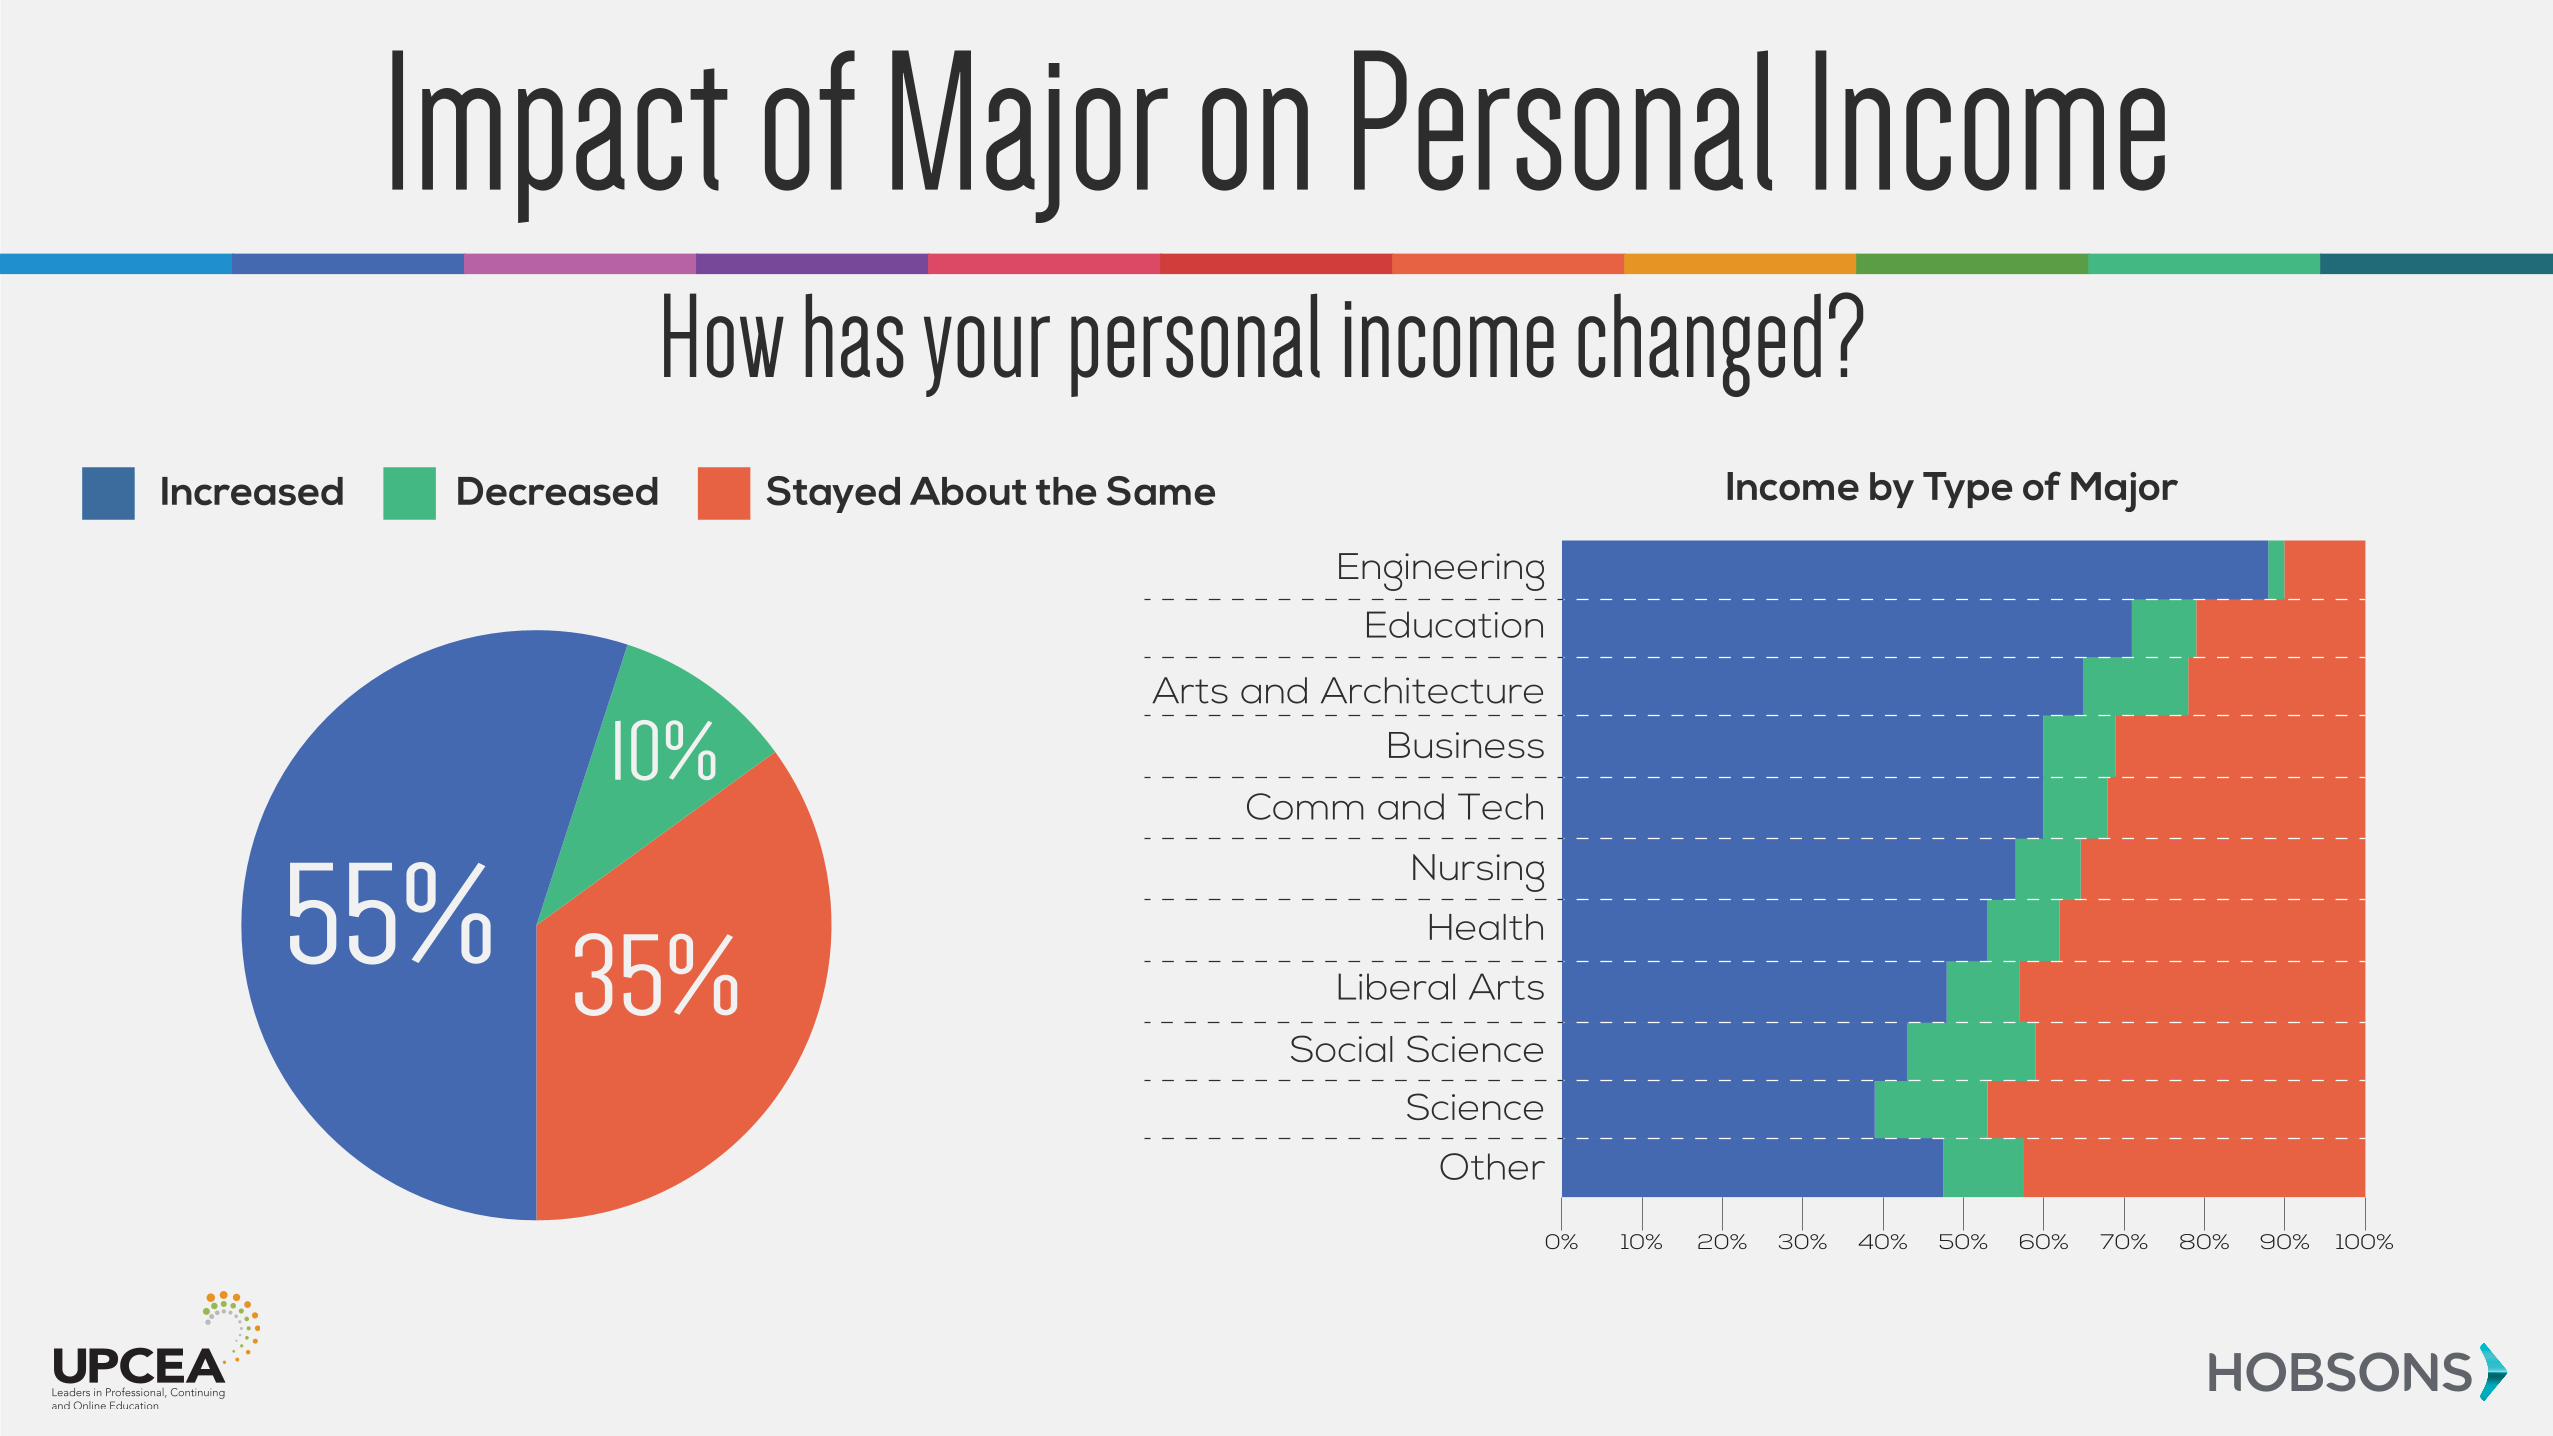
How has your personal income changed?Increased
Impact of Major on Personal Income
Decreased Stayed About the Same Income by Type of Major
Engineering
Education
Nursing
BusinessArts and Architecture
Comm and Tech
Social Science
Health
Liberal Arts
Science
Other
0% 10% 20% 30% 40% 50% 60% 70% 80% 90% 100%
55% 35%
10%
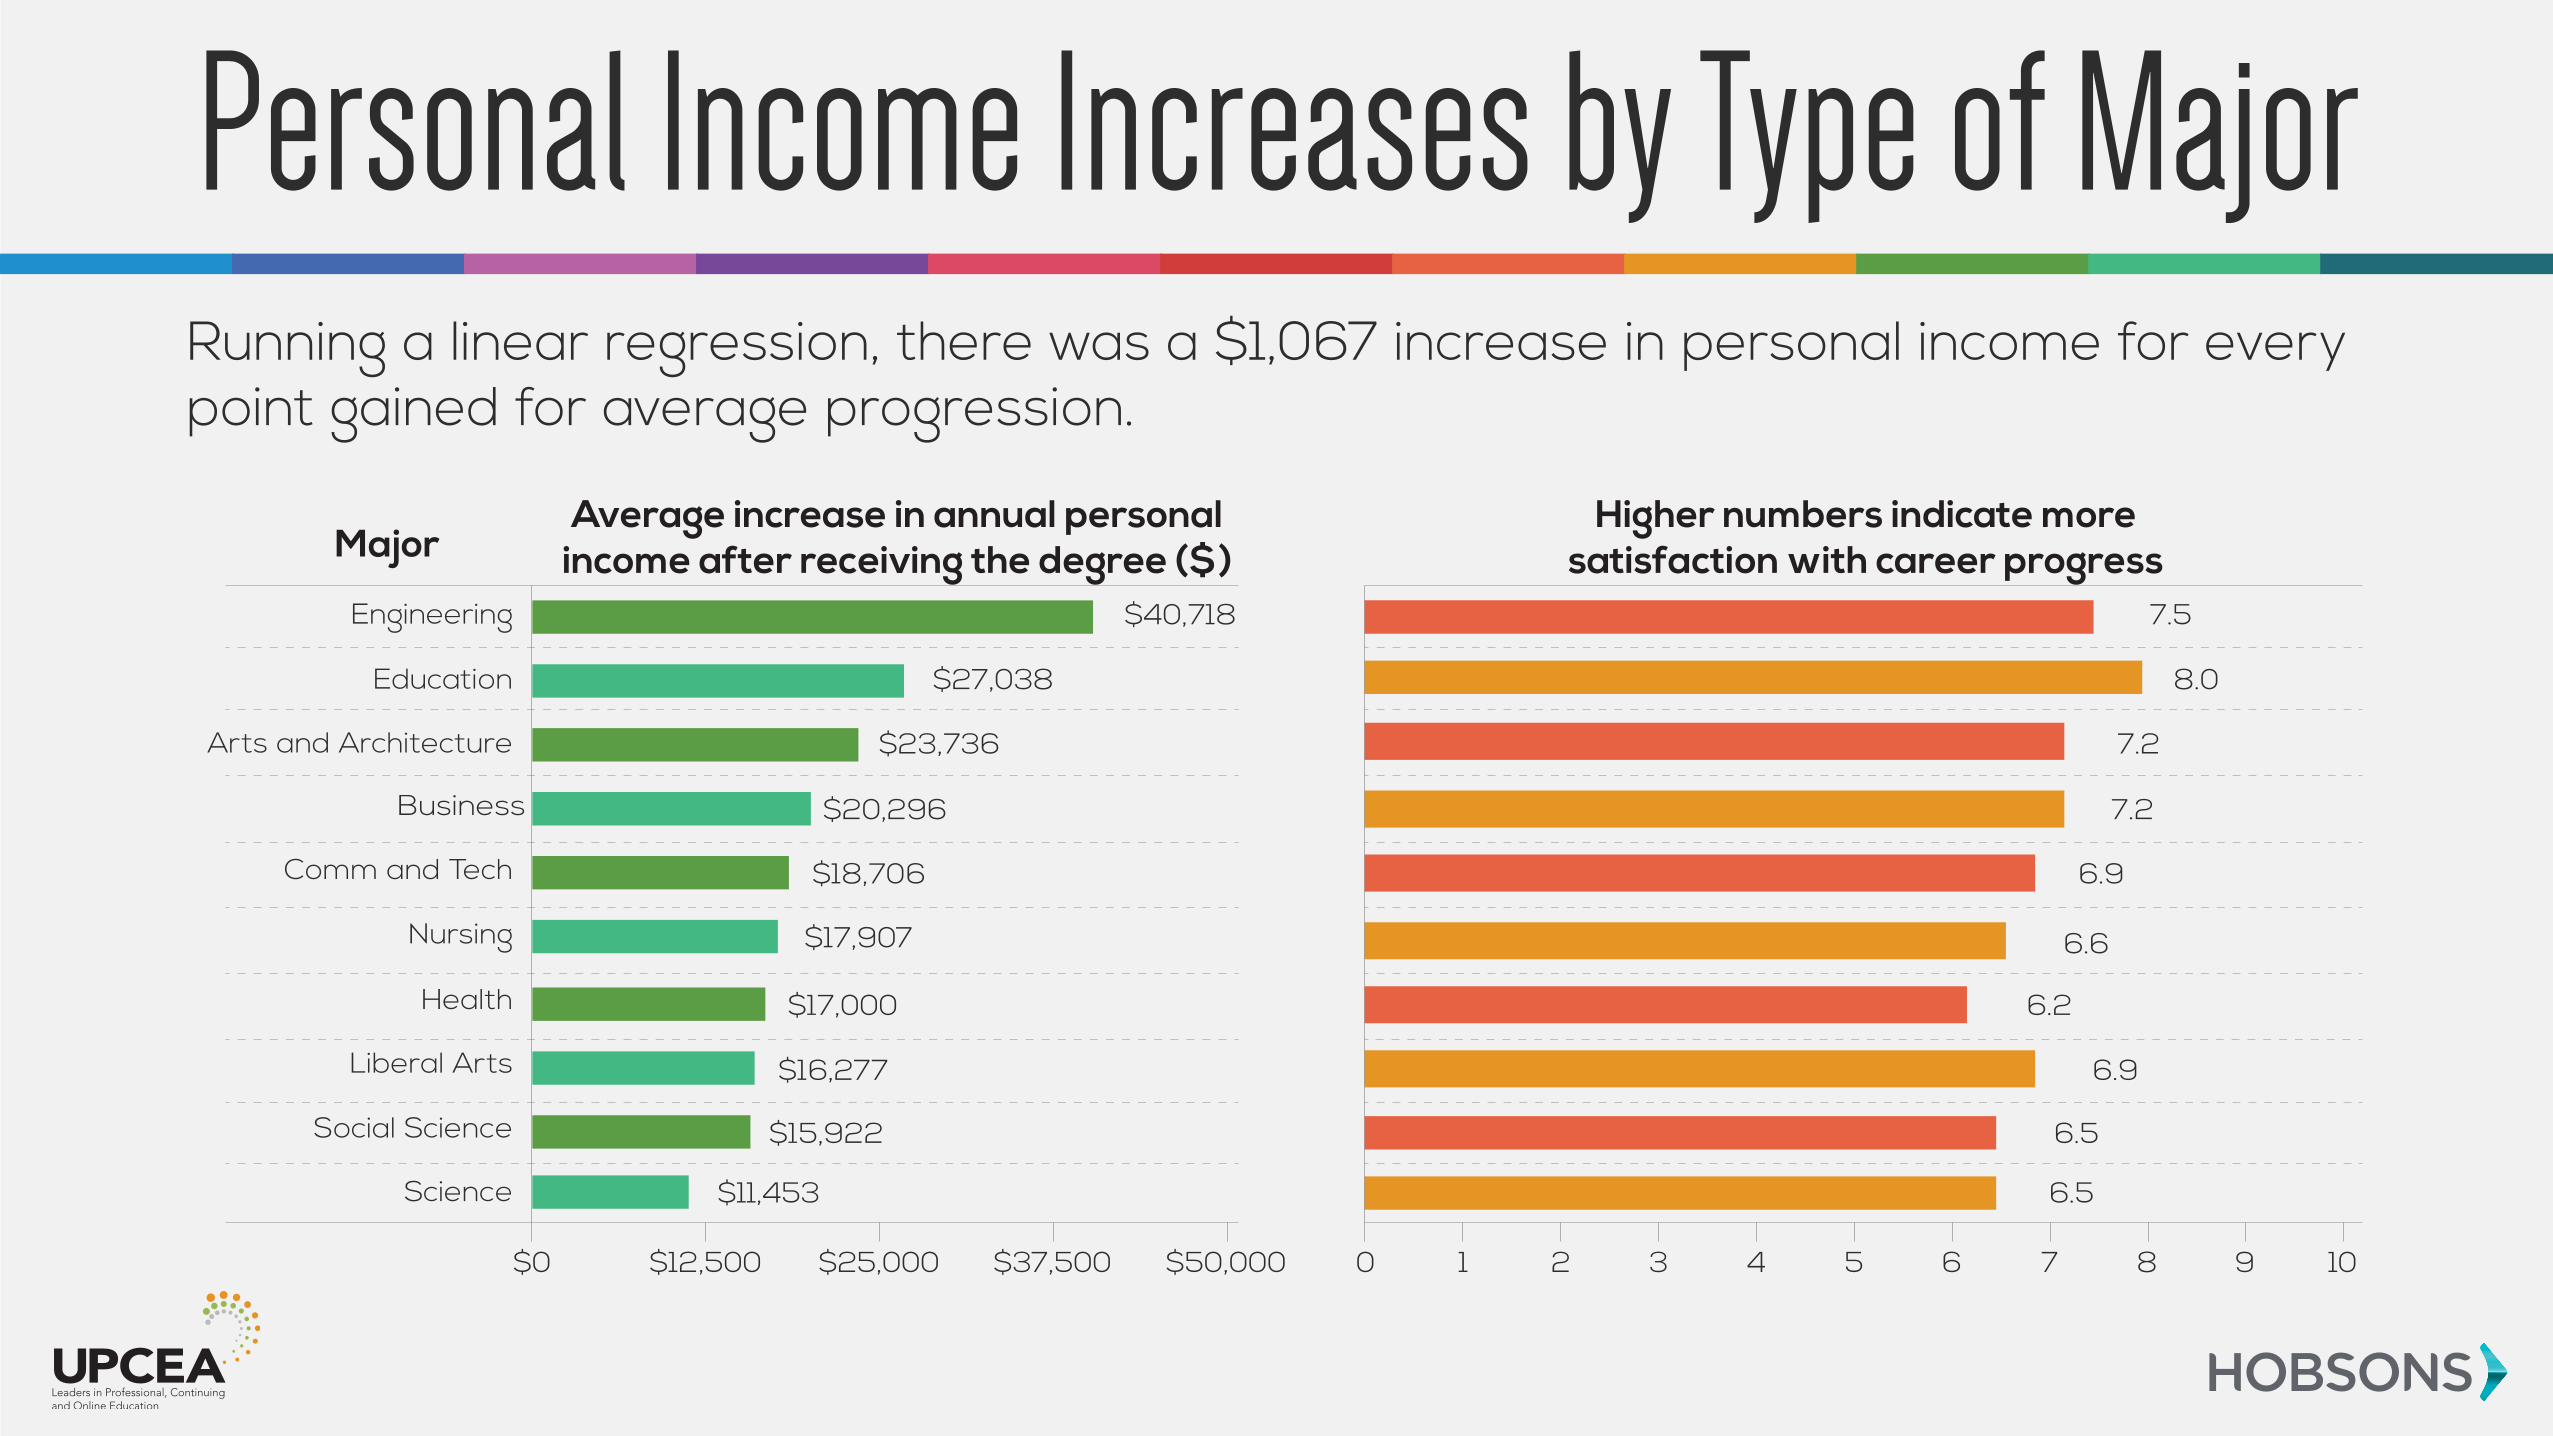
Running a linear regression, there was a $1,067 increase in personal income for every point gained for average progression.
Personal Income Increases by Type of Major
Engineering
Education
Nursing
Business
Arts and Architecture
Comm and Tech
Social Science
Health
Liberal Arts
Science
Higher numbers indicate more satisfaction with career progress
Average increase in annual personal income after receiving the degree ($)Major
$0 $12,500 $25,000 $37,500 $50,000
$40,718 7.5
8.0
7.2
7.2
6.9
6.6
6.2
6.9
6.5
6.5
$27,038
$23,736
$20,296
$18,706
$17,907
$17,000
$16,277
$15,922
$11,453
0 1 2 3 4 5 6 7 8 9 10
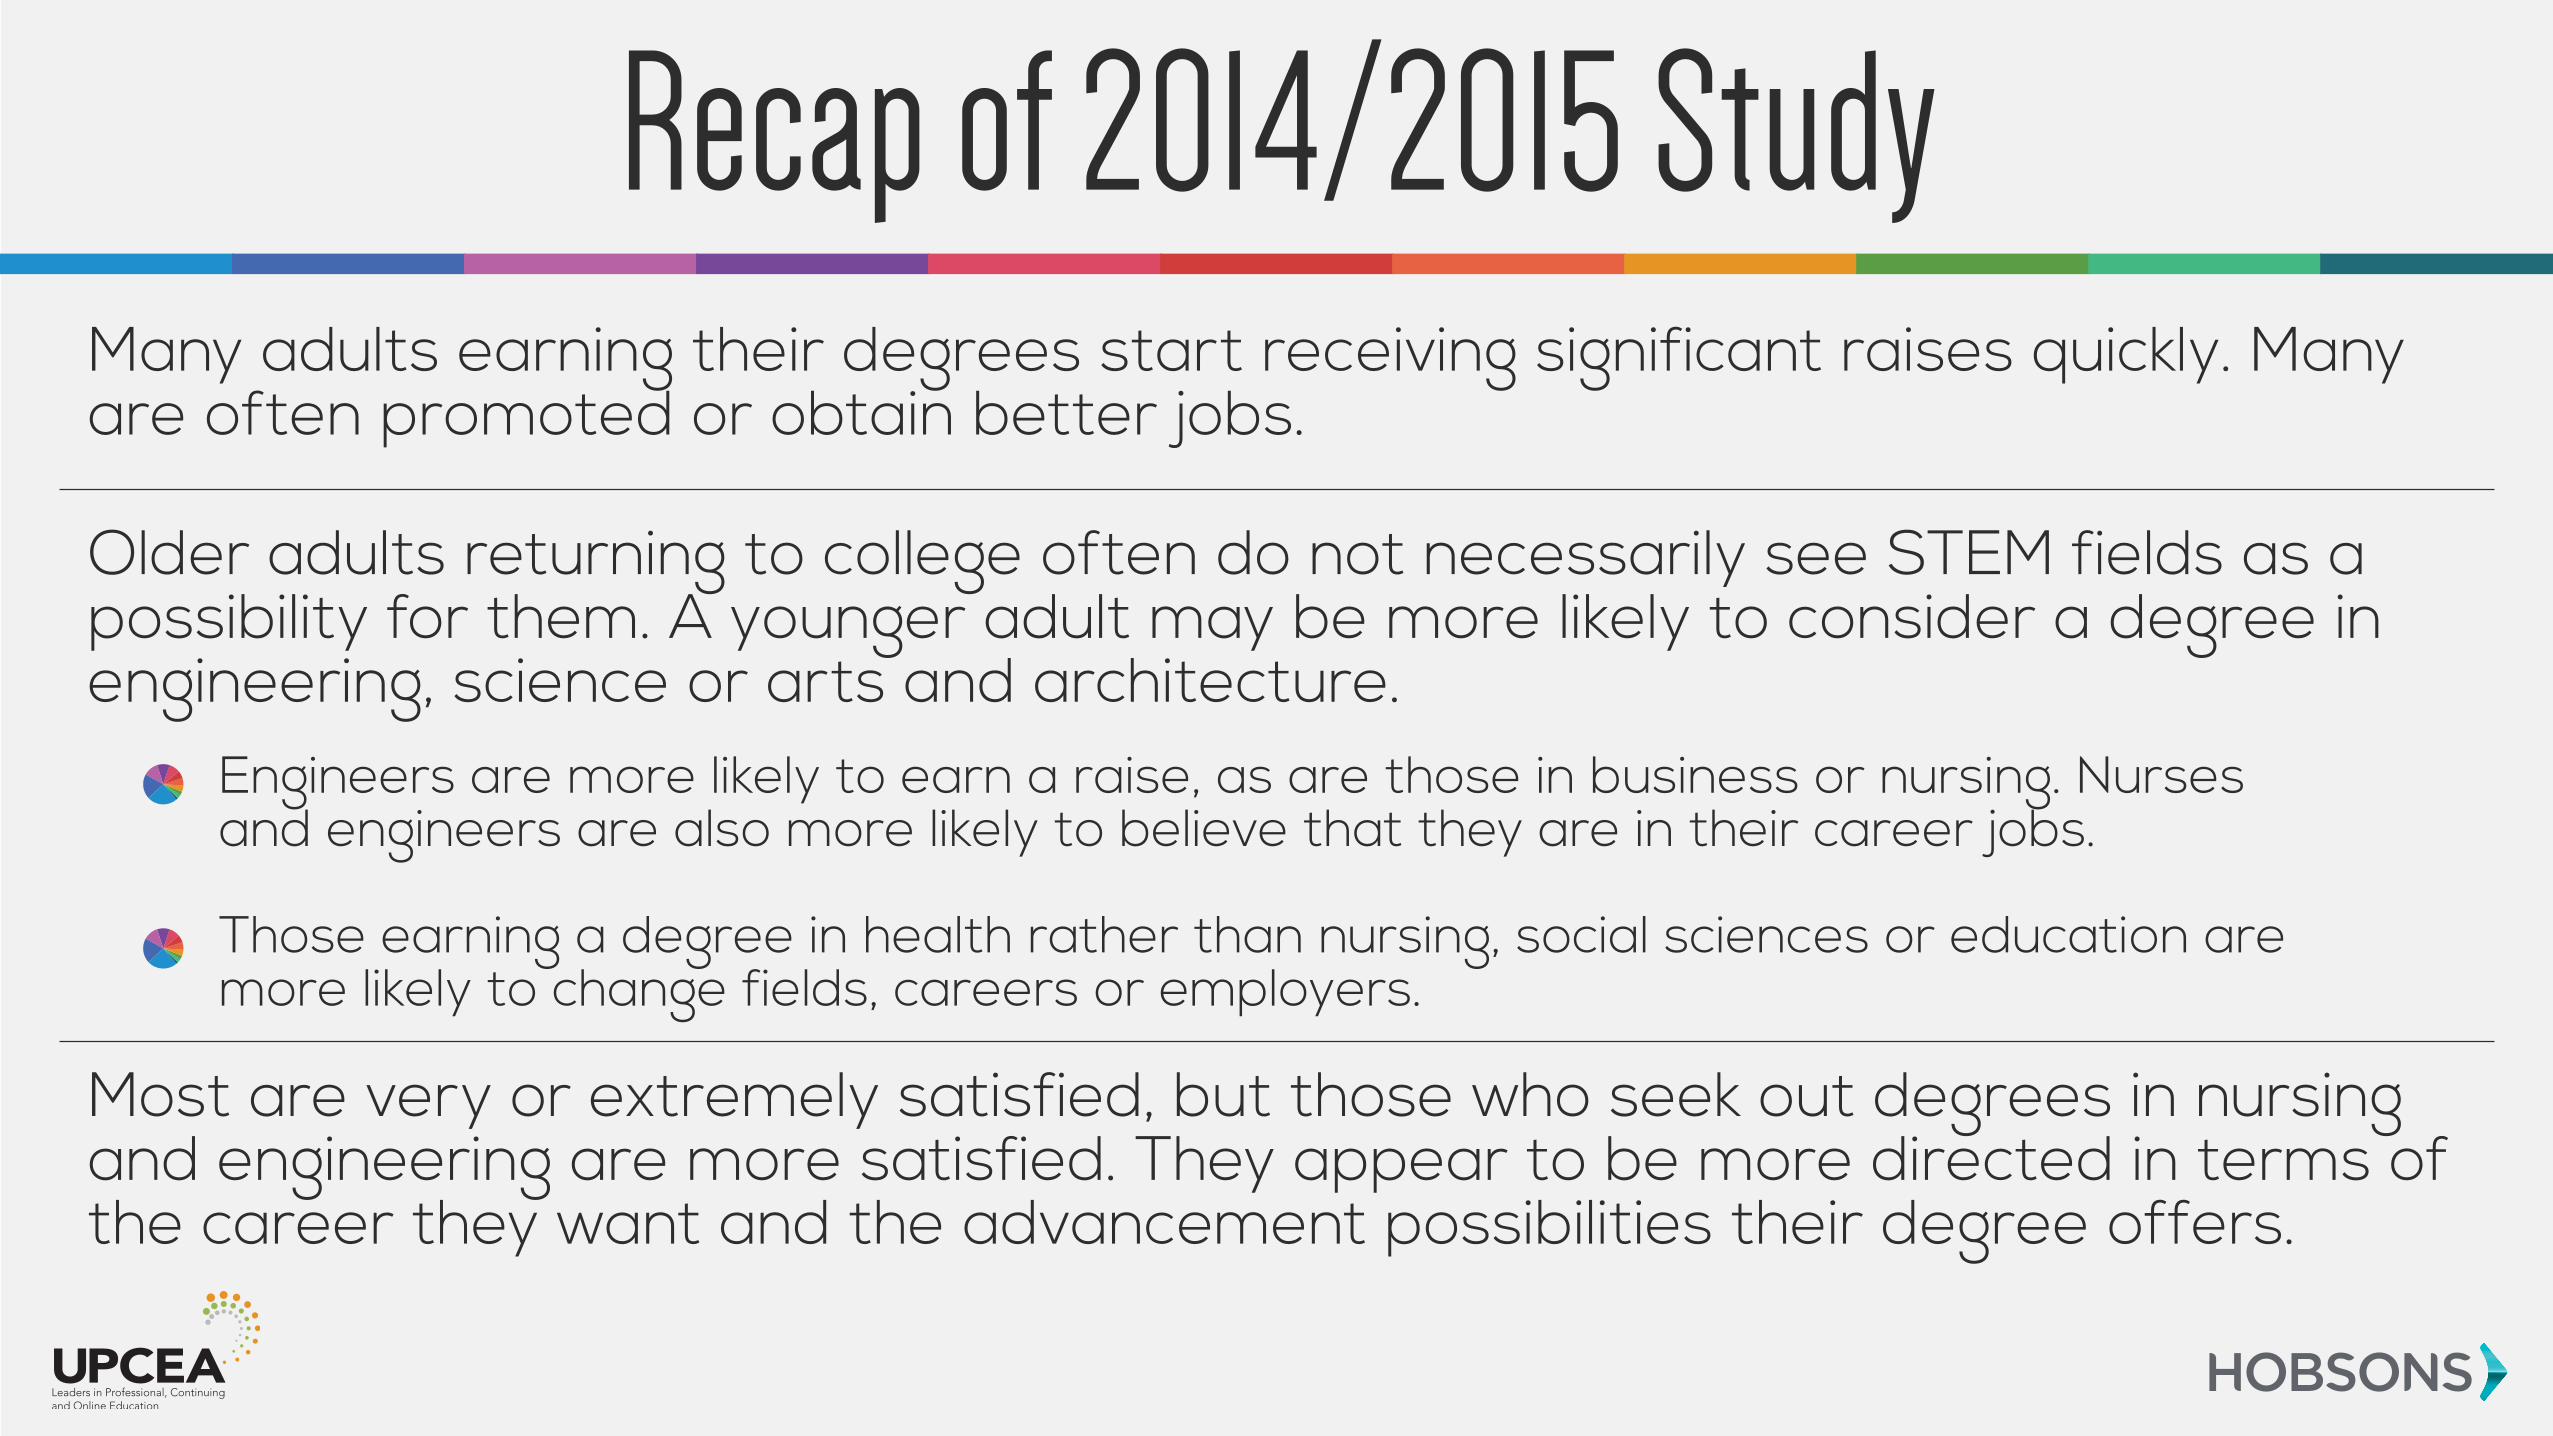
Many adults earning their degrees start receiving significant raises quickly. Many are often promoted or obtain better jobs.
Older adults returning to college often do not necessarily see STEM fields as a possibility for them. A younger adult may be more likely to consider a degree in engineering, science or arts and architecture.
Most are very or extremely satisfied, but those who seek out degrees in nursing and engineering are more satisfied. They appear to be more directed in terms of the career they want and the advancement possibilities their degree offers.
Recap of 2014/2015 Study
Engineers are more likely to earn a raise, as are those in business or nursing. Nurses and engineers are also more likely to believe that they are in their career jobs.
Those earning a degree in health rather than nursing, social sciences or education are more likely to change fields, careers or employers.
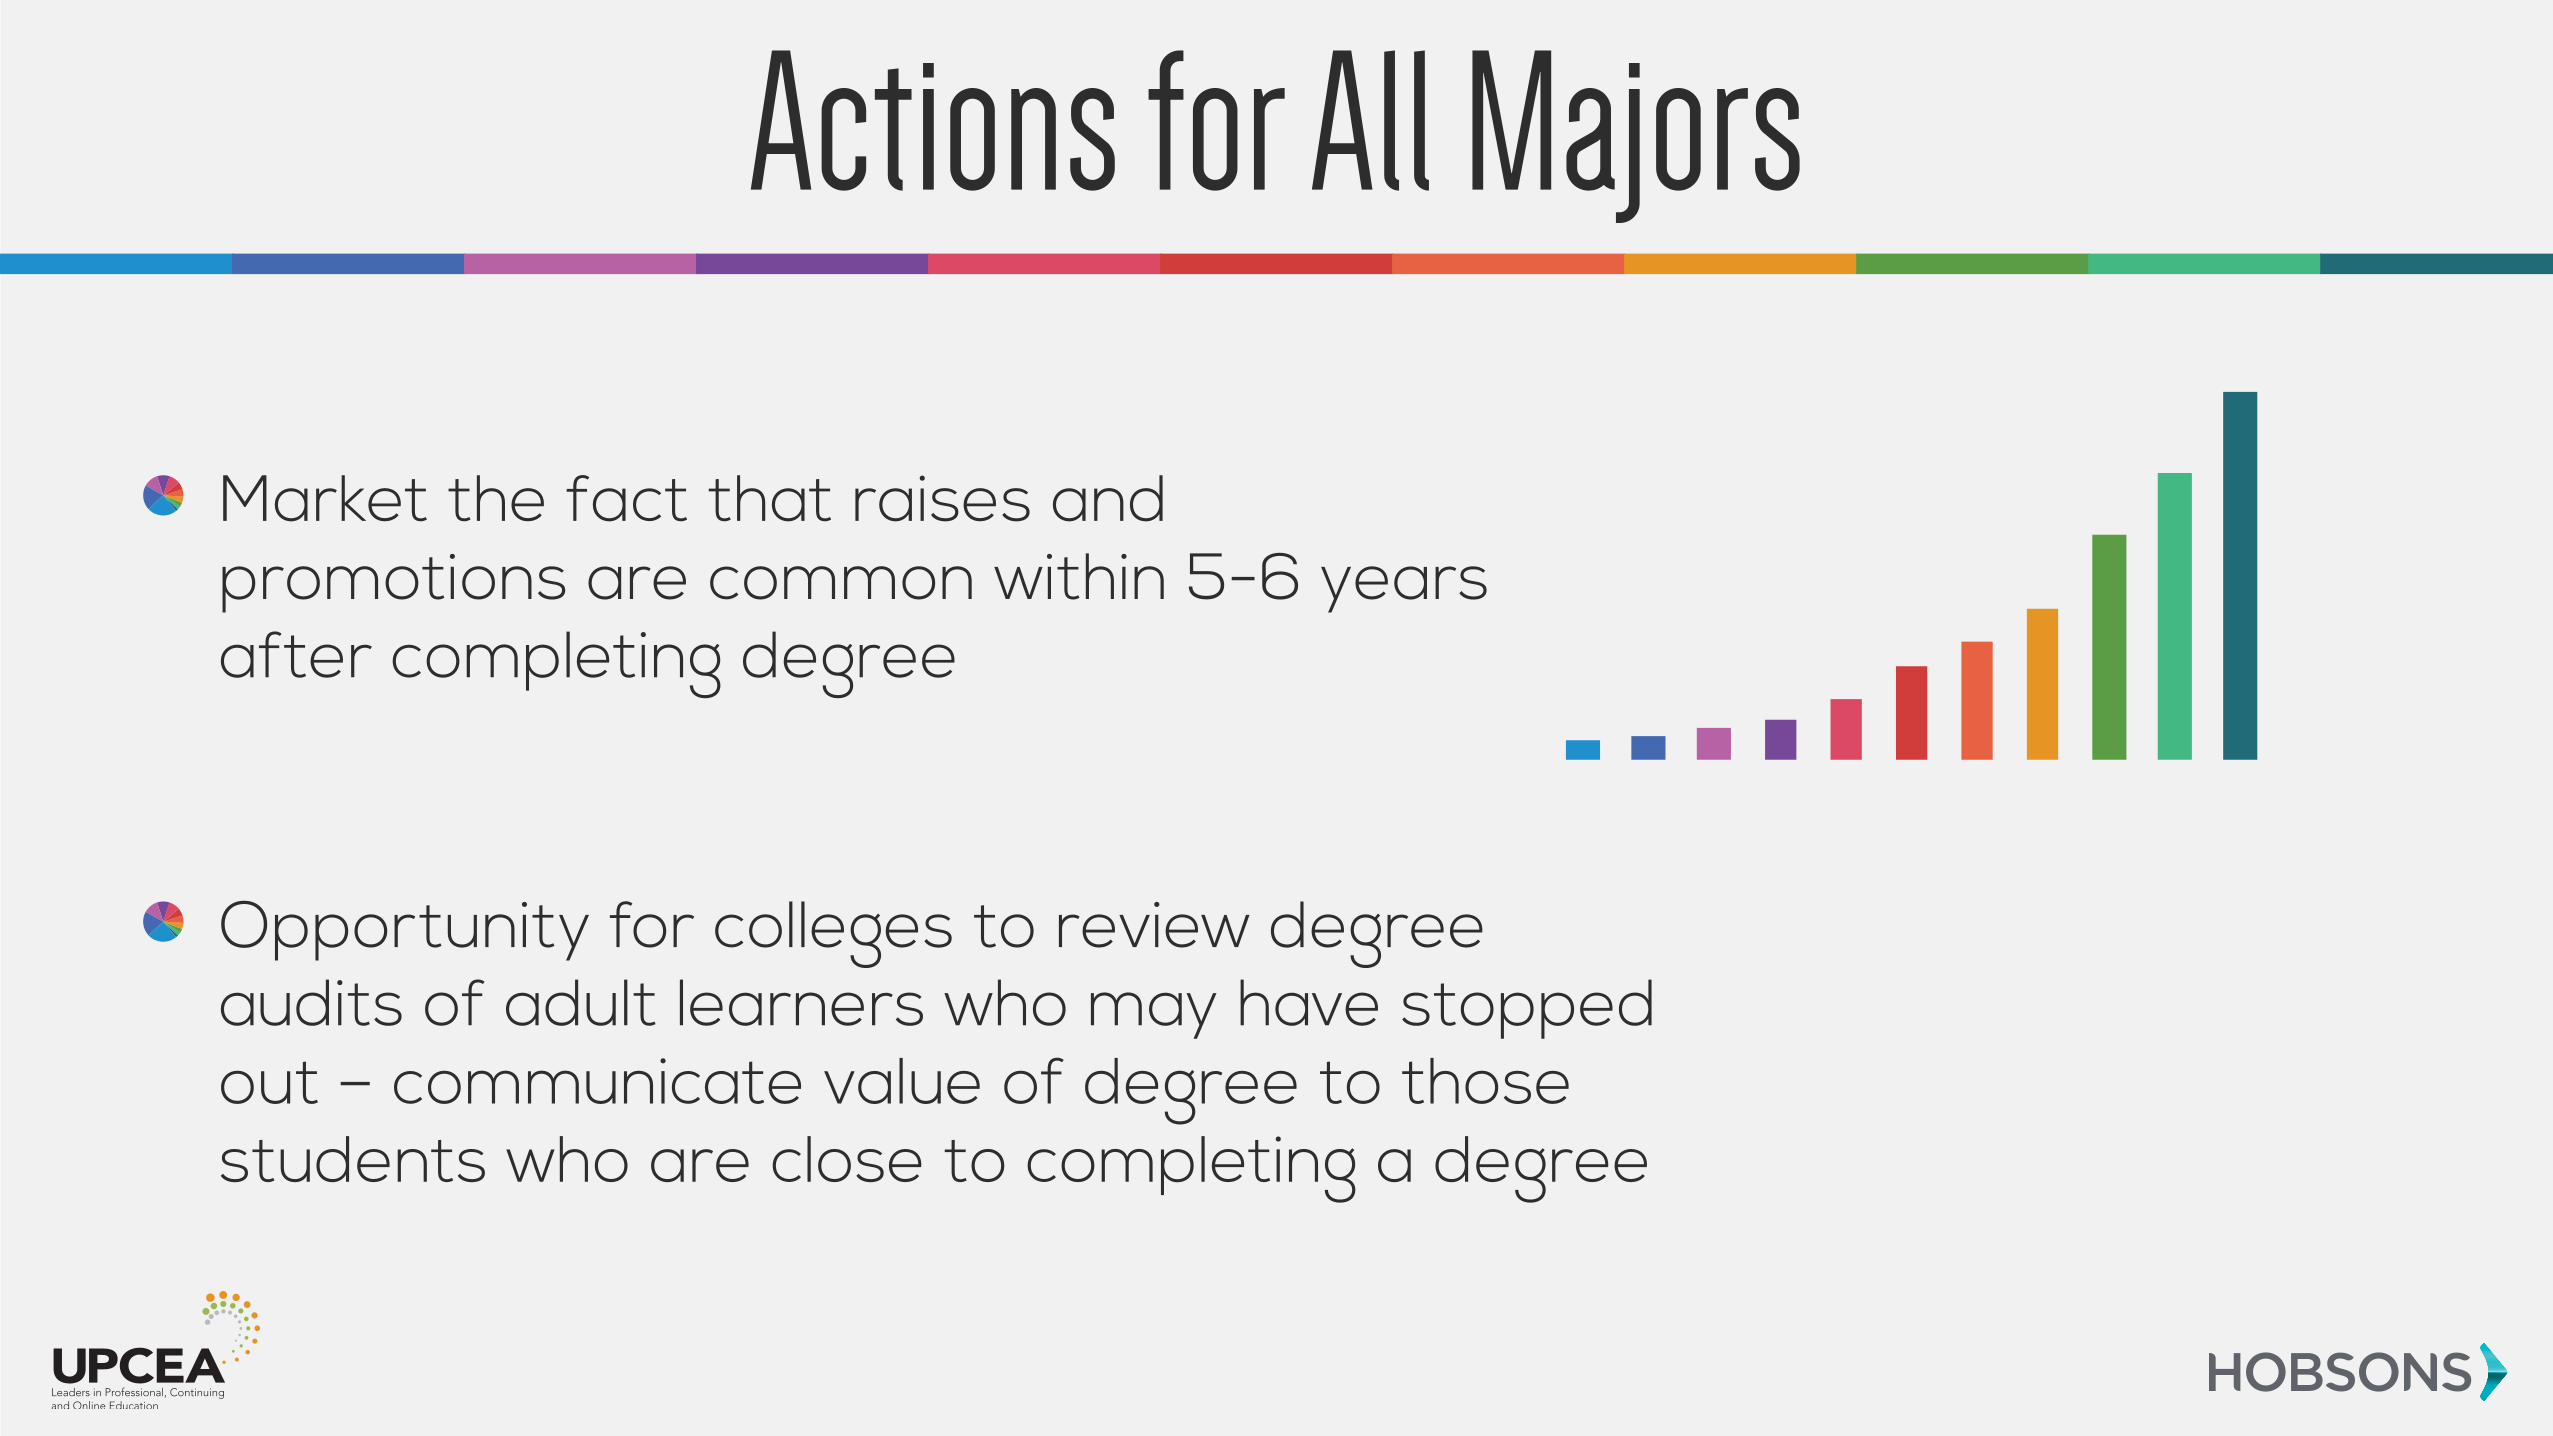
Actions for All Majors
Market the fact that raises and promotions are common within 5-6 years after completing degree
Opportunity for colleges to review degree audits of adult learners who may have stopped out – communicate value of degree to those students who are close to completing a degree
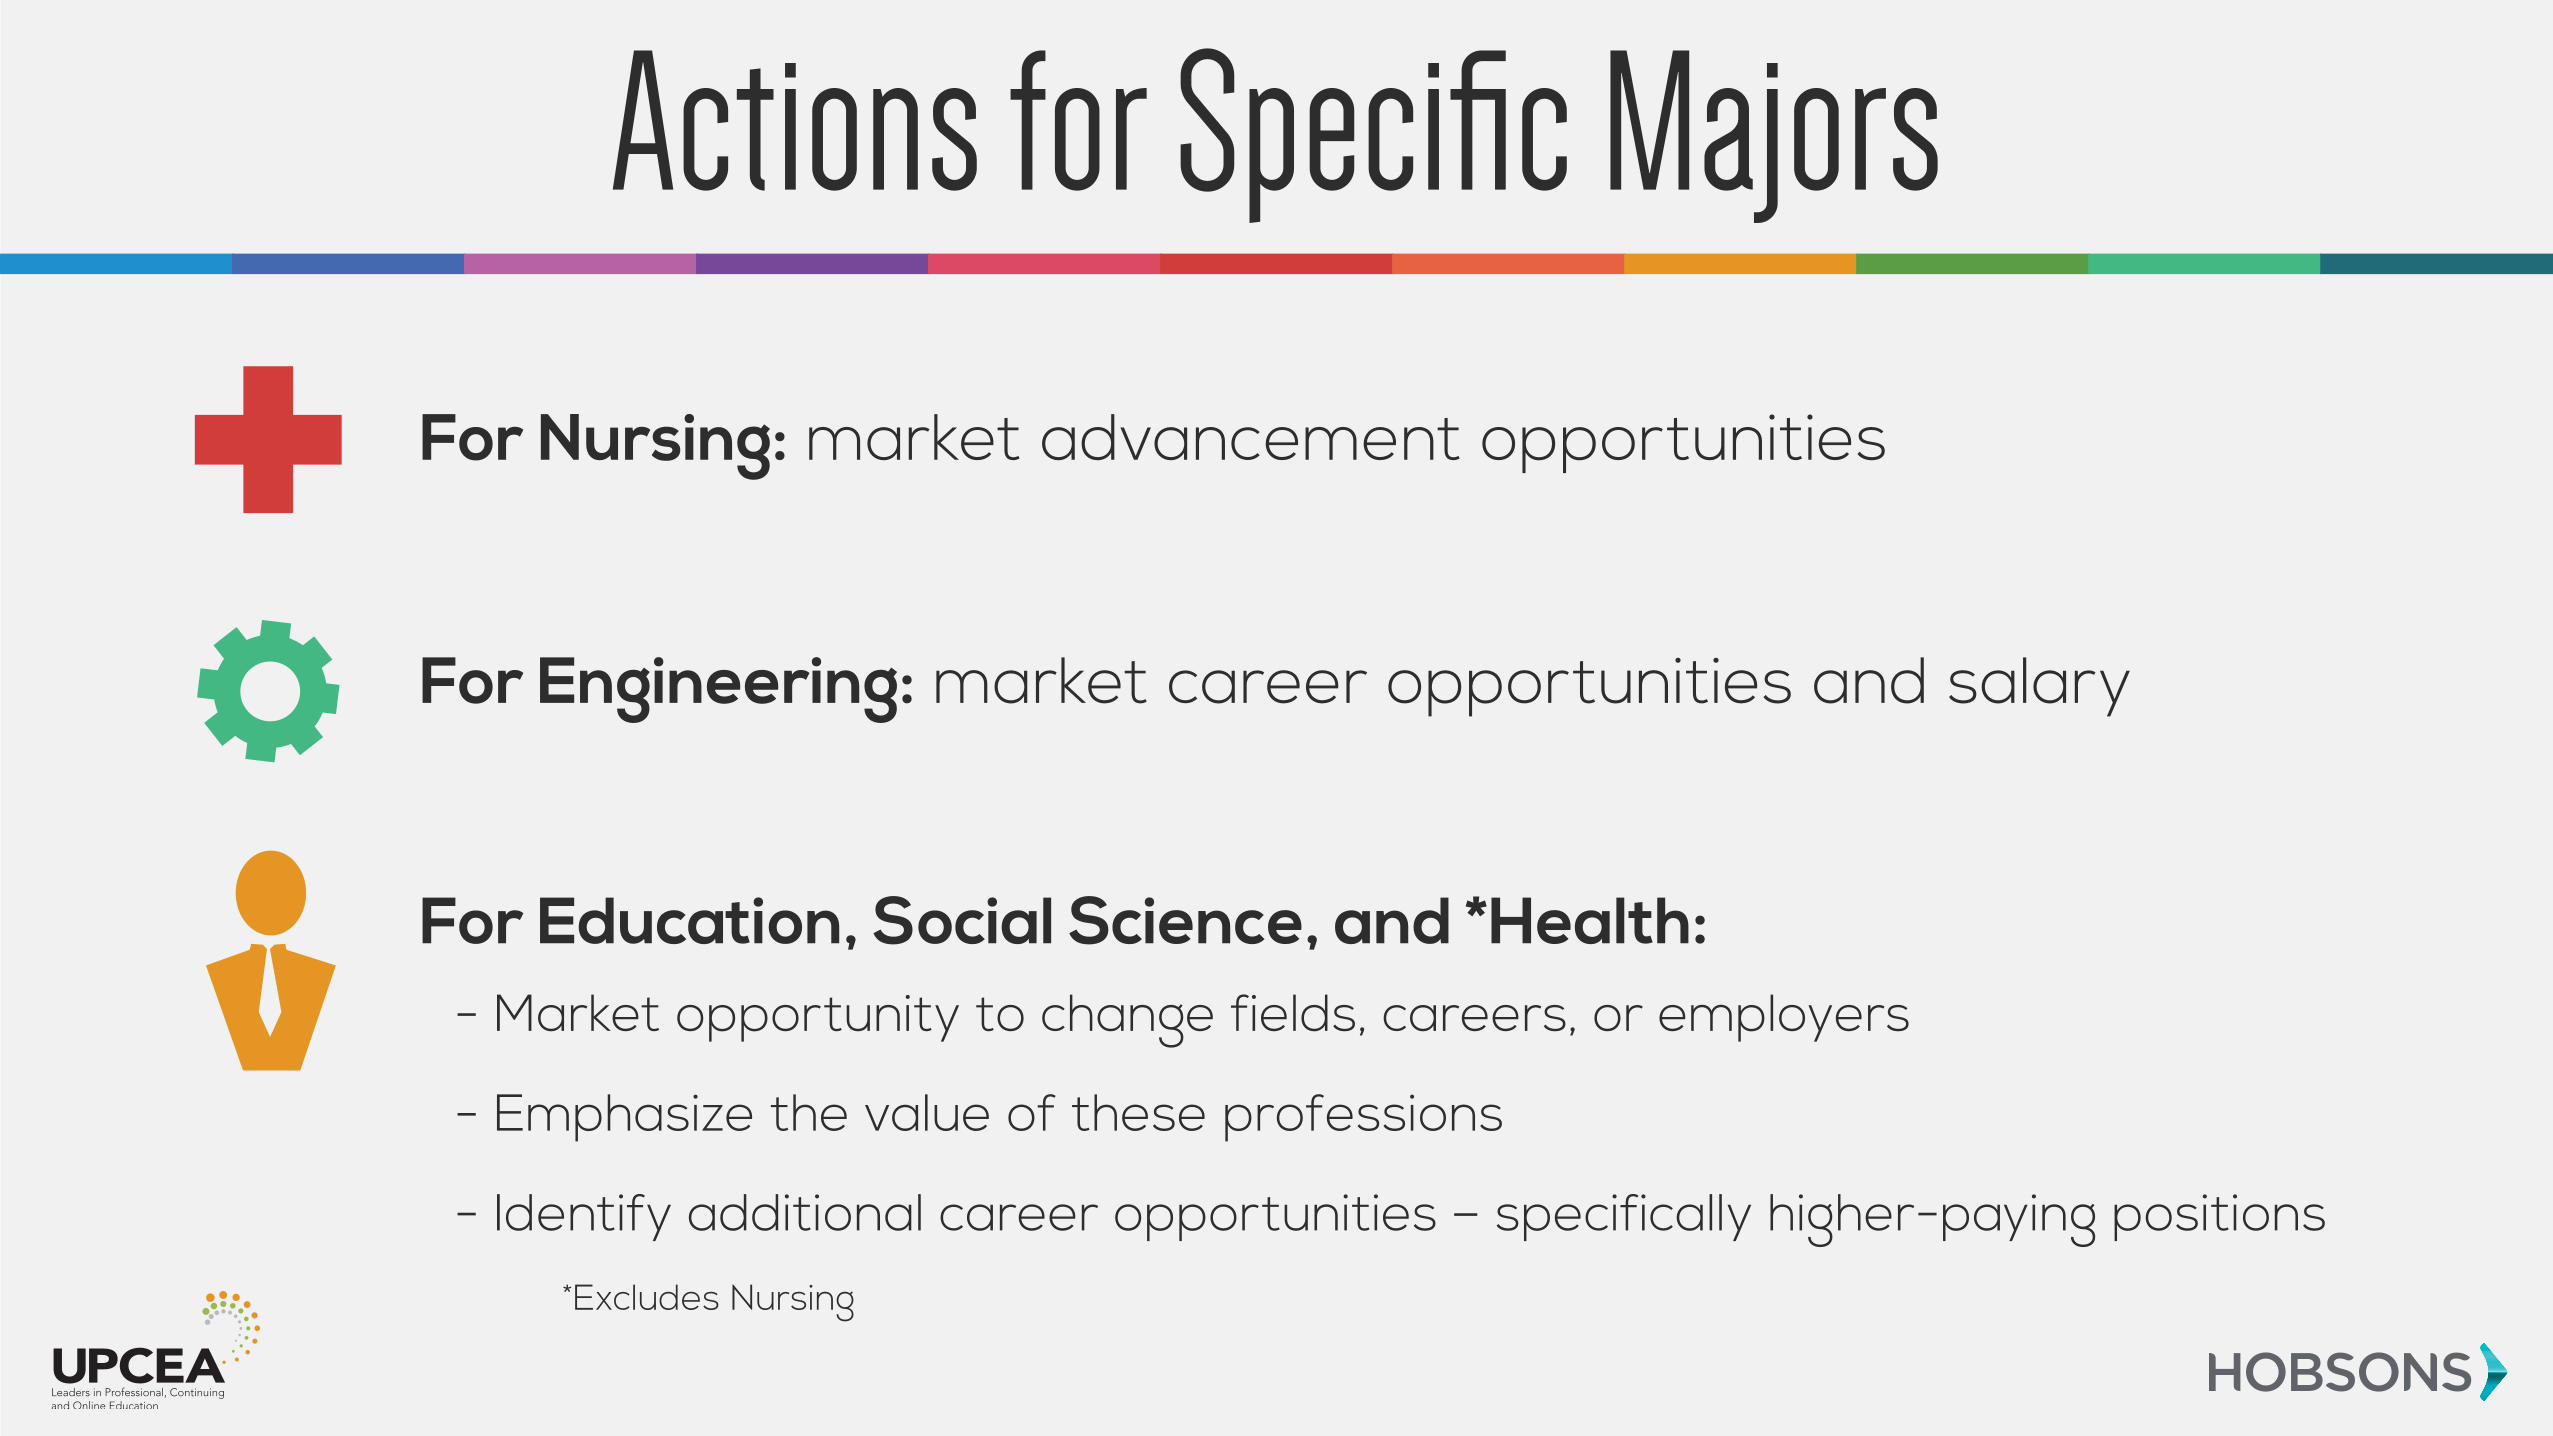
Actions for Specific Majors
For Nursing: market advancement opportunities
For Engineering: market career opportunities and salary
For Education, Social Science, and *Health:- Market opportunity to change fields, careers, or employers
- Emphasize the value of these professions
- Identify additional career opportunities – specifically higher-paying positions*Excludes Nursing
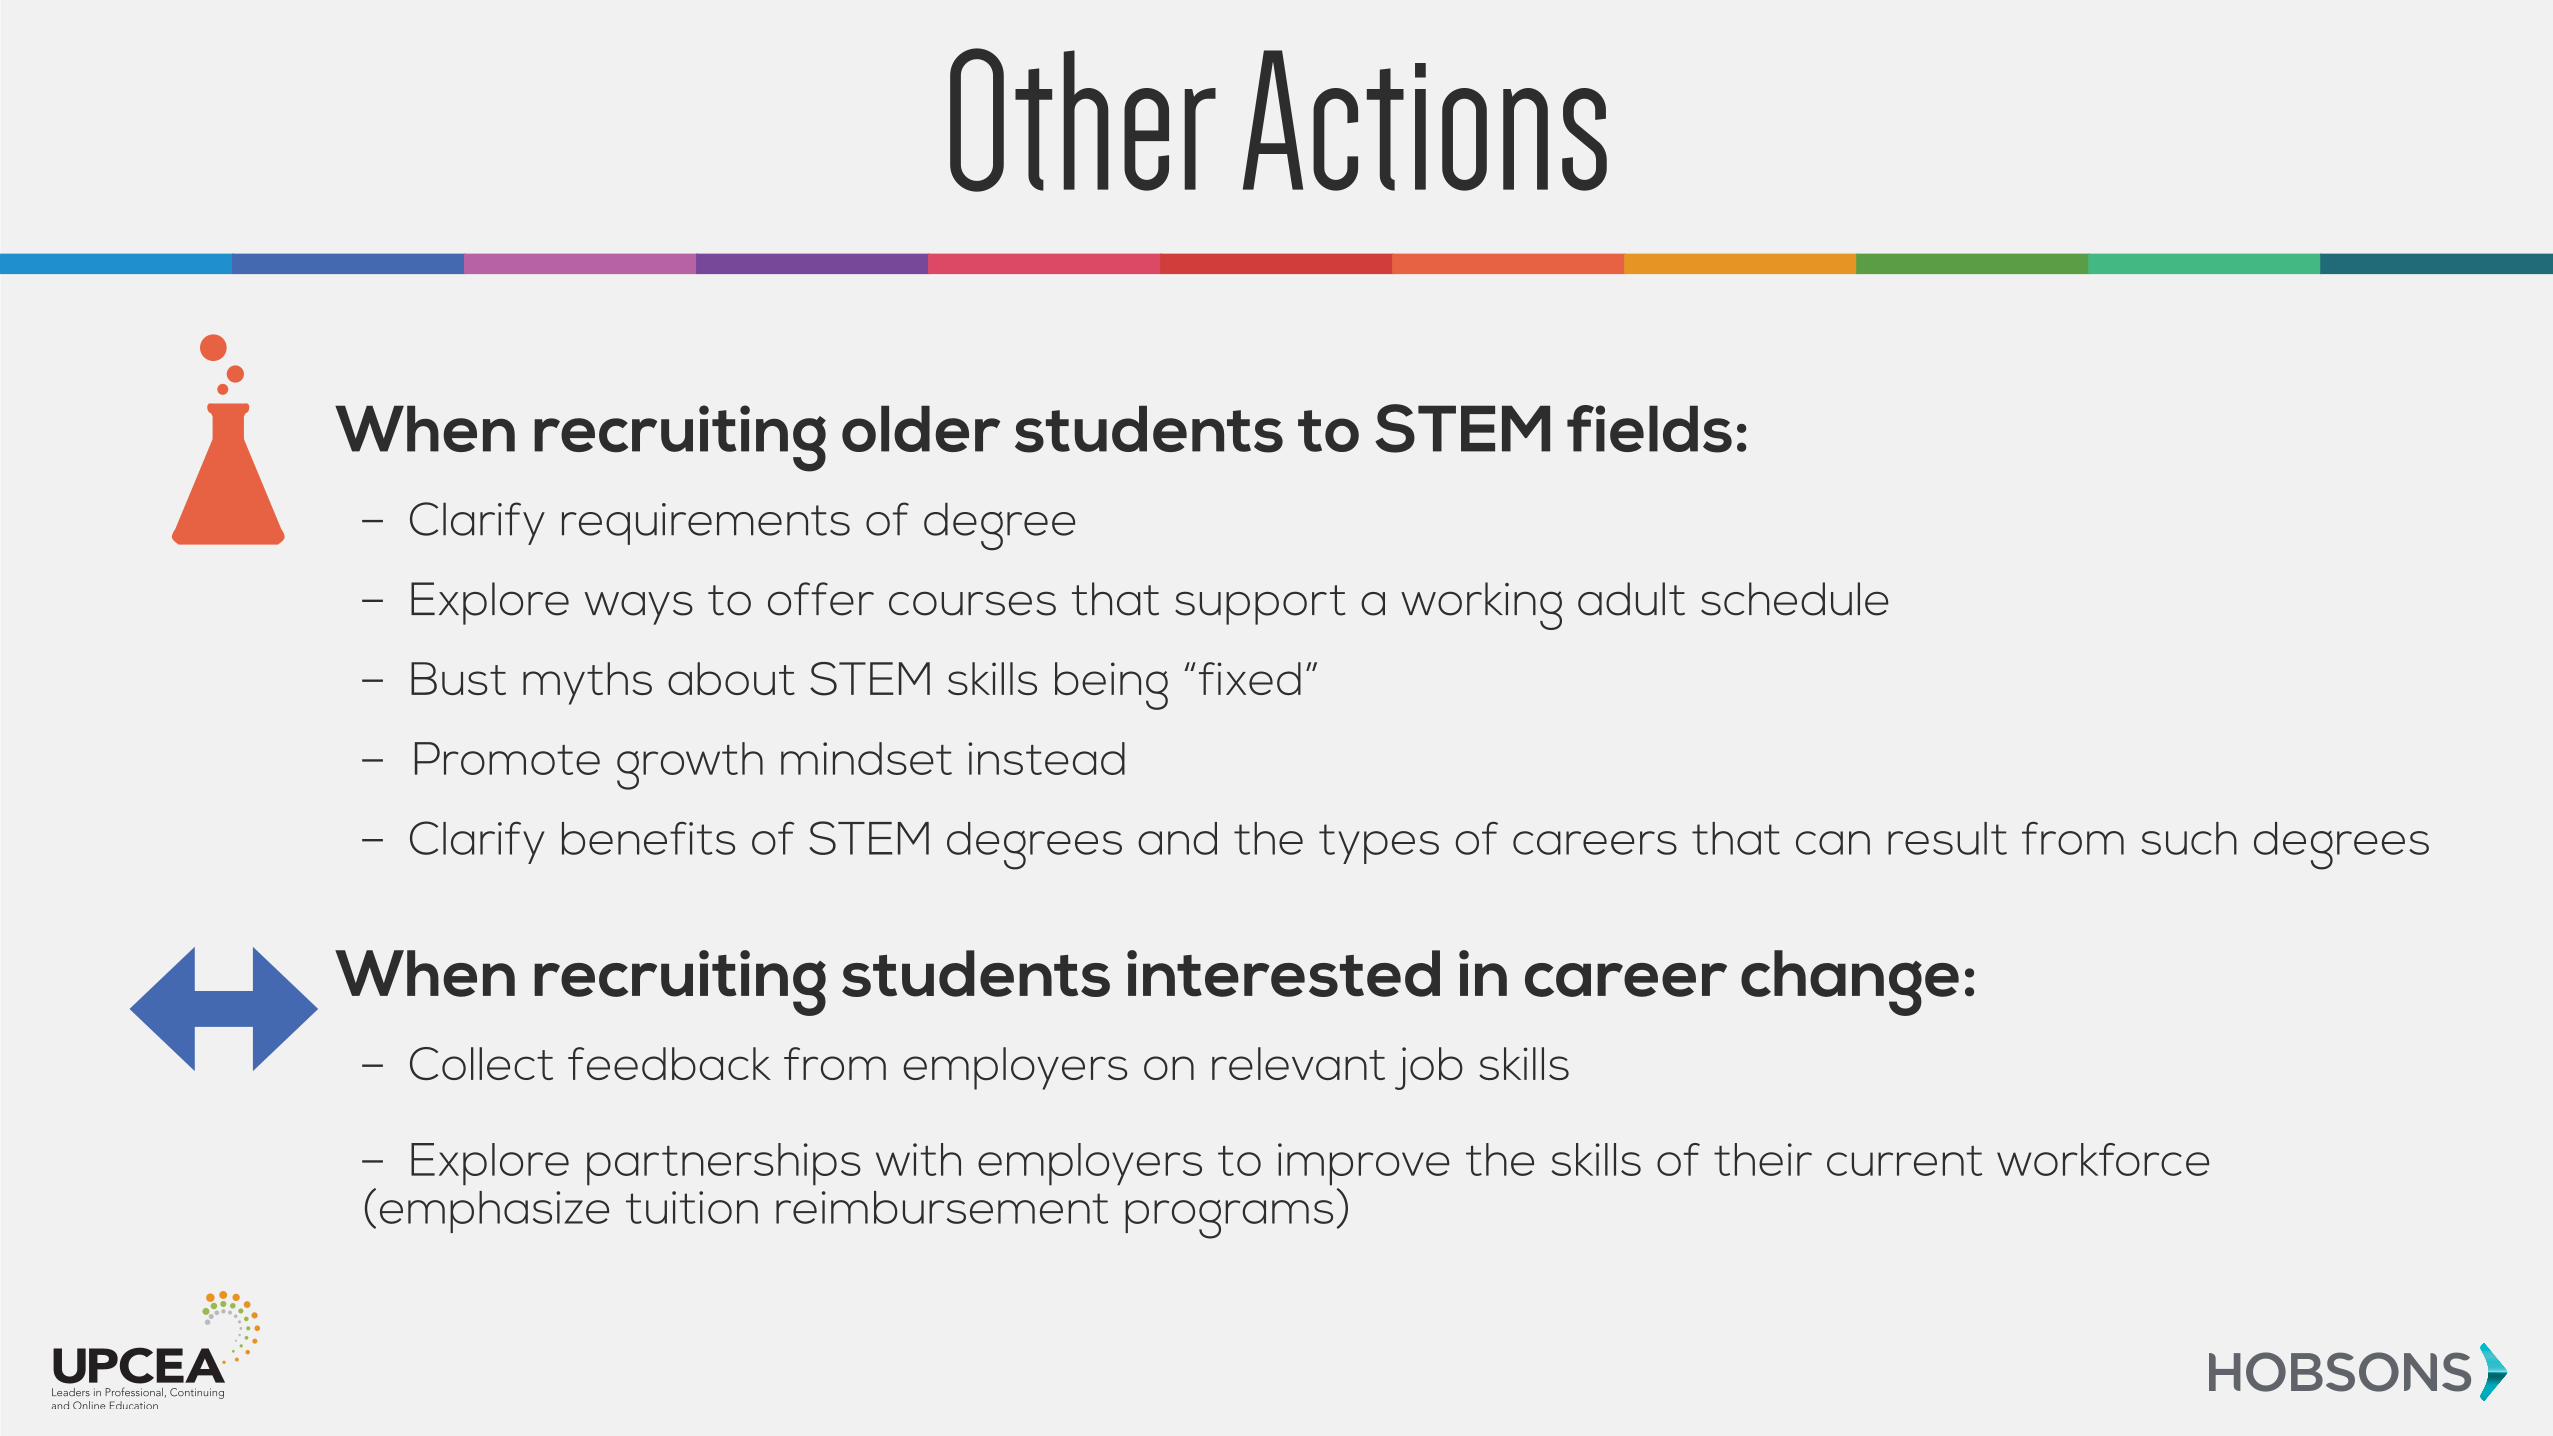
Other Actions
When recruiting older students to STEM fields:– Clarify requirements of degree
– Explore ways to offer courses that support a working adult schedule
– Bust myths about STEM skills being “fixed”
– Promote growth mindset instead
– Clarify benefits of STEM degrees and the types of careers that can result from such degrees
When recruiting students interested in career change:– Collect feedback from employers on relevant job skills
– Explore partnerships with employers to improve the skills of their current workforce (emphasize tuition reimbursement programs)
Jim Fong
Director, UPCEA Center for Research and Consulting
Amanda Mason-Singh
Research AnalystPolicy and Advocacy,
Hobsons
Questions and Insights