Embed Size (px)
Citation preview
1
FOUNDATION IN NATURAL AND BUILT ENVIRONMENT
BASIC ACCOUNTING (ACC30205)
ASSIGNMENT 1: FINANCIAL RATIO ANALYSIS
GROUP MEMBERS:
CHAN PEI SHAN (0318350)
YEO DOR EEN (0316224)
LIM JIE QI (0318313)
COMPANY: MCDONALDS CORPORATION
LECTURER: MR CHANG JAU HO
SUBMISSION DATE: 13th NOVEMBER, THURSDAY, 12PM
2
TABLE OF CONTENTS
BACKGROUND OF MCDONALDS CORP. PAGE 3
RECENT DEVELOPMENT PAGE 4
PROFITABILITY RATIOS PAGE 5-6
STABILITY RATIOS PAGE 7-8
PRICE/EARNING RATIO PAGE 9
INVESTMENT RECOMMENDATION PAGE 10-11
APPENDIX PAGE 12-15
REFERENCES PAGE 16
3
BACKGROUND OF MCDONALDS CORP.
McDonalds was originally owned by just the McDonald’s brothers,
Richard and Maurice (Dick and Mac) McDonald. It had been in business since
1930 in a carhop drive-in, but it was until 1954 when Raymond “Ray” Kroc
founded their restaurant and opened their first franchise in Illinois. That was
when McDonald’s Corporation was created, and since then, the McDonald’s
franchise kept expanding and just in 5 years, the 100th McDonald restaurant
was opened on Chicago.
The original menu set by the McDonald brothers were very simple, of
just two types of burgers, french fries, shakes, soft drinks and apple pie. They
initially used the founder’s milkshake machine to make the shakes, which
made Ray Kroc curious and decided to check their restaurant out.
During 1960 to 1970, the fast-food chain began to grow rapidly. In the
early 1960 Ray Kroc used $2.7 million to buy the concepts rights from the
brothers, and since then, McDonald’s begin expanding not only the size of the
franchise, but also the varieties of food on the menu. The first McDonald
opened outside of the USA was in Canada and Puerto Rico in the year 1967,
and soon, all the countries began expanding the franchise.
Up until today, McDonald had become a worldwide fast-food industry
and could be found almost anywhere. It is ranked the first fast-food chain in
terms of size and popularity, and its net worth on 2013 was $90.3 billion!!
4
RECENT DEVELOPMENT
Over the years, McDonald’s had increased their menu varieties and also
expanding the franchise. Since McDonald’s had become a worldwide
franchise, it can’t keep the few menus they have forever. The expanding of
McDonald’s had make the fast food chain to come up with many different
types of burgers, McNuggets, and also breakfast menu and happy meals for
kids. They even provided toys for the happy meals.
Until the recent year of 2013, McDonald have had 440,000 employees in
total including all restaurants around the world. Up until now Japan has the
largest number of franchise In the U.S. 225 new restaurants had opened in the
same year, and in Europe the company emphasized on value meals and offers.
By the end of the year, over 65% of McDonald’s chain had improved in
interior and 55% of the exteriors.
5
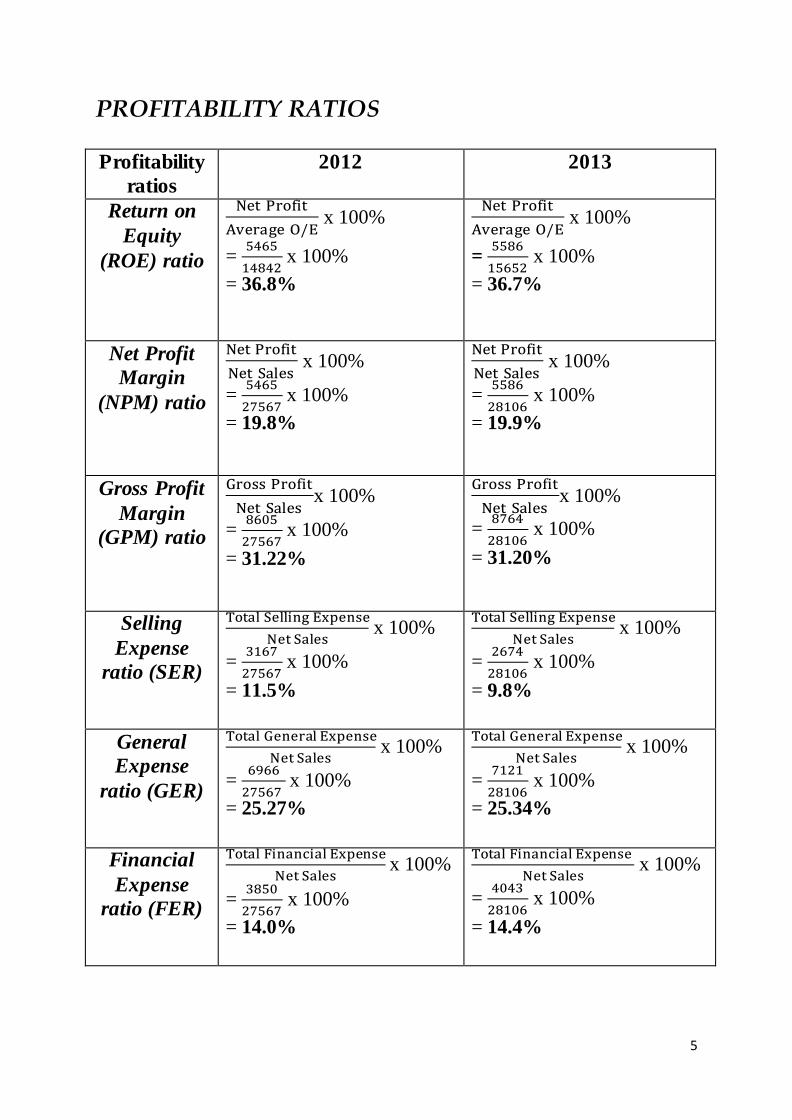
PROFITABILITY RATIOS
Profitability
ratios
2012 2013
Return on
Equity
(ROE) ratio
Net Profit
Average O/E x 100%
= 5465
14842 x 100%
= 36.8%
Net Profit
Average O/E x 100%
= 5586
15652 x 100%
= 36.7%
Net Profit
Margin
(NPM) ratio
Net Profit
Net Sales x 100%
= 5465
27567 x 100%
= 19.8%
Net Profit
Net Sales x 100%
= 5586
28106 x 100%
= 19.9%
Gross Profit
Margin
(GPM) ratio
Gross Profit
Net Salesx 100%
= 8605
27567 x 100%
= 31.22%
Gross Profit
Net Salesx 100%
= 8764
28106 x 100%
= 31.20%
Selling
Expense
ratio (SER)
Total Selling Expense
Net Sales x 100%
= 3167
27567 x 100%
= 11.5%
Total Selling Expense
Net Sales x 100%
= 2674
28106 x 100%
= 9.8%
General
Expense
ratio (GER)
Total General Expense
Net Sales x 100%
= 6966
27567 x 100%
= 25.27%
Total General Expense
Net Sales x 100%
= 7121
28106 x 100%
= 25.34%
Financial
Expense
ratio (FER)
Total Financial Expense
Net Sales x 100%
= 3850
27567 x 100%
= 14.0%
Total Financial Expense
Net Sales x 100%
= 4043
28106 x 100%
= 14.4%
6
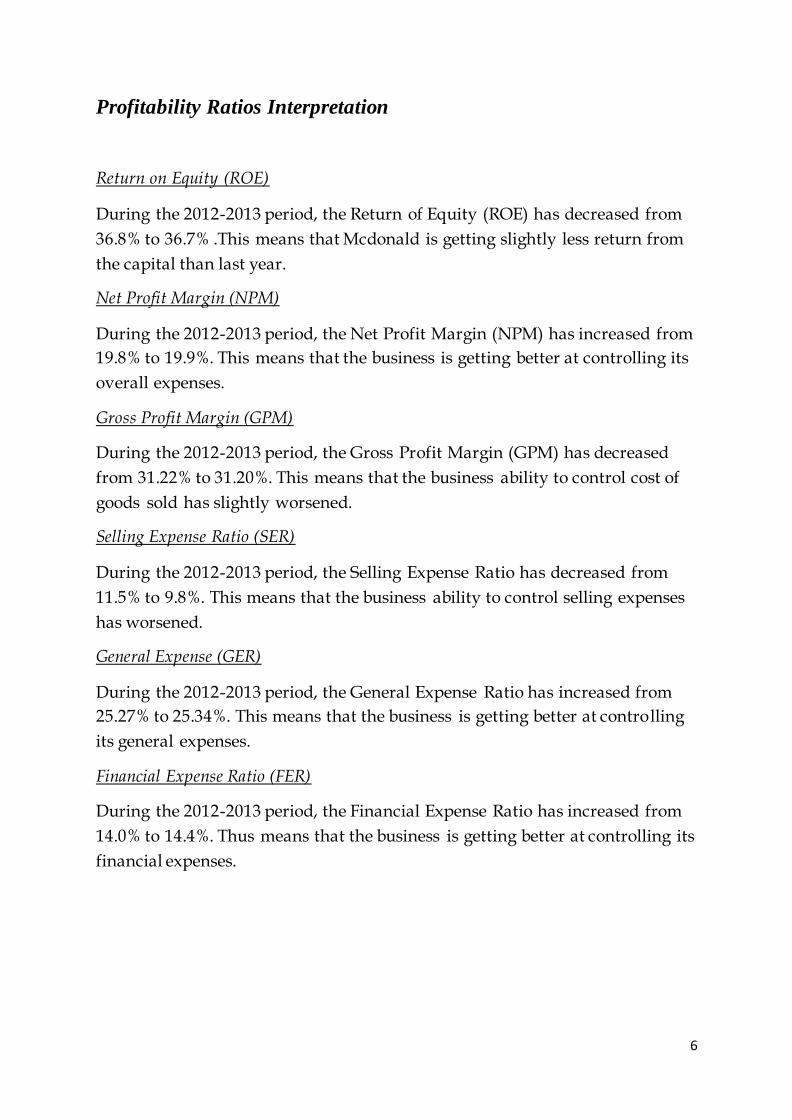
Profitability Ratios Interpretation
Return on Equity (ROE)
During the 2012-2013 period, the Return of Equity (ROE) has decreased from
36.8% to 36.7% .This means that Mcdonald is getting slightly less return from
the capital than last year.
Net Profit Margin (NPM)
During the 2012-2013 period, the Net Profit Margin (NPM) has increased from
19.8% to 19.9%. This means that the business is getting better at controlling its
overall expenses.
Gross Profit Margin (GPM)
During the 2012-2013 period, the Gross Profit Margin (GPM) has decreased
from 31.22% to 31.20%. This means that the business ability to control cost of
goods sold has slightly worsened.
Selling Expense Ratio (SER)
During the 2012-2013 period, the Selling Expense Ratio has decreased from
11.5% to 9.8%. This means that the business ability to control selling expenses
has worsened.
General Expense (GER)
During the 2012-2013 period, the General Expense Ratio has increased from
25.27% to 25.34%. This means that the business is getting better at controlling
its general expenses.
Financial Expense Ratio (FER)
During the 2012-2013 period, the Financial Expense Ratio has increased from
14.0% to 14.4%. Thus means that the business is getting better at controlling its
financial expenses.
7
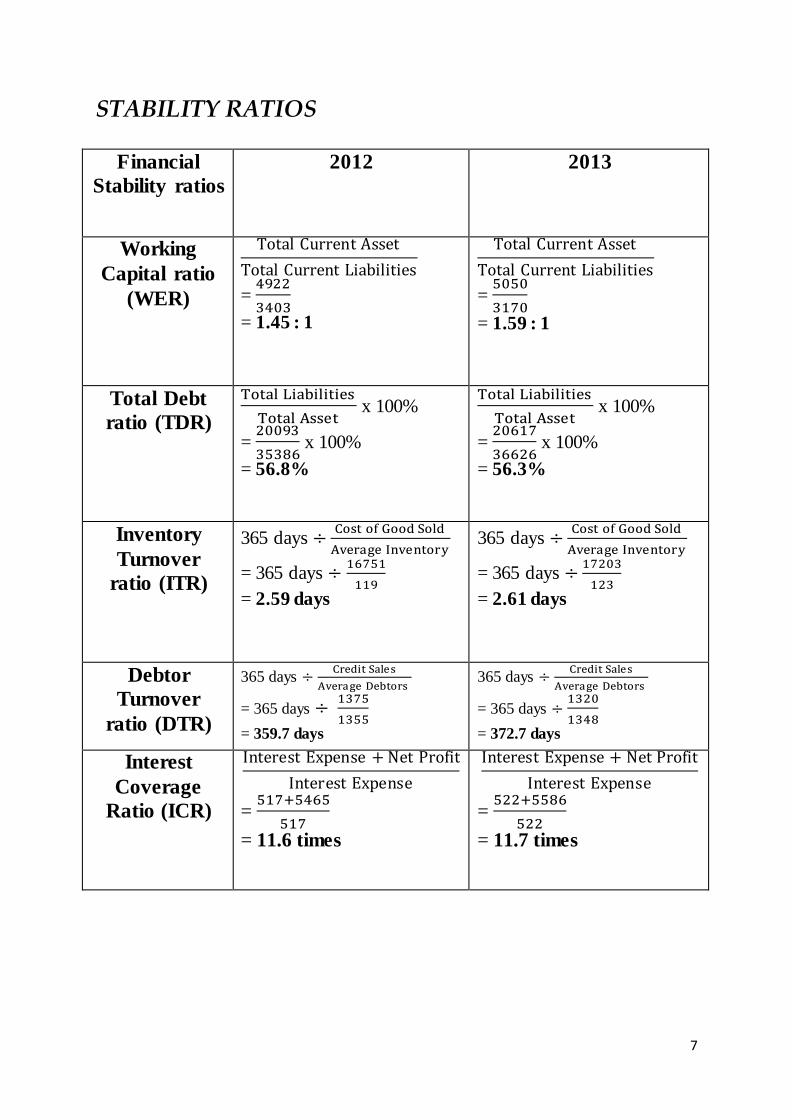
STABILITY RATIOS
Financial
Stability ratios
2012 2013
Working
Capital ratio
(WER)
Total Current Asset
Total Current Liabilities
= 4922
3403
= 1.45 : 1
Total Current Asset
Total Current Liabilities
= 5050
3170
= 1.59 : 1
Total Debt
ratio (TDR)
Total Liabilities
Total Asset x 100%
= 20093
35386 x 100%
= 56.8%
Total Liabilities
Total Asset x 100%
= 20617
36626 x 100%
= 56.3%
Inventory
Turnover
ratio (ITR)
365 days ÷Cost of Good Sold
Average Inventory
= 365 days ÷ 16751
119
= 2.59 days
365 days ÷Cost of Good Sold
Average Inventory
= 365 days ÷17203
123
= 2.61 days
Debtor
Turnover
ratio (DTR)
365 days ÷ Credit Sales
Average Debtors
= 365 days ÷ 1375
1355
= 359.7 days
365 days ÷ Credit Sales
Average Debtors
= 365 days ÷ 1320
1348
= 372.7 days
Interest
Coverage
Ratio (ICR)
Interest Expense + Net Profit
Interest Expense
= 517+5465
517
= 11.6 times
Interest Expense + Net Profit
Interest Expense
= 522+5586
522
= 11.7 times
8
Financial Stability Ratios Interpretation
Working Capital Ratio (WER)
During the 2012-2013 period, the Working Capital Ratio has increased from
1.45: 1 to 1.59: 1. This means that the business ability to pay current liabilities
with current assets is getting better. In addition, it does not satisfy the
minimum requirement of 2: 1.
Total Debt Ratio (TDR)
During the 2012-2013 period, the Total Debt Ratio has decreased from 56.8%
to 56.3%. This means that the business overall liabilities has reduced. In
addition, it is still over 50% maximum limit.
Inventory Turnover Ratio (ITR)
During the 2012-2013 period, the Inventory Turnover Ratio has increased
from 2.59 days to 2.61 days. This means that the business is selling its
products at a slightly slower rate.
Debtor Turnover Ratio (DTR)
During the 2012-2013 period, the Debtor Turnover Ratio has increased from
359.7days to 372.7days. This means that the business is getting slower in
collecting debts.
Interest Coverage Ratio (ICR)
During the 2012-2013 period, the Interest Coverage Ratio has increased from
11.6 times to 11.7 times. This means that the business ability to pay its interest
expenses has become slightly better. In addition, the business satisfies the
minimum requirement of 5 times.
9
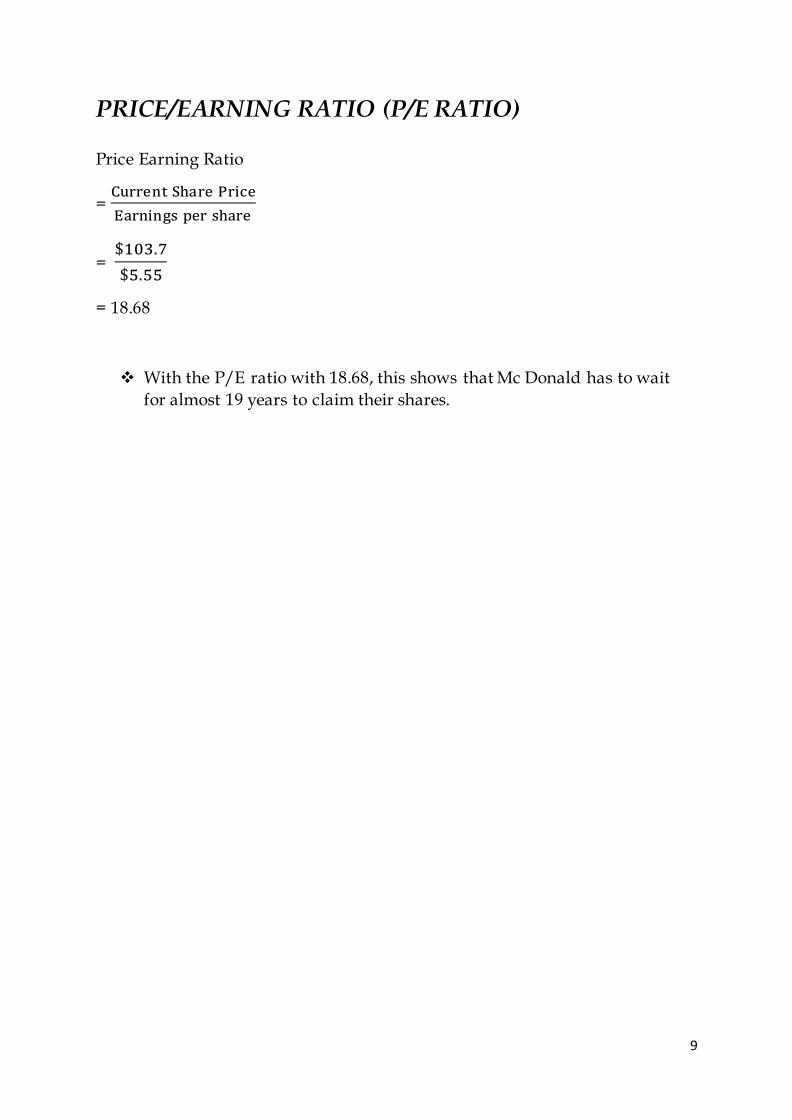
PRICE/EARNING RATIO (P/E RATIO)
Price Earning Ratio
= Current Share Price
Earnings per share
= $103.7
$5.55
= 18.68
With the P/E ratio with 18.68, this shows that Mc Donald has to wait
for almost 19 years to claim their shares.
10
INVESTMENT RECOMMENDATION
From the profitability ratio, the return of equity (ROE) shows that there
was actually a slightly fell on 2013 compare to 2012 and it is bad for their
company. Based on net profit margin (NPM), Mc Donald’s did better at
controlling the expenses on 2013, this is a good thing. And now, take a look at
gross profit margin (GPM), there was a fall on 2013 compare to 2012, this
shows that Mc Donald’s is getting worse at controlling their costs of goods
sold, which is bad. For selling expense ratios (SER), the ability of the
company at controlling their selling expenses is getting worse. However, the
general expense ratio (GER) shows that McDonald’s has improved their
ability at controlling general expenses and it is good. Besides that, the
financial expense ratio (FER) shows that McDonald’s has also improved their
ability at controlling the financial expenses and it is good to the company.
For financial stability ratios, the working capital ratio(WCR) shows
that the WCR of McDonald’s has improved from 1.45:1 to 1.59:1, it doesn’t
satisfy the ratio of 2:1 so this is a good thing, because this company is able to
pay their current liabilities in a shorter time. For total debt ratio (TDR), the
TDR ratio has decreased from 56.8% to 56.3% and it is a good thing, because it
shows that the business is now has a less debt compare to the year before. For
inventory turnover ratio (ITR), the ITR remained unchanged, this shows that
the business was actually selling their products at the same price for the two
years we compared. For debtor turnover ratio (DTR), the DTR has increased
from 359.7 to 372.7 days, this is bad for the business because it means the
business’ ability to collect their debt is getting worsen. For interest coverage
ratio (ICR), the ICR has slightly increased from 11.6 to 11.7 times and this is a
good thing to the business, because this means the business’ ability to pay
their interest expense becomes better than the previous year.
11
APPENDIX
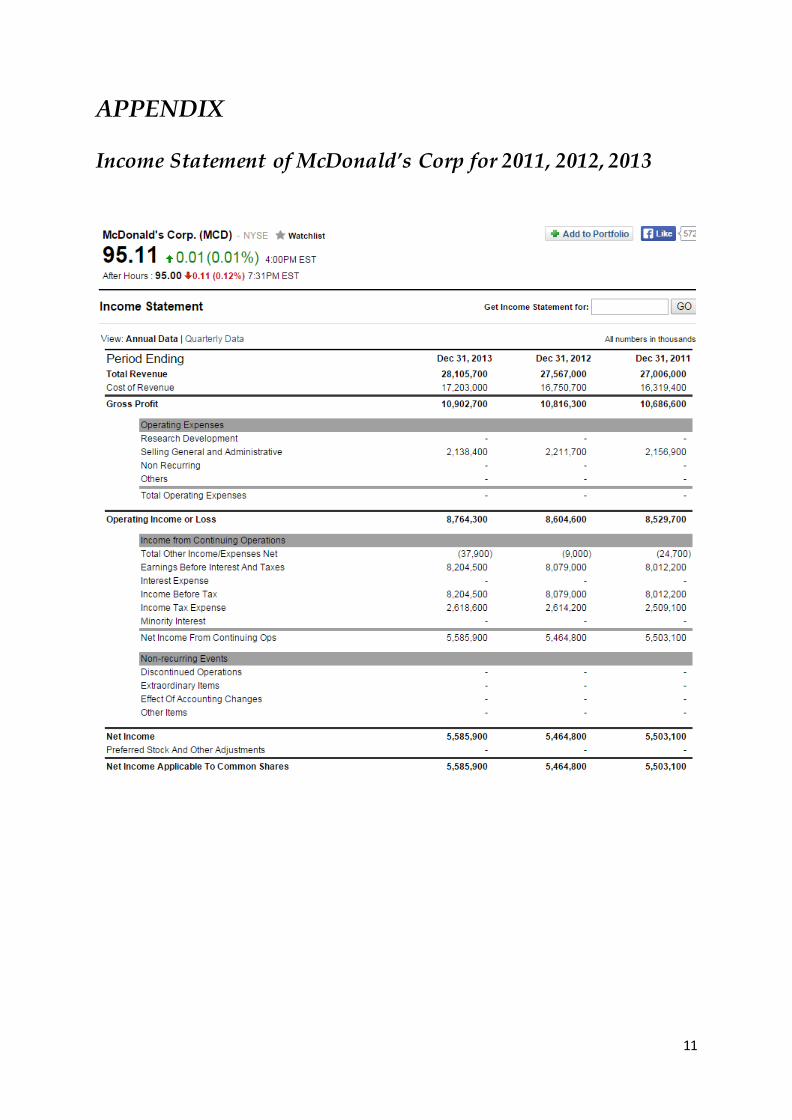
Income Statement of McDonald’s Corp for 2011, 2012, 2013
12
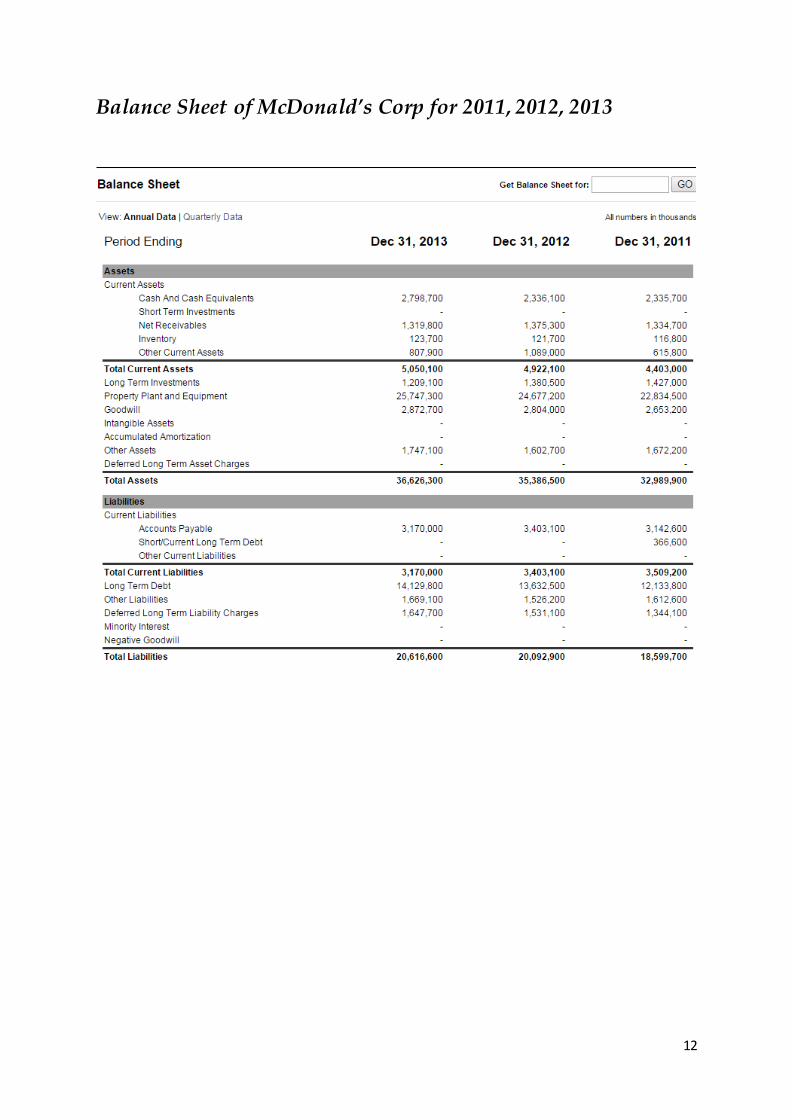
Balance Sheet of McDonald’s Corp for 2011, 2012, 2013
13
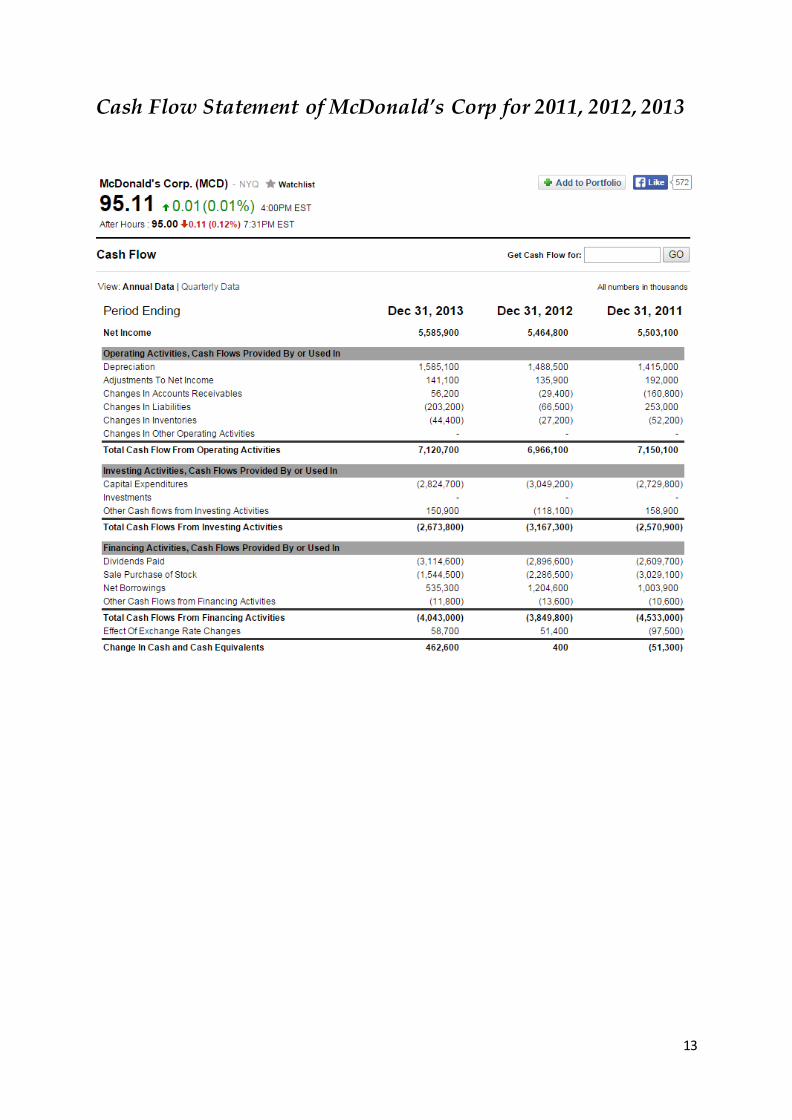
Cash Flow Statement of McDonald’s Corp for 2011, 2012, 2013
14
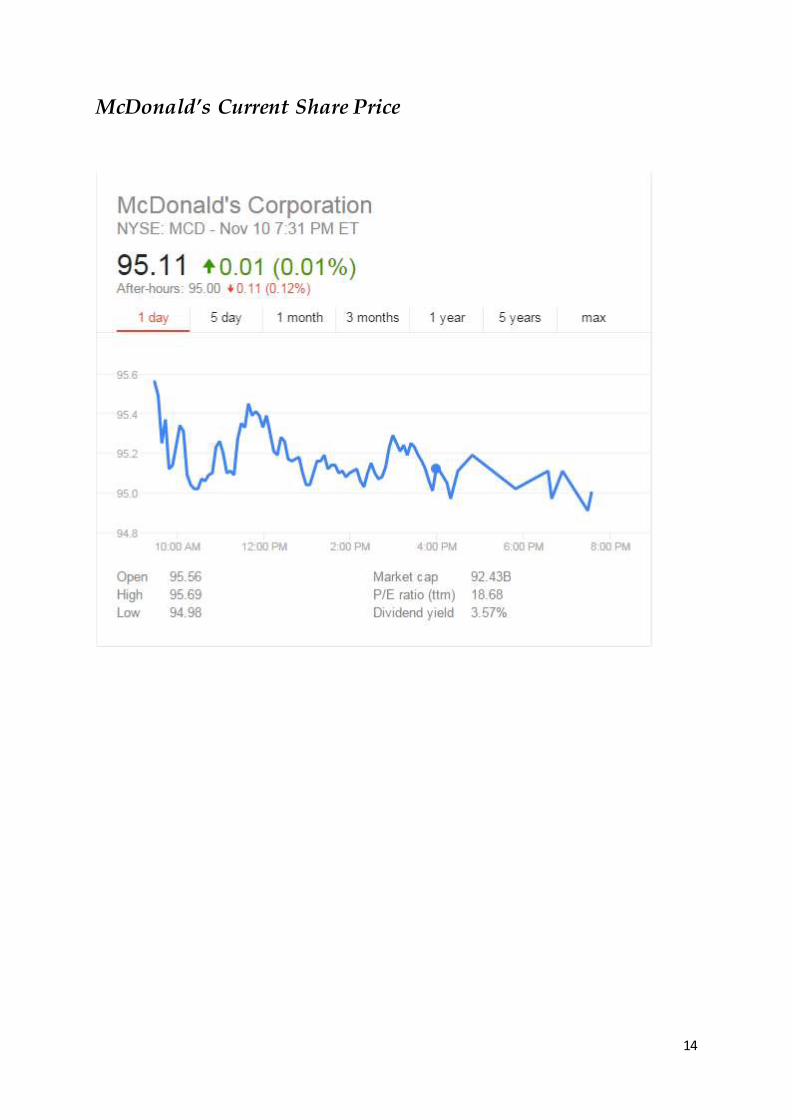
McDonald’s Current Share Price
15
REFERENCES
1. Unknown. (1996, November 10). A brief history of McDonald’s. Retrieved
from http://www.mcspotlight.org/company/company_history.html
2. McDonald’s Plaza. (2010, February 12). McDonald’s Corporation –
company profile, information, business description, history, background
information in McDonald’s Corporation. Retrieved from
http://www.referenceforbusiness.com/history2/56/McDonald-s-
Corporation.html
3. Golden G. (2010, July 23). How much does McDonald’s make? Retrieved
from http://www.celebritynetworth.com/articles/how-much-
does/how-much-does-mcdonalds-make/
4. McDonald’s Corporation. (2014, July 17). 2013 Annual Report, Part 1
Business. Retrieved from
http://www.aboutmcdonalds.com/content/dam/AboutMcDonalds/I
nvestors/McDs2013AnnualReport.pdf
5. Unknown. (2014, November 11). McDonald’s Corp. Retrieved from
http://www.msn.com/en-us/money/stockdetails?symbol=US:MCD
6. Finance Yahoo. (2014, November 11). Income Statement. Retrieved from
http://finance.yahoo.com/q/is?s=MCD+Income+Statement&annual
7. Finance Yahoo. (2014, November 11). Balance Sheet. Retrieved from
http://finance.yahoo.com/q/bs?s=MCD+Balance+Sheet&annual
8. Finance Yahoo. (2014, November 11). Cash Flow. Retrieved from
http://finance.yahoo.com/q/cf?s=MCD+Cash+Flow&annual