Embed Size (px)
Citation preview
1
SCHOOL OF ARCHITECTURE, BUILDING & DESIGN FOUNDATION IN NATURAL & BUILT ENVIRONMENT
August Intake 2014
Semester 2
MODULE: Basic Accounting (ACC30205/FNBE0145)
LECTURER : Mr. Chang Jau Ho
ASSIGNMENT: Financial Ratio Analysis
Company: QL Resources
WORD COUNT: 1669 words SUBMISSION DATE: June 4th, 2015 (Week 16)
GROUP MEMBERS: AMANDA CHIONG (0320328)
BRIDGET HSU (0320218)
CHAU XET NEE (0320222)
2
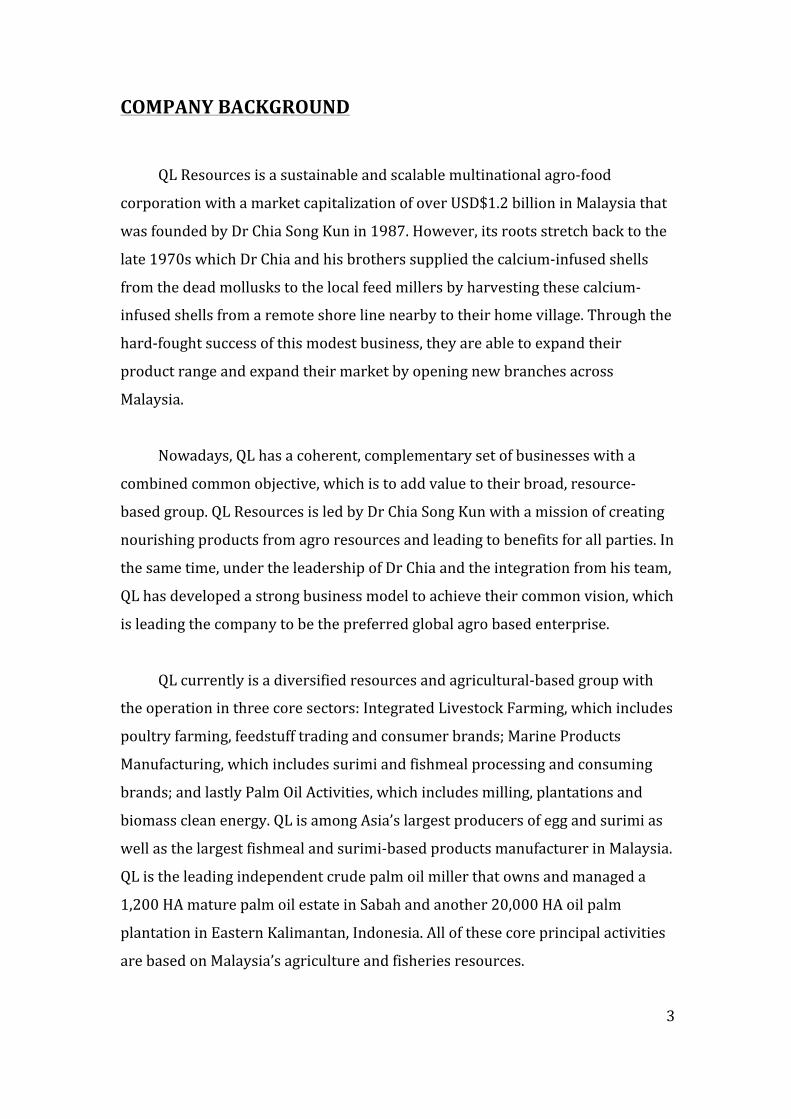
CONTENTS
TITLE PAGE
COMPANY BACKGROUND 3-‐4
RECENT DEVELOPMENT 5
RATIO ANALYSIS & P/E RATIO 6-‐7
INVESTMENT RECOMMENDATION 8
APPENDIX APPENDIX A : CALCULATION
APPENDIX B : CONSOLIDATED BALANCE SHEET APPENDIX C : CONSOLIDATED STATEMENTS OF
INCOME
9-‐14
REFERENCE 15
3
COMPANY BACKGROUND
QL Resources is a sustainable and scalable multinational agro-‐food
corporation with a market capitalization of over USD$1.2 billion in Malaysia that
was founded by Dr Chia Song Kun in 1987. However, its roots stretch back to the
late 1970s which Dr Chia and his brothers supplied the calcium-‐infused shells
from the dead mollusks to the local feed millers by harvesting these calcium-‐
infused shells from a remote shore line nearby to their home village. Through the
hard-‐fought success of this modest business, they are able to expand their
product range and expand their market by opening new branches across
Malaysia.
Nowadays, QL has a coherent, complementary set of businesses with a
combined common objective, which is to add value to their broad, resource-‐
based group. QL Resources is led by Dr Chia Song Kun with a mission of creating
nourishing products from agro resources and leading to benefits for all parties. In
the same time, under the leadership of Dr Chia and the integration from his team,
QL has developed a strong business model to achieve their common vision, which
is leading the company to be the preferred global agro based enterprise.
QL currently is a diversified resources and agricultural-‐based group with
the operation in three core sectors: Integrated Livestock Farming, which includes
poultry farming, feedstuff trading and consumer brands; Marine Products
Manufacturing, which includes surimi and fishmeal processing and consuming
brands; and lastly Palm Oil Activities, which includes milling, plantations and
biomass clean energy. QL is among Asia’s largest producers of egg and surimi as
well as the largest fishmeal and surimi-‐based products manufacturer in Malaysia.
QL is the leading independent crude palm oil miller that owns and managed a
1,200 HA mature palm oil estate in Sabah and another 20,000 HA oil palm
plantation in Eastern Kalimantan, Indonesia. All of these core principal activities
are based on Malaysia’s agriculture and fisheries resources.
4
QL operates in and supplies to Malaysia, Indonesia, Vietnam and China.
However, its market penetration is transcontinental. For instance, the livestock
sector is responsible in supplying eggs to neighboring ASEAN countries including
Philippines, Singapore, Cambodia, Brunei and further afield to Hong Kong. In the
other hand, the company’s fisheries sector supplies fishmeal, surimi and frozen
food to countries including Japan, Korea, Singapore, Pakistan, Bangladesh, Spain,
Portugal and North America. For the palm oil sector, the development is recently
focusing in Sabah, Malaysia and Eastern Kalimantan, Indonesia. QL is a pioneer of
the field in clean energy palm biomass fuel and has a global market for its
solution. All of these activities are well aligned with government initiatives to
grow the field of agriculture and also the fisheries industries. Other than that, tax
incentives are available for these sectors, which are subsidies by the government
in purpose to encourage their core activities.
5
RECENT DEVELOPMENT
QL Resources has acquired a stake in property developer SunsuriaBhd recently, which is embarking on the Xiamen University Malaysia Campus property development project in Sepang. QL know the major shareholder of Sunsuria, Datuk Ter Leong Yap with a 50.12% of the company and have confidence in his ability to deliver on the property projects. QL’s substantial shareholders had bought a stake of more than 5% in Sunsuria via it’s private investment company, Ruby Technique Sdn Bhd. Sunsuria’s share price has been rising recently. On the March of 2015, the stock was only trading at RM1.50 level and it has increased to 56.49% on a year-‐to-‐date basis. Its’ share price has increased recently to RM2.05. The company principal activity has been changed from a wooden and fire rated door-‐maker to property development and this changers has improved the earnings of the corporation. The company’s net profit has increased to 138.54% to RM3 millions for the nine months to Dec 31st, 2015, which on the back of a 271.93% increase to RM56.03 millions in revenue. QL’s net profit has rose 24.67% to RM55.62 millions on the back of a 10.09% increase in revenue to RM732.82 millions. Other than that, QL has failed in its project to takeover bid of fellow poultry player Lay Hong Bhd. Since then, Lay Hong has proposed a 15% share placement which in turn will reduce 38% of QL’s current stake in the company.
6
PROFITABILTY
Stability Financial
Stability Ratio
2013
2014
Interpretation
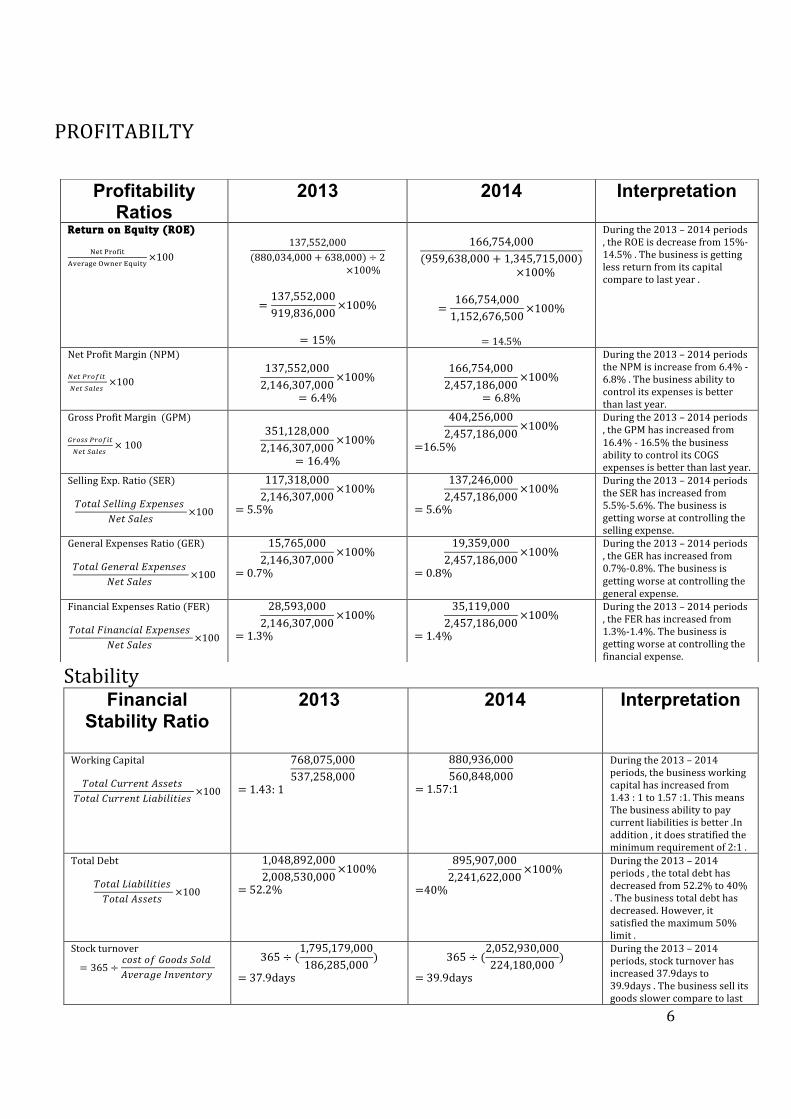
Working Capital 𝑇𝑜𝑡𝑎𝑙 𝐶𝑢𝑟𝑟𝑒𝑛𝑡 𝐴𝑠𝑠𝑒𝑡𝑠
𝑇𝑜𝑡𝑎𝑙 𝐶𝑢𝑟𝑟𝑒𝑛𝑡 𝐿𝑖𝑎𝑏𝑖𝑙𝑖𝑡𝑖𝑒𝑠 ×100
768,075,000537,258,000
= 1.43: 1
880,936,000560,848,000
= 1.57:1 = ====
During the 2013 – 2014 periods, the business working capital has increased from 1.43 : 1 to 1.57 :1. This means The business ability to pay current liabilities is better .In addition , it does stratified the minimum requirement of 2:1 .
Total Debt
𝑇𝑜𝑡𝑎𝑙 𝐿𝑖𝑎𝑏𝑖𝑙𝑖𝑡𝑖𝑒𝑠 𝑇𝑜𝑡𝑎𝑙 𝐴𝑠𝑠𝑒𝑡𝑠 ×100
1,048,892,0002,008,530,000
×100%
= 52.2%
895,907,0002,241,622,000
×100%
=40%
During the 2013 – 2014 periods , the total debt has decreased from 52.2% to 40% . The business total debt has decreased. However, it satisfied the maximum 50% limit .
Stock turnover
= 365 ÷𝑐𝑜𝑠𝑡 𝑜𝑓 𝐺𝑜𝑜𝑑𝑠 𝑆𝑜𝑙𝑑 𝐴𝑣𝑒𝑟𝑎𝑔𝑒 𝐼𝑛𝑣𝑒𝑛𝑡𝑜𝑟𝑦
365 ÷ (1,795,179,000186,285,000
)
= 37.9days
365 ÷ (2,052,930,000224,180,000
)
= 39.9days
During the 2013 – 2014 periods, stock turnover has increased 37.9days to 39.9days . The business sell its goods slower compare to last
Profitability Ratios
2013
2014
Interpretation
Return on Equity (ROE)
!"# !"#$%&
!"#$%&# !"#$% !"#$%&×100
137,552,000
(880,034,000 + 638,000) ÷ 2×100%
=137,552,000919,836,000
×100%
= 15%
166,754,000
(959,638,000 + 1,345,715,000)×100%
=166,754,0001,152,676,500
×100%
= 14.5%
During the 2013 – 2014 periods , the ROE is decrease from 15%-‐14.5% . The business is getting less return from its capital compare to last year .
Net Profit Margin (NPM) !"# !"#$%&
!"# !"#$% ×100
137,552,0002,146,307,000
×100%
= 6.4%
166,754,0002,457,186,000
×100%
= 6.8%
During the 2013 – 2014 periods the NPM is increase from 6.4% -‐ 6.8% . The business ability to control its expenses is better than last year.
Gross Profit Margin (GPM) !"#$$ !"#$%&
!"# !"#$% × 100
351,128,0002,146,307,000
×100%
= 16.4%
404,256,0002,457,186,000
×100%
=16.5%
During the 2013 – 2014 periods , the GPM has increased from 16.4% -‐ 16.5% the business ability to control its COGS expenses is better than last year.
Selling Exp. Ratio (SER) 𝑇𝑜𝑡𝑎𝑙 𝑆𝑒𝑙𝑙𝑖𝑛𝑔 𝐸𝑥𝑝𝑒𝑛𝑠𝑒𝑠
𝑁𝑒𝑡 𝑆𝑎𝑙𝑒𝑠 ×100
117,318,0002,146,307,000
×100%
= 5.5%
137,246,0002,457,186,000
×100%
= 5.6%
During the 2013 – 2014 periods the SER has increased from 5.5%-‐5.6%. The business is getting worse at controlling the selling expense.
General Expenses Ratio (GER) 𝑇𝑜𝑡𝑎𝑙 𝐺𝑒𝑛𝑒𝑟𝑎𝑙 𝐸𝑥𝑝𝑒𝑛𝑠𝑒𝑠
𝑁𝑒𝑡 𝑆𝑎𝑙𝑒𝑠 ×100
15,765,0002,146,307,000
×100%
= 0.7%
19,359,0002,457,186,000
×100%
= 0.8%
During the 2013 – 2014 periods , the GER has increased from 0.7%-‐0.8%. The business is getting worse at controlling the general expense.
Financial Expenses Ratio (FER) 𝑇𝑜𝑡𝑎𝑙 𝐹𝑖𝑛𝑎𝑛𝑐𝑖𝑎𝑙 𝐸𝑥𝑝𝑒𝑛𝑠𝑒𝑠
𝑁𝑒𝑡 𝑆𝑎𝑙𝑒𝑠 ×100
28,593,0002,146,307,000
×100%
= 1.3%
35,119,0002,457,186,000
×100%
= 1.4%
During the 2013 – 2014 periods , the FER has increased from 1.3%-‐1.4%. The business is getting worse at controlling the financial expense.
7
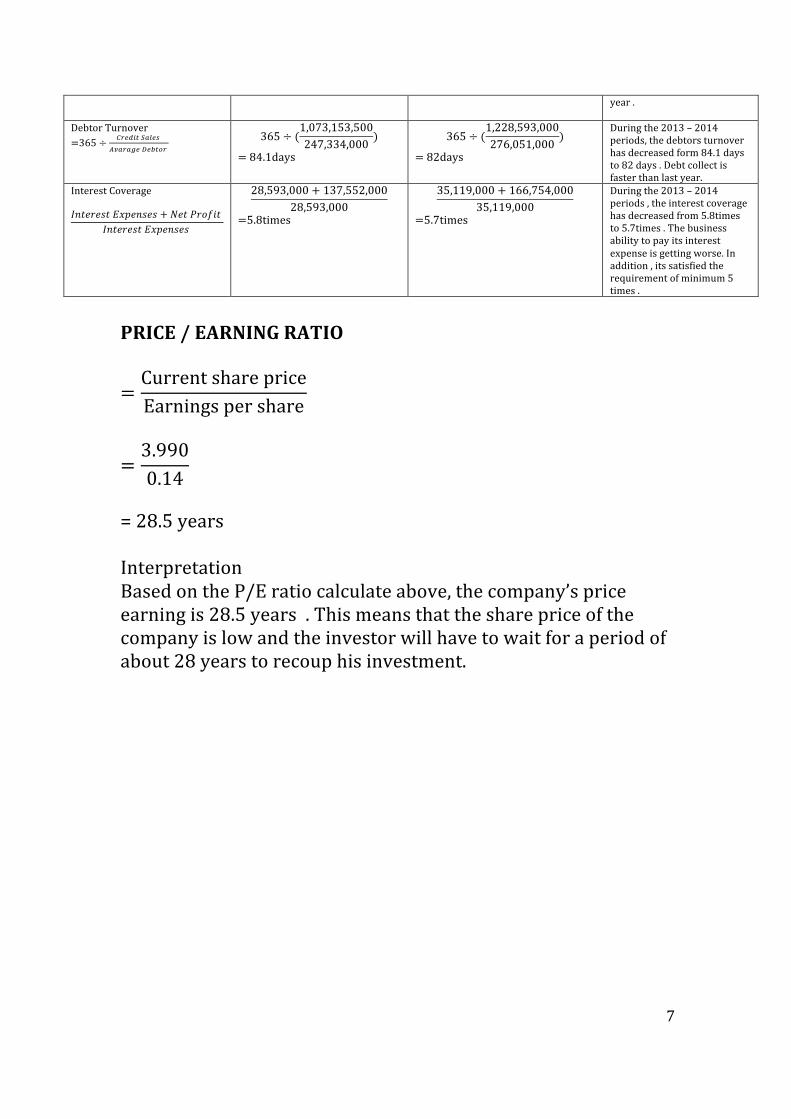
year .
Debtor Turnover =365 ÷ !"#$%& !"#$%
!"#$#%& !"#$%&
365 ÷ (1,073,153,500247,334,000
)
= 84.1days
365 ÷ (1,228,593,000276,051,000
)
= 82days
During the 2013 – 2014 periods, the debtors turnover has decreased form 84.1 days to 82 days . Debt collect is faster than last year.
Interest Coverage 𝐼𝑛𝑡𝑒𝑟𝑒𝑠𝑡 𝐸𝑥𝑝𝑒𝑛𝑠𝑒𝑠 + 𝑁𝑒𝑡 𝑃𝑟𝑜𝑓𝑖𝑡
𝐼𝑛𝑡𝑒𝑟𝑒𝑠𝑡 𝐸𝑥𝑝𝑒𝑛𝑠𝑒𝑠
28,593,000 + 137,552,00028,593,000
=5.8times
35,119,000 + 166,754,00035,119,000
=5.7times
During the 2013 – 2014 periods , the interest coverage has decreased from 5.8times to 5.7times . The business ability to pay its interest expense is getting worse. In addition , its satisfied the requirement of minimum 5 times .
PRICE / EARNING RATIO
=Current share priceEarnings per share
=3.9900.14
= 28.5 years Interpretation Based on the P/E ratio calculate above, the company’s price earning is 28.5 years . This means that the share price of the company is low and the investor will have to wait for a period of about 28 years to recoup his investment.
8
Investment recommendation
During the year 2013 and 2014. There is moderately change in the gross profit margin. During the period 2013 and 2014 the GPM has increased from 16.4 to 16.5%. This shows that QL company has better ability to control it's expenses is better than last year. Besides that , there was a slight decrease in return of equity (ROE) which is 15%-‐14.5%.As a result the business is getting less return from its capital in the year of 2013 compare to the year of 2014 . On the stability ratio side , working capital was increasing from 1.43:1 to 1.57:1 . Hence , both of the ratios did not reach the minimum requirement of 2:1 and this show that QL company has a hard time to pay liabilities with current assets therefore , the total debt of the company has decreased from 52.2% to 40% . However, it satisfied the maximum 50% limit . The selling rate of QL company product has getting slower which has increasing from 37.9 days to 39.9 days . Other than that the interest coverage of year 2013 has slightly drop from 5.8times to 5.7times . It mean that the business ability to pay its interest expense is getting worse. In addition , its satisfied the minimum requirement of 5 times . Therefore , QL company does not have any problem of paying interest . From the analysis , QL company has a moderate of stability ratio .
As a conclusion, QL company has shown moderate potential in profitability ratios and financial stability ratio in their investment . However, I think it is not wise to invest in QL company because it required a long period of about 29 years for the investor to recoup their investment, company share price is RM3.99 per share which consider low .
9
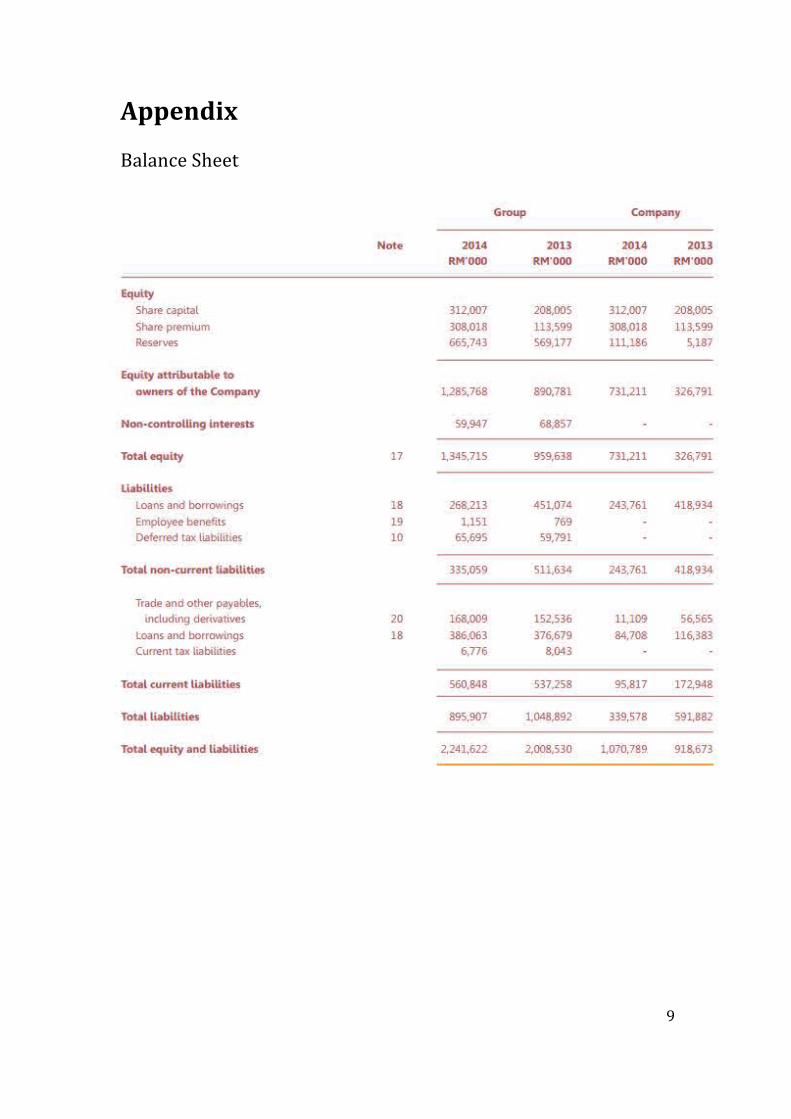
Appendix Balance Sheet
10
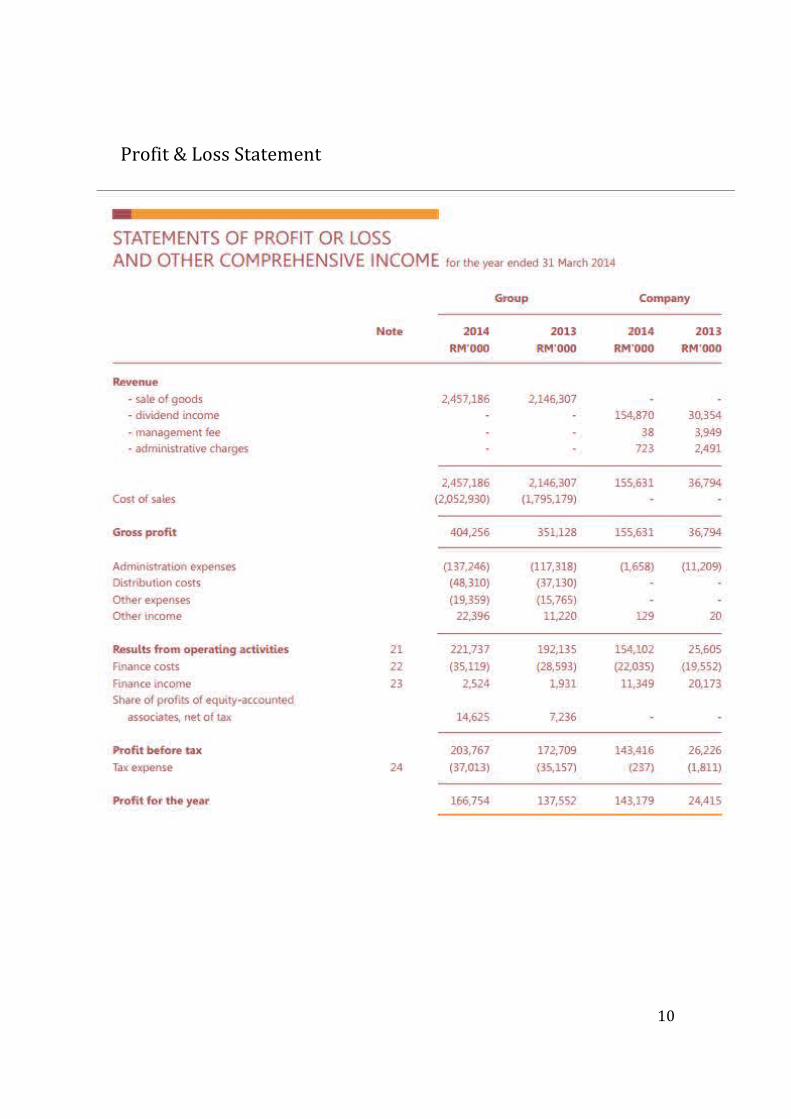
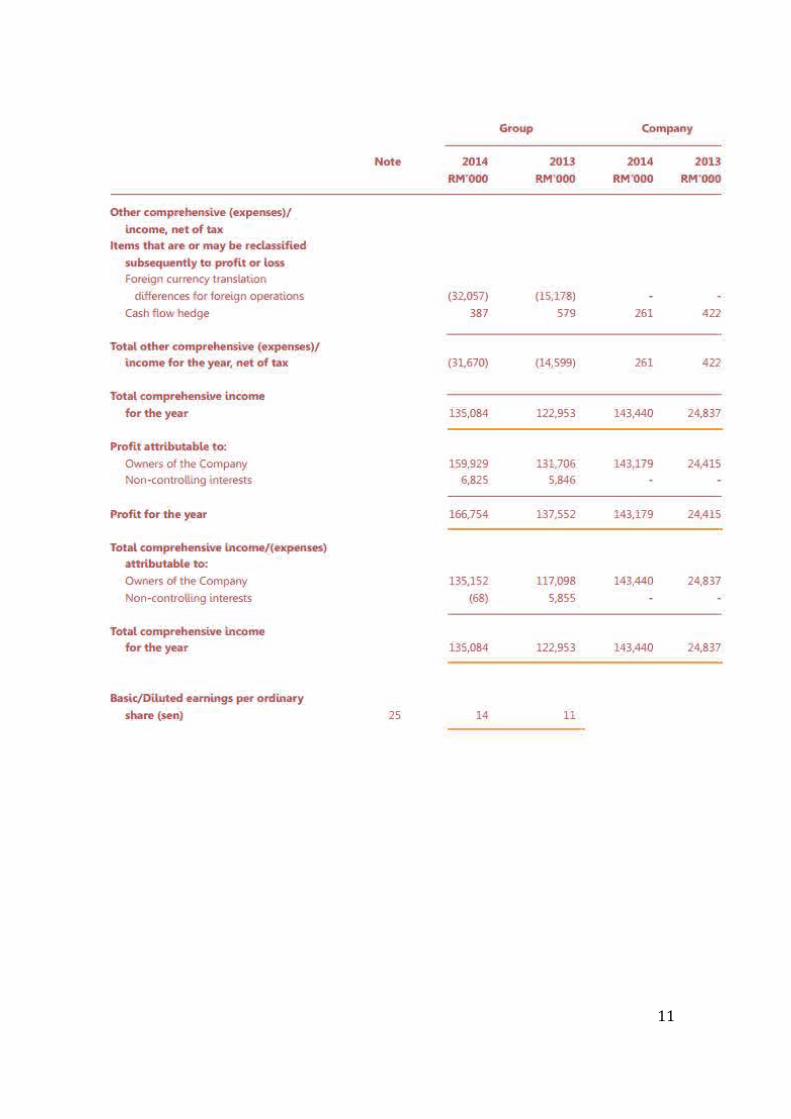
Profit & Loss Statement
11
12
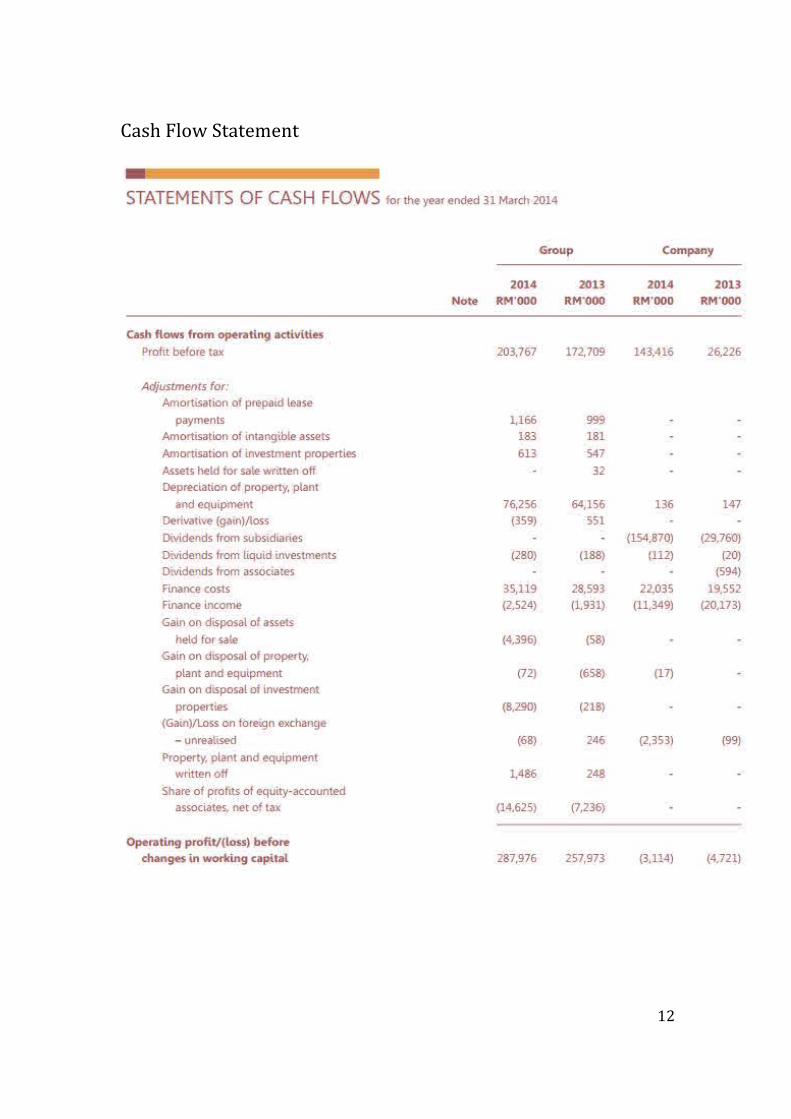
Cash Flow Statement
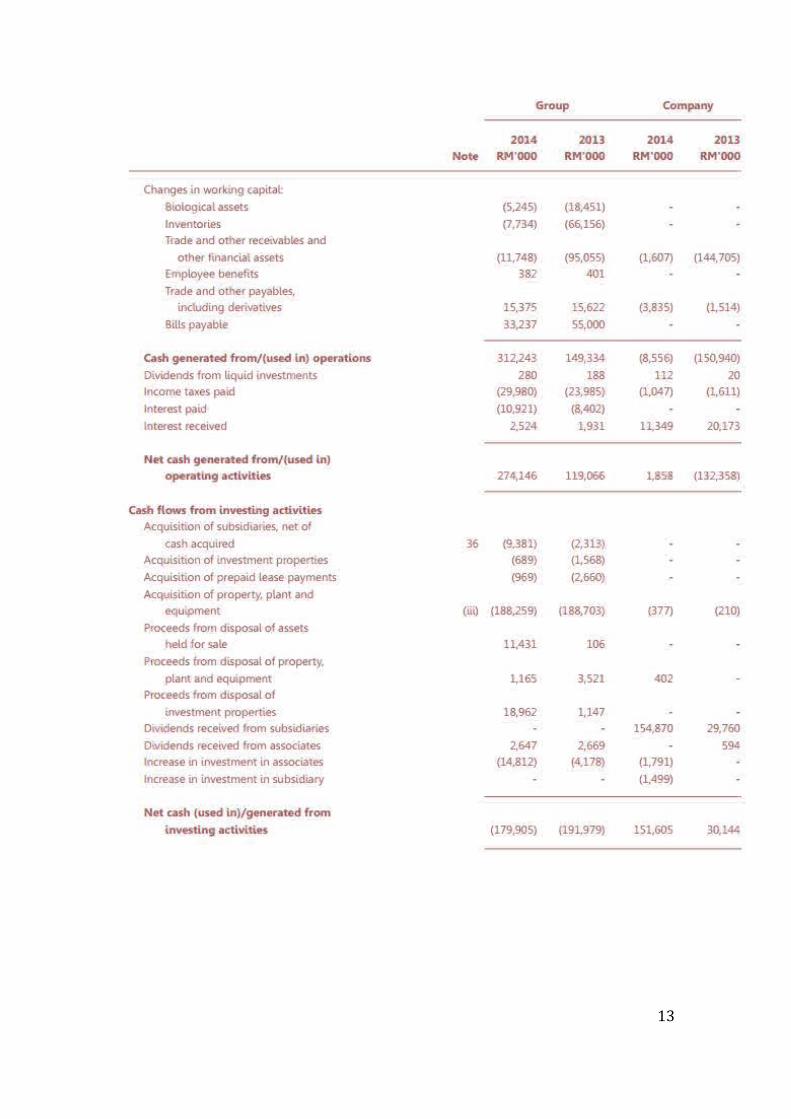
13
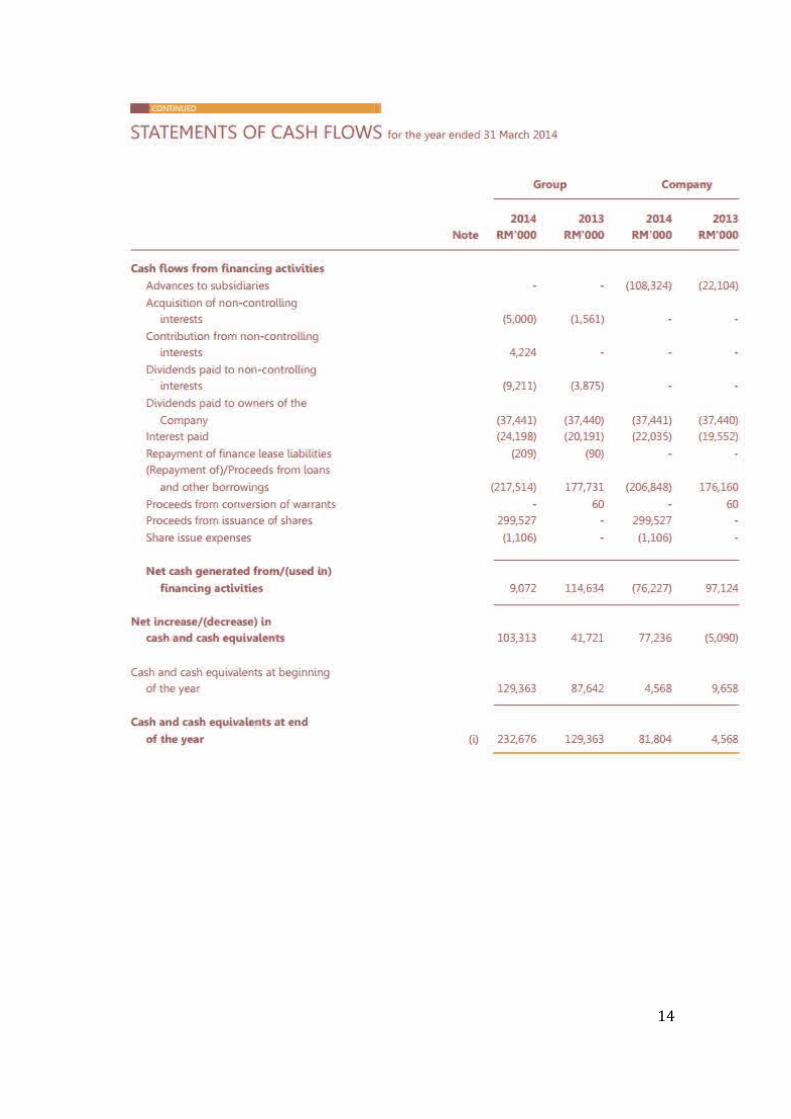
14
15
References (n.d.). Retrieved May 28 , 2015, from http://www.ql.com.my/ QL substantial shareholders take up stake in Sunsuria - Business News | The Star Online. (n.d.). Retrieved May 28, 2015, from http://www.thestar.com.my/Business/Business-News/2015/04/27/QL-to-take-up-stake-in-Sunsuria/?style=biz Profile: QL Resources Bhd (QRES.KL). (n.d.). Retrieved May 30, 2015, from http://in.reuters.com/finance/stocks/companyProfile?symbol=QRES.KL Share Price Movement. (n.d.). Retrieved June 1, 2015, from http://www.malaysiastock.biz/Corporate-Infomation.aspx?type=A&value=Q&securityCode=7084