Embed Size (px)
Citation preview
THE TIMES OF INDIA | NEW DELHITHURSDAY | JUNE 9, 2011
Education is seen as the passport to a golden future, but millions in India cannot access it beyond the entry level
TIMES NEWS NETWORK
India’s education system is stag-geringly huge. Its 300 million stu-dents and 6.5 million teachers couldmake up the world’s fourth largestcountry. In this otherwise sleepybehemoth, far-reaching changes
have been taking place in recent years. Enrolment in primary classes is touch-
ing 100%. Over 120 million kids are get-ting free mid-day meals at school. The lit-eracy rate has increased to almost 75%.The right to education has been enshrinedas a law. There has been a surge of inter-est and attention towards education, large-ly because people no longer are willing tolet their children stagnate in backward-ness. Education is increasingly being seenas the door to a better life.
This momentum and the accompany-ing euphoria, however, hide a stark truththat many are unable to see: that the ed-ucation system continues to suffer fromfour great divides. These are — rural-urban, men-women, rich-poor and between castes. These divides are builtinto the system. As a result, vast millionson the wrong side of these divides are denied the benefits of modern education,their dream of prosperity crushed.
� DALITS AND TRIBALSTake the case of scheduled castes andtribes. They account for about a quarterof the population. Recent years have seenan intense urge in them to get educated.At the elementary (Class VIII) level, gross
enrolment ratios, that is, the ratio of thoseenrolled to the total number of childrenin the 6-14 year age group, have increasedat a faster rate for dalits and tribals thanfor other sections.
But look beyond the elementary leveland you see a grim picture. The drop-outrate for dalits is about 53% and for tribalsa staggering 63%. This is way above theaverage for the country, which is 43%, initself a pretty high figure. In some largestates like Uttar Pradesh, Bihar, and Rajasthan, over 50% of dalit children donot go beyond Class V. In other words, vul-nerable sections like dalits and tribals,who are also among the poorest, are notable to continue educating their children.
We are talking about dropouts and not
children who haven’t ever been to school.Estimates of out-of-school-children areshrouded in mystery. There were about 3crore in 2001-02. According to the gov-ernment, this had dropped to just 28.7 lakhin 2009. But an independent survey by theIndian Market Research Bureau in 2009found that over 81 lakh were out of school.
� THE GENDER DIVIDEThe gender divide is starkly brought outby the fact that in the age group 5-29 years,about 57% of males were enrolled in educational institutions as opposed to 50%females. Even among those enrolled, only48% females were attending classes as op-
posed to 51% males. These are results ofan NSSO study in 2007-08.
The legacy of past discriminationagainst women remains visible in today’snumbers. According to Census 2011 data,among those above 7 years of age, thereare 17.6 crore illiterate women in the coun-try compared to about 9.7 crore men.
� RICH-POOR AND RURAL-URBANIn rural areas, over 51% of the poorest areilliterate and a minuscule 0.4% have gonebeyond higher secondary. Among the rich-est, about 23% are illiterate but nearly 9%have completed post-school studies.
In the urban areas, the situation is dra-matically different. Though 42% of thepoorest are illiterate, the proportion of il-literates among the richest is only7%. Just 1.5% of the poorest havecompleted higher studies but 42%of the richest have done so.
Even geography seems to beagainst the poor. In rural areas,almost all people — rich and poor
alike — have a primary school within 2km of their residence. But secondaryschools are in a different league. While59% of the richest have a secondary schoolwithin 2 km, only 39% of the poorest do.
� TECHNICAL GLITCHIt would be logical for policymakers
to believe that providing technical and vocational education to the poor wouldlift them out of poverty, with subsequenthelp. But the state of technical educa-tion in the country causes dismay.
Just 1.9% of all students enrolled inthe country get technical education, whilethose receiving vocational education area mere 0.3%. In all, just about 2% of thecountry’s population has ever received
technical training of any kind. Besidesthe paucity of technical institutions likeITIs and polytechnics, the high fees in tech-nical and professional institutions is sure-ly a cause for this abysmal state of affairs.
According to the NSSO report of 2007-08, the average annual spending by a fam-ily on technical education for their son ordaughter is Rs 19,989 in case of govern-ment institutions and a back-breaking Rs 38,675 for those studying in a privateunaided institution. Who among the poor-er can afford this kind of expenditure?
These averages are much higher in urban areas where most technical edu-cation institutions are located. Studyingin a private unaided institution in an ur-ban area means spending Rs 43,058 on av-
erage. This average hides therange between top-class institutions and lesser ones.
� QUALITY CRUNCHThe rush by the government tochurn out numbers has hit the
quality of education hard. A recent sur-vey of learning outcomes of school chil-dren reported in the Annual Survey of Ed-ucation-Rural revealed that about half ofthose in Class V could read only Class IItexts and the proportion of kids who couldsolve a simple division sum in Class V haddeclined. In short, the standard of learn-ing is low and dipping further.
Although a new national curricularframework was adopted in 2005, only lipservice is being paid to its approach. Un-trained and demotivated teachers are ig-noring it, as are text book publishers andsyllabus makers. The number of teachersneeded for unrolling the RTE is estimat-ed at 20 lakh and the standards of teachereducation are being lowered to hastily fillthe gap. A study by the National Univer-sity of Educational Planning & Admin-istration found that of the 47 lakh ele-mentary school teachers, nearly 25% havenot studied beyond the secondary level.Another quarter have just completed theirhigher/senior secondary level.
2REALITY CHECK
EDUCATION
There is a view that at last the govern-ment has realized the importance ofeducation and is channeling huge
amounts of money into the sector. This isfar from the truth. The latest EconomicSurvey notes that the combined spendingon education by the central and state gov-ernments is projected at just short of 3%of the gross domestic product (GDP) for2010-11. It is about 11% of all governmentspending. This spend is nothing spectacu-lar — way back in 1991-92, education spend-ing had inched up to3.8% of GDP andover 13% of publicspending.
What this meansis that despite the highgrowth trajectory of theIndian economy, essential problems likeproviding quality education for all are notreceiving adequate resources. Not onlydoes this restrict the opportunity of edu-cation, it also affects quality.
With people thirsting for better edu-cation, there is only one way this playsout — higher costs for better education.As a recent NSSO study revealed, the average cost for general education (nottechnical) has increased by 176% in ruralareas and 204% in urban areas between1995-96 and 2007-08. This increase hasthe net effect of preventing large sec-tions of people from joining the educa-tional mainstream.
THE FUNDING DEFICIT
To apply or nominate for the awards, go totimessocialawards.com. You can log in via Twitter, Facebook,itimes, indiatimes or TOI IDs. If you do not have an account
on these, please click “More Login Options” and select‘Connect with Times of India’ and join as a new member
Class Act? That’s A Cruel Joke
social impactawards
DIVIDE AND RUEDrop-out Rates by Class 8
43%
53%
63%
All
Scheduled Castes
Scheduled TribesSource: SES, MHRD
Poorest 10% 588 1346
Richest 10% 4738 15834
Rural Urban
GENDER DIVIDE |Illiteracy Above Age 7
Male
9.7cr
Female
17.6cr
Source: Census 2011
Expenditure on Education (Centre + States)
Year % of GDP % of All Public Exp
1951-52 0.6 7.9
1961-62 1.5 11.7
1971-72 2.3 9.5
1981-82 2.8 10.3
1991-92 3.8 13.1
2001-02 3.8 12.9
2008-09 2.9 10.1
2010-11 BE 3.0 11.3
Source: Economic Survey, various years
Source: NSSO Report No.532, 2007-08
Total | 27.3cr
Private Spending on Education
1995-96 2007-08 Increase (%)
Rural 570 1551 172
Urban 1686 5128 204
India 904 2461 172
Rs /Annum
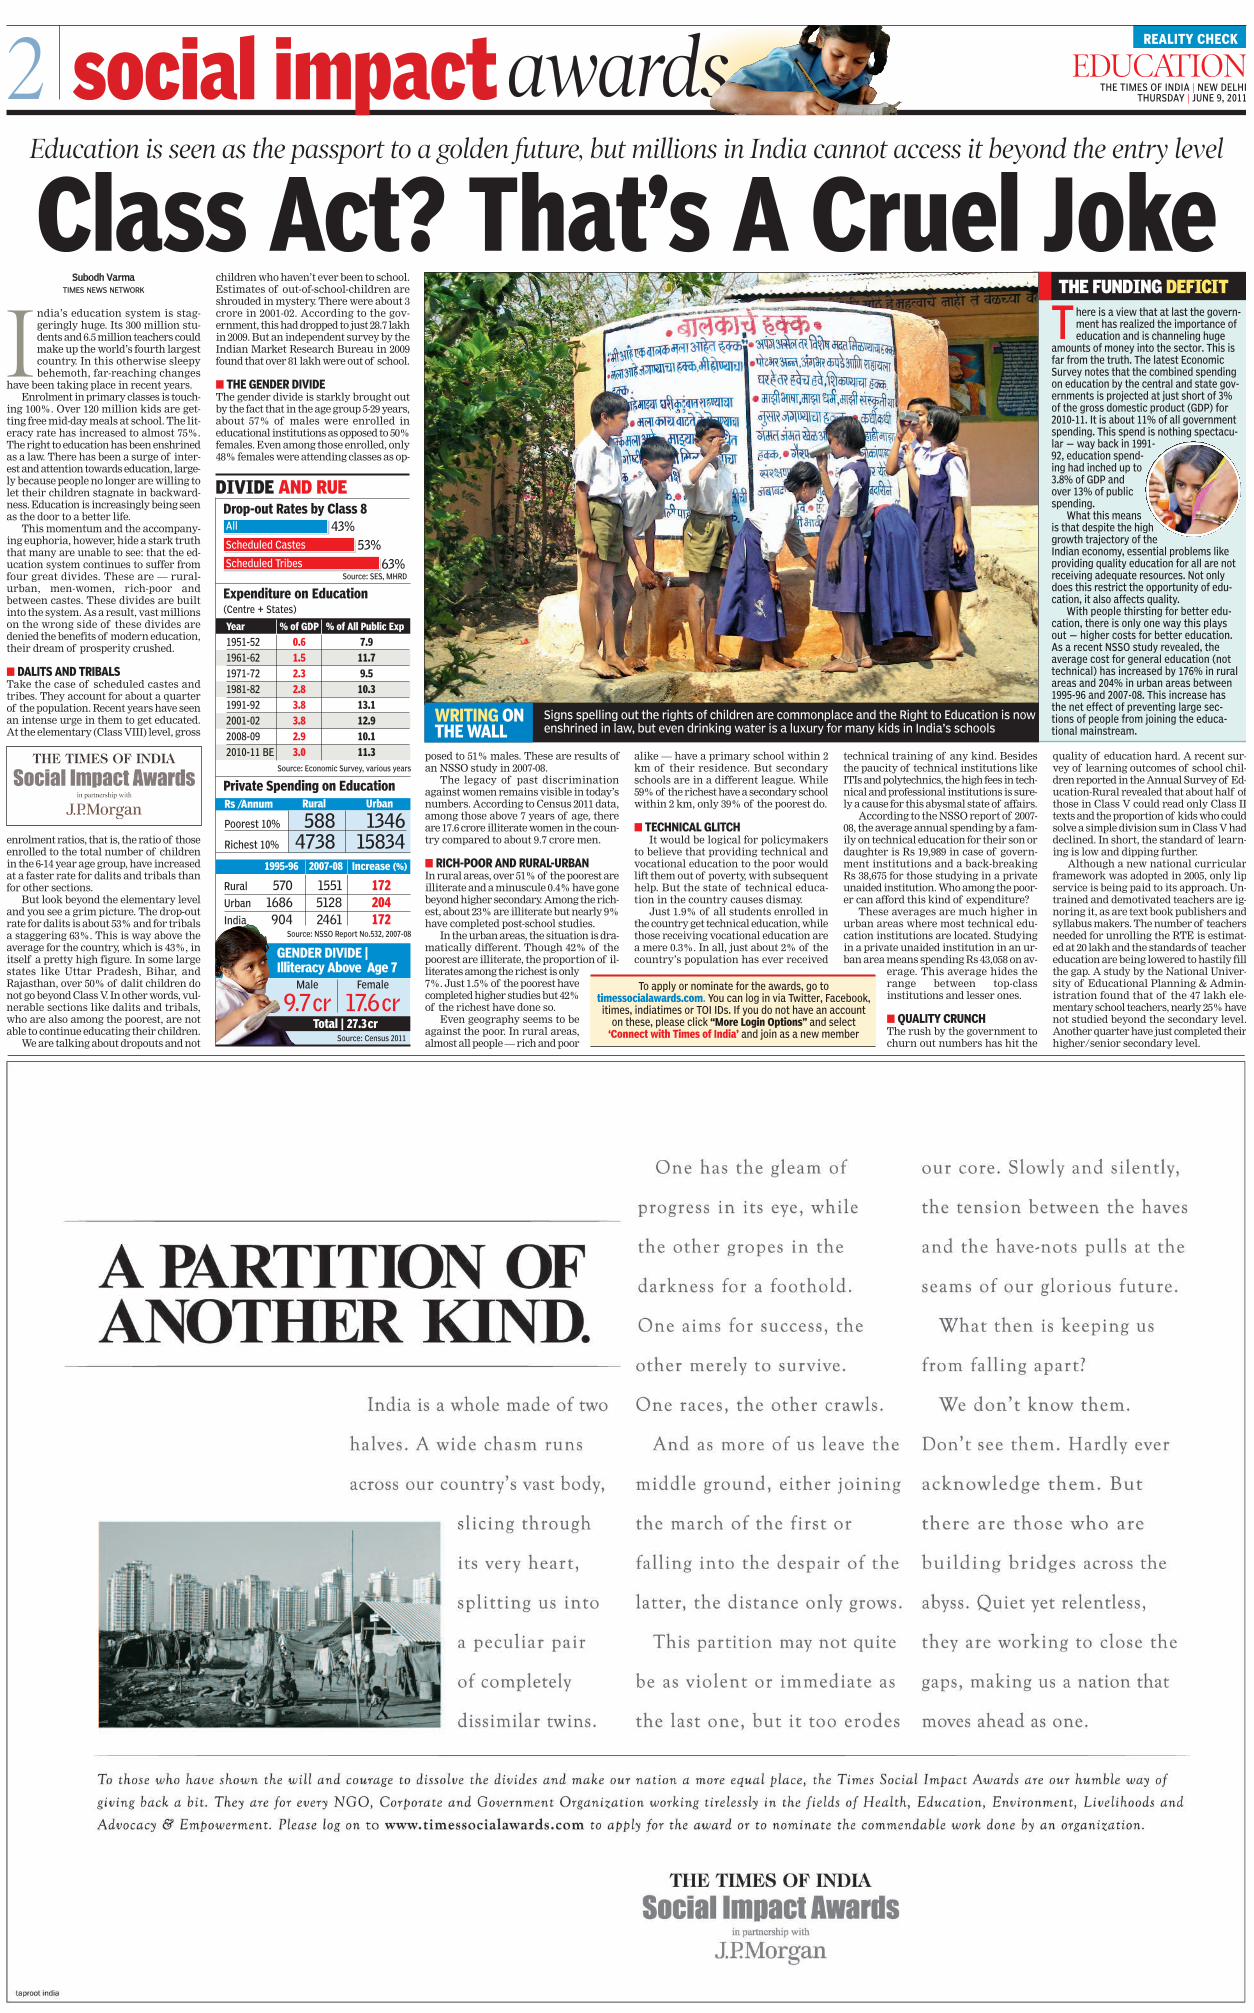
WRITING ONTHE WALL
Signs spelling out the rights of children are commonplace and the Right to Education is nowenshrined in law, but even drinking water is a luxury for many kids in India’s schools
One has the g leam of
pro gress in its eye , while
the other gropes in the
darkness for a foothold.
One aims for success , the
other merel y to survive.
One races , the other crawls.
And as more o f us leave the
middle ground , either jo in ing
the march of the first or
falling into the despair of the
latter , the distance only grows.
This partition may not quite
be as violent or immediate as
the last one , but it too erodes
our core, Slowly and silentl y,
the tension between the haves
and the have-nots pulls at the
seams of our glorious future.
What then is keep ing us
from falling apart?
We don ’t t know them.
Don ’t t see them. Hardl y ever
acknowled ge them . But
there are those who are
buildin g bridges across the
abyss, Quiet yet relentless ,
they are working to close the
gaps , making us a nation that
moves ahead as one.
To those who have shown the wil l and courage to dissolve the divides and make our nation a more equal place , the Times Social I mpact Awards are our humble way of
giving back a bit. They are for every NGO , Corpor ate and Government Organi zation working tirelessly in the f i e lds of Hea l th , E ducation , Environment , Livelihoods and
Advocacy & Empowerment. Please log on to www.timessocialawards.com to a p p l y for the award or to nominate the commendable work done by an organization.
THE TIMES OF INDIA
Social Impact Awardsin partnnership with
J .PMor gan
taproot india
A PARTITION OFANOTHER KIND.
India is a whole made of two
halves. A A wide chasm runs
across our country ’s vast bod y,
� slicing through
- - V its very heart ,
H �� sp l it t ing us into
a peculiar pair
of comp letely
dissimilar twins.