Embed Size (px)
Citation preview

8 Sellar and Juxtasellar Masses on Magnetic Resonance Imaging
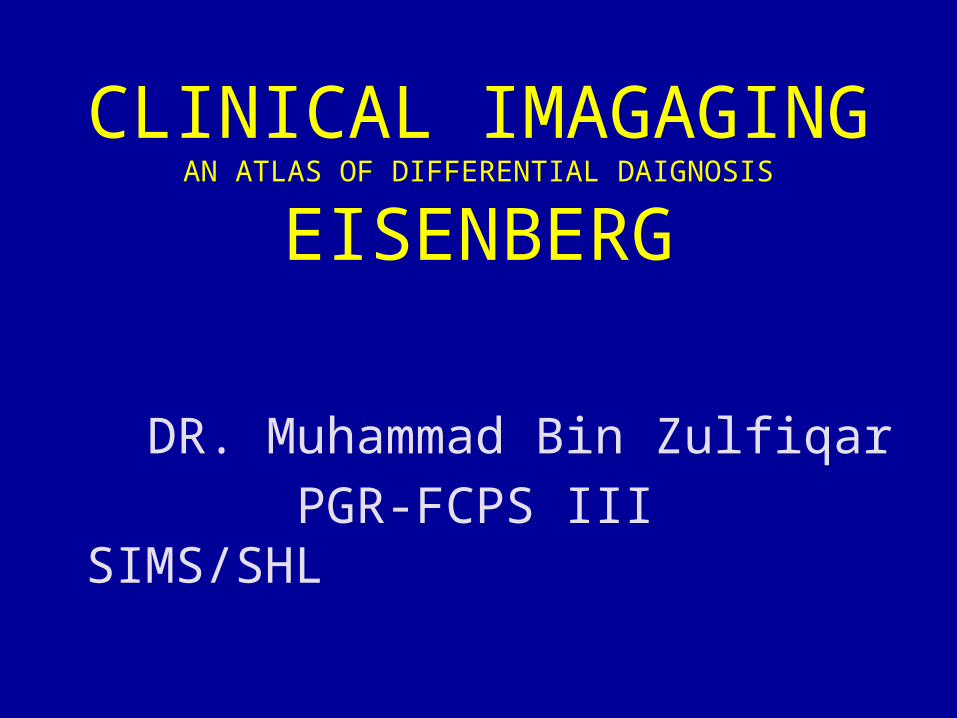
CLINICAL IMAGAGINGAN ATLAS OF DIFFERENTIAL DAIGNOSIS
EISENBERG
DR. Muhammad Bin Zulfiqar PGR-FCPS III SIMS/SHL
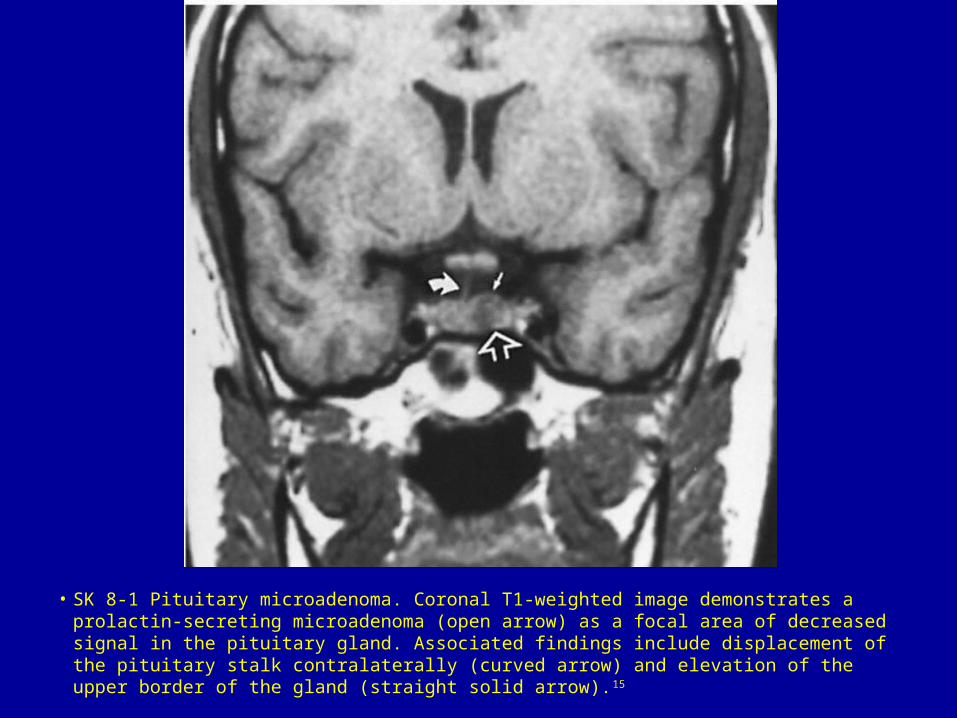
• SK 8-1 Pituitary microadenoma. Coronal T1-weighted image demonstrates a prolactin-secreting microadenoma (open arrow) as a focal area of decreased signal in the pituitary gland. Associated findings include displacement of the pituitary stalk contralaterally (curved arrow) and elevation of the upper border of the gland (straight solid arrow).15
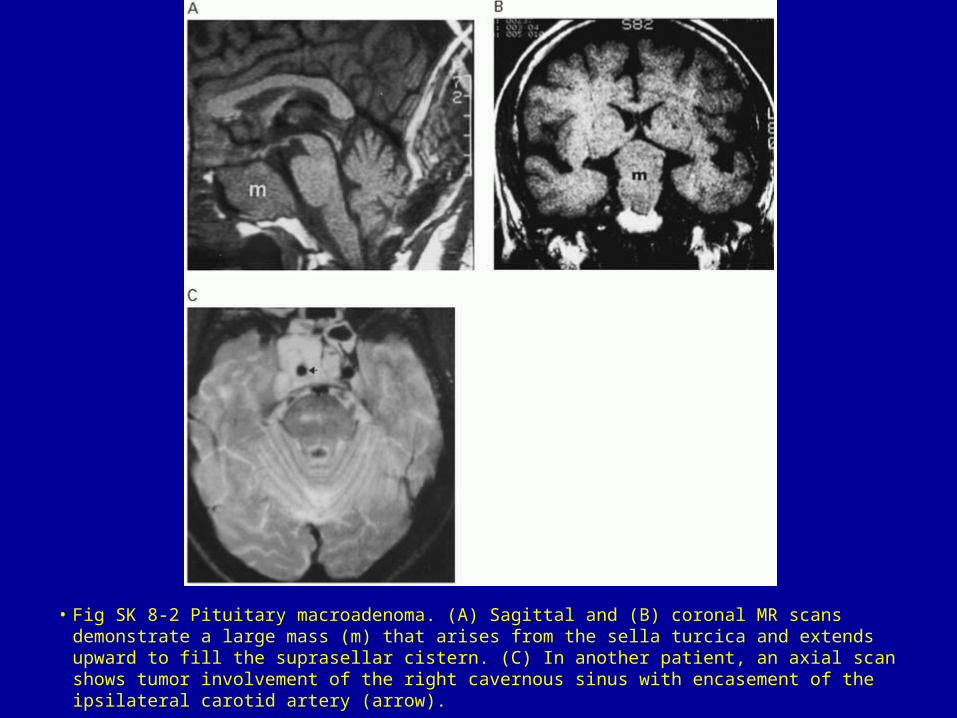
• Fig SK 8-2 Pituitary macroadenoma. (A) Sagittal and (B) coronal MR scans demonstrate a large mass (m) that arises from the sella turcica and extends upward to fill the suprasellar cistern. (C) In another patient, an axial scan shows tumor involvement of the right cavernous sinus with encasement of the ipsilateral carotid artery (arrow).
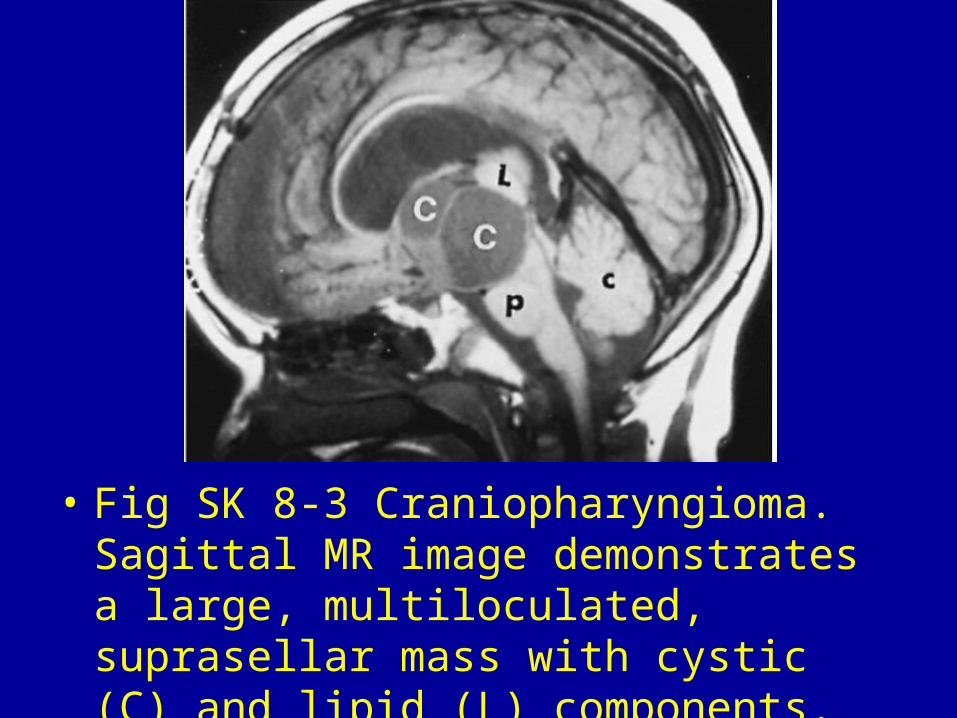
• Fig SK 8-3 Craniopharyngioma. Sagittal MR image demonstrates a large, multiloculated, suprasellar mass with cystic (C) and lipid (L) components. (c, cerebellum; p, pons.)
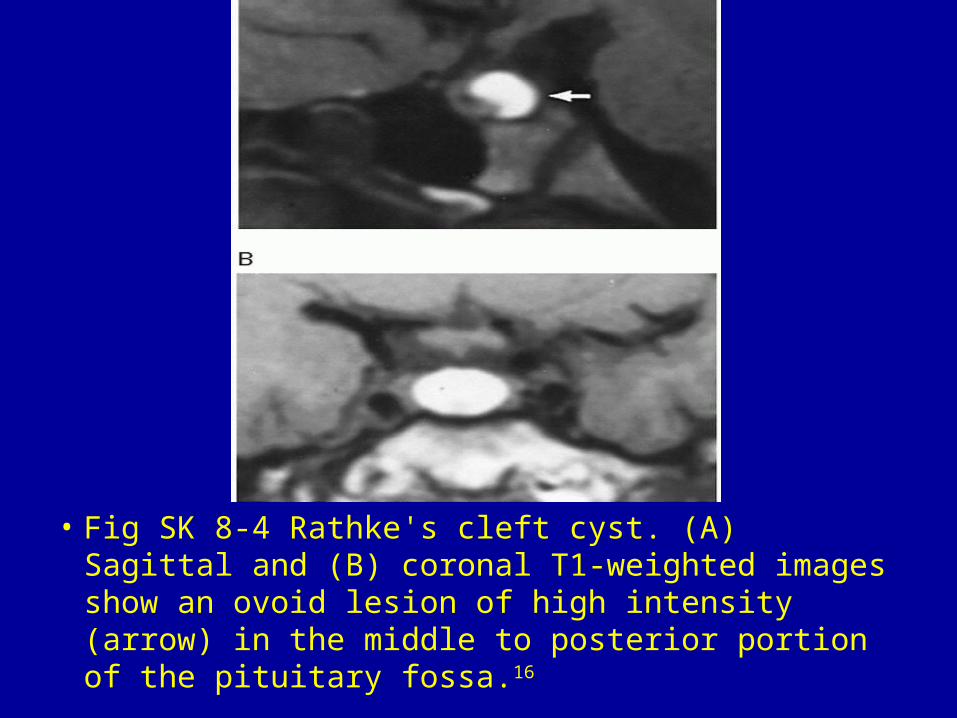
• Fig SK 8-4 Rathke's cleft cyst. (A) Sagittal and (B) coronal T1-weighted images show an ovoid lesion of high intensity (arrow) in the middle to posterior portion of the pituitary fossa.16
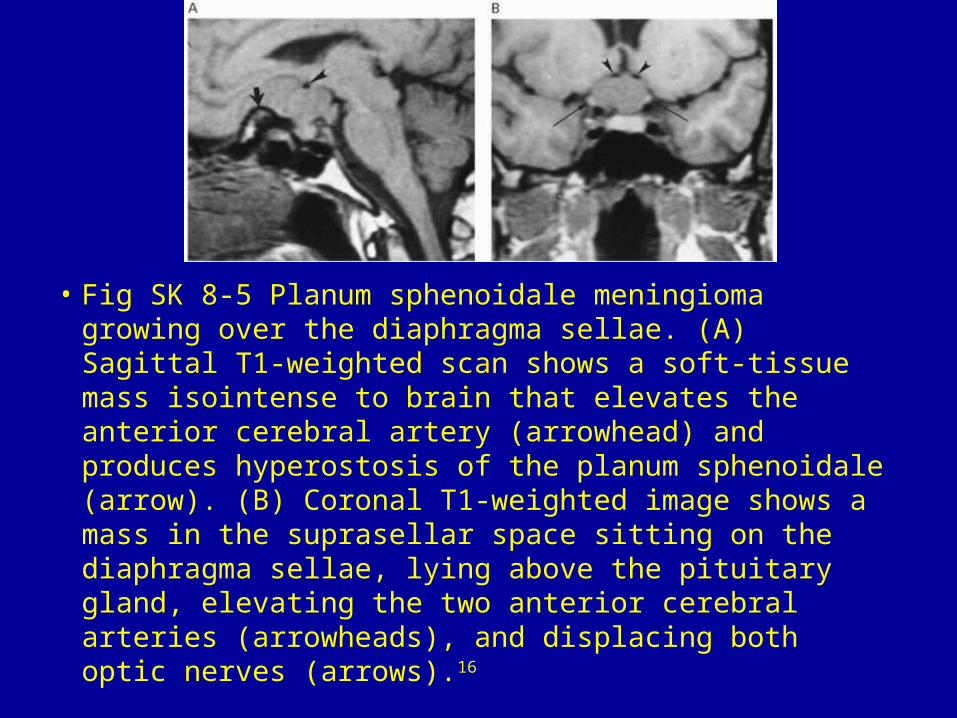
• Fig SK 8-5 Planum sphenoidale meningioma growing over the diaphragma sellae. (A) Sagittal T1-weighted scan shows a soft-tissue mass isointense to brain that elevates the anterior cerebral artery (arrowhead) and produces hyperostosis of the planum sphenoidale (arrow). (B) Coronal T1-weighted image shows a mass in the suprasellar space sitting on the diaphragma sellae, lying above the pituitary gland, elevating the two anterior cerebral arteries (arrowheads), and displacing both optic nerves (arrows).16
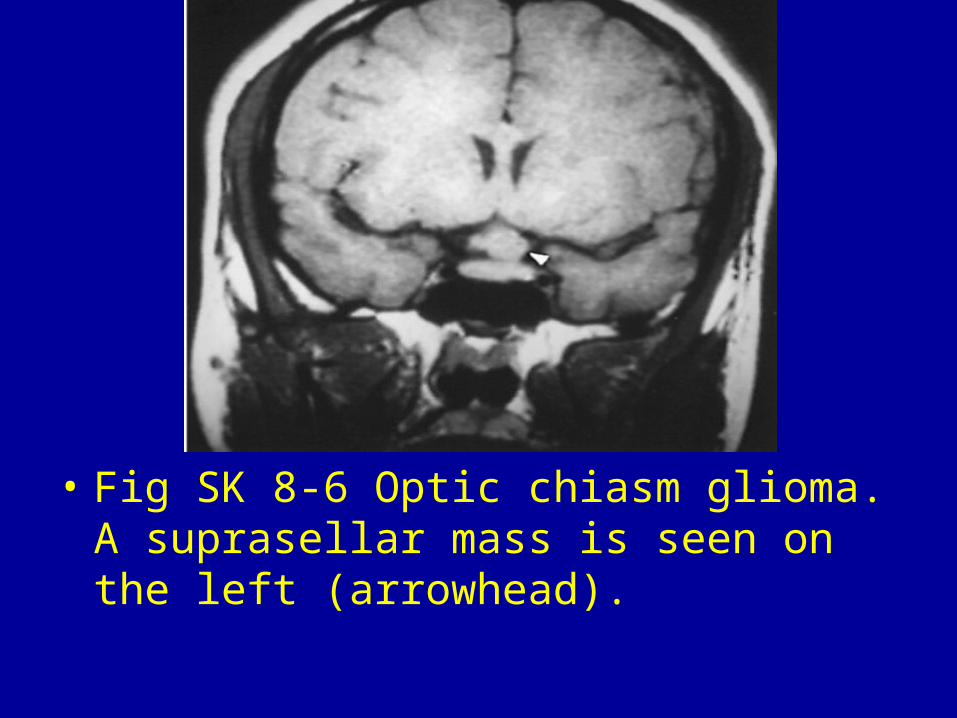
• Fig SK 8-6 Optic chiasm glioma. A suprasellar mass is seen on the left (arrowhead).
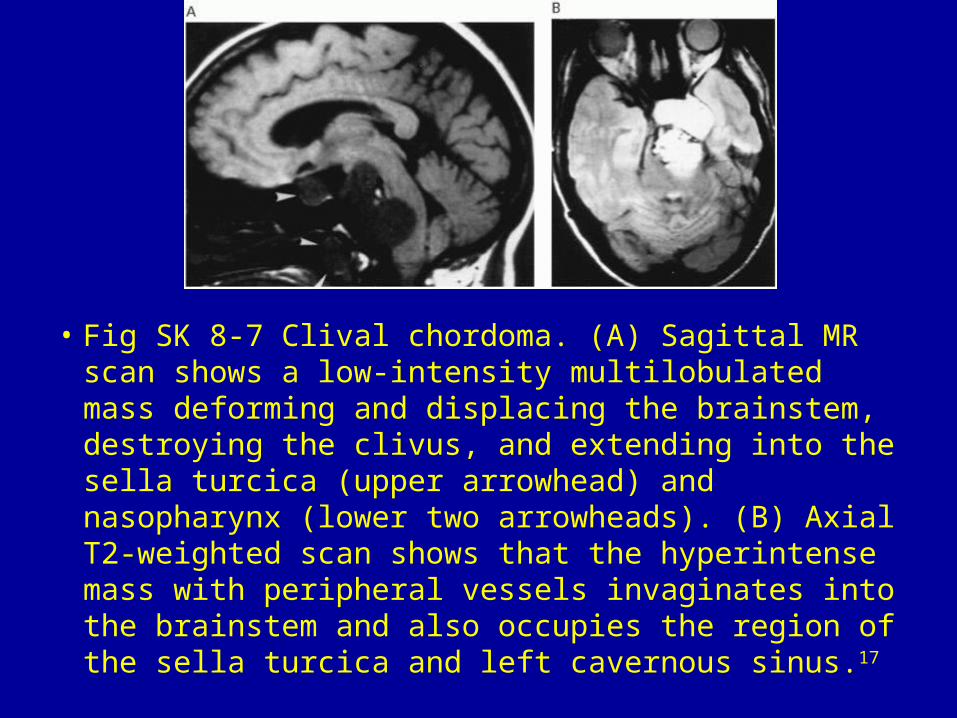
• Fig SK 8-7 Clival chordoma. (A) Sagittal MR scan shows a low-intensity multilobulated mass deforming and displacing the brainstem, destroying the clivus, and extending into the sella turcica (upper arrowhead) and nasopharynx (lower two arrowheads). (B) Axial T2-weighted scan shows that the hyperintense mass with peripheral vessels invaginates into the brainstem and also occupies the region of the sella turcica and left cavernous sinus.17
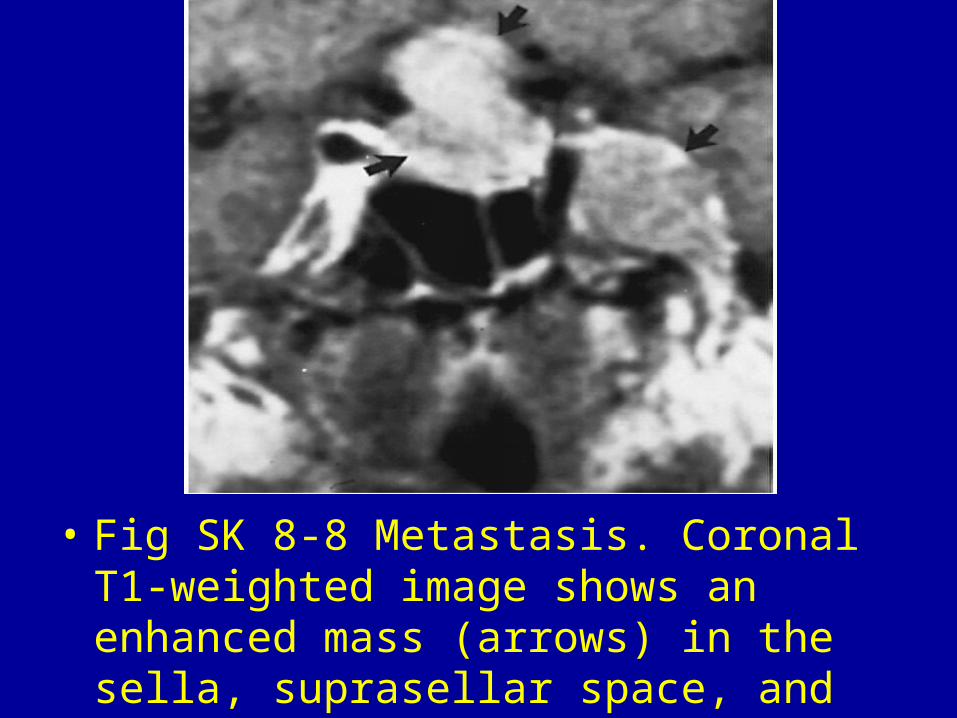
• Fig SK 8-8 Metastasis. Coronal T1-weighted image shows an enhanced mass (arrows) in the sella, suprasellar space, and left parasellar cavernous sinus.16
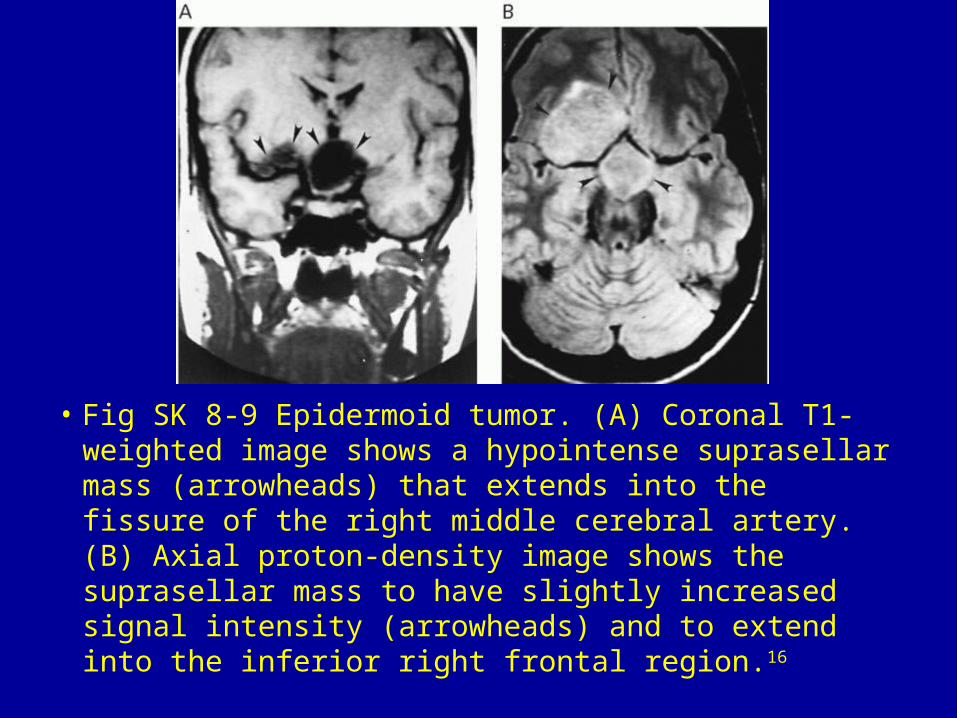
• Fig SK 8-9 Epidermoid tumor. (A) Coronal T1-weighted image shows a hypointense suprasellar mass (arrowheads) that extends into the fissure of the right middle cerebral artery. (B) Axial proton-density image shows the suprasellar mass to have slightly increased signal intensity (arrowheads) and to extend into the inferior right frontal region.16
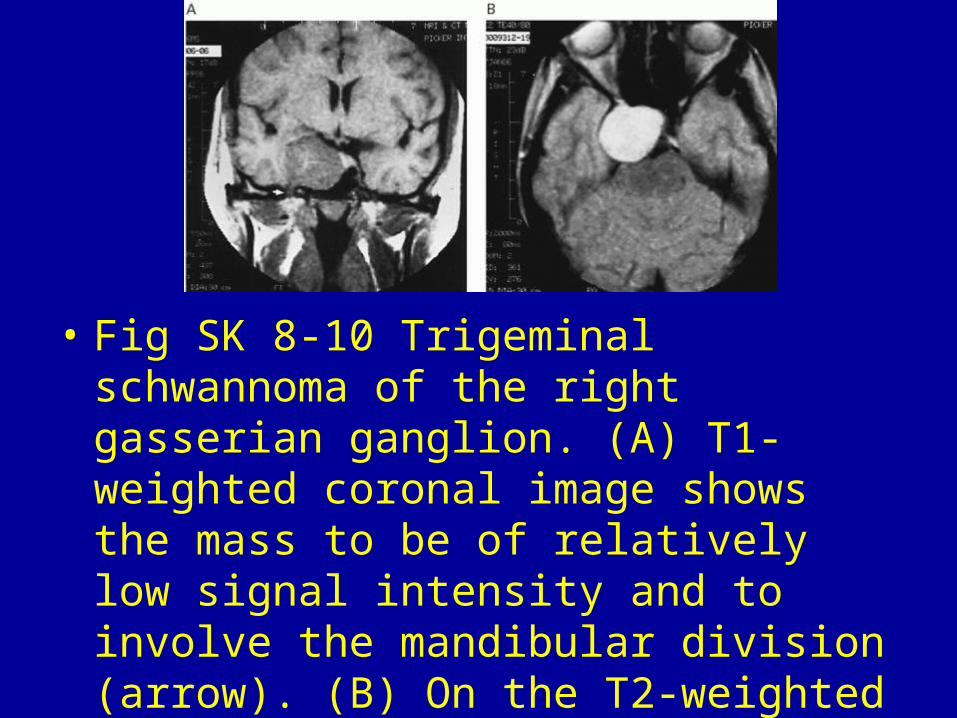
• Fig SK 8-10 Trigeminal schwannoma of the right gasserian ganglion. (A) T1-weighted coronal image shows the mass to be of relatively low signal intensity and to involve the mandibular division (arrow). (B) On the T2-weighted scan, the lesion has high homogeneous signal intensity.18
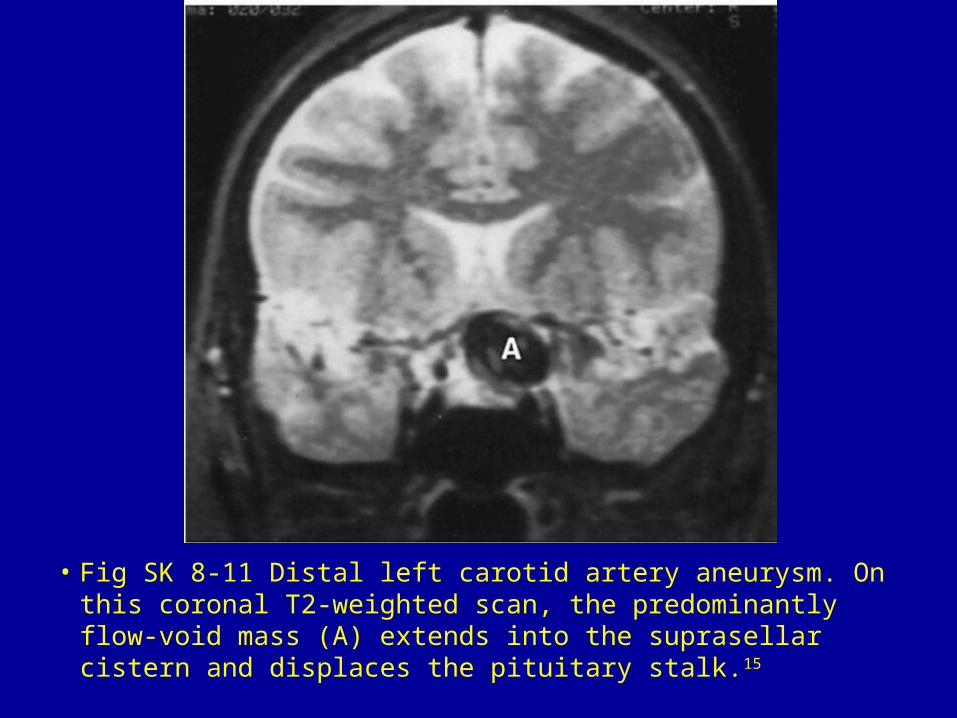
• Fig SK 8-11 Distal left carotid artery aneurysm. On this coronal T2-weighted scan, the predominantly flow-void mass (A) extends into the suprasellar cistern and displaces the pituitary stalk.15
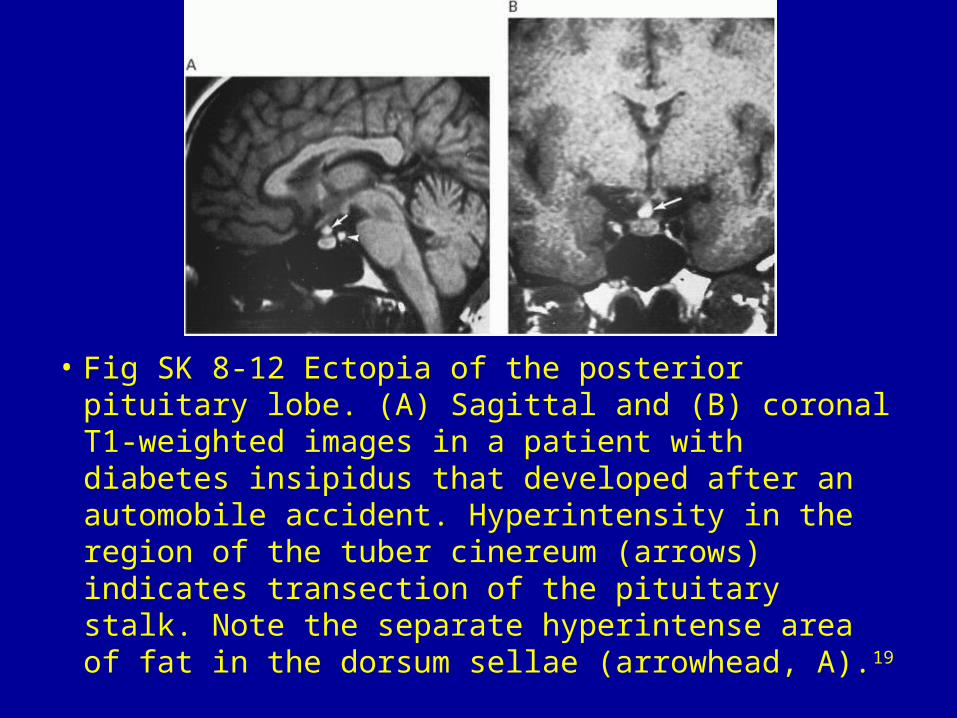
• Fig SK 8-12 Ectopia of the posterior pituitary lobe. (A) Sagittal and (B) coronal T1-weighted images in a patient with diabetes insipidus that developed after an automobile accident. Hyperintensity in the region of the tuber cinereum (arrows) indicates transection of the pituitary stalk. Note the separate hyperintense area of fat in the dorsum sellae (arrowhead, A).19