Embed Size (px)
Citation preview
K313
3D Modeling to achieve net-zero and maintain cradle to grave3DM-BP-15 A
Brenda Morawa23/04/15

Credit(s) earned on completion of this course will be reported to AIA CES for AIA members. Certificates of Completion for both AIA members and non-AIA members are available upon request.
This course is registered with AIA CES for continuing professional education. As such, it does not include content that may be deemed or construed to be an approval or endorsement by the AIA of any material of construction or any method or manner ofhandling, using, distributing, or dealing in any material or product.___________________________________________Questions related to specific materials, methods, and services will be addressed at the conclusion of this presentation.

This presentation is protected by US and International Copyright laws. Reproduction, distribution, display and use of the presentation without written
permission of the speaker is prohibited.
© IES 2015
Copyright Materials

Integrated project delivery has never been more important, especially if the aim is to be net-zero. Today the building industry must focus on creating value, not only in terms of economics, but also comfort, health, and environment. This requires new skills together with a major behavioural shift.
Worldwide, energy regulations and usage assessments within voluntary rating systems have begun to put the emphasis on high performance, not only during design, but also across cradle-to-grave. LEED v4 is driving this by mandating performance across design, commissioning, and operation. It demands increased monitoring, improvement, and verification with an emphasis on installing technologies, or a technology infrastructure that equips buildings to do this.
It is clear that the industry must be ready to use a performance-based simulation approach across the building lifecycle. Using a real-life net-zero and LEED project case study, IES experts will demonstrate how you can use the same 3D simulation model throughout the lifecycle of a building to inform concept design, operation, commissioning, and retrofit all the while optimizing the building to maintain net-zero status. In addition to the featured project, other project examples will be examined throughout the session.
CourseDescription

LearningObjectives
1. Understand how and identify when to use advanced building simulation across the building lifecycle to optimize energy efficiency and performance and what it can reveal.
2. Use the same 3D building model throughout a building’s lifecycle to design, evaluate, optimize and maintain Net-Zero status.
3. Share knowledge of the latest advanced technology in this field and apply it to their working practice to deliver integrated design.
4. Address project challenges after gaining valuable insight on the challenges and solutions presented and discussed through the case study.
At the end of the this course, participants will be able to:
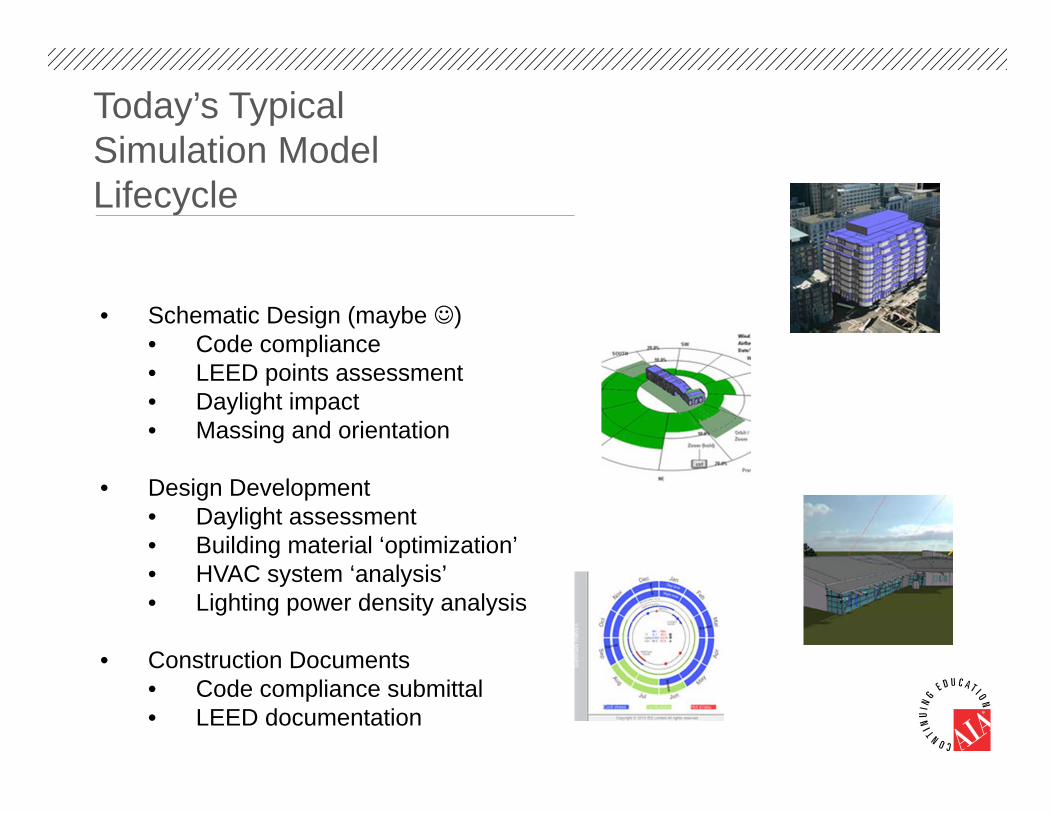
Today’s Typical Simulation Model Lifecycle
• Schematic Design (maybe )• Code compliance• LEED points assessment• Daylight impact• Massing and orientation
• Design Development• Daylight assessment• Building material ‘optimization’• HVAC system ‘analysis’• Lighting power density analysis
• Construction Documents• Code compliance submittal• LEED documentation
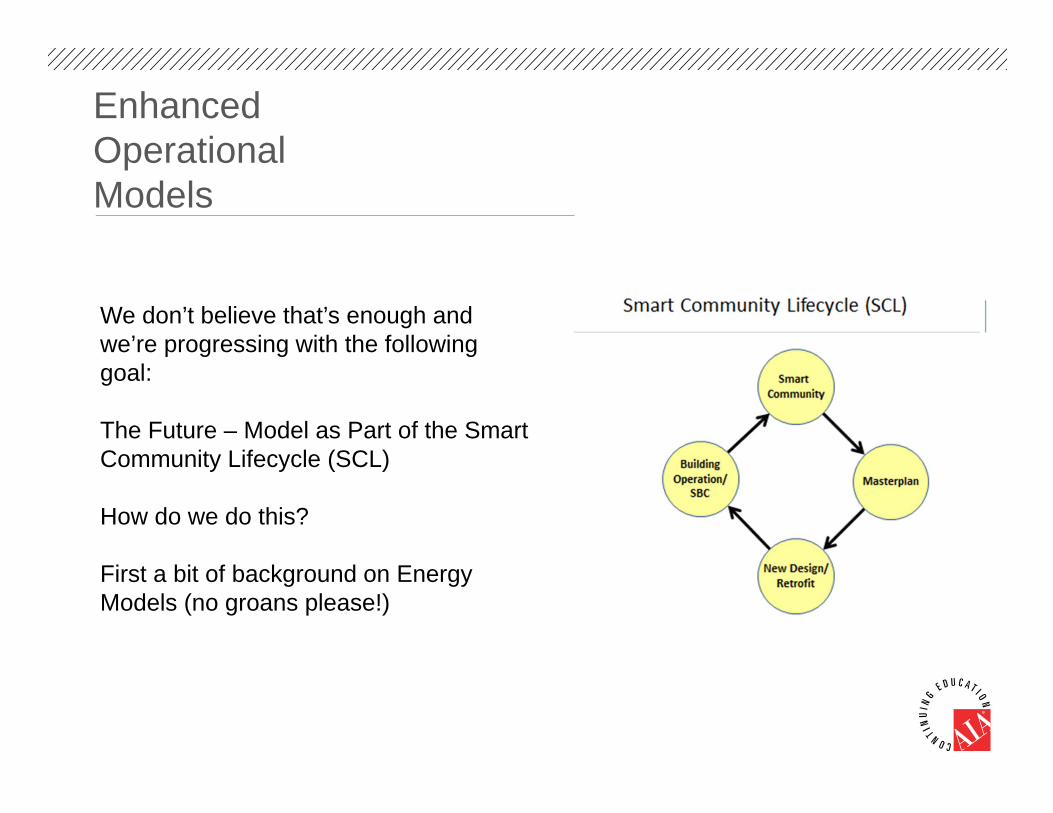
Enhanced Operational Models
We don’t believe that’s enough and we’re progressing with the following goal:
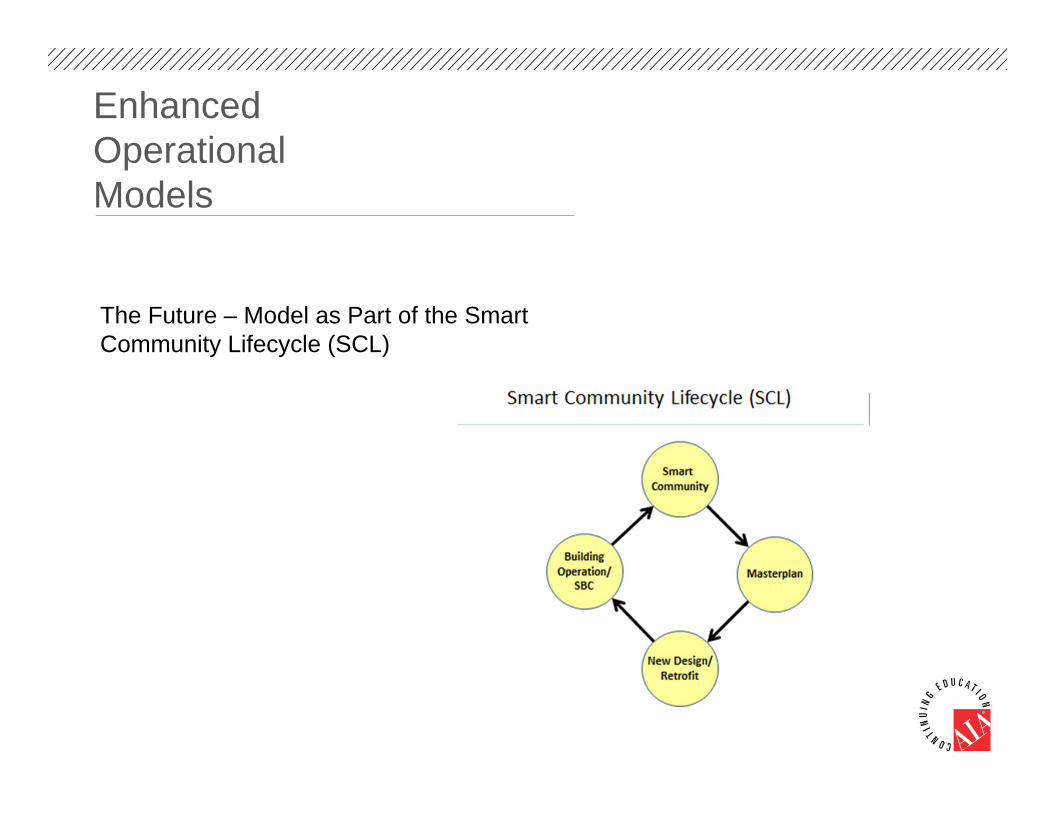
The Future – Model as Part of the Smart Community Lifecycle (SCL)
How do we do this?
First a bit of background on Energy Models (no groans please!)

Enhanced Operational Models
Building Energy Simulation Tools are used to analyse buildings for a range of purposes. Some of these purposes require a specific type of model that is specific to its purpose. However, the differences between these model types is poorly defined which causes confusion to the marketplace.
We define four type of models:• Design Model• Compliance Model• Reference Model• Operational Model

Enhanced Operational Models
The Design Model (DM)• The Design Model is used throughout design and refurbishment from design
concept to detailed design. • Best guess at how the building will perform or operate (lots of averages!)• Used to compare design options • Will become more detailed as the design progresses
Accuracy• Make best guess at how the building will be used and the various loads on the
building e.g. occupancy, lighting, etc.• The building may have a significantly different usage pattern and HVAC
system operation.• Depending upon the level of detail the DM will be best at comparing design
options rather than building operational accuracy.
Enhanced Operational Models
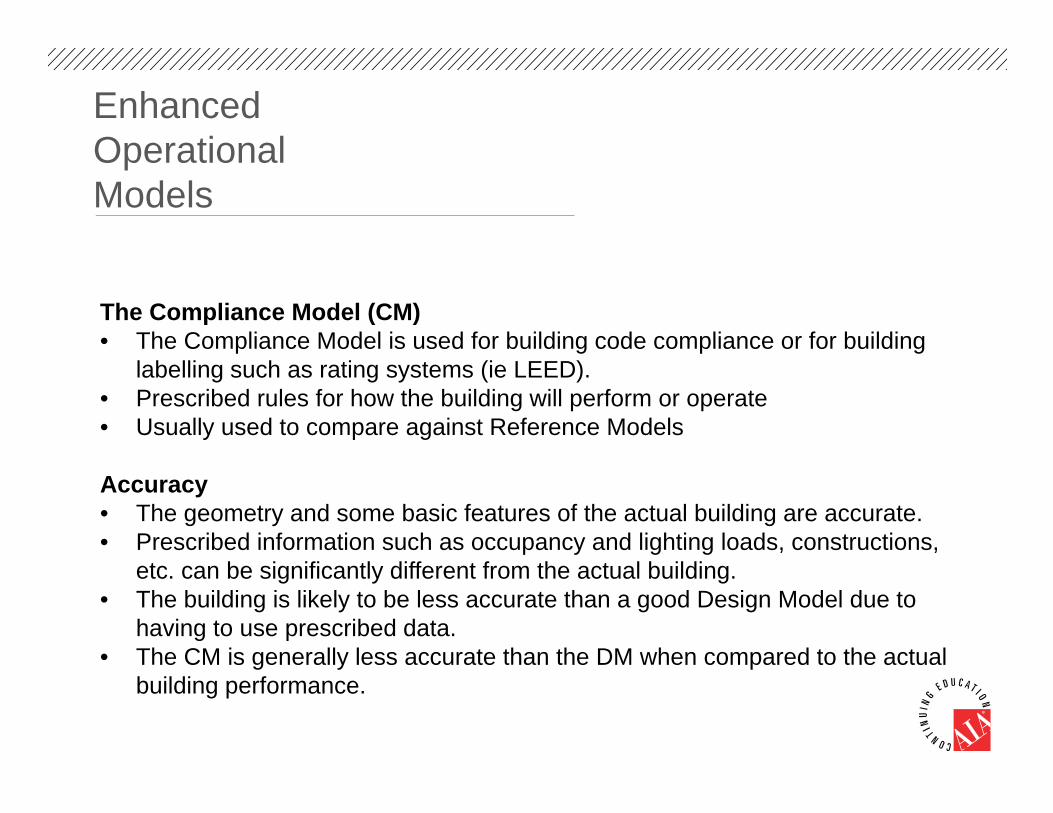
The Compliance Model (CM)• The Compliance Model is used for building code compliance or for building
labelling such as rating systems (ie LEED). • Prescribed rules for how the building will perform or operate• Usually used to compare against Reference Models
Accuracy• The geometry and some basic features of the actual building are accurate.• Prescribed information such as occupancy and lighting loads, constructions,
etc. can be significantly different from the actual building.• The building is likely to be less accurate than a good Design Model due to
having to use prescribed data.• The CM is generally less accurate than the DM when compared to the actual
building performance.
Enhanced Operational Models
The Reference Model (RM)• The Reference Model is used only for building code compliance or for building
labelling such as rating systems. • The RM will typically have most of the geometrical features of the proposed
building but not necessarily.• Highly prescribed building data for different building types.• Used primarily as a benchmark for the Compliance Model.
Accuracy• As the RM is a benchmark it may not be an accurate representation of the
building performance.• The RM is likely to be the least accurate of the four building model types.
Enhanced Operational Models
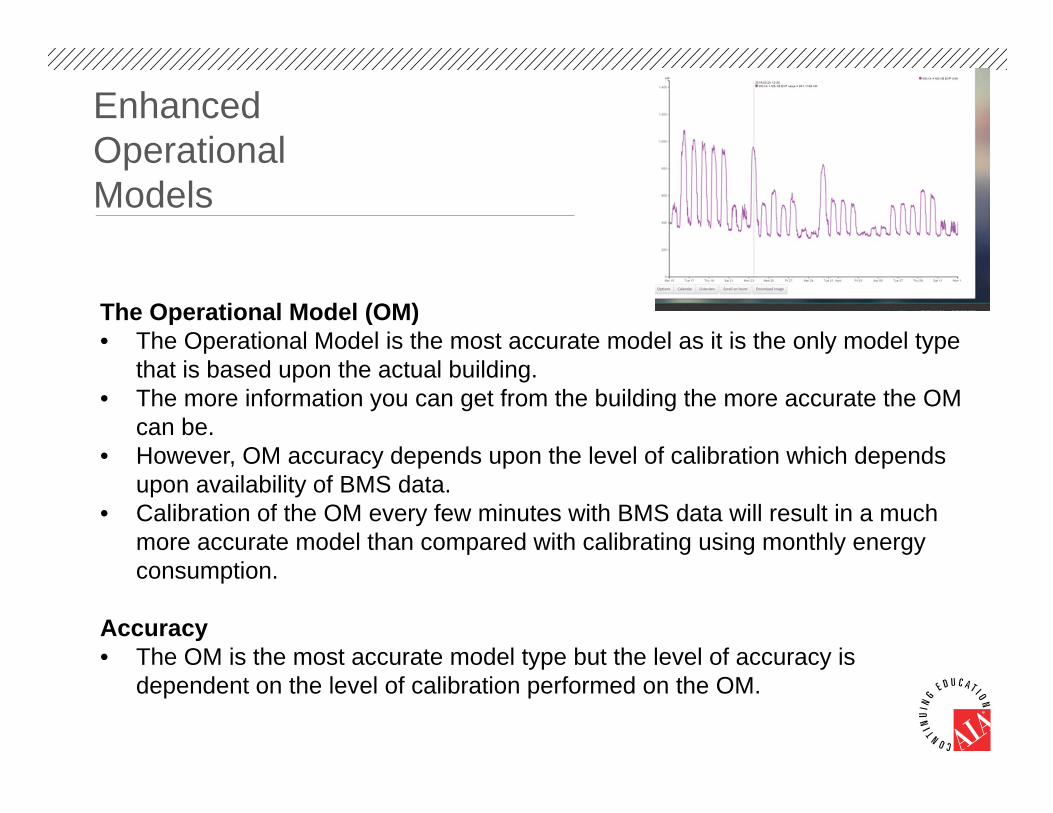
The Operational Model (OM)• The Operational Model is the most accurate model as it is the only model type
that is based upon the actual building. • The more information you can get from the building the more accurate the OM
can be.• However, OM accuracy depends upon the level of calibration which depends
upon availability of BMS data.• Calibration of the OM every few minutes with BMS data will result in a much
more accurate model than compared with calibrating using monthly energy consumption.
Accuracy• The OM is the most accurate model type but the level of accuracy is
dependent on the level of calibration performed on the OM.

Enhanced Operational Models
The Future – Model as Part of the Smart Community Lifecycle (SCL)
Enhanced Operational Models
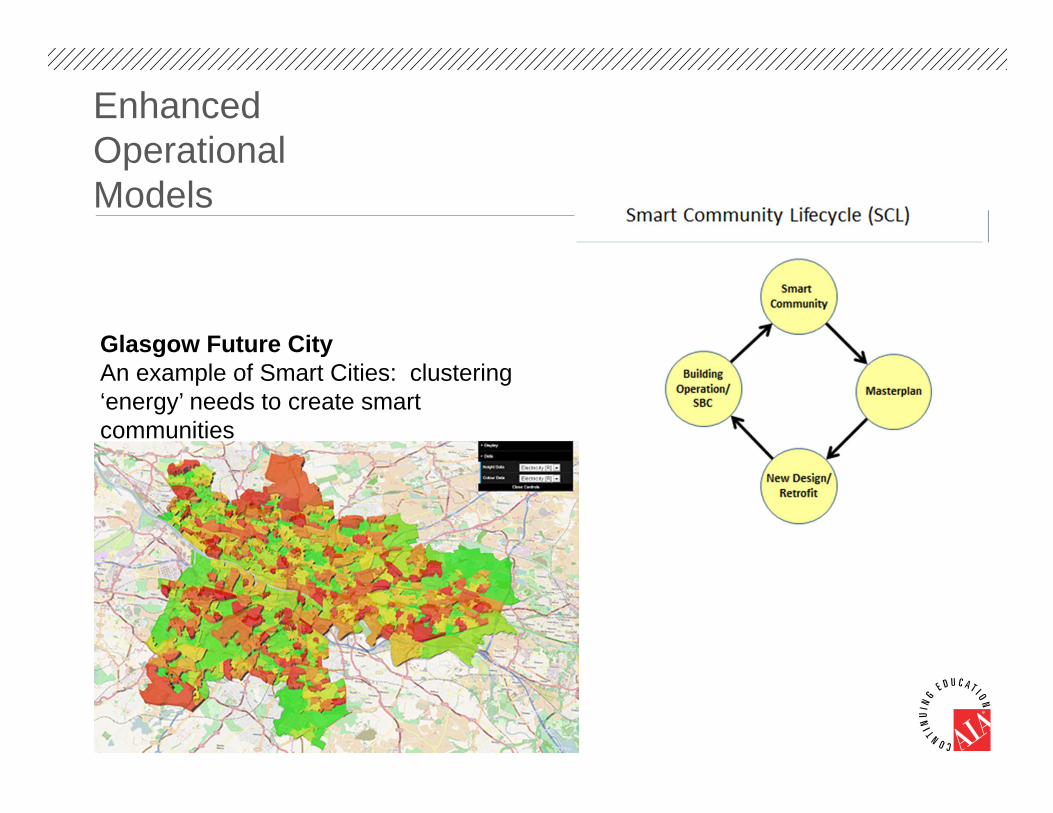
Glasgow Future CityAn example of Smart Cities: clustering ‘energy’ needs to create smart communities
What is Glasgow Doing?
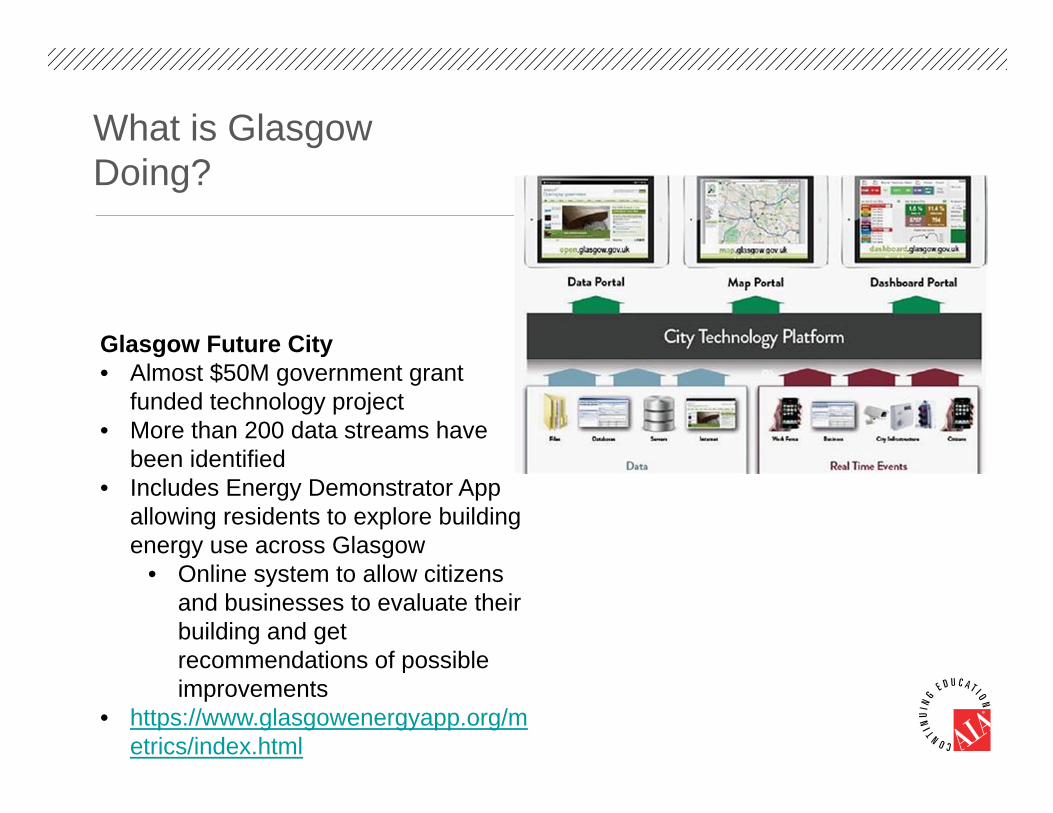
Glasgow Future City• Almost $50M government grant
funded technology project• More than 200 data streams have
been identified• Includes Energy Demonstrator App
allowing residents to explore building energy use across Glasgow
• Online system to allow citizens and businesses to evaluate their building and get recommendations of possible improvements
• https://www.glasgowenergyapp.org/metrics/index.html
Enhanced Operational Models
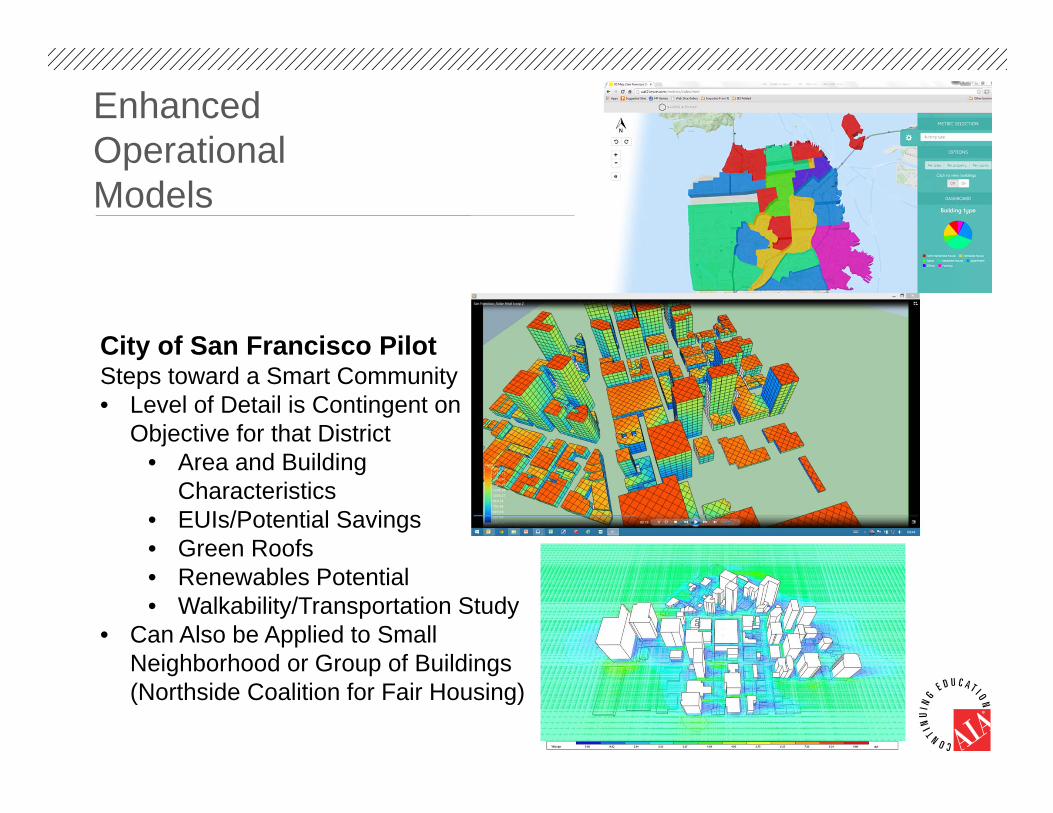
City of San Francisco PilotSteps toward a Smart Community• Level of Detail is Contingent on
Objective for that District• Area and Building
Characteristics• EUIs/Potential Savings• Green Roofs• Renewables Potential• Walkability/Transportation Study
• Can Also be Applied to Small Neighborhood or Group of Buildings (Northside Coalition for Fair Housing)

Enhanced Operational Models
City of San Francisco PilotDistrict 3
• 6,200 buildings, footprint area of 3.06km2
• Specific buildings with differing levels of detail
• Footprint• Shell• Textured Windows• Full Glazing
Enhanced Operational Models
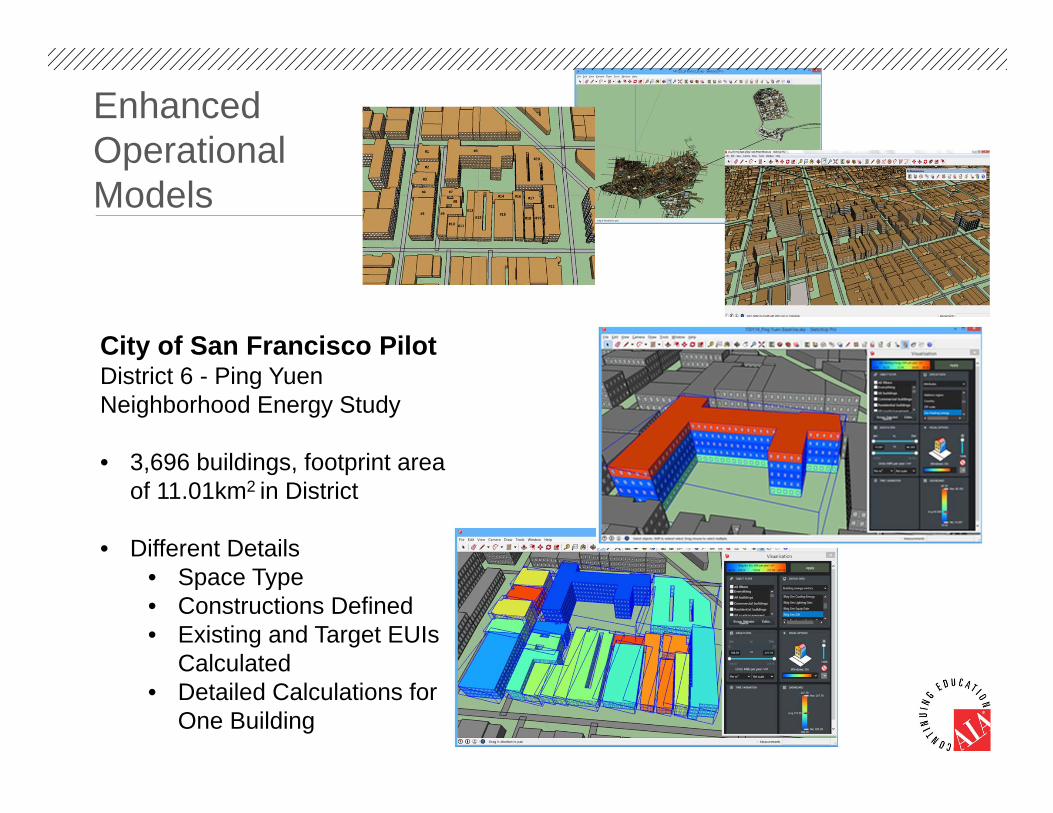
City of San Francisco PilotDistrict 6 - Ping Yuen Neighborhood Energy Study
• 3,696 buildings, footprint area of 11.01km2 in District
• Different Details• Space Type• Constructions Defined• Existing and Target EUIs
Calculated• Detailed Calculations for
One Building
Enhanced Operational Models
The Future – Model as Part of the Smart Community Lifecycle (SCL)

1. Smart Cities2. Concept Design & Master
Planning3. Building Design
1. Schematic Design2. Design Development3. Construction Documents
4. Monitoring Based Commissioning
5. Building Operation and Optimization (Smart Building Controller)
6. Smart Cities
Proposed Simulation Model Lifecycle
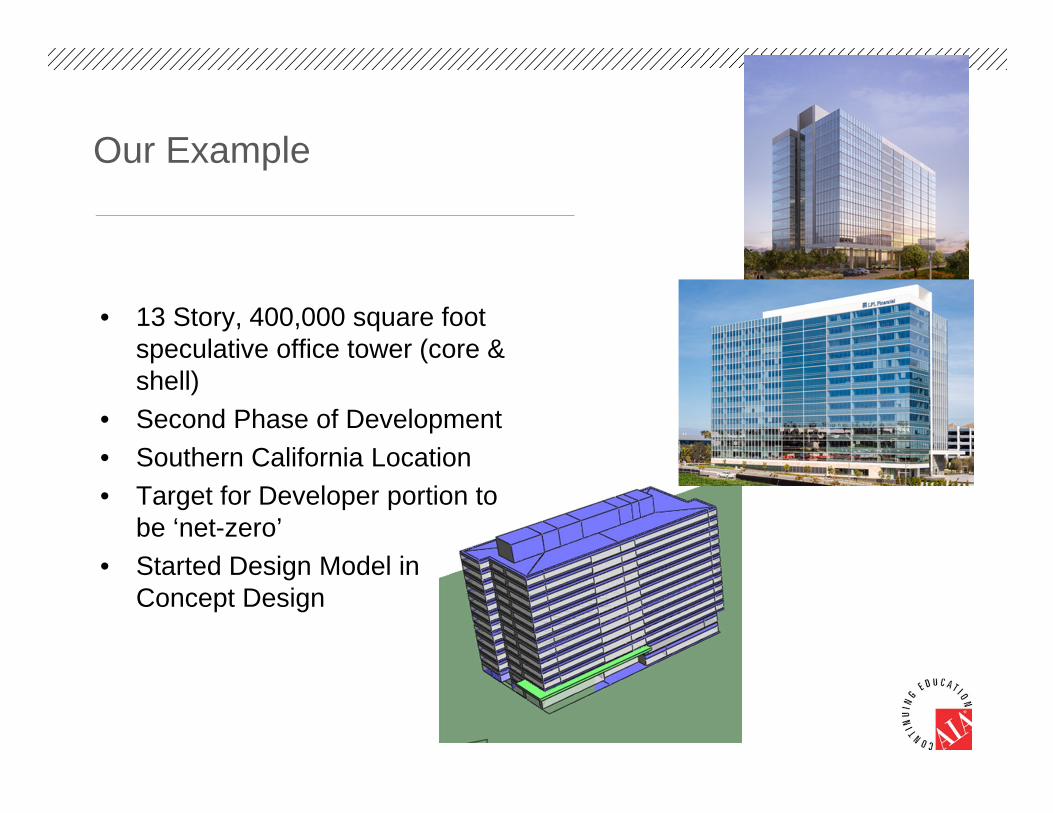
• 13 Story, 400,000 square foot speculative office tower (core & shell)
• Second Phase of Development• Southern California Location• Target for Developer portion to
be ‘net-zero’• Started Design Model in
Concept Design
Our Example
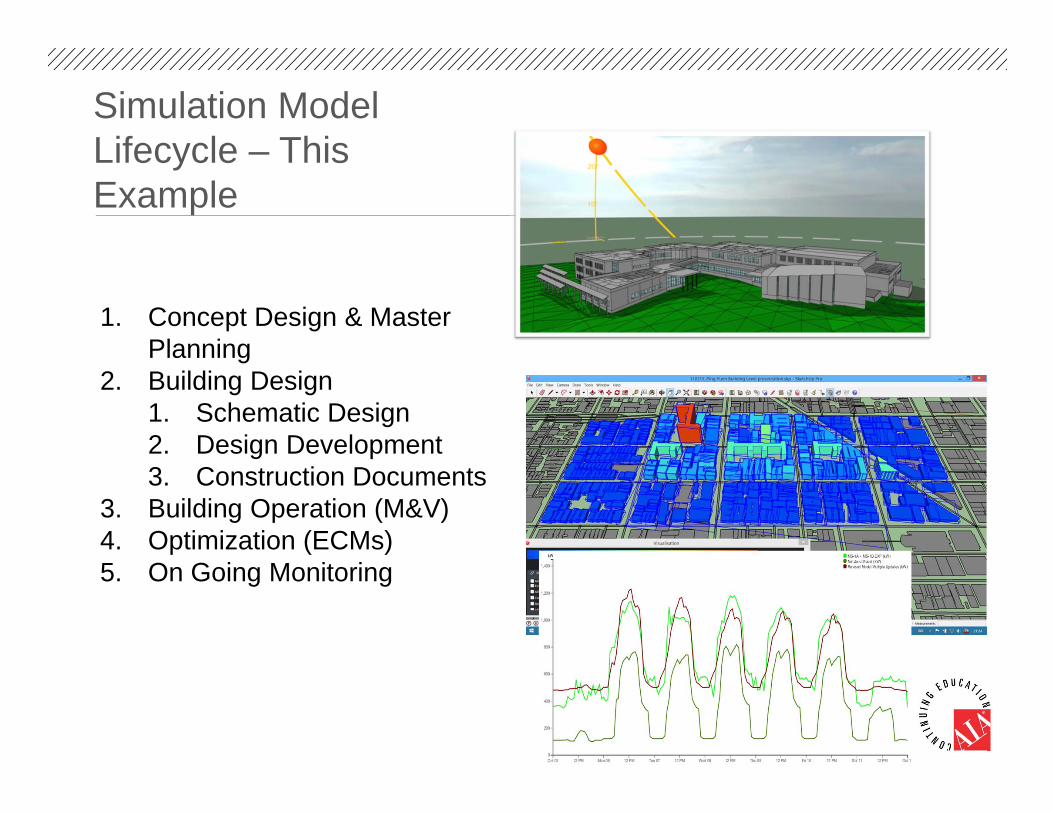
1. Concept Design & Master Planning
2. Building Design1. Schematic Design2. Design Development3. Construction Documents
3. Building Operation (M&V)4. Optimization (ECMs)5. On Going Monitoring
Simulation Model Lifecycle – This Example
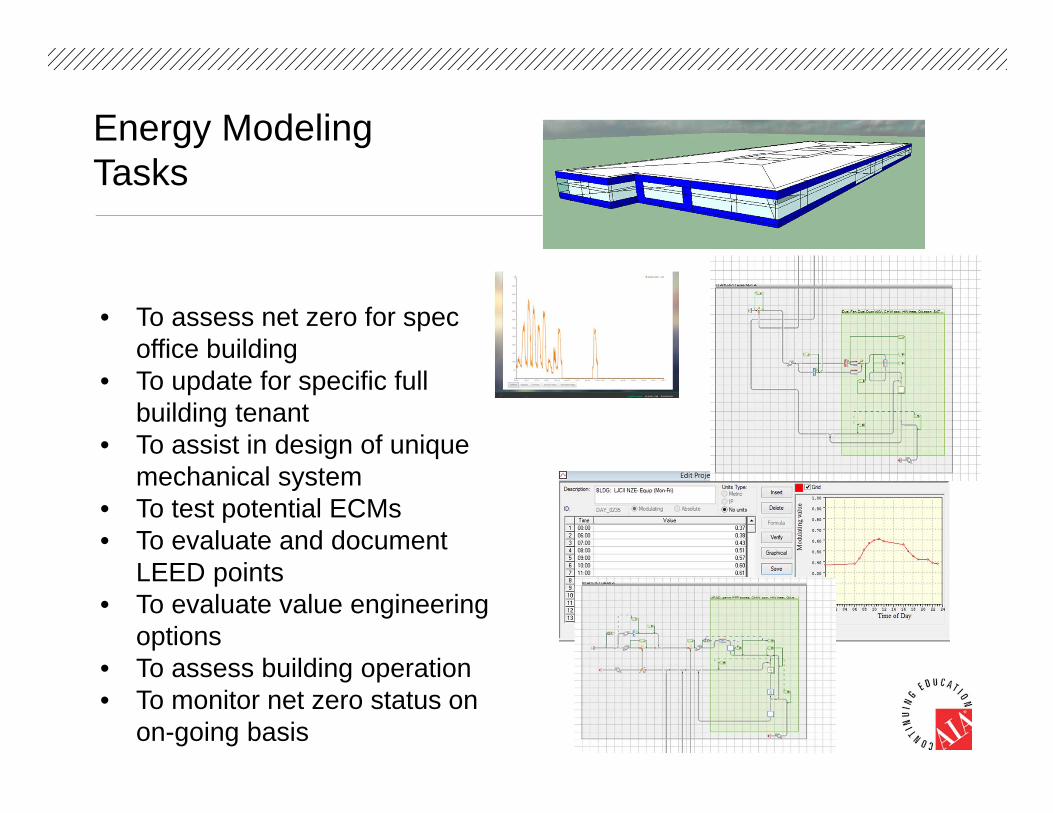
• To assess net zero for spec office building
• To update for specific full building tenant
• To assist in design of unique mechanical system
• To test potential ECMs• To evaluate and document
LEED points• To evaluate value engineering
options• To assess building operation• To monitor net zero status on
on-going basis
Energy Modeling Tasks

Net Zero Study & Core & Shell Concept
• Load Reductions• Glass/Glazing Study• Metered Sister Building
Tenant Plug Loads• Custom Load and Profile
• HVAC System Analysis• Evaluation of Economizer
Operation (Cost/Benefit)• Analyzed Hybrid
UFAD/Overhead System• Plenum Heat Recovery
• Sizing of Fuel Cells Required for Offset of Core and Shell Loads/Energy Usage
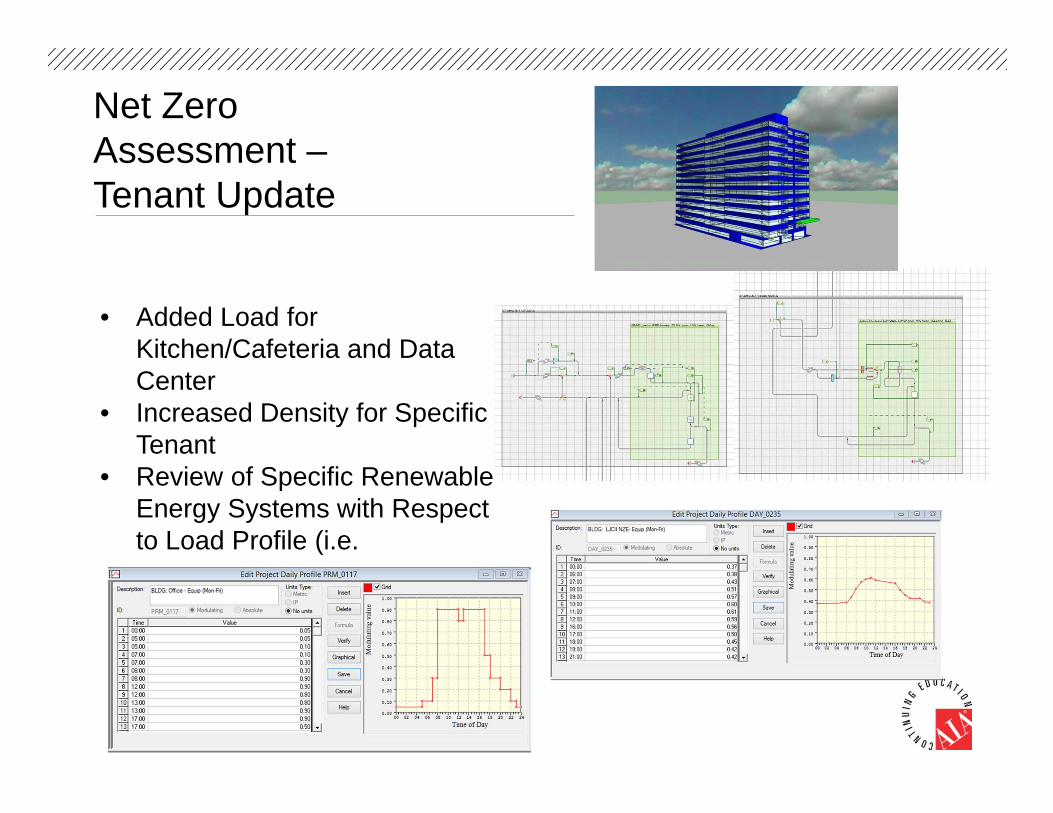
• Added Load for Kitchen/Cafeteria and Data Center
• Increased Density for Specific Tenant
• Review of Specific Renewable Energy Systems with Respect to Load Profile (i.e.
Net Zero Assessment –Tenant Update
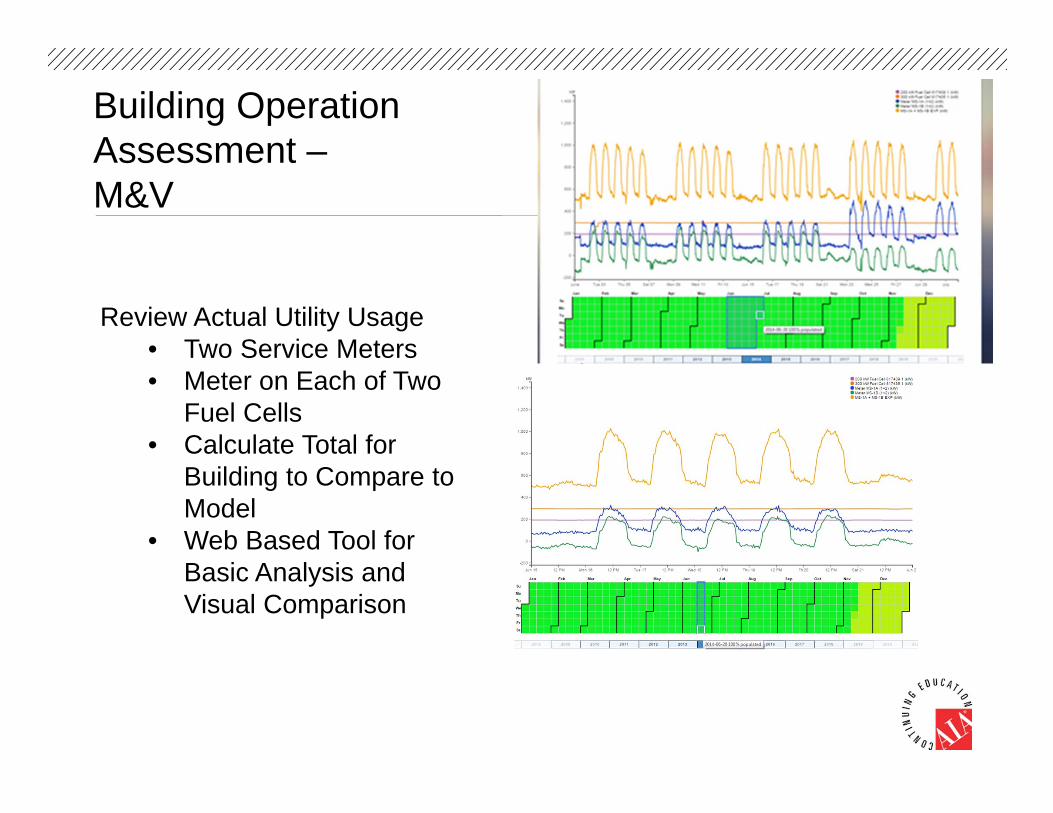
Review Actual Utility Usage• Two Service Meters• Meter on Each of Two
Fuel Cells• Calculate Total for
Building to Compare to Model
• Web Based Tool for Basic Analysis and Visual Comparison
Building Operation Assessment –M&V
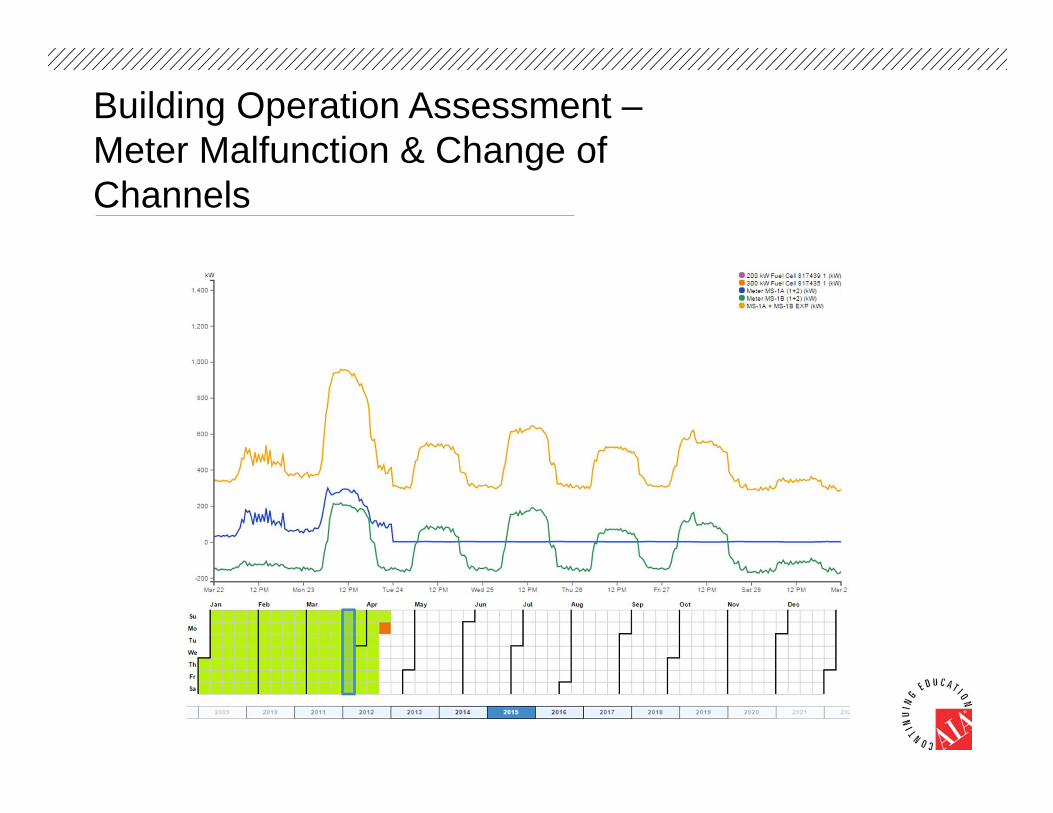
Building Operation Assessment –Meter Malfunction & Change of Channels

Building Operation Assessment –Compare to Model
• Utility Meter Composite (purple)
• Original Core and Shell Model for NZE orange)
• Updated Model (Blue)• Web Based Tool for Basic
Analysis and Visual Comparison
• What do we see?
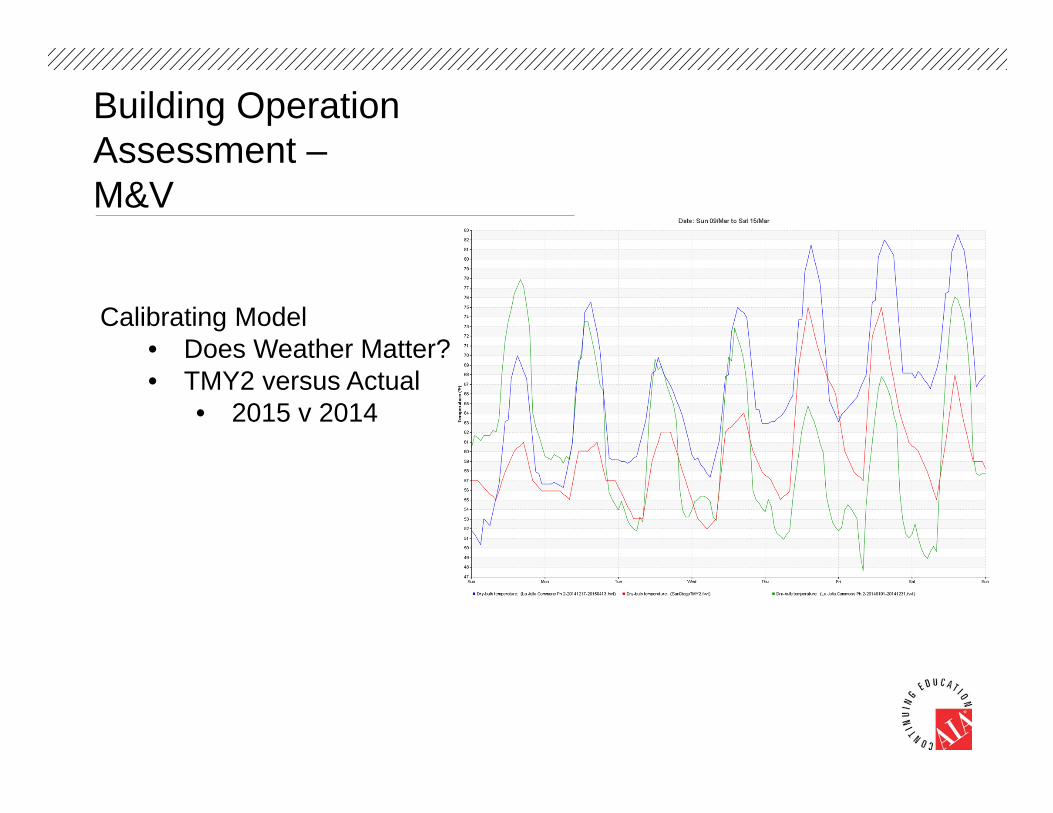
Calibrating Model• Does Weather Matter?• TMY2 versus Actual
• 2015 v 2014
Building Operation Assessment –M&V
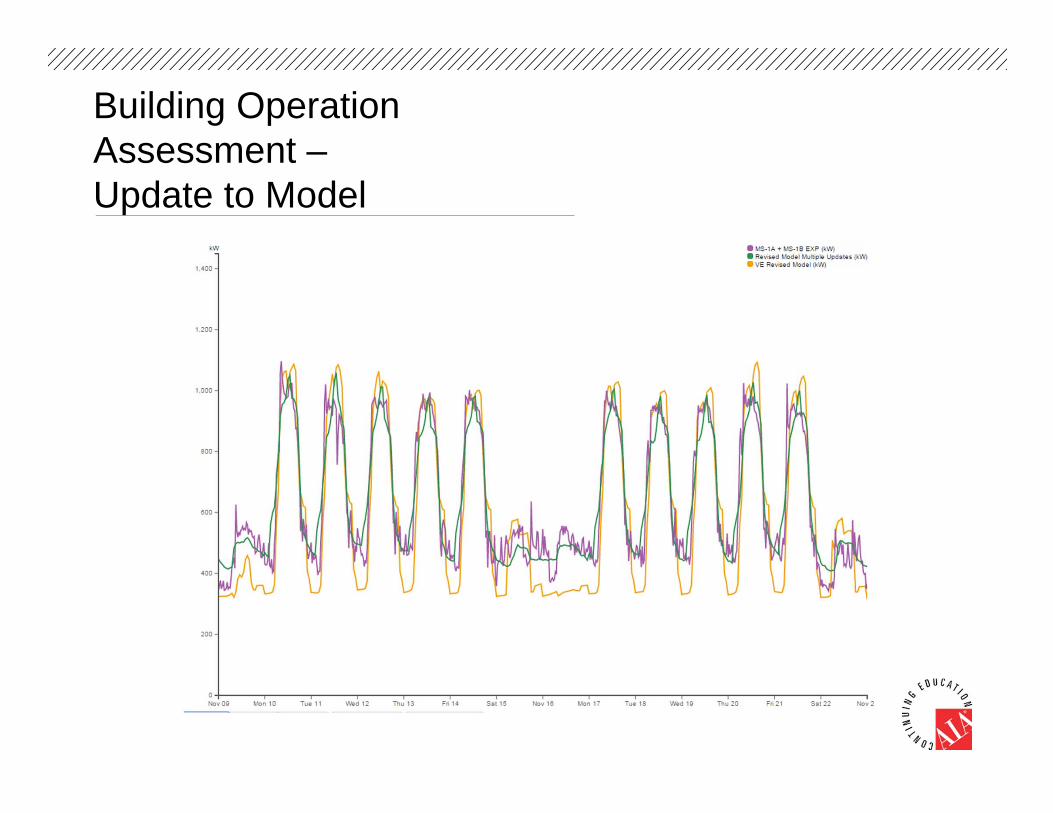
Building Operation Assessment –Update to Model

Building Operation Assessment –Update to Model
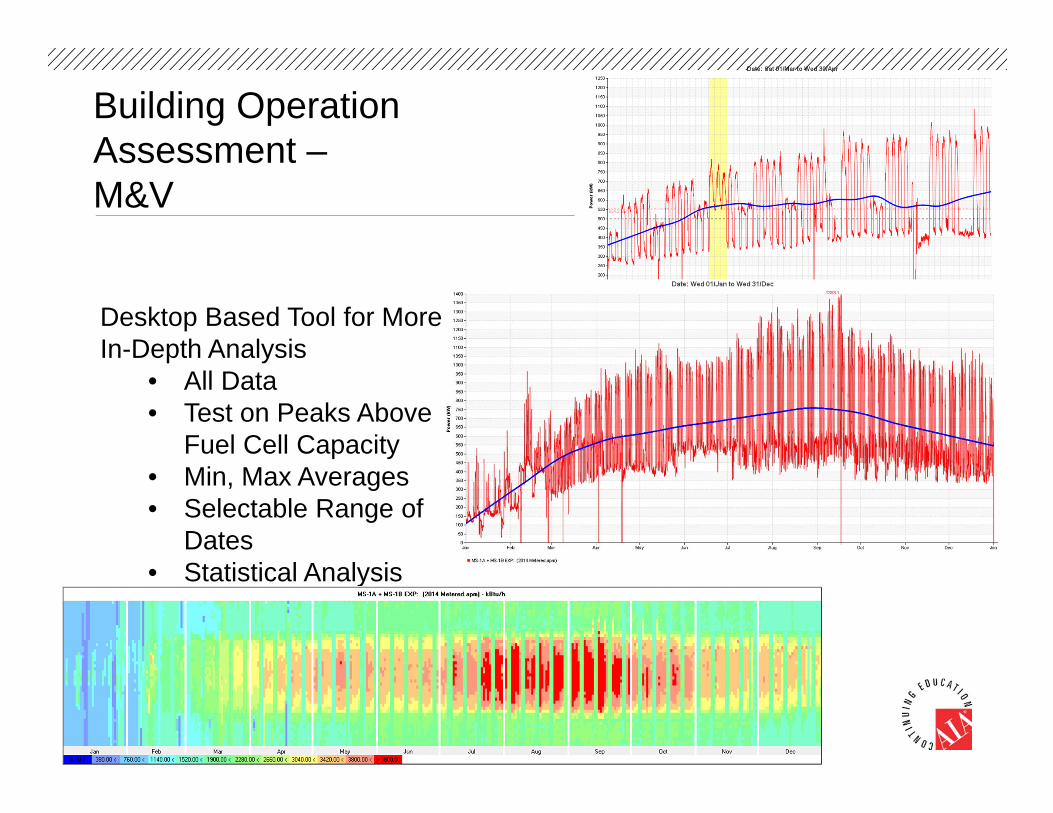
Desktop Based Tool for More In-Depth Analysis
• All Data• Test on Peaks Above
Fuel Cell Capacity• Min, Max Averages• Selectable Range of
Dates• Statistical Analysis
Building Operation Assessment –M&V
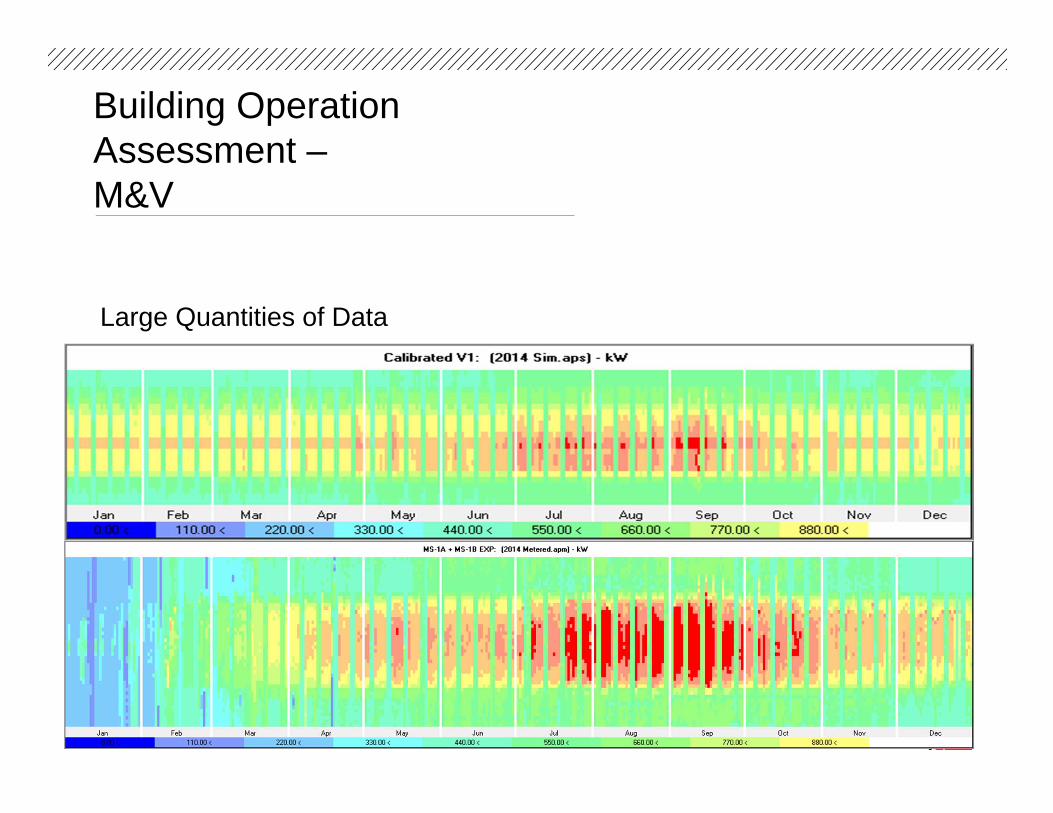
Large Quantities of Data
Building Operation Assessment –M&V
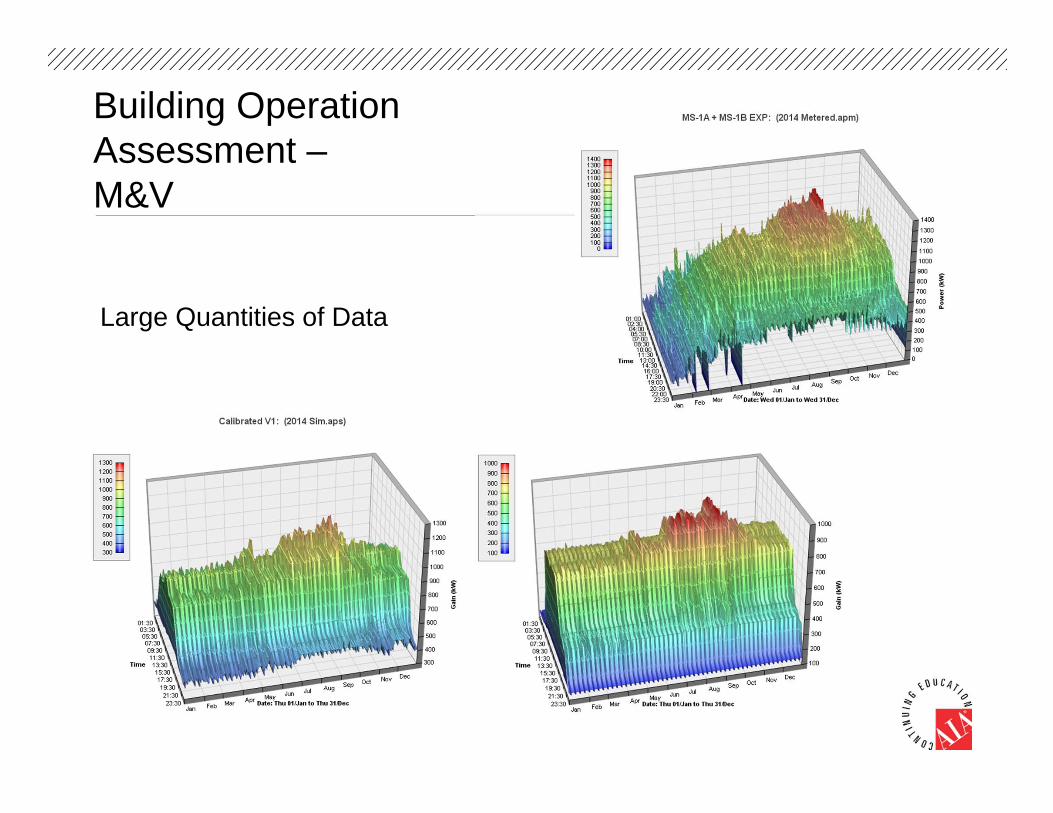
Large Quantities of Data
Building Operation Assessment –M&V
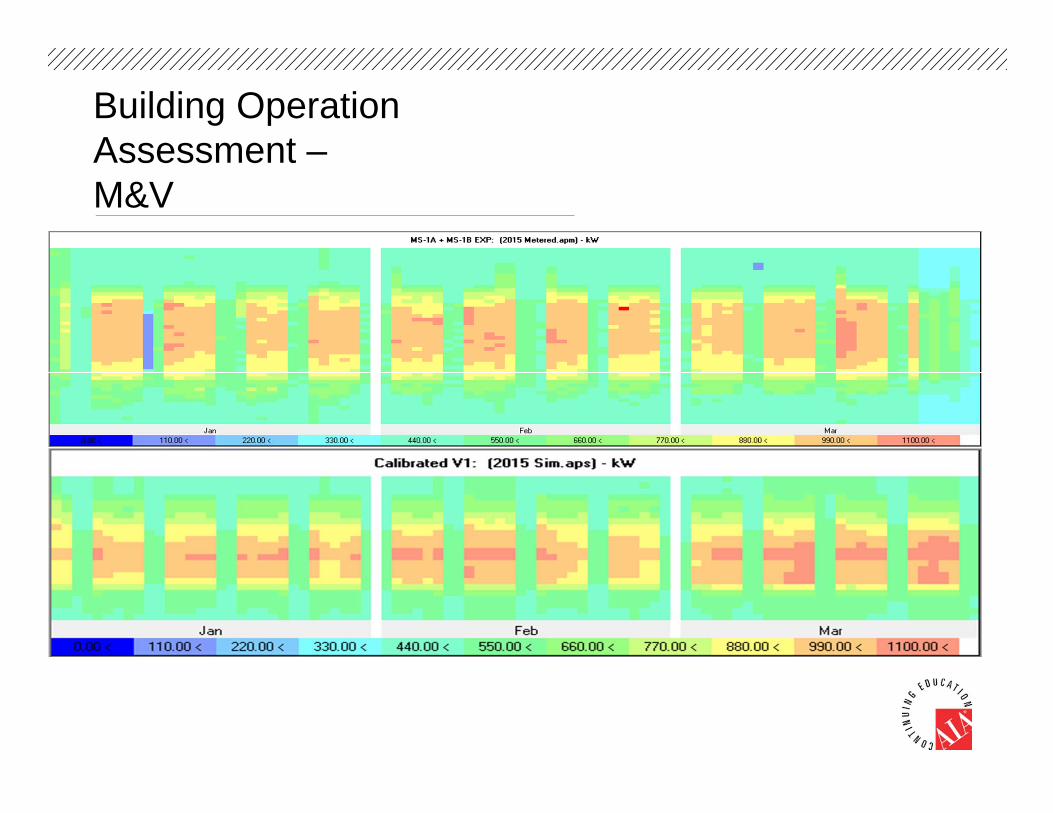
Heat Maps – Large Quantities of Data
Building Operation Assessment –M&V
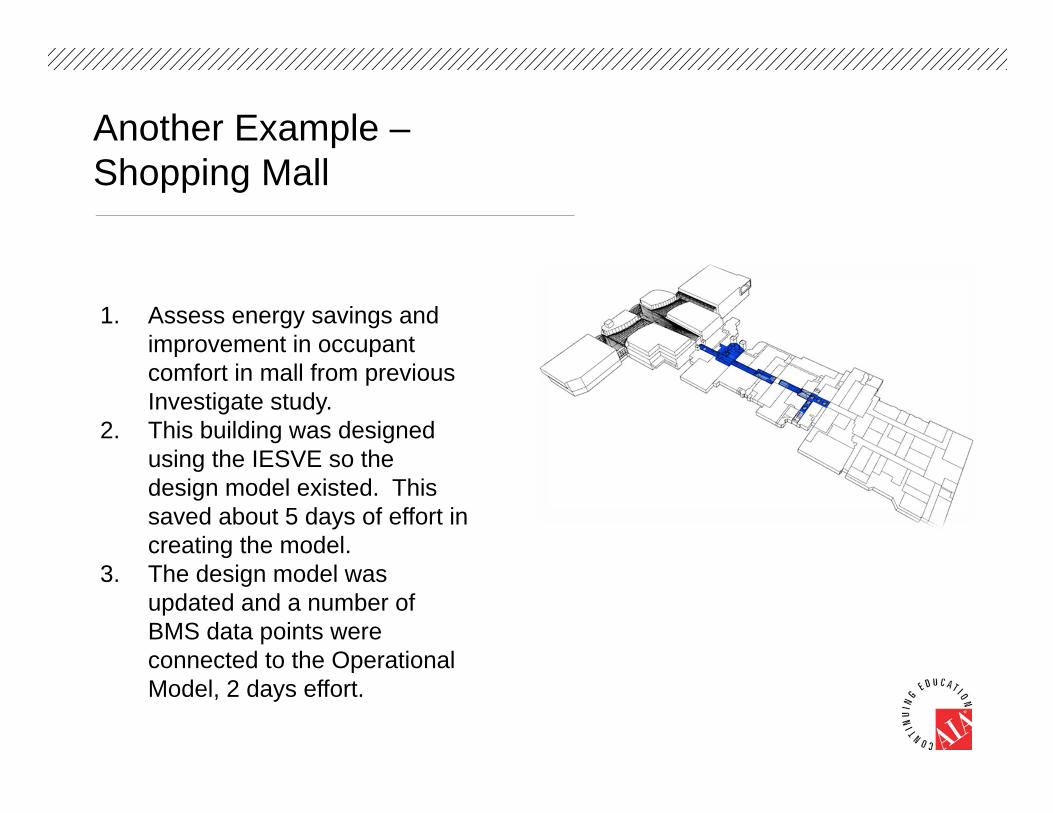
1. Assess energy savings and improvement in occupant comfort in mall from previous Investigate study.
2. This building was designed using the IESVE so the design model existed. This saved about 5 days of effort in creating the model.
3. The design model was updated and a number of BMS data points were connected to the Operational Model, 2 days effort.
Another Example –Shopping Mall

4. The difference in the BMS data (blue) and the Operational Model predicted data (red) is substantial.
5. Identified heating plant ‘on’ when temperate setting is exceeded
6. Benefits:• 30% Energy reduction
through the heating season.• Education of FM Manager
and change in user behaviour• Energy cost can be reduced
by better control of the energy supplied to the space.
Another Example –Shopping Mall
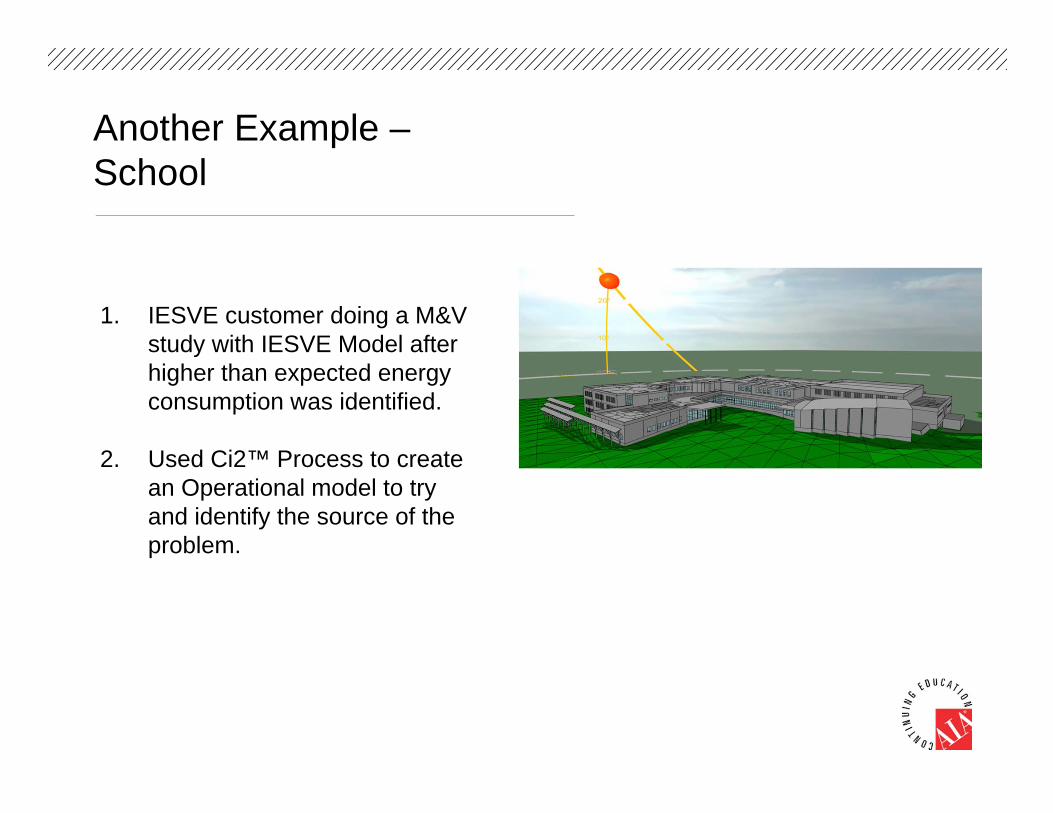
1. IESVE customer doing a M&V study with IESVE Model after higher than expected energy consumption was identified.
2. Used Ci2™ Process to create an Operational model to try and identify the source of the problem.
Another Example –School
Another Example –School
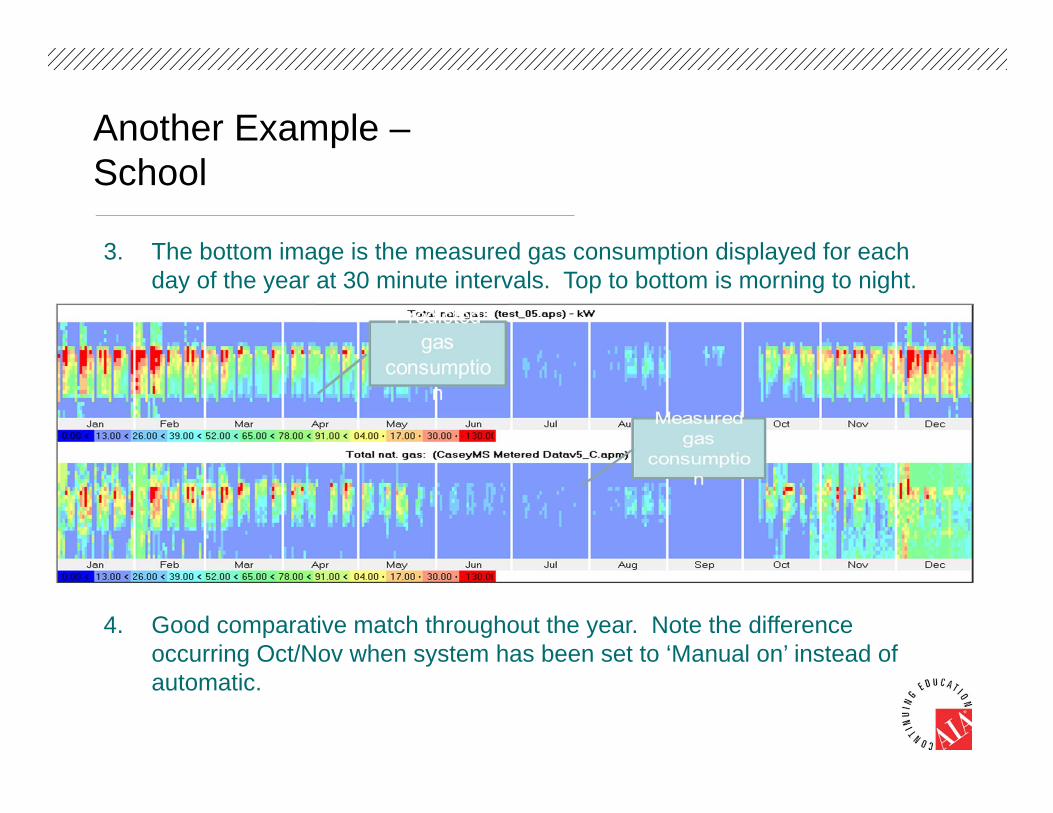
3. The bottom image is the measured gas consumption displayed for each day of the year at 30 minute intervals. Top to bottom is morning to night.
4. Good comparative match throughout the year. Note the difference occurring Oct/Nov when system has been set to ‘Manual on’ instead of automatic.
• Why are we off our original estimates?• Longer Hours and Non-
Segregated Area• Running System for
One After Hours Person• Higher Miscellaneous
Loads• Kitchen• Data Center
• Do We Need Additional Fuel Cell Capacity?
• Because of Cost We Need a Better Way to Calibrate Model
Building Operation Assessment –Capital Projects
Next Generation Analysis/Calibration
• More Detail on schedules and loads for:• Lighting• Data Center Loads• Kitchen Loads
• Use Metered Data To Create Actual Profiles of These or Any Measured Loads
• Ability to ‘feed back’ into SCL
Building Operation Assessment –Sub-Metered Data

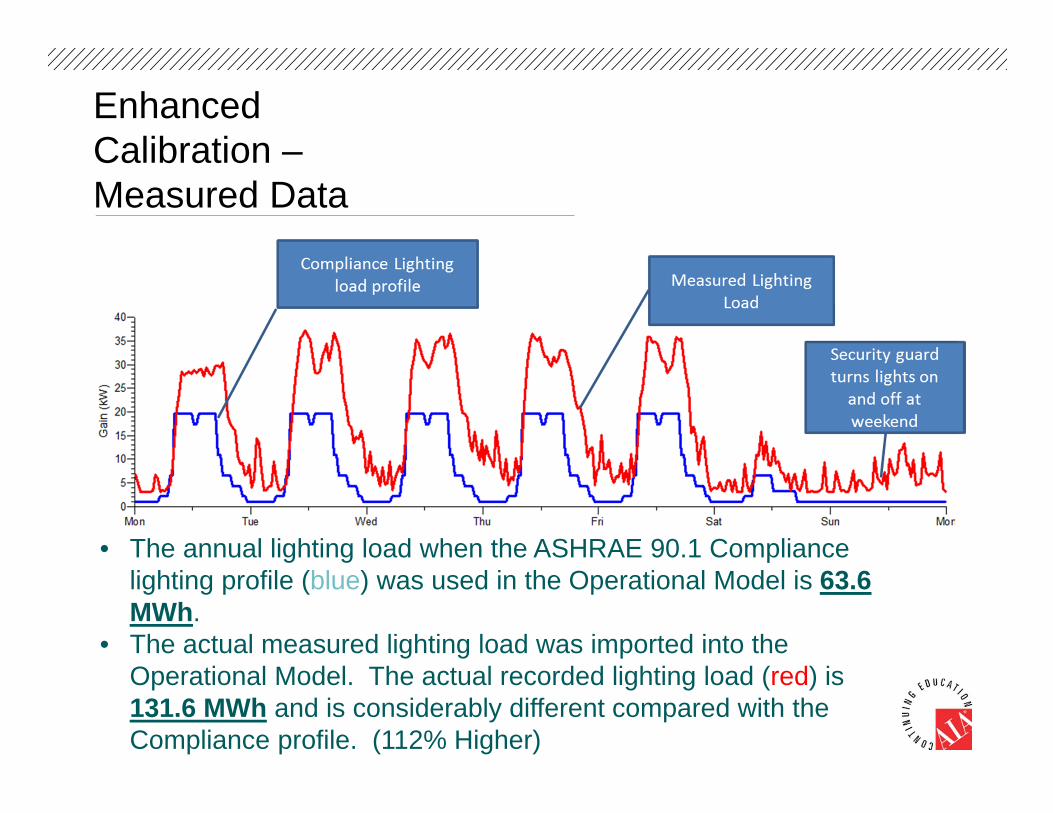
Enhanced Calibration –Measured DataConsider the following profiles:
• The Blue profile is a typical profile that a design team would use as a best guess of the energy used.
• The Red line is the actual or measured energy used.• Obviously if you can use the red line profile in your simulation it must
be more accurate than if you used the blue profile.
Enhanced Calibration –Measured Data
• The annual lighting load when the ASHRAE 90.1 Compliance lighting profile (blue) was used in the Operational Model is 63.6 MWh.
• The actual measured lighting load was imported into the Operational Model. The actual recorded lighting load (red) is 131.6 MWh and is considerably different compared with the Compliance profile. (112% Higher)
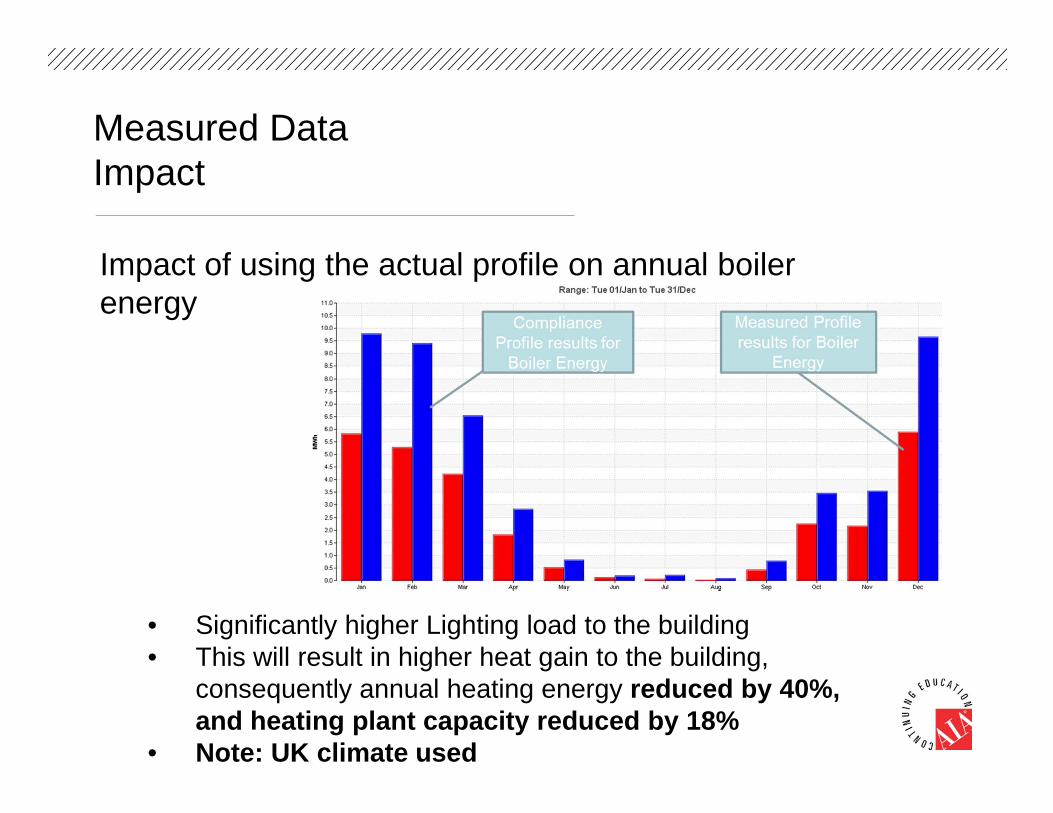
Measured Data Impact
Impact of using the actual profile on annual boiler energy
• Significantly higher Lighting load to the building• This will result in higher heat gain to the building,
consequently annual heating energy reduced by 40%, and heating plant capacity reduced by 18%
• Note: UK climate used
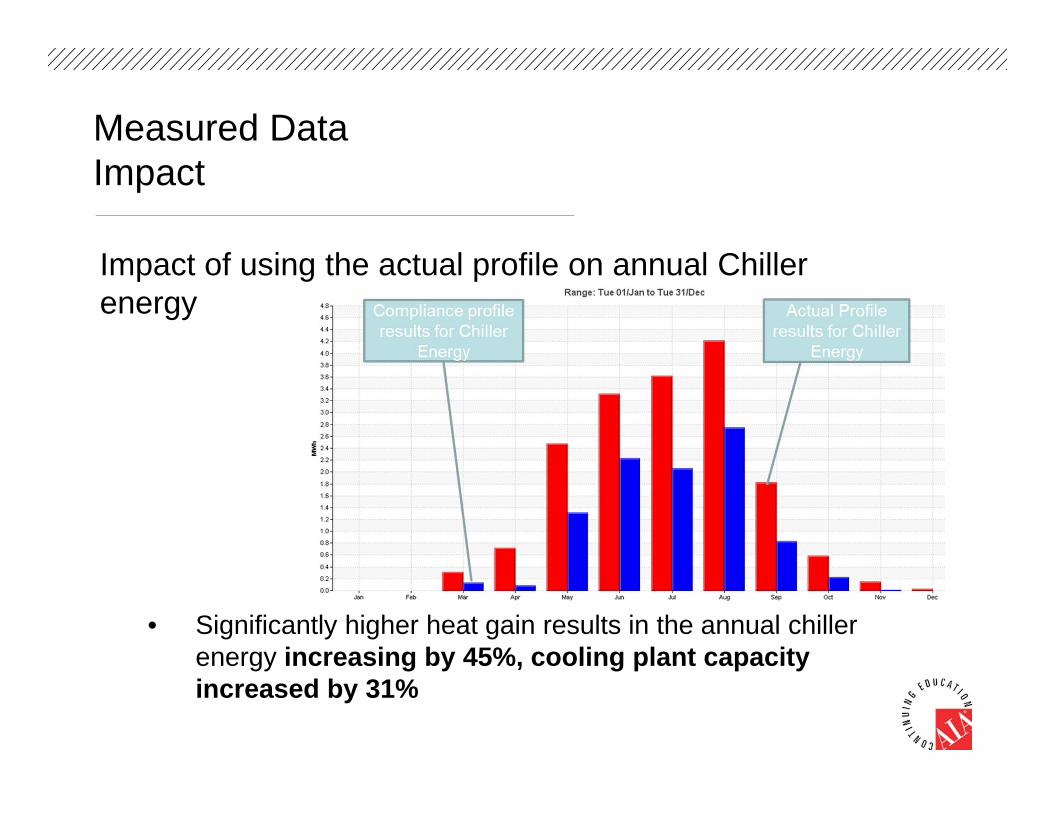
Measured Data Impact
Impact of using the actual profile on annual Chiller energy
• Significantly higher heat gain results in the annual chiller energy increasing by 45%, cooling plant capacity increased by 31%
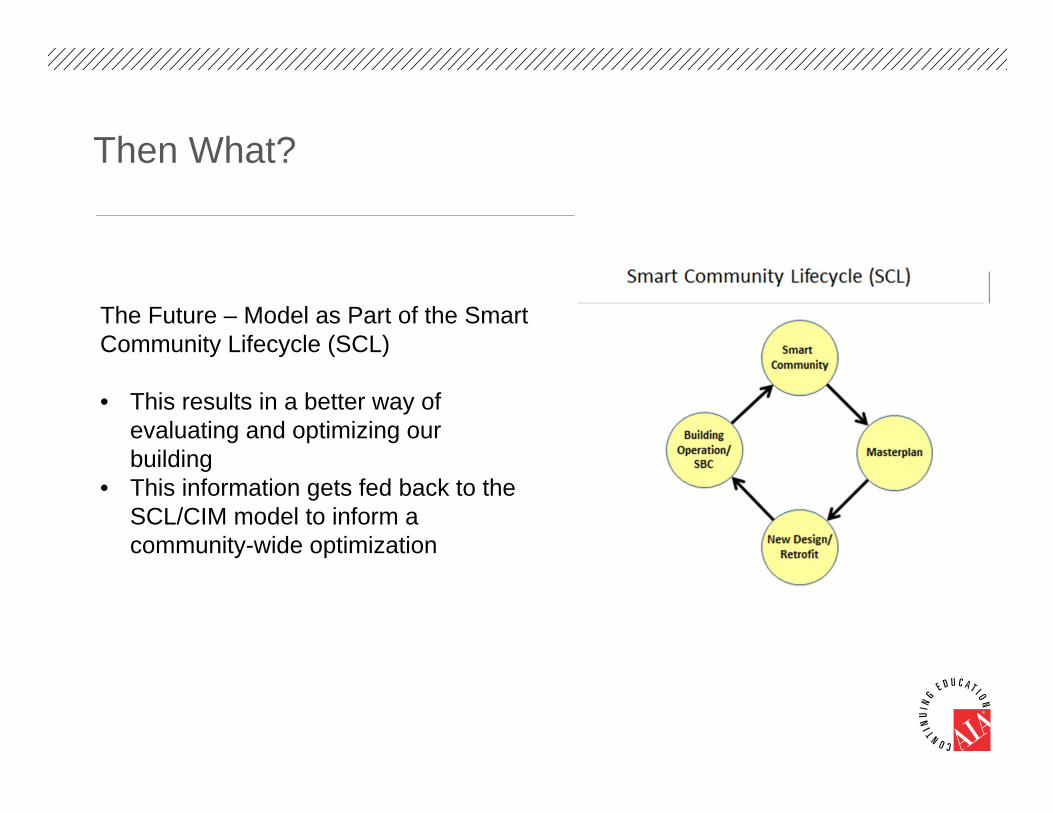
Then What?
The Future – Model as Part of the Smart Community Lifecycle (SCL)
• This results in a better way of evaluating and optimizing our building
• This information gets fed back to the SCL/CIM model to inform a community-wide optimization
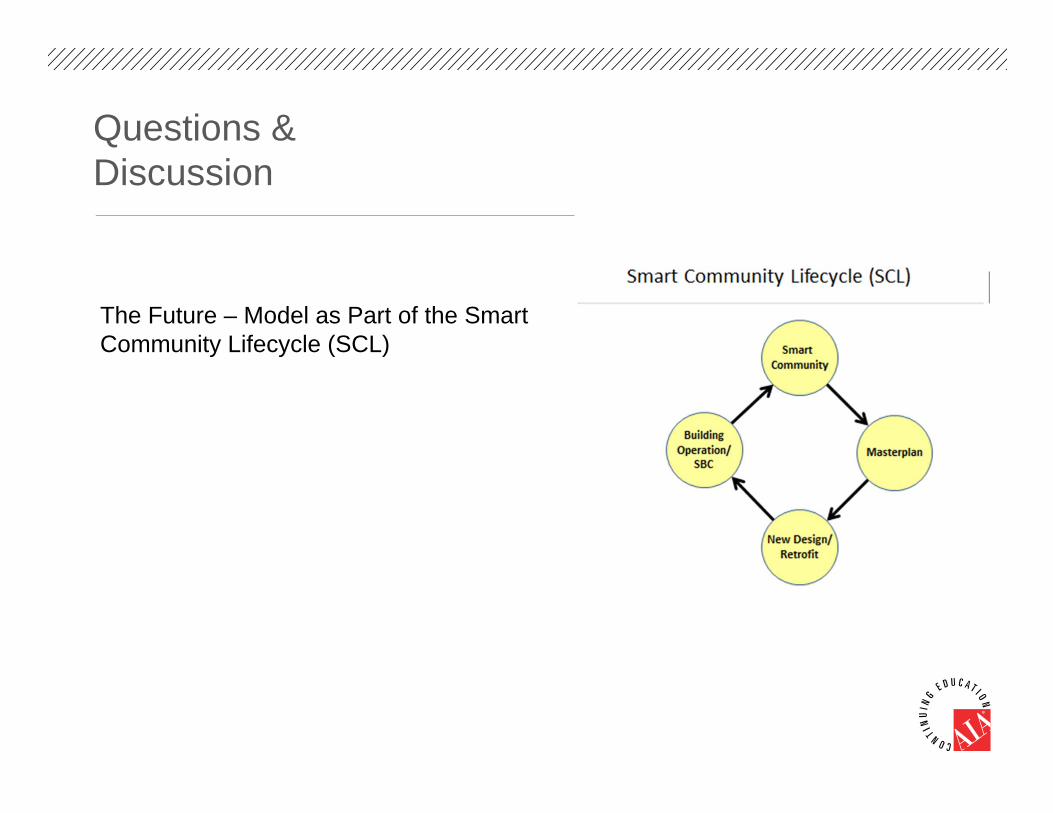
Questions & Discussion
The Future – Model as Part of the Smart Community Lifecycle (SCL)

This concludes The American Institute of Architects Continuing Education Systems Course
Brenda MorawaE: [email protected]