Embed Size (px)
Citation preview
1

University of South FloridaUniversity of Southern
University of Southern MaineUniversity of St. Thomas
University of Tennessee, KnoxvilleUniversity of Texas - Austin
University of Texas at DallasUniversity of Texas Health
University of Texas Rio Grande ValleyUniversity of the Sciences in Philadelphia
University of ToledoUniversity of Vermont
University of WashingtonUniversity of West Florida
University of Wisconsin - MadisonVanderbilt University
Virginia Commonwealth UniversityWake Forest University
Washburn UniversityWashington State University
Washington State University - Tri-Cities CampusWashington State University - Vancouver
Washington University in St. LouisWayne State University
Wellesley CollegeWesleyan University
West Chester UniversityWest Virginia Health Science Center
West Virginia UniversityWestern Oregon University
Westfield State UniversityWidener University
Williams CollegeWorcester Polytechnic Institute
Worcester State UniversityXavier University
2017 State of Facilities in Higher Education
January 22, 2018
© 2017 Sightlines, LLC. All Rights Reserved. 3
2017 State of Facilities ReportComing soon!

© 2017 Sightlines, LLC. All Rights Reserved.4
Introduction & Agenda
Peter ReevesRegional Director, Member Services
Sightlines
The impact of space growth and how current enrollments trends offer opportunities for some campuses and pose a risk to others
The diminishing impact of investments and how campuses can prioritize finite capital resources
How flat operating budgets are affecting service levels across campus.
A summary of the 2017 trends and recommendations
Today’s topics include:
© 2017 Sightlines, LLC. All Rights Reserved.5
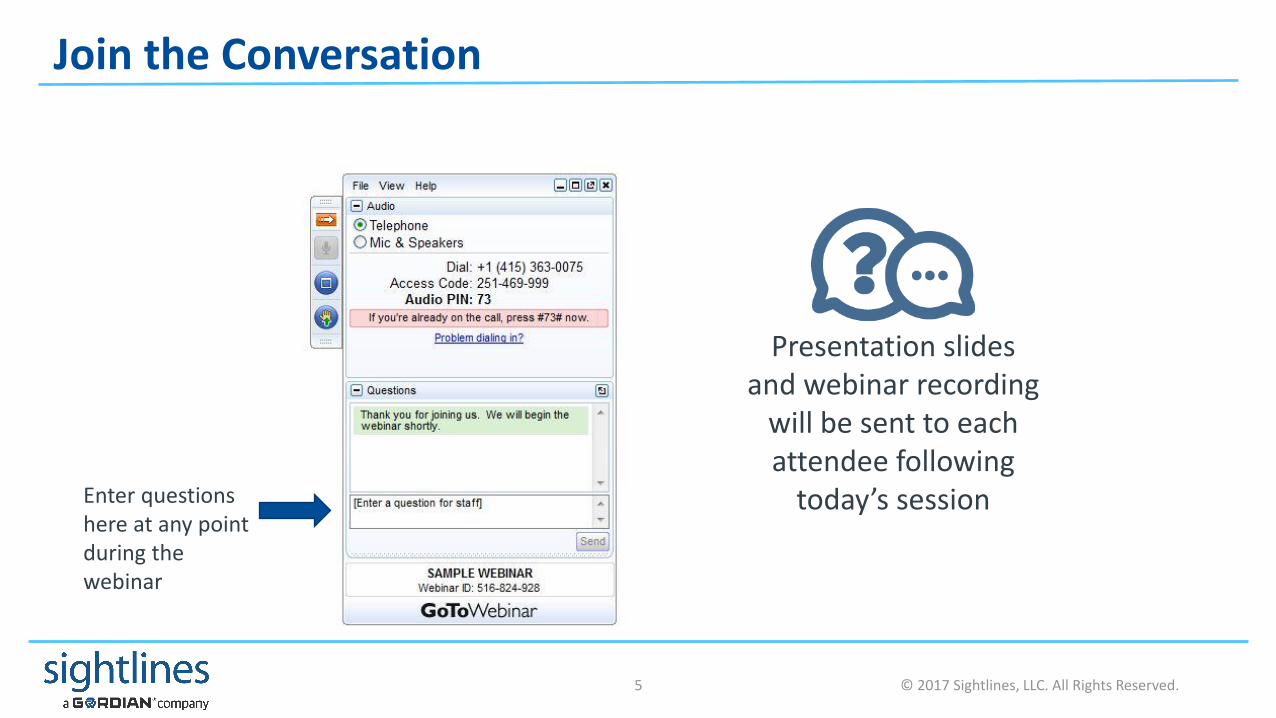
Join the Conversation
Enter questions here at any point during the webinar
Presentation slides and webinar recording
will be sent to each attendee following
today’s session
© 2017 Sightlines, LLC. All Rights Reserved.6
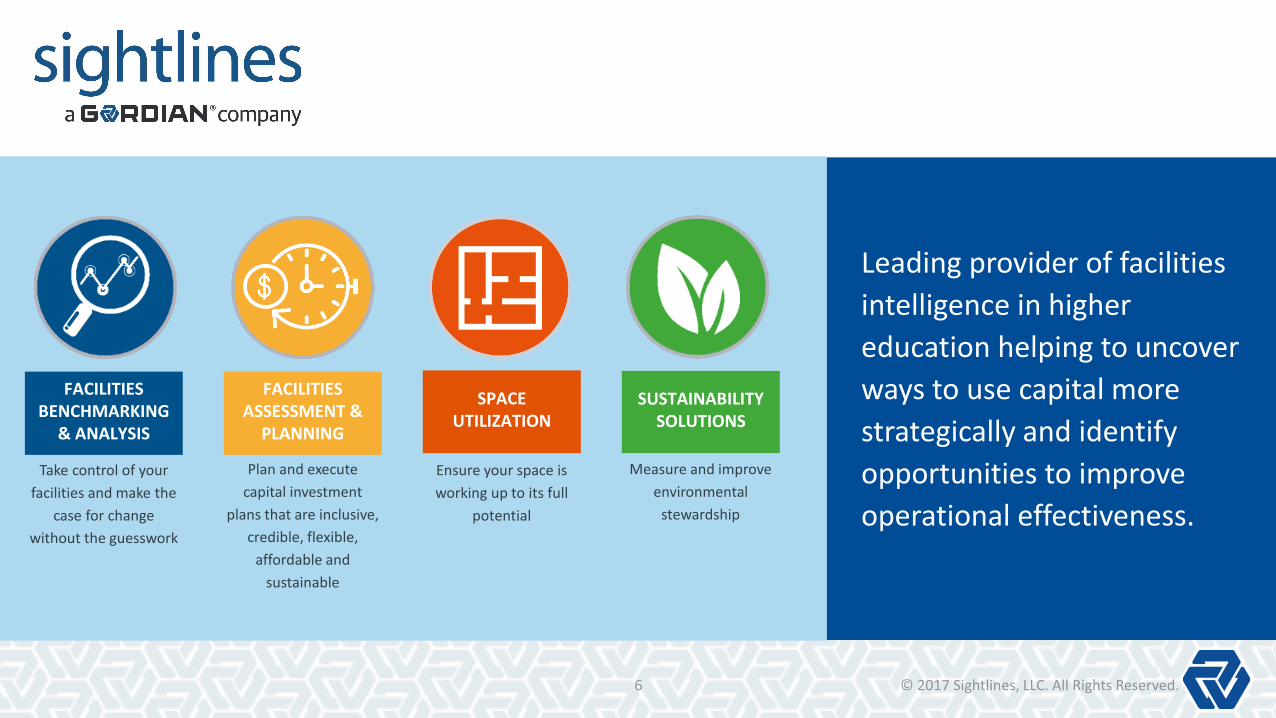
Leading provider of facilities
intelligence in higher
education helping to uncover
ways to use capital more
strategically and identify
opportunities to improve
operational effectiveness.
FACILITIES BENCHMARKING
& ANALYSIS
Take control of your
facilities and make the
case for change
without the guesswork
FACILITIES ASSESSMENT &
PLANNING
Plan and execute
capital investment
plans that are inclusive,
credible, flexible,
affordable and
sustainable
SPACE UTILIZATION
Ensure your space is
working up to its full
potential
SUSTAINABILITY SOLUTIONS
Measure and improve
environmental
stewardship

© 2017 Sightlines, LLC. All Rights Reserved.7
Sightlines by the NumbersRobust membership includes colleges, universities, consortiums, and state systems
Sightlines has advised state systems in:
• Alaska• California• Florida• Hawaii• Maine
• Massachusetts• Minnesota• Mississippi• Missouri• Nebraska
• New Hampshire• New Jersey• Pennsylvania• Texas• Washington
44States+DC
90%Memberretention
rate
360+ROPA
Members
450Colleges &
Universities
15State Systems
currently being advised
5Canadianprovinces
© 2017 Sightlines, LLC. All Rights Reserved.8
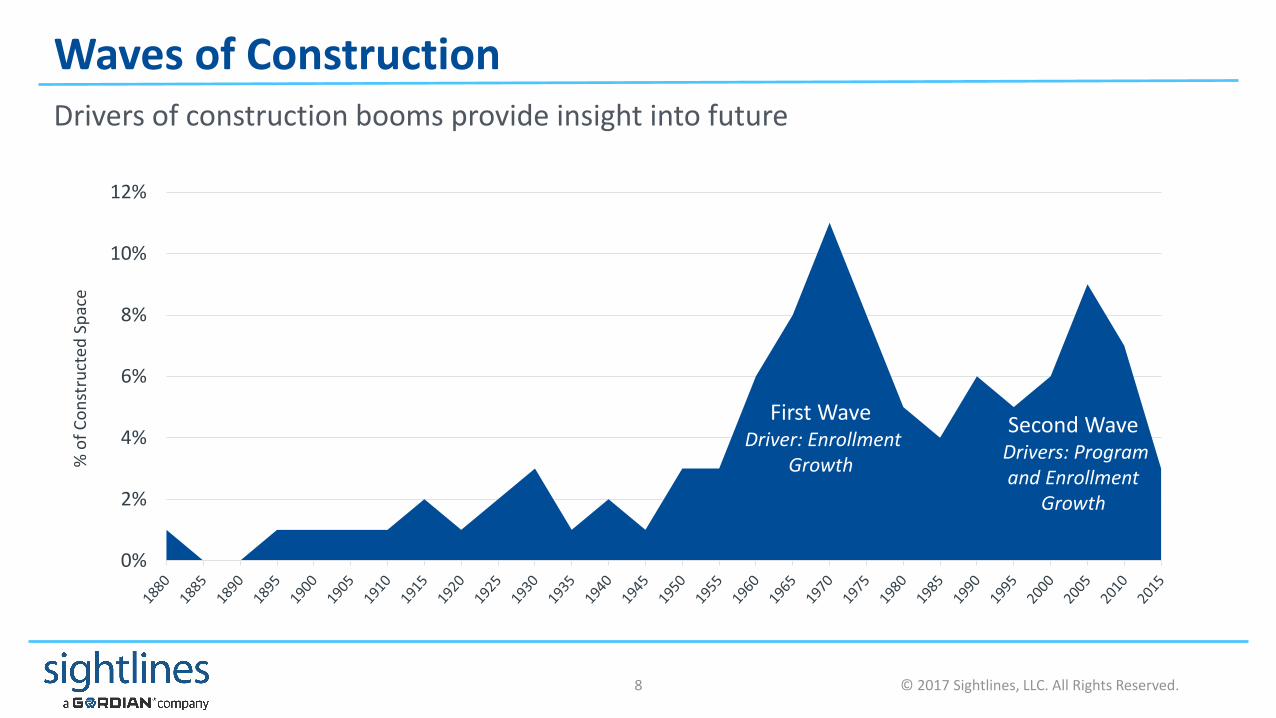
Waves of ConstructionDrivers of construction booms provide insight into future
0%
2%
4%
6%
8%
10%
12%
% o
f C
on
stru
cted
Sp
ace
First WaveDriver: Enrollment
Growth
Second WaveDrivers: Program and Enrollment
Growth

© 2017 Sightlines, LLC. All Rights Reserved.9
Themes
Space: Growth Sustains Some Campuses, a Risk to OthersSpace growth continues, surprising us. Some campuses are indeed chasing rising enrollment and still many others are pursuing a high risk strategy to build their way out of enrollment doldrums. Are these approaches working?
Capital: Investment Impact DiminishingWith “first wave” building systems and components reaching the end of their useful life and “second wave” buildings beginning to demand capital investments, institutions are facing record amounts of capital needs, which are only poised to grow in the near term. How will campuses prioritize finite capital resources between these two competing areas of campus?
Operations: Budgets Impacting ServiceAs the amount and complexity of space has grown, operations resources have not increased to meet these demands, affecting service levels. As the operational challenges are only increased with “second wave” space aging, how do institutions maintain adequate service levels or manage the consequences?
Growth Sustains Some Campuses, a Risk to Others
Space growth continues, surprising us. Some campuses are indeed chasing rising enrollment and still many others are pursuing a high risk strategy to build their way out of enrollment doldrums. Are these approaches working?
© 2017 Sightlines, LLC. All Rights Reserved.11
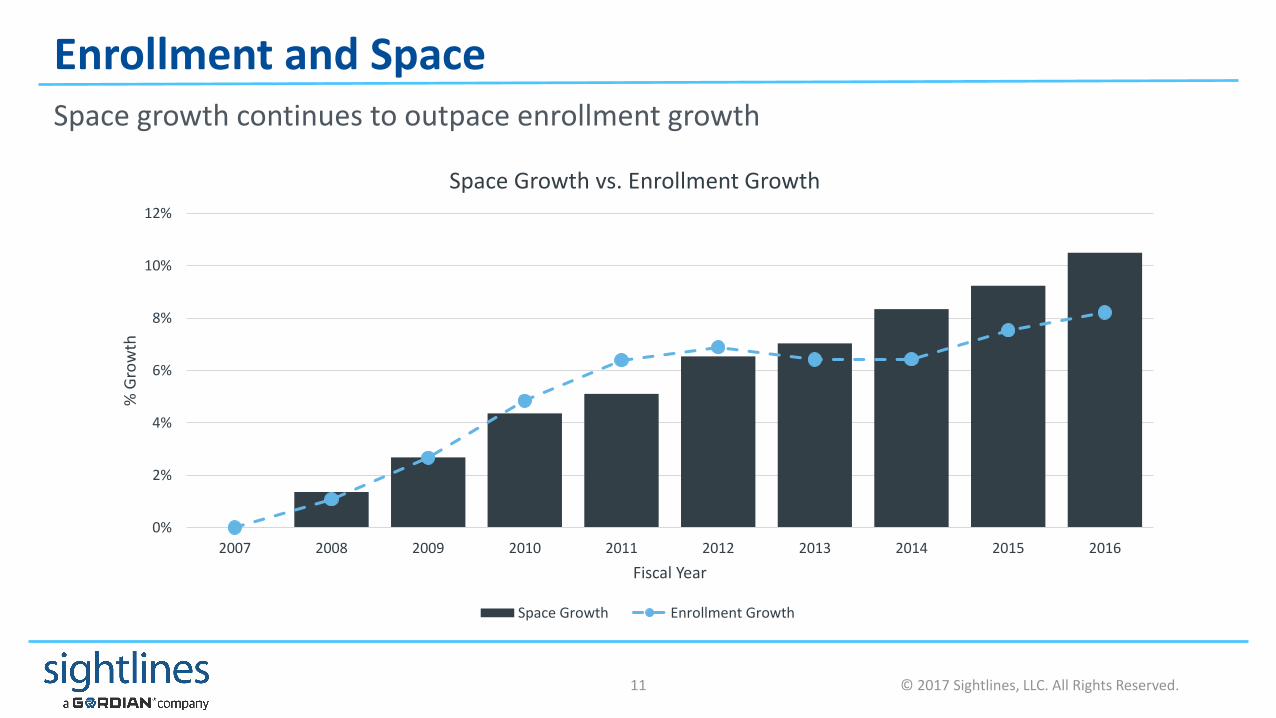
Enrollment and SpaceSpace growth continues to outpace enrollment growth
0%
2%
4%
6%
8%
10%
12%
2007 2008 2009 2010 2011 2012 2013 2014 2015 2016
% G
row
th
Fiscal Year
Space Growth vs. Enrollment Growth
Space Growth Enrollment Growth

© 2017 Sightlines, LLC. All Rights Reserved.12
Enrollment Gains Centered at Research Institutions
-2%
0%
2%
4%
6%
8%
10%
12%
14%
16%
2007 08 09 10 11 12 13 14 15 16 2007 08 09 10 11 12 13 14 15 16 2007 08 09 10 11 12 13 14 15 16
% G
row
th
Fiscal Year
Space Growth vs. Enrollment GrowthBy Institution Type
Space Growth Enrollment Growth
Baccalaureate Master’s Research

© 2017 Sightlines, LLC. All Rights Reserved.13
If You Build It, They Don’t Always Show UpCampus growth does not correlate directly with enrollment changes
-5%
0%
5%
10%
15%
20%
0-5% 5-10% 10-15% 0-5% 5-10% 10-15% 15-25% 0-5% 5-10% 10-15% 15-25%
Ave
rage
En
rollm
ent
Gro
wth
Space Growth Buckets
Space Growth vs. Enrollment Growth 2007-16
Baccalaureate Master’s Research

© 2017 Sightlines, LLC. All Rights Reserved.14
Resources Affect Growth BehaviorsLess well-resourced exhibit widely varying responses to circumstances
-30%
-10%
10%
30%
50%
70%
90%
-10% 0% 10% 20% 30% 40% 50% 60%
Enro
llmen
t G
row
th
Space Growth-30%
-10%
10%
30%
50%
70%
90%
-10% 0% 10% 20% 30% 40% 50% 60%
Enro
llmen
t G
row
th
Space Growth
Endowment > $250,000 per student Endowment < $250,000 per student
* Data for 91 primarily private institutions
© 2017 Sightlines, LLC. All Rights Reserved.15
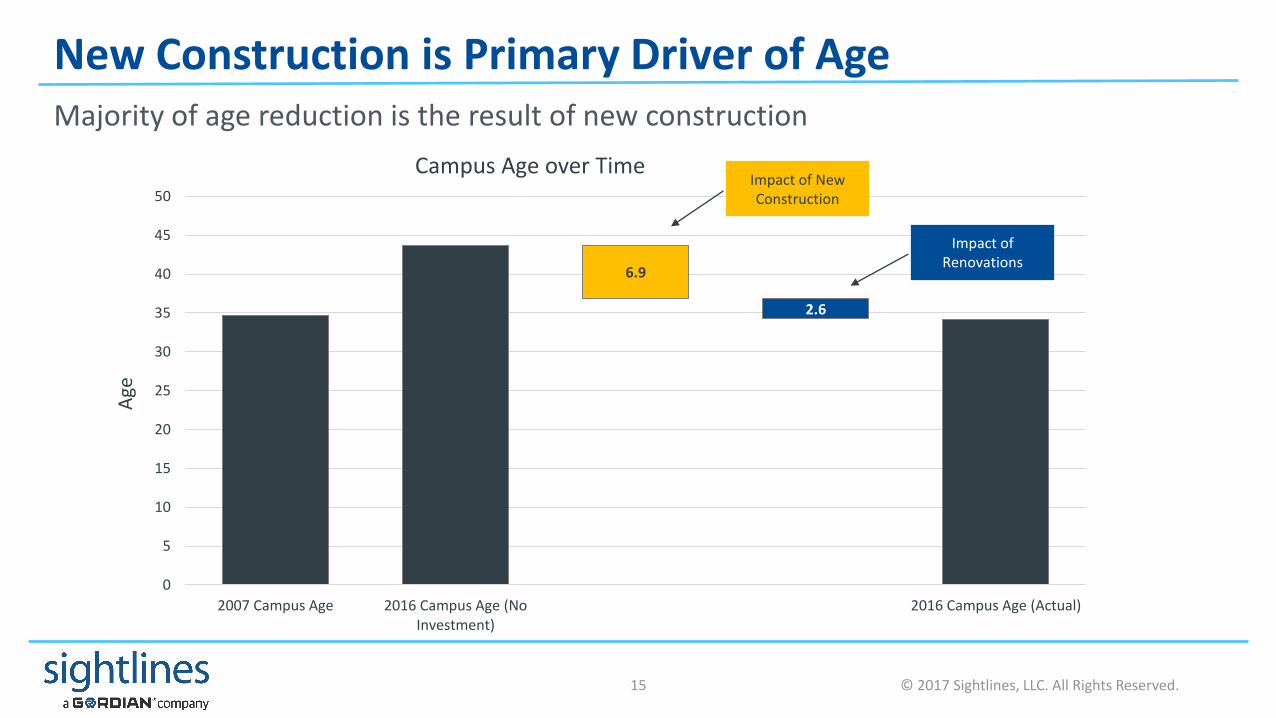
New Construction is Primary Driver of AgeMajority of age reduction is the result of new construction
6.9
2.6
0
5
10
15
20
25
30
35
40
45
50
2007 Campus Age 2016 Campus Age (NoInvestment)
2016 Campus Age (Actual)
Age
Campus Age over TimeImpact of New Construction
Impact of Renovations

© 2017 Sightlines, LLC. All Rights Reserved.16
Customer Satisfaction Lowest in Older FacilitiesLack of renovations one contributor to the lower customer perception
4.34.1
3.4
3.83.93.6
3.23.63.5
3.33.1
3.43.7
3.22.9
3.2
1.0
1.5
2.0
2.5
3.0
3.5
4.0
4.5
5.0
General appearance of exteriors General repair of interior shell Temperature is frequently at areasonable level
Air quality is good
Cu
sto
mer
Sat
isfa
ctio
n S
cale
Reported Average Customer Satisfaction*
Under 10 10 to 25 25 to 50 Over 50
*Sample of 27 institutions, approximately 900 Buildings and 6,750 Respondents
© 2017 Sightlines, LLC. All Rights Reserved.17
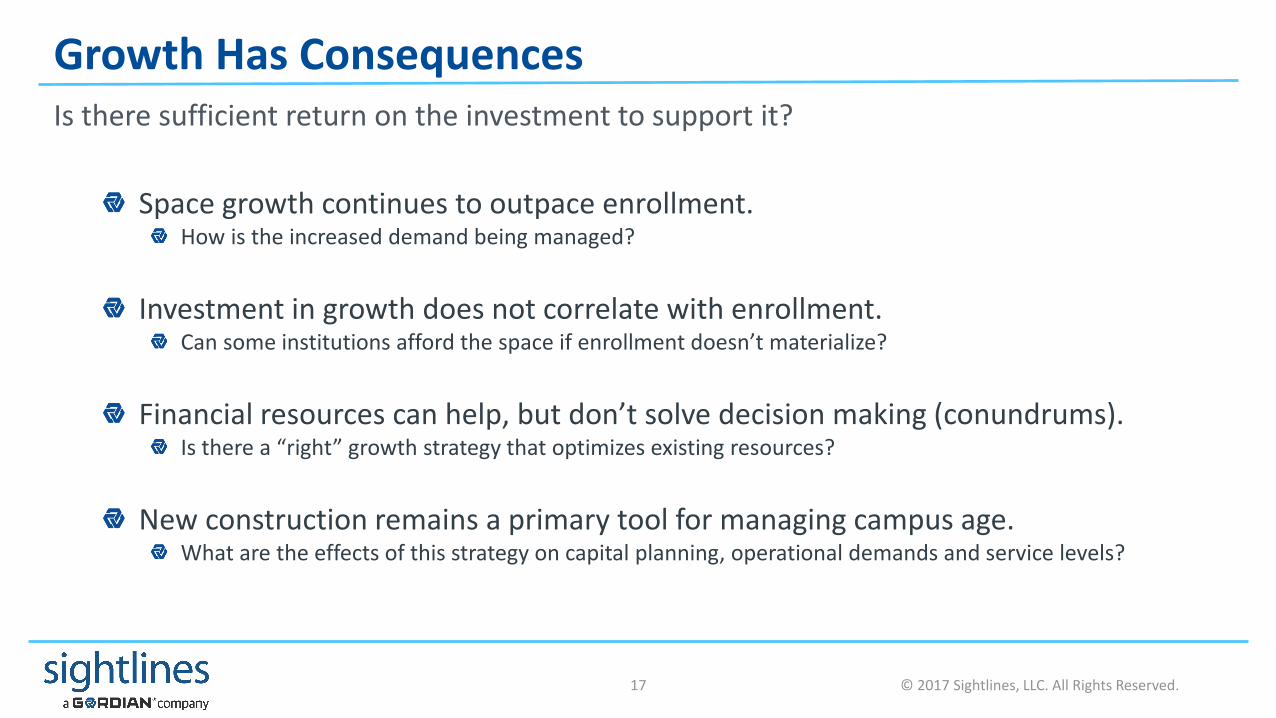
Growth Has ConsequencesIs there sufficient return on the investment to support it?
Space growth continues to outpace enrollment. How is the increased demand being managed?
Investment in growth does not correlate with enrollment. Can some institutions afford the space if enrollment doesn’t materialize?
Financial resources can help, but don’t solve decision making (conundrums). Is there a “right” growth strategy that optimizes existing resources?
New construction remains a primary tool for managing campus age. What are the effects of this strategy on capital planning, operational demands and service levels?

Investment Impact Diminishing
With “first wave” building systems and components reaching the end of their useful life and “second wave” buildings beginning to demand capital investments, institutions are facing record amounts of capital needs, which are only poised to grow in the near term. How will campuses prioritize finite capital resources between these two competing areas of campus?
© 2017 Sightlines, LLC. All Rights Reserved.19
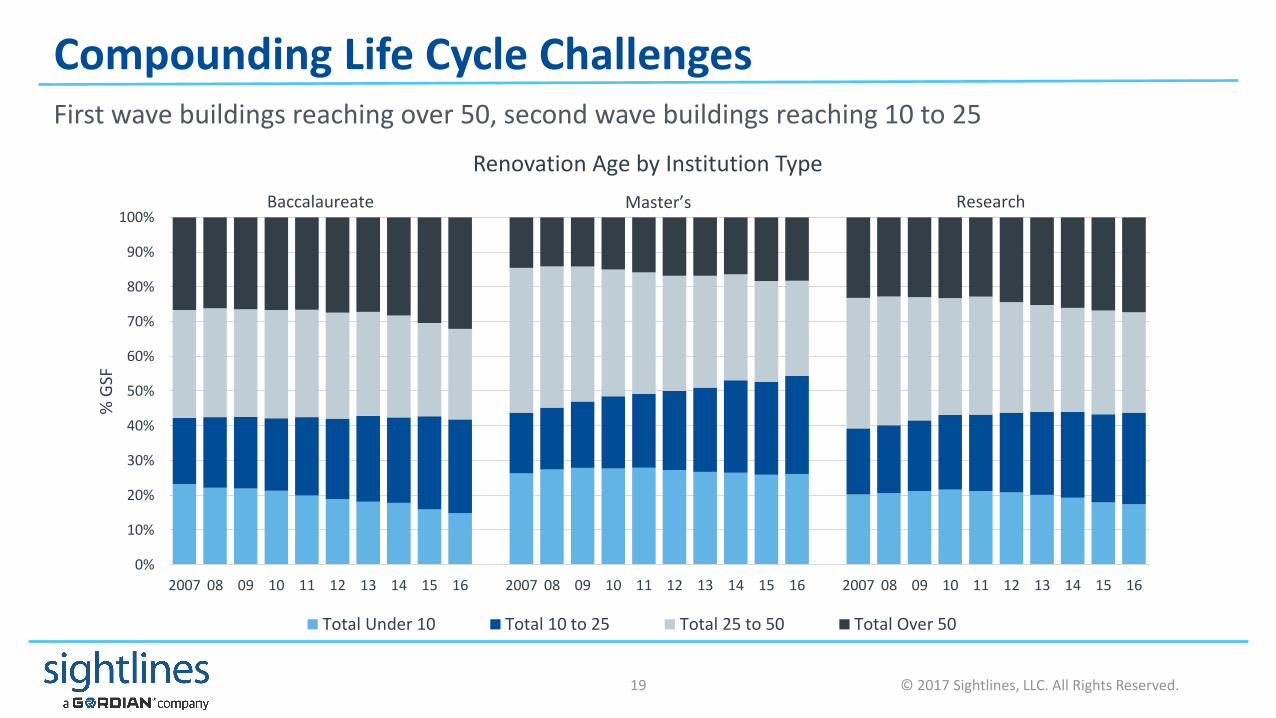
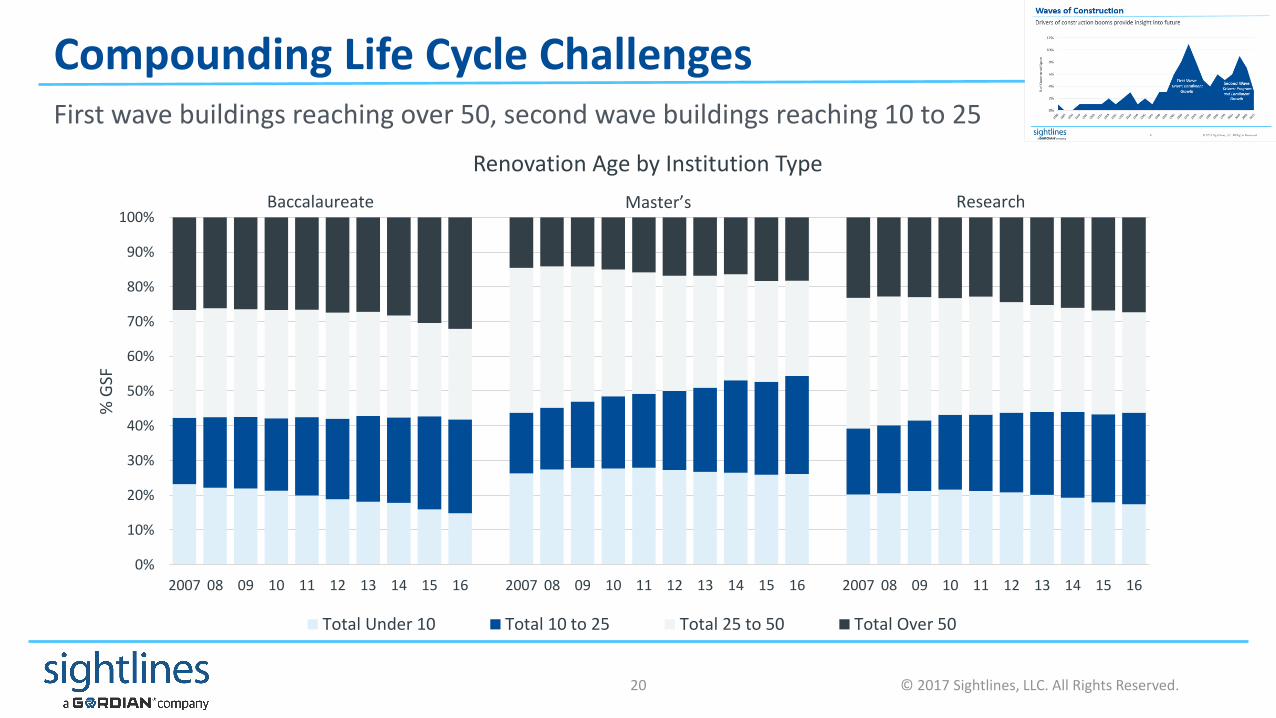
Compounding Life Cycle ChallengesFirst wave buildings reaching over 50, second wave buildings reaching 10 to 25
0%
10%
20%
30%
40%
50%
60%
70%
80%
90%
100%
2007 08 09 10 11 12 13 14 15 16 2007 08 09 10 11 12 13 14 15 16 2007 08 09 10 11 12 13 14 15 16
% G
SF
Renovation Age by Institution Type
Total Under 10 Total 10 to 25 Total 25 to 50 Total Over 50
Baccalaureate Master’s Research
© 2017 Sightlines, LLC. All Rights Reserved.20
Compounding Life Cycle Challenges
0%
10%
20%
30%
40%
50%
60%
70%
80%
90%
100%
2007 08 09 10 11 12 13 14 15 16 2007 08 09 10 11 12 13 14 15 16 2007 08 09 10 11 12 13 14 15 16
% G
SF
Renovation Age by Institution Type
Total Under 10 Total 10 to 25 Total 25 to 50 Total Over 50
Baccalaureate Master’s Research
First wave buildings reaching over 50, second wave buildings reaching 10 to 25
© 2017 Sightlines, LLC. All Rights Reserved.21
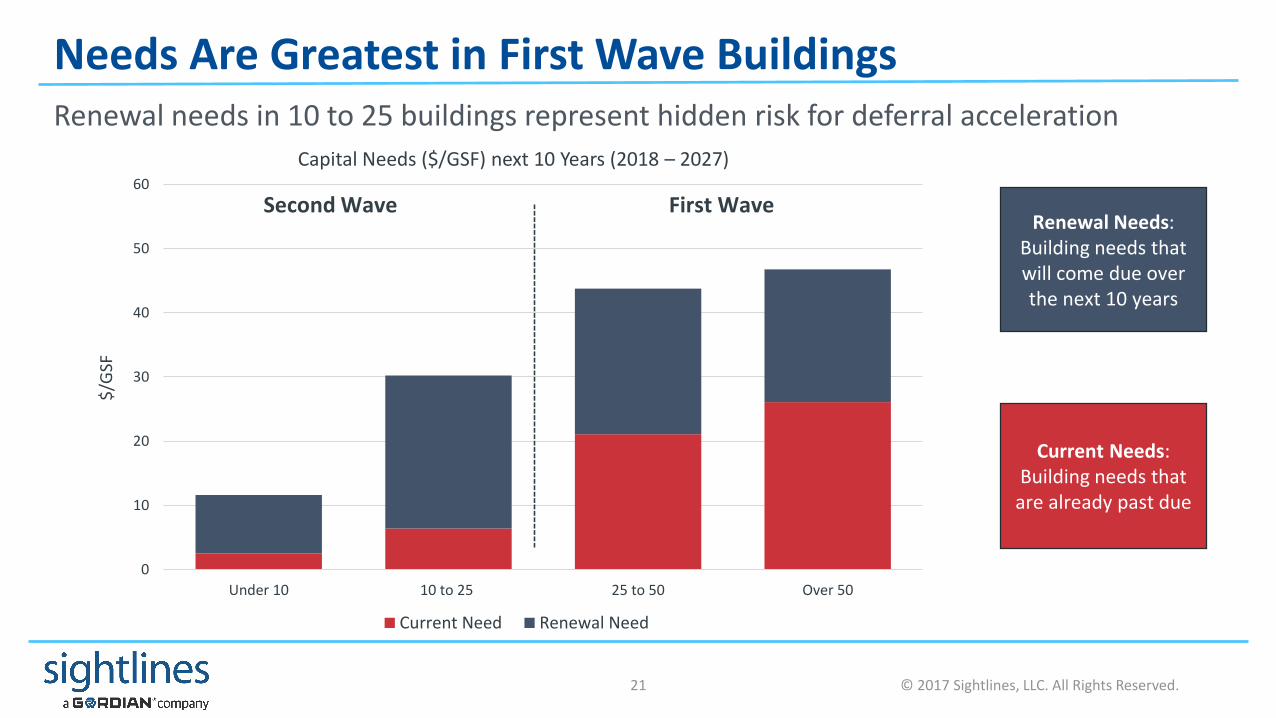
Needs Are Greatest in First Wave BuildingsRenewal needs in 10 to 25 buildings represent hidden risk for deferral acceleration
0
10
20
30
40
50
60
Under 10 10 to 25 25 to 50 Over 50
$/G
SF
Capital Needs ($/GSF) next 10 Years (2018 – 2027)
Current Need Renewal Need
Renewal Needs: Building needs that will come due over the next 10 years
Current Needs: Building needs that are already past due
Second Wave First Wave
© 2017 Sightlines, LLC. All Rights Reserved.22
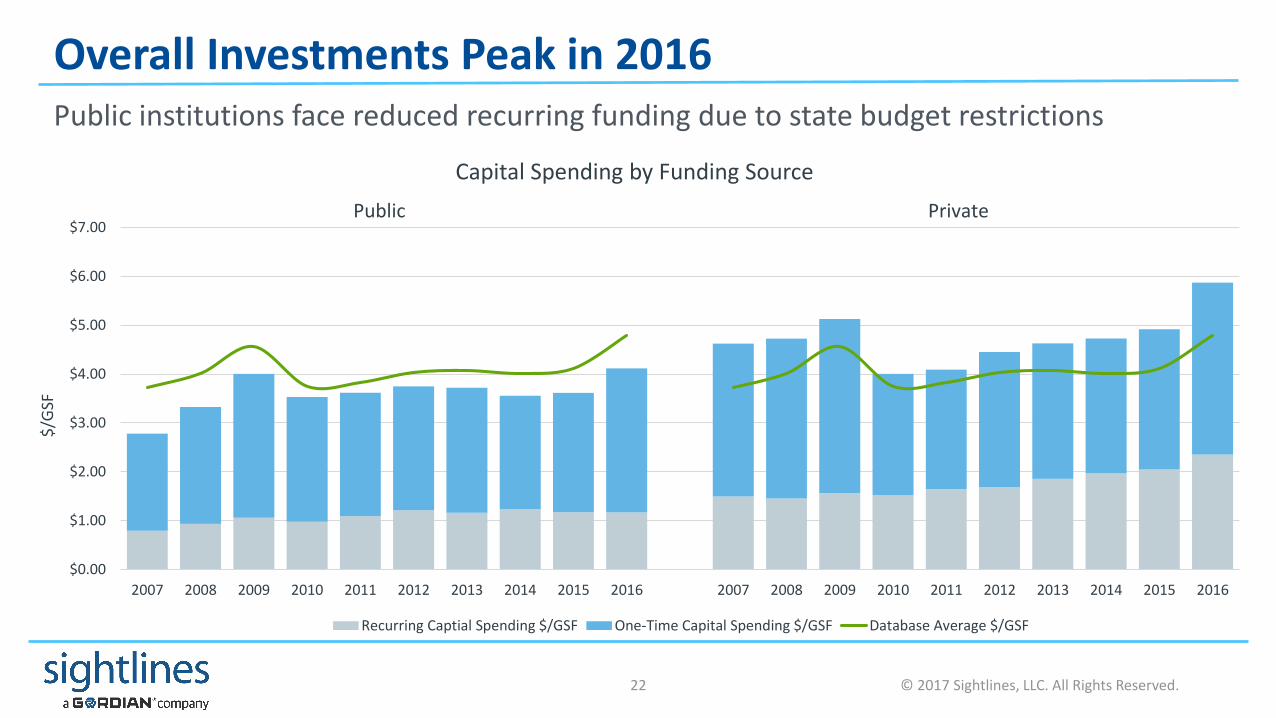
Overall Investments Peak in 2016Public institutions face reduced recurring funding due to state budget restrictions
$0.00
$1.00
$2.00
$3.00
$4.00
$5.00
$6.00
$7.00
2007 2008 2009 2010 2011 2012 2013 2014 2015 2016 2007 2008 2009 2010 2011 2012 2013 2014 2015 2016
$/G
SF
Capital Spending by Funding Source
Recurring Captial Spending $/GSF One-Time Capital Spending $/GSF Database Average $/GSF
Public Private
© 2017 Sightlines, LLC. All Rights Reserved.23
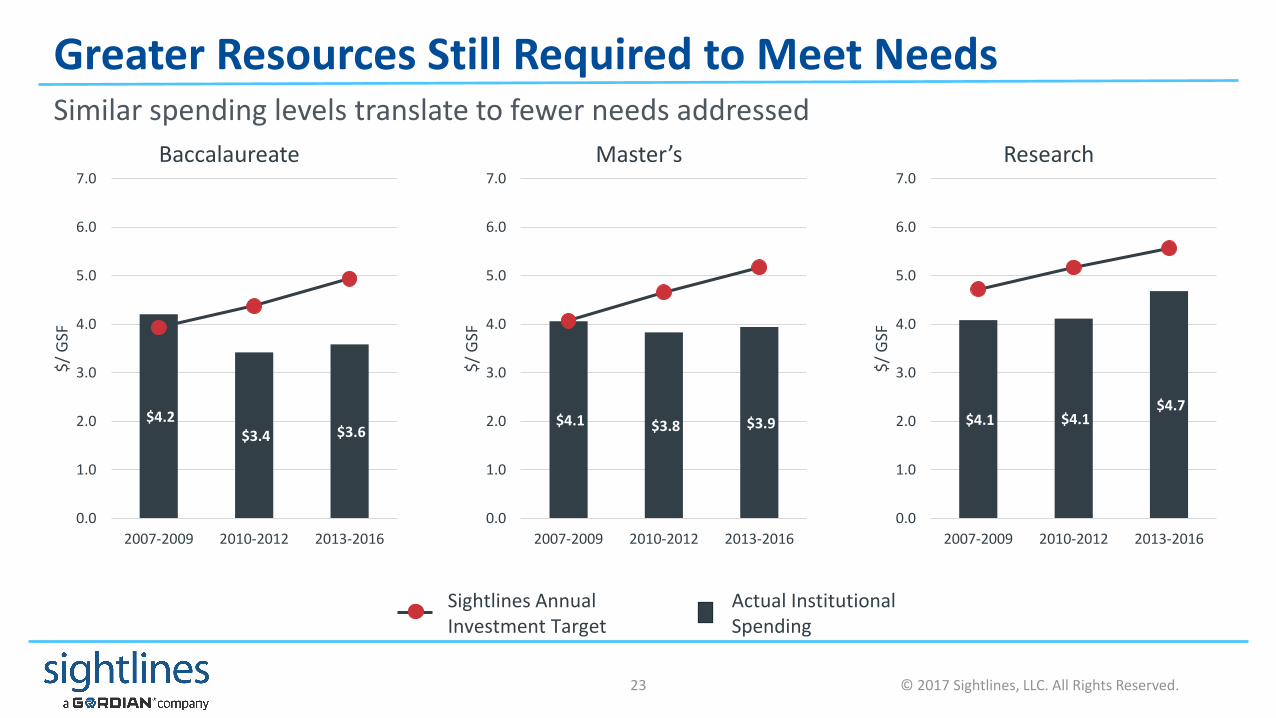
Greater Resources Still Required to Meet NeedsSimilar spending levels translate to fewer needs addressed
$4.2 $3.4 $3.6
0.0
1.0
2.0
3.0
4.0
5.0
6.0
7.0
2007-2009 2010-2012 2013-2016
$/
GSF
Baccalaureate
$4.1 $3.8 $3.9
0.0
1.0
2.0
3.0
4.0
5.0
6.0
7.0
2007-2009 2010-2012 2013-2016
$/
GSF
Master’s
$4.1 $4.1 $4.7
0.0
1.0
2.0
3.0
4.0
5.0
6.0
7.0
2007-2009 2010-2012 2013-2016
$/
GSF
Research
Sightlines Annual Investment Target
Actual Institutional Spending

© 2017 Sightlines, LLC. All Rights Reserved.24
Renewal Needs Continue to Grow Into the Early ‘20sWithout greater investment levels, deferral rate poised to grow
$-
$1.00
$2.00
$3.00
$4.00
$5.00
$6.00
$7.00
$8.00
$9.00
$10.00
2017 - 2019 2020 - 2023 2024 - 2026 2017 - 2019 2020 - 2023 2024 - 2026 2017 - 2019 2020 - 2023 2024 - 2026
$/G
SF
Upcoming Renewal Needs by Timeframe
Baccalaureate Master’s Research
© 2017 Sightlines, LLC. All Rights Reserved.25
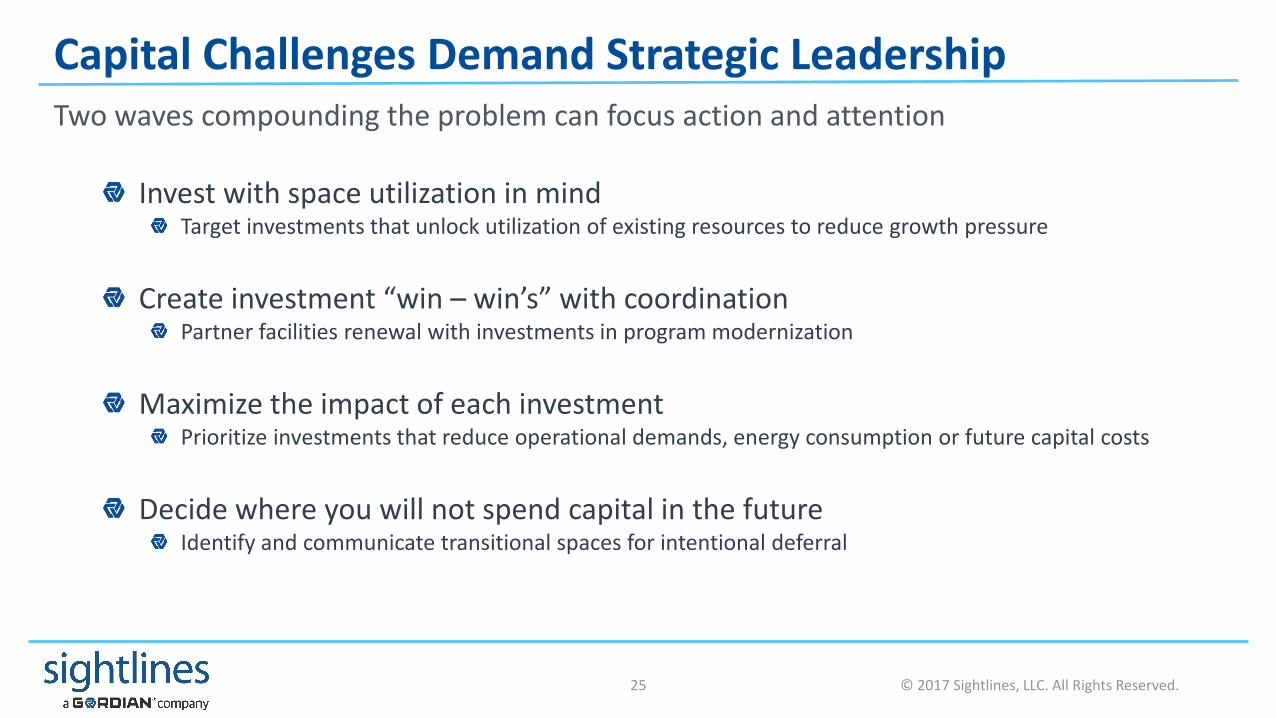
Capital Challenges Demand Strategic LeadershipTwo waves compounding the problem can focus action and attention
Invest with space utilization in mindTarget investments that unlock utilization of existing resources to reduce growth pressure
Create investment “win – win’s” with coordination Partner facilities renewal with investments in program modernization
Maximize the impact of each investmentPrioritize investments that reduce operational demands, energy consumption or future capital costs
Decide where you will not spend capital in the futureIdentify and communicate transitional spaces for intentional deferral

Budgets Impacting Service
As the amount and complexity of space has grown, operations resources have not increased to meet these demands, affecting service levels. As the operational challenges are only increased with “second wave” space aging, how do institutions maintain adequate service levels or manage the consequences?

© 2017 Sightlines, LLC. All Rights Reserved.27
Budget Growth Trails InflationInflation adjusted budget gap continues to grow
$0.00
$1.00
$2.00
$3.00
$4.00
$5.00
$6.00
$7.00
2007 2008 2009 2010 2011 2012 2013 2014 2015 2016
$/G
SF
Facilities Operating Budget
Daily Serivce PM Utilities CPI*Inflation is Bureau of Labor Standards CPI-U
© 2017 Sightlines, LLC. All Rights Reserved.28
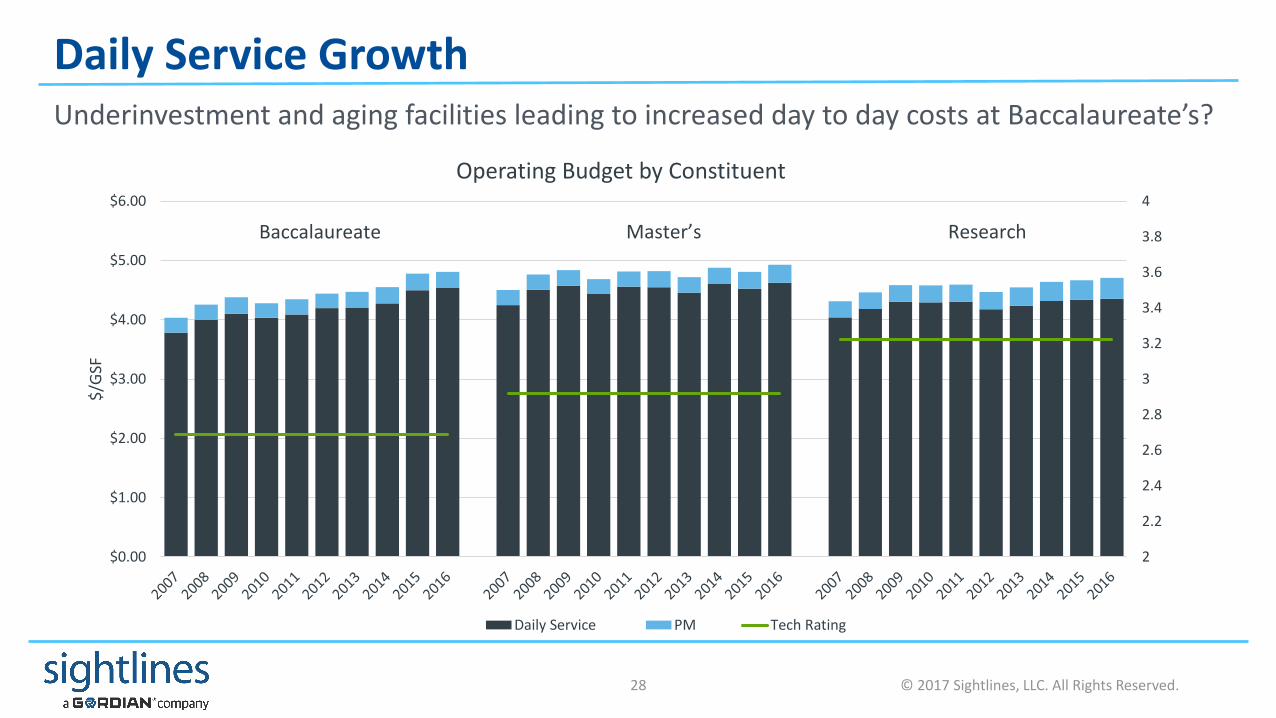
Daily Service GrowthUnderinvestment and aging facilities leading to increased day to day costs at Baccalaureate’s?
2
2.2
2.4
2.6
2.8
3
3.2
3.4
3.6
3.8
4
$0.00
$1.00
$2.00
$3.00
$4.00
$5.00
$6.00
$/G
SF
Operating Budget by Constituent
Daily Service PM Tech Rating
Baccalaureate Master’s Research
© 2017 Sightlines, LLC. All Rights Reserved.29
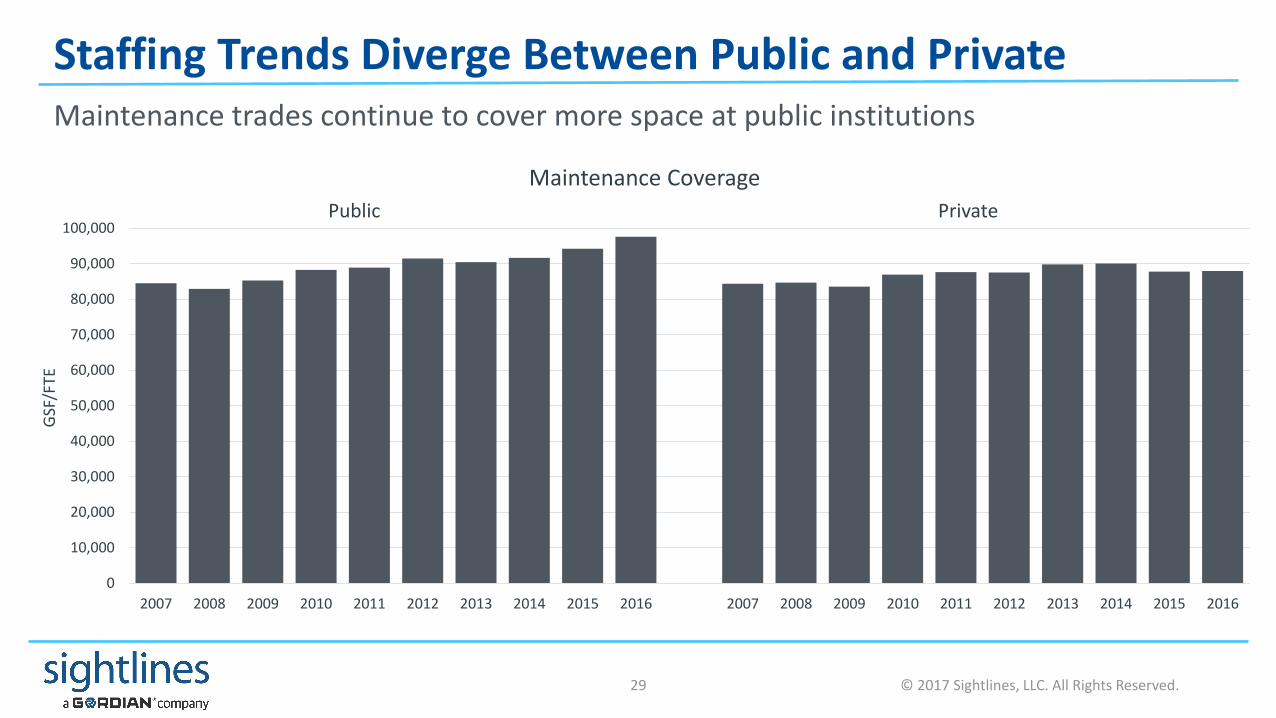
Staffing Trends Diverge Between Public and PrivateMaintenance trades continue to cover more space at public institutions
0
10,000
20,000
30,000
40,000
50,000
60,000
70,000
80,000
90,000
100,000
2007 2008 2009 2010 2011 2012 2013 2014 2015 2016 2007 2008 2009 2010 2011 2012 2013 2014 2015 2016
GSF
/FTE
Maintenance Coverage
Public Private
© 2017 Sightlines, LLC. All Rights Reserved.30
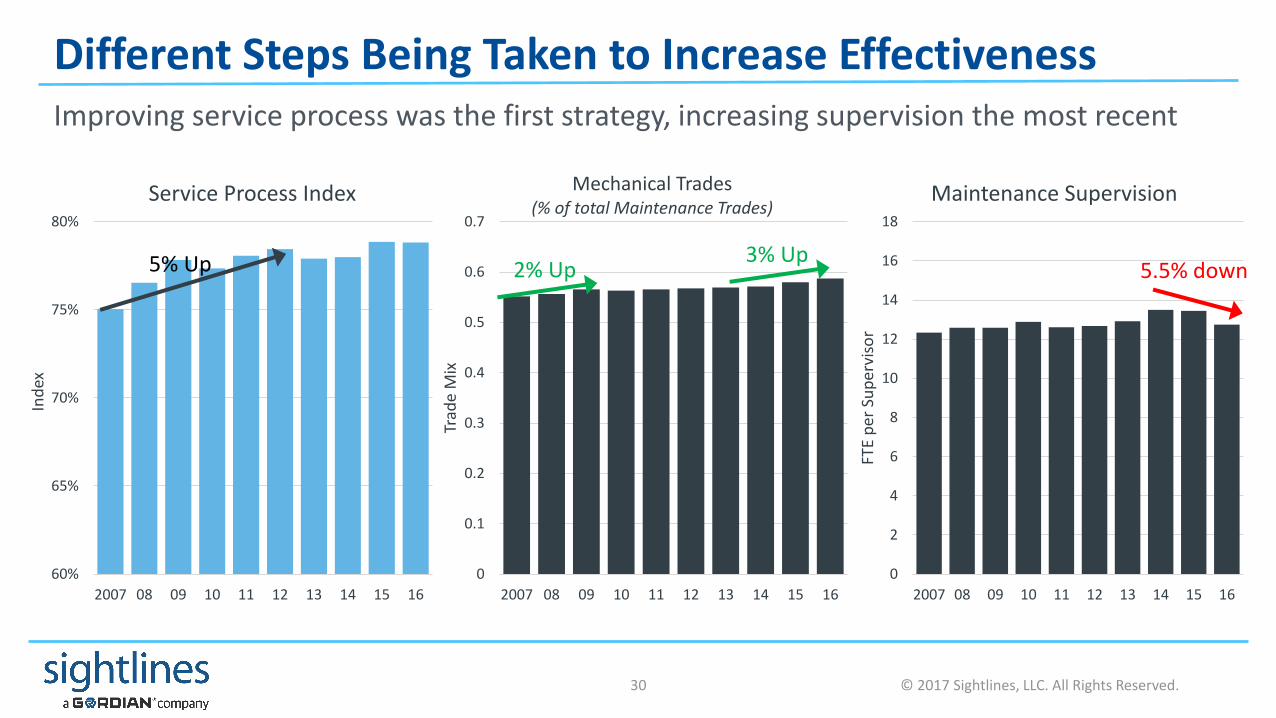
Different Steps Being Taken to Increase EffectivenessImproving service process was the first strategy, increasing supervision the most recent
0
2
4
6
8
10
12
14
16
18
2007 08 09 10 11 12 13 14 15 16
FTE
per
Su
per
viso
r
Maintenance Supervision
0
0.1
0.2
0.3
0.4
0.5
0.6
0.7
2007 08 09 10 11 12 13 14 15 16
Trad
e M
ix
Mechanical Trades (% of total Maintenance Trades)
2% Up3% Up
60%
65%
70%
75%
80%
2007 08 09 10 11 12 13 14 15 16
Ind
ex
Service Process Index
5.5% down5% Up
© 2017 Sightlines, LLC. All Rights Reserved.31
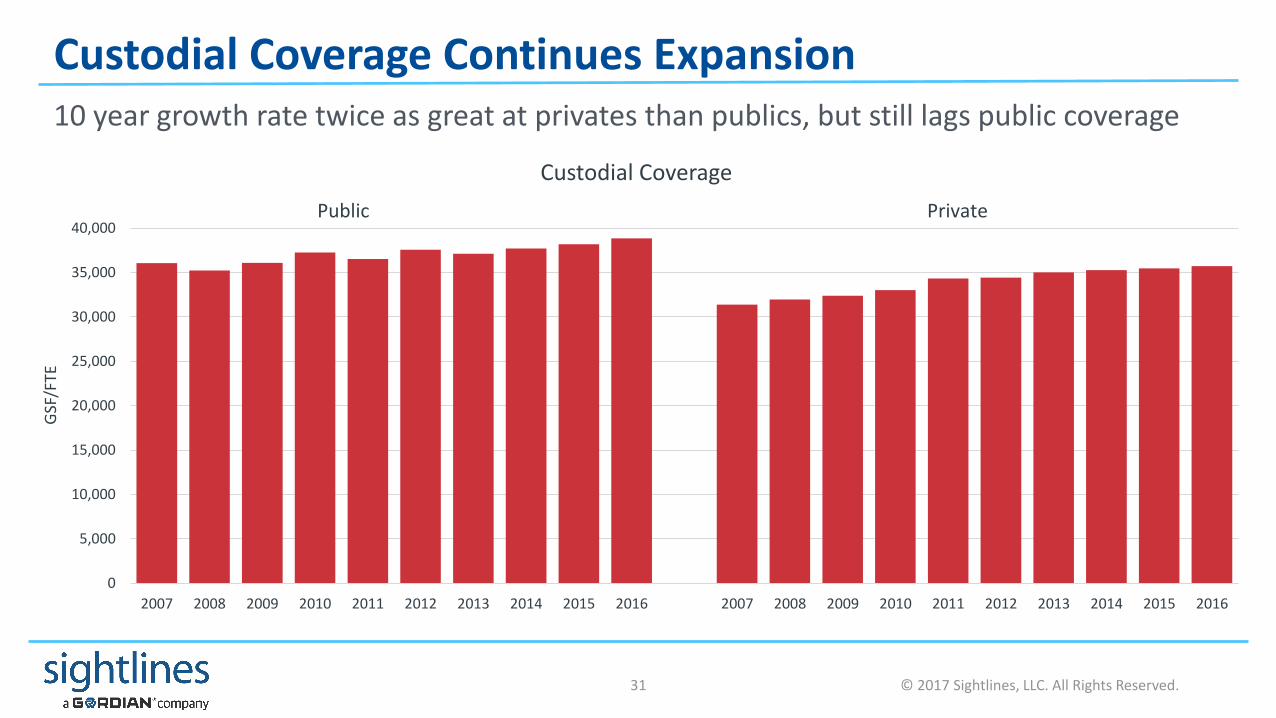
Custodial Coverage Continues Expansion10 year growth rate twice as great at privates than publics, but still lags public coverage
0
5,000
10,000
15,000
20,000
25,000
30,000
35,000
40,000
2007 2008 2009 2010 2011 2012 2013 2014 2015 2016 2007 2008 2009 2010 2011 2012 2013 2014 2015 2016
GSF
/FTE
Custodial Coverage
Public Private
© 2017 Sightlines, LLC. All Rights Reserved.32
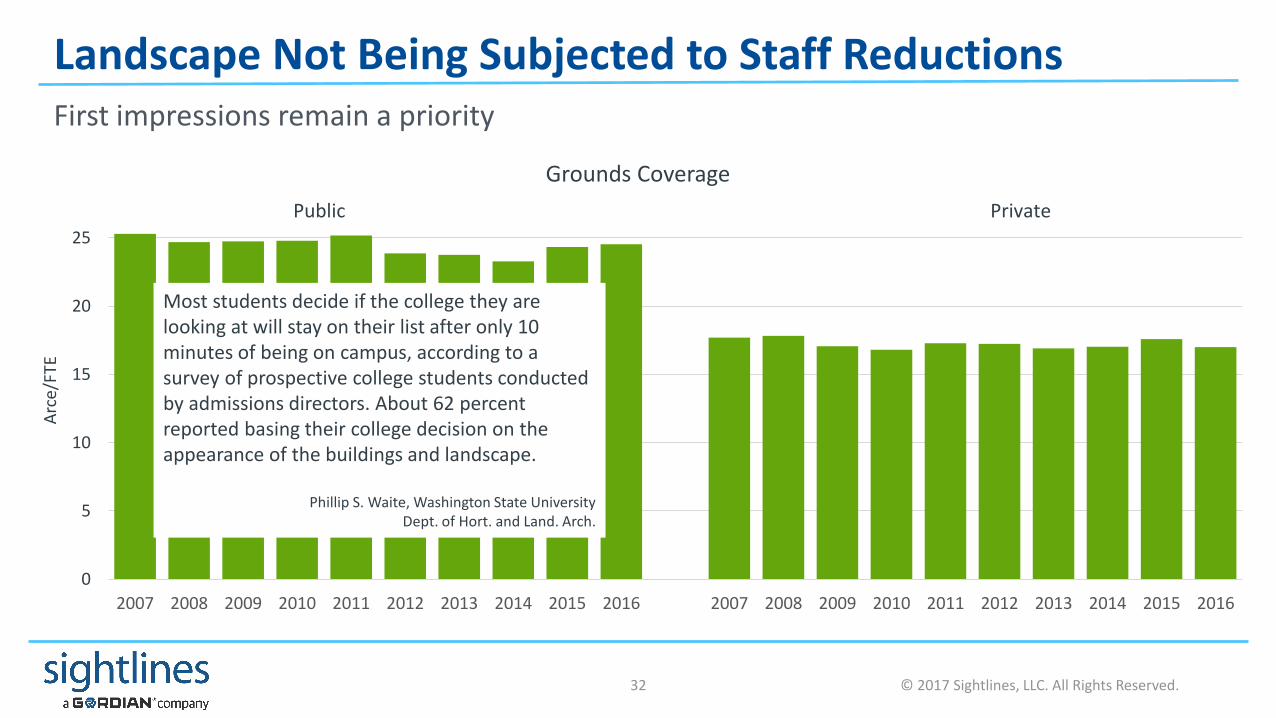
Landscape Not Being Subjected to Staff ReductionsFirst impressions remain a priority
0
5
10
15
20
25
2007 2008 2009 2010 2011 2012 2013 2014 2015 2016 2007 2008 2009 2010 2011 2012 2013 2014 2015 2016
Arc
e/FT
E
Grounds Coverage
Public Private
Most students decide if the college they are looking at will stay on their list after only 10 minutes of being on campus, according to a survey of prospective college students conducted by admissions directors. About 62 percent reported basing their college decision on the appearance of the buildings and landscape.
Phillip S. Waite, Washington State UniversityDept. of Hort. and Land. Arch.
© 2017 Sightlines, LLC. All Rights Reserved.33
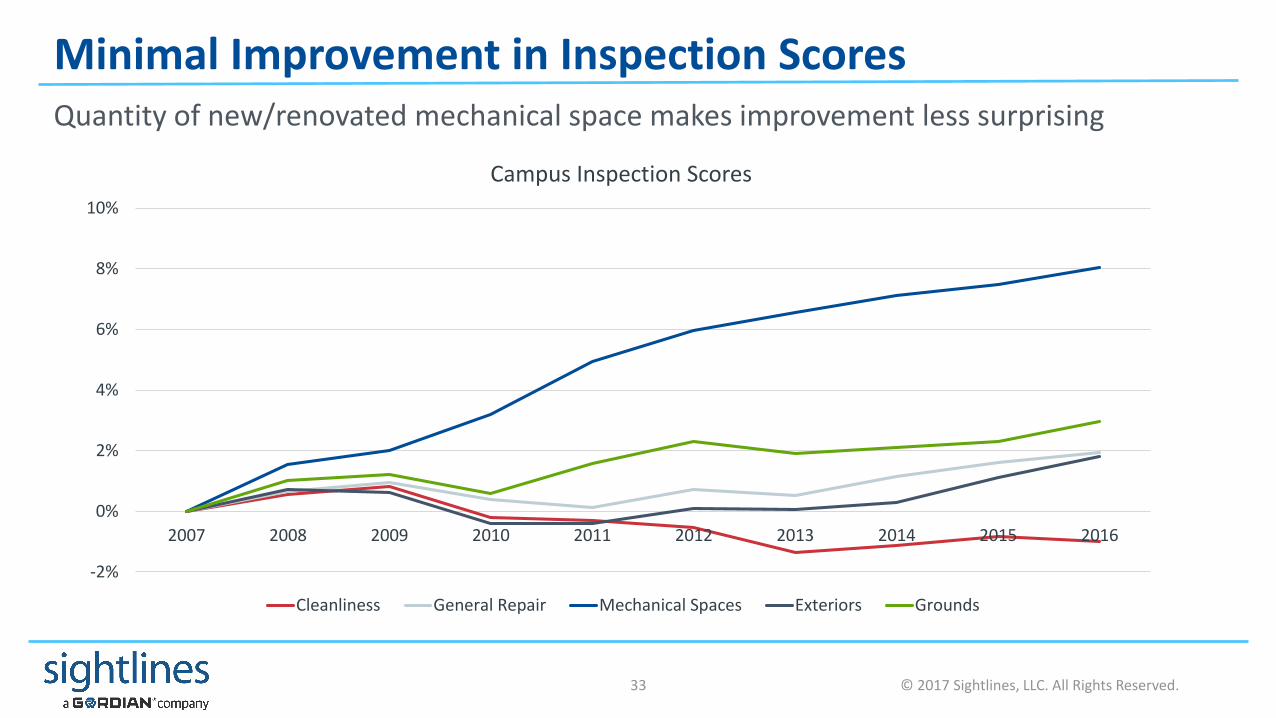
Minimal Improvement in Inspection ScoresQuantity of new/renovated mechanical space makes improvement less surprising
-2%
0%
2%
4%
6%
8%
10%
2007 2008 2009 2010 2011 2012 2013 2014 2015 2016
Campus Inspection Scores
Cleanliness General Repair Mechanical Spaces Exteriors Grounds
© 2017 Sightlines, LLC. All Rights Reserved.34
Maintaining Service Levels Grows More ChallengingCreativity is in high demand
Understand the drivers of operational costsNumerous factors such as growing backlogs, increasing technical complexity, or student density all may contribute to rising demands
Technology can help mitigate these demandsBuilding automation, adaptive planned/predictive maintenance, and improved reporting from CMMS can proactively address challenges
Organizational structure and processes matterHaving the right staffing skill mix and effective scheduling process can increase efficiency and improve the customer communication
Communicate to manage expectationsEstablish an understanding of service standards throughout the community

© 2017 Sightlines, LLC. All Rights Reserved.35
In Summary
Space: Growth Sustains Some Campuses, a Risk to OthersFor those campuses that are not growing enrollment, increasing space is a long term exposure, especially if revenue streams drop in the future
For all campuses, decisions about future space growth should be evaluated considering the total lifetime cost of that space and the potential institutional return on that investment (enrollment, research $, retention, educational outcomes, etc.)
Capital: Investment Impact DecliningWith investment into existing buildings insufficient to meet the growing future capital costs, institutions will have to prioritize certain areas of campus over others.
Effective prioritizing of investments will incorporate institutional mission/strategy, modernization and renewal needs to allocate an institutions finite resources
Operations: Budgets Impacting ServiceThe limited growth in facilities operating budgets, coupled with reductions in staffing in key services areas have made delivering consistent levels of service difficult.
Evaluating organizational structure, the role of technology and customer expectations will be required for organizations to navigate a future world of higher operational demands without additional resources

36
Questions & Discussion

© 2017 Sightlines, LLC. All Rights Reserved.37
What did you think?Please share your feedback by answering a few quick questions after the session to helps us get to know you better and improve our webinars for the future

© 2017 Sightlines, LLC. All Rights Reserved.38
Next Webinar: State of Sustainability 2017
State of Sustainability in Higher Education 2017
Free, interactive webinar hosted by Sightlines on February 20, 2018
Time: 1:00 PM ET | 10:00 AM PTDuration: 45 minutes plus live Q&A
http://www.sightlines.com/events/webinar-state-of-sustainability-2017/

39
Thank you for your time.
@sightlinesllc
Sightlines
Sightlines360