Embed Size (px)
Citation preview
MATH& 146
Lesson 9
Section 1.6
Standard Deviation
1
Averages
• MEAN – or arithmetic mean. It is the sum of all
values divided by the count of values. It is the most
important of the averages.
• MEDIAN – the middle value in a collection when the
values are arranged in order of increasing size. It is
the average of choice when outliers are present.
• MODE – the most common value(s) in a dataset. It
can be used for any type of data, and it is the only
average for regular categorical data.
2
Measures of Variation
• RANGE – the difference between the maximum
and minimum data values.
• INTERQUARTILE RANGE – the difference
between the upper and lower quartiles.
• STANDARD DEVIATION – the typical distance
the data values are from the mean.
3
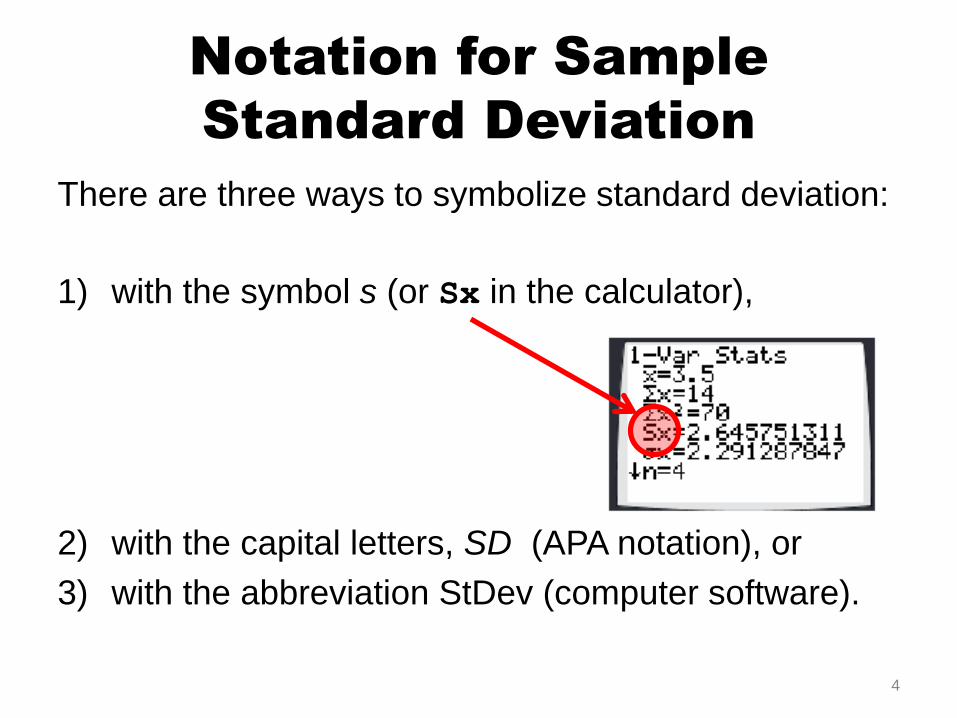
Notation for Sample
Standard Deviation
There are three ways to symbolize standard deviation:
1) with the symbol s (or Sx in the calculator),
2) with the capital letters, SD (APA notation), or
3) with the abbreviation StDev (computer software).
4
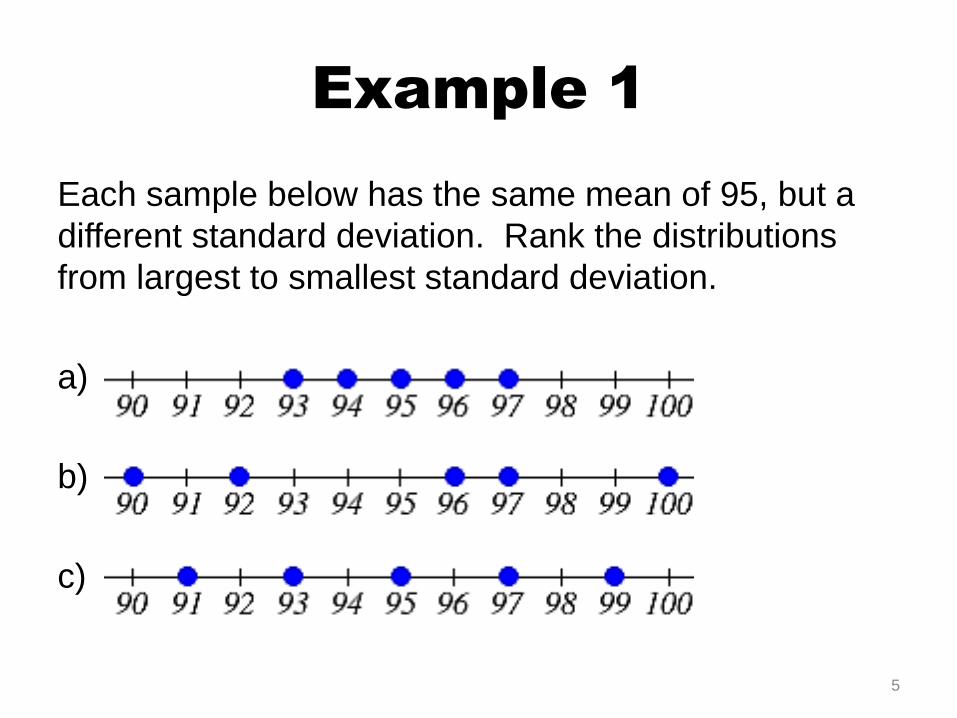
Example 1
Each sample below has the same mean of 95, but a
different standard deviation. Rank the distributions
from largest to smallest standard deviation.
a)
b)
c)
5
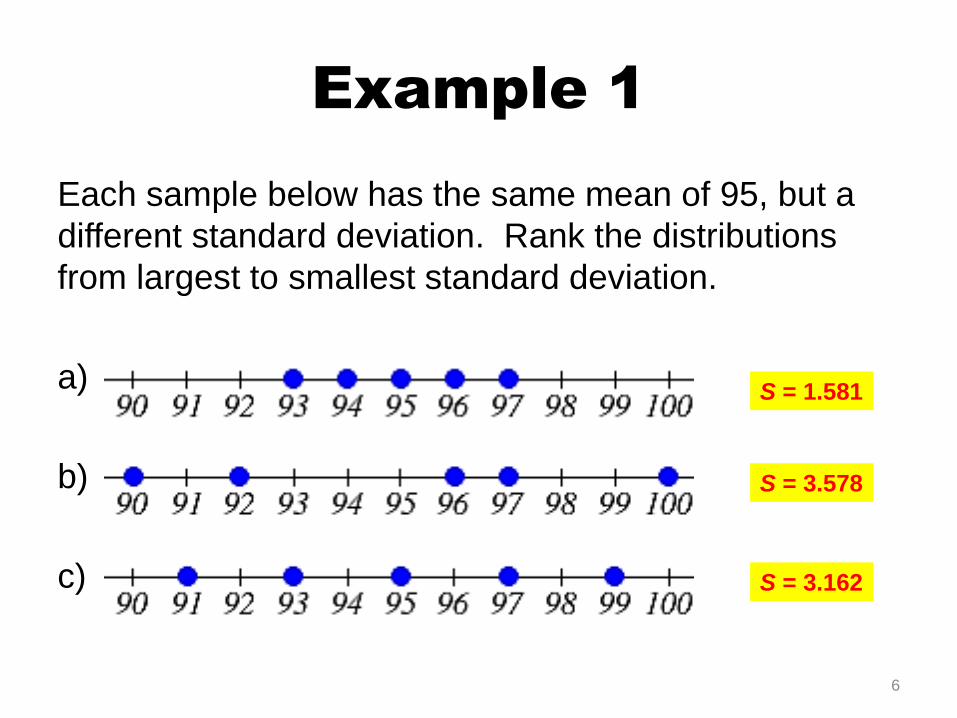
Example 1
Each sample below has the same mean of 95, but a
different standard deviation. Rank the distributions
from largest to smallest standard deviation.
a)
b)
c)
6
S = 1.581
S = 3.578
S = 3.162
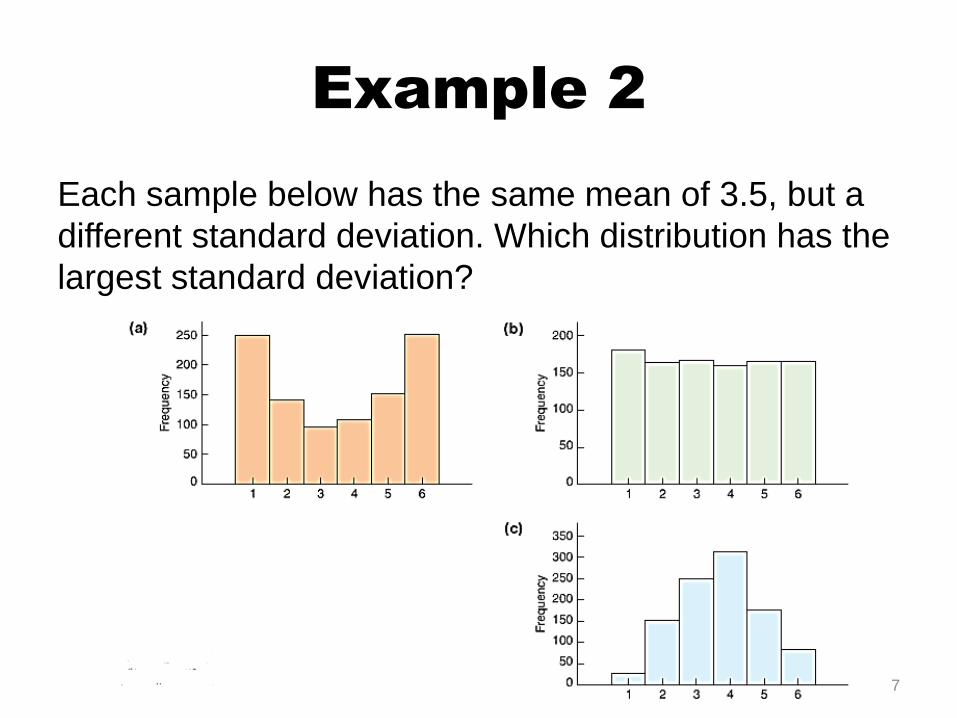
Example 2
Each sample below has the same mean of 3.5, but a
different standard deviation. Which distribution has the
largest standard deviation?
7
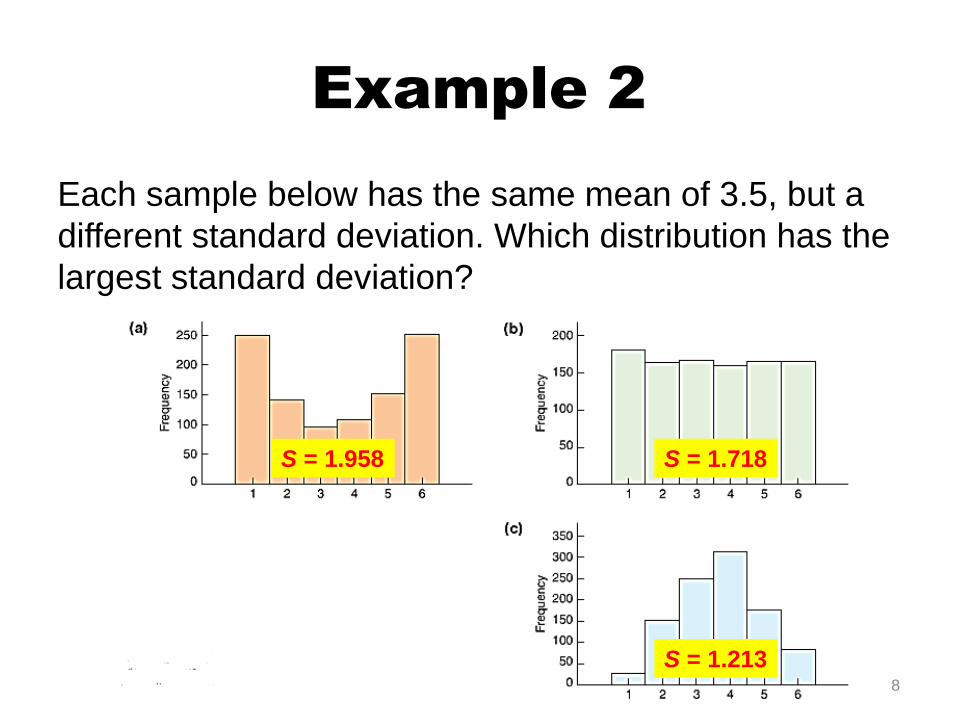
Example 2
Each sample below has the same mean of 3.5, but a
different standard deviation. Which distribution has the
largest standard deviation?
8
S = 1.958 S = 1.718
S = 1.213
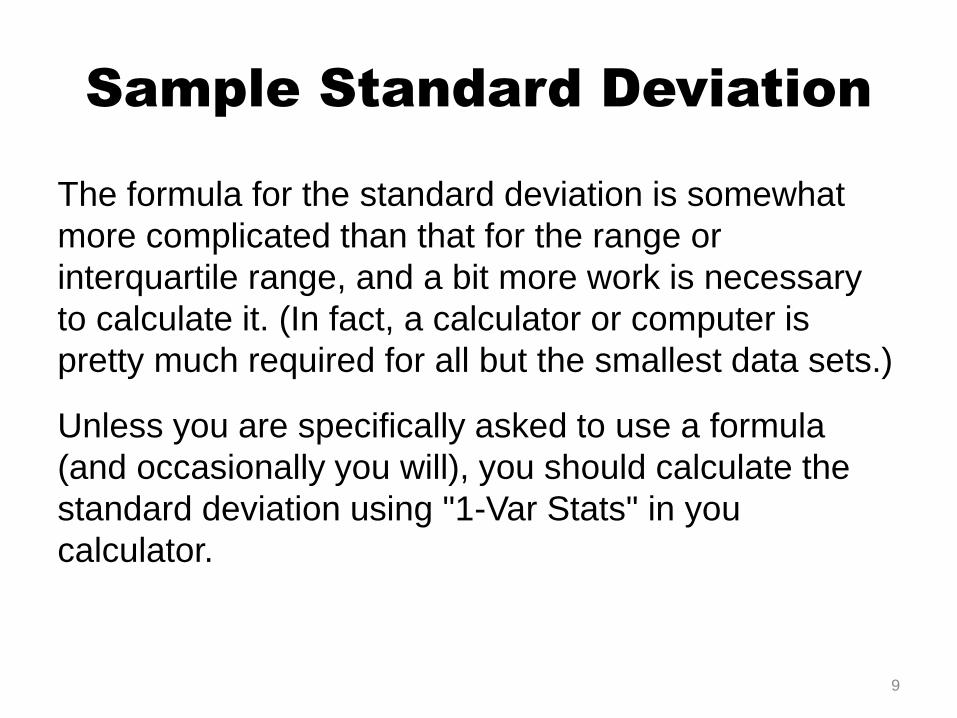
Sample Standard Deviation
The formula for the standard deviation is somewhat
more complicated than that for the range or
interquartile range, and a bit more work is necessary
to calculate it. (In fact, a calculator or computer is
pretty much required for all but the smallest data sets.)
Unless you are specifically asked to use a formula
(and occasionally you will), you should calculate the
standard deviation using "1-Var Stats" in you
calculator.
9
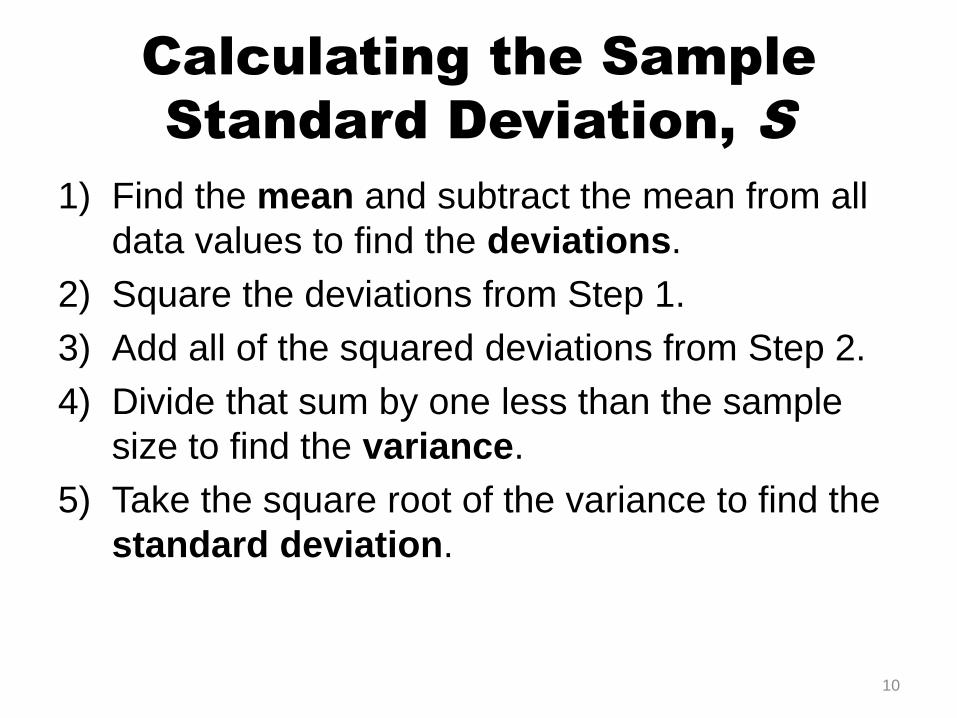
Calculating the Sample
Standard Deviation, S
1) Find the mean and subtract the mean from all
data values to find the deviations.
2) Square the deviations from Step 1.
3) Add all of the squared deviations from Step 2.
4) Divide that sum by one less than the sample
size to find the variance.
5) Take the square root of the variance to find the
standard deviation.
10
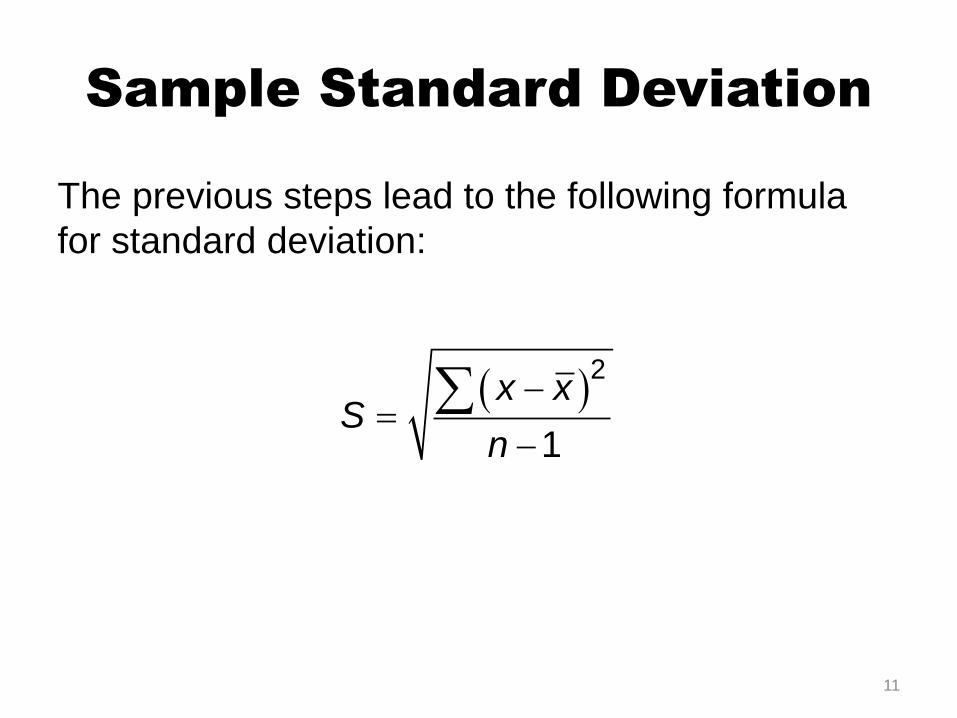
Sample Standard Deviation
The previous steps lead to the following formula
for standard deviation:
2
1
x xS
n
11
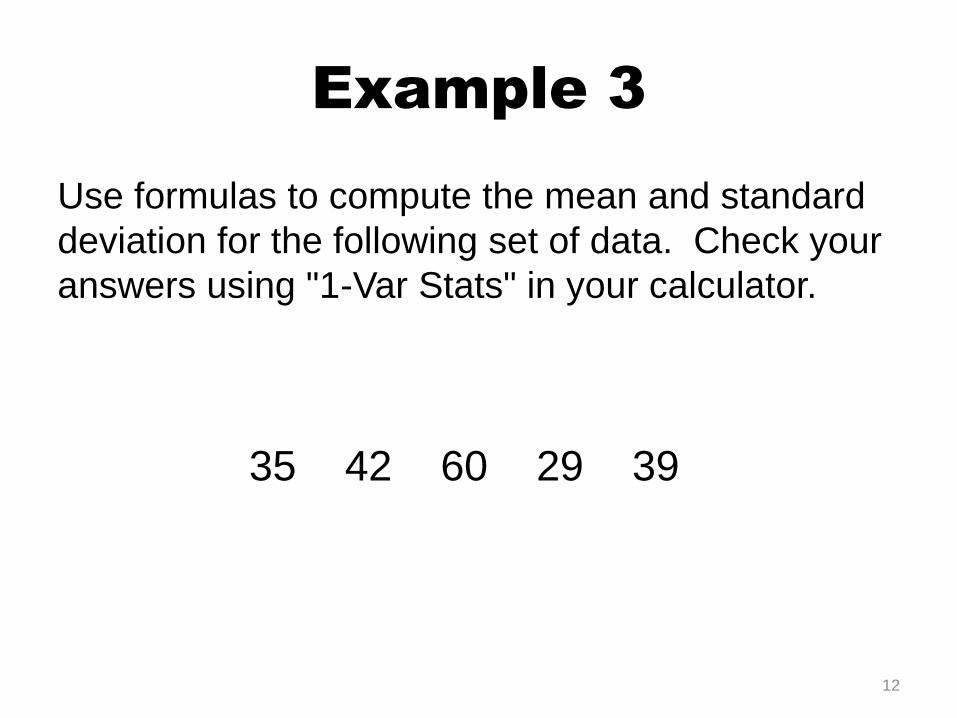
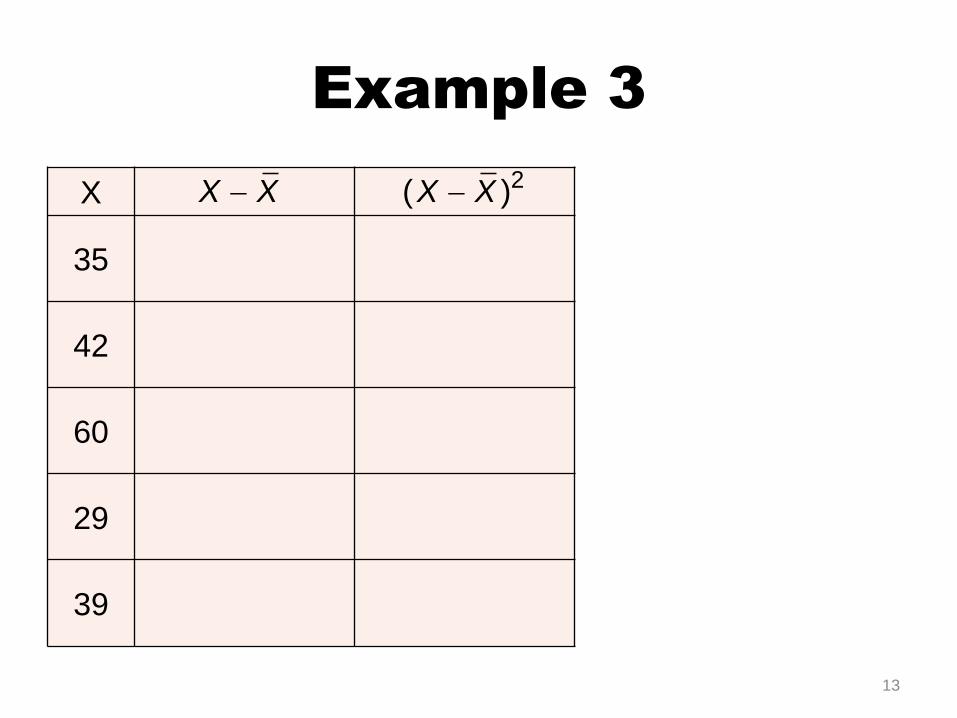
Example 3
Use formulas to compute the mean and standard
deviation for the following set of data. Check your
answers using "1-Var Stats" in your calculator.
35 42 60 29 39
12
Example 3
13
X
35
42
60
29
39
X X 2( )X X
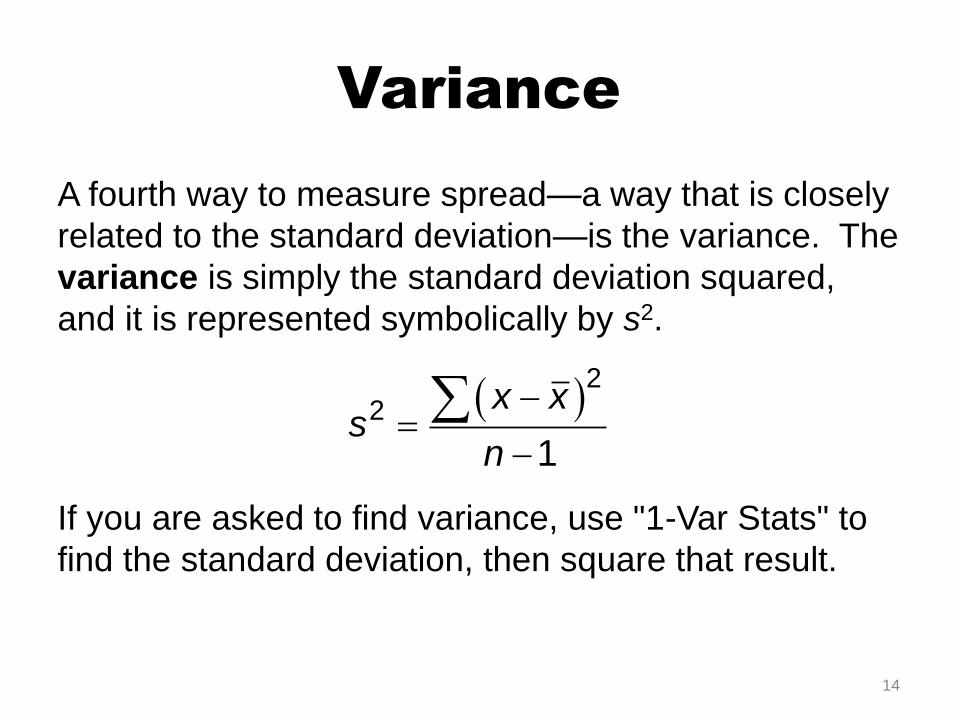
Variance
A fourth way to measure spread—a way that is closely
related to the standard deviation—is the variance. The
variance is simply the standard deviation squared,
and it is represented symbolically by s2.
If you are asked to find variance, use "1-Var Stats" to
find the standard deviation, then square that result.
2
2
1
x xs
n
14
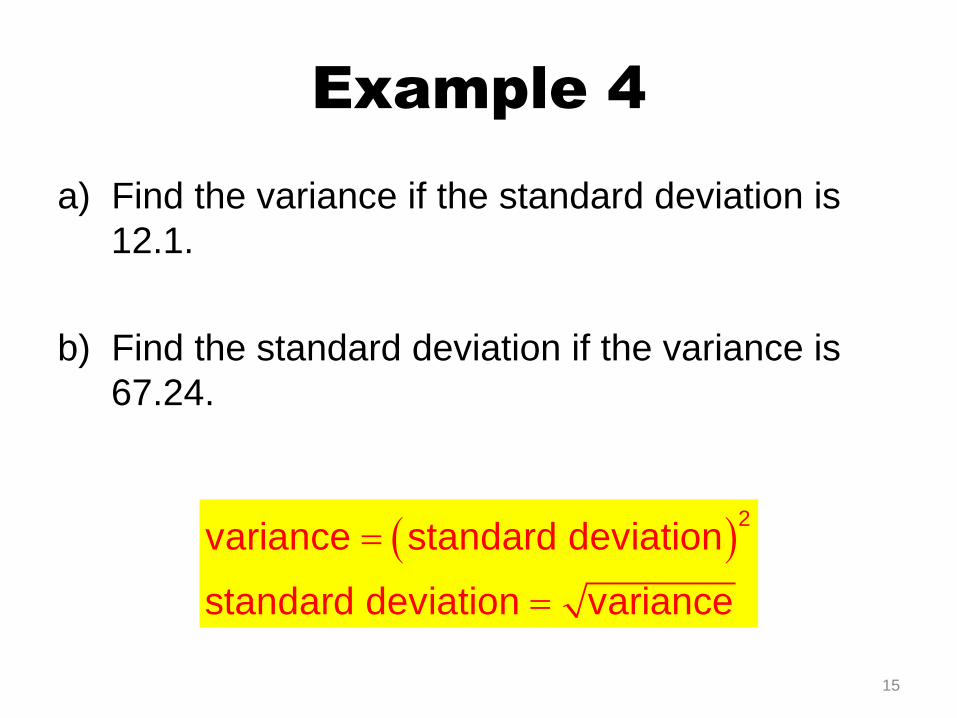
Example 4
a) Find the variance if the standard deviation is
12.1.
b) Find the standard deviation if the variance is
67.24.
15
2
variance standard deviation
standard deviation variance
Standard Deviation as a
Yardstick
The standard deviation tells us how the whole collection of values varies, so it's a natural ruler for comparing an individual value to a group.
Over and over this quarter we will ask questions such as "How far is the value from the mean?" or "How different are these two statistics?" The answer in every case will be to measure the distance in standard deviations. This distance is called a z-score.
16
Standard Deviation as a
Yardstick
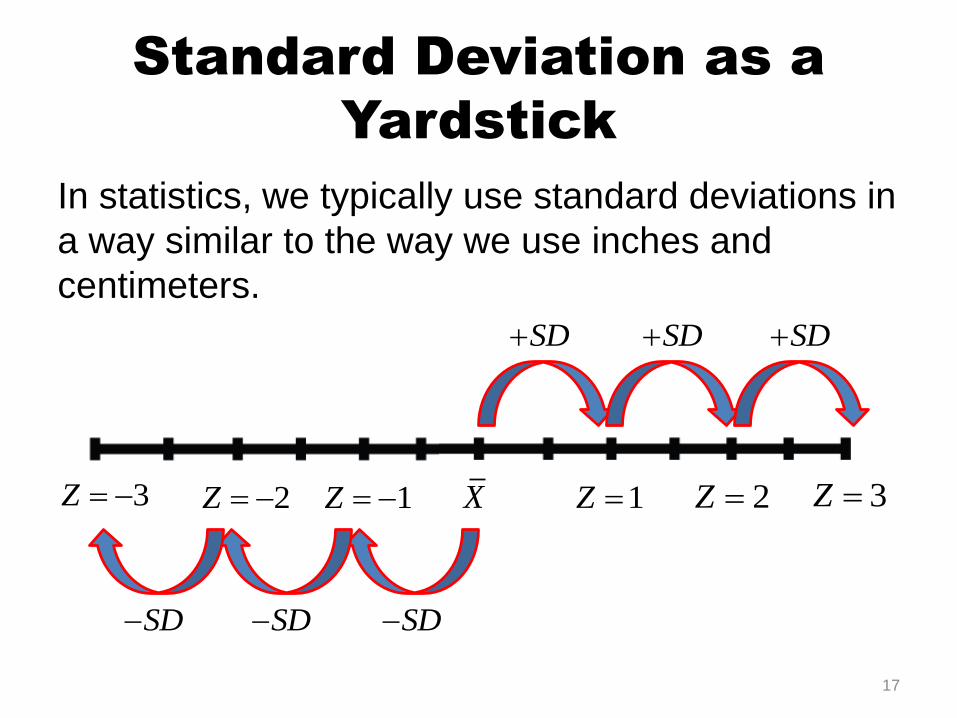
In statistics, we typically use standard deviations in
a way similar to the way we use inches and
centimeters.
X 1Z 2Z 1Z 2Z 3Z
SDSD
SD SD SD
SD
3Z
17
Standard Deviation as a
Yardstick
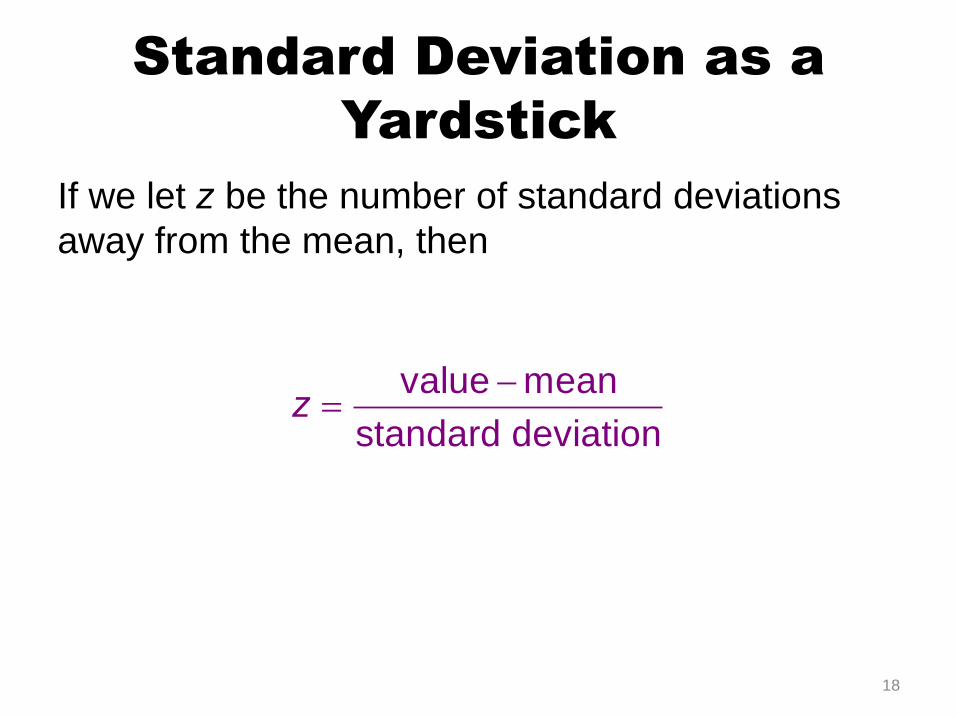
If we let z be the number of standard deviations
away from the mean, then
value mean
standard deviationz
18
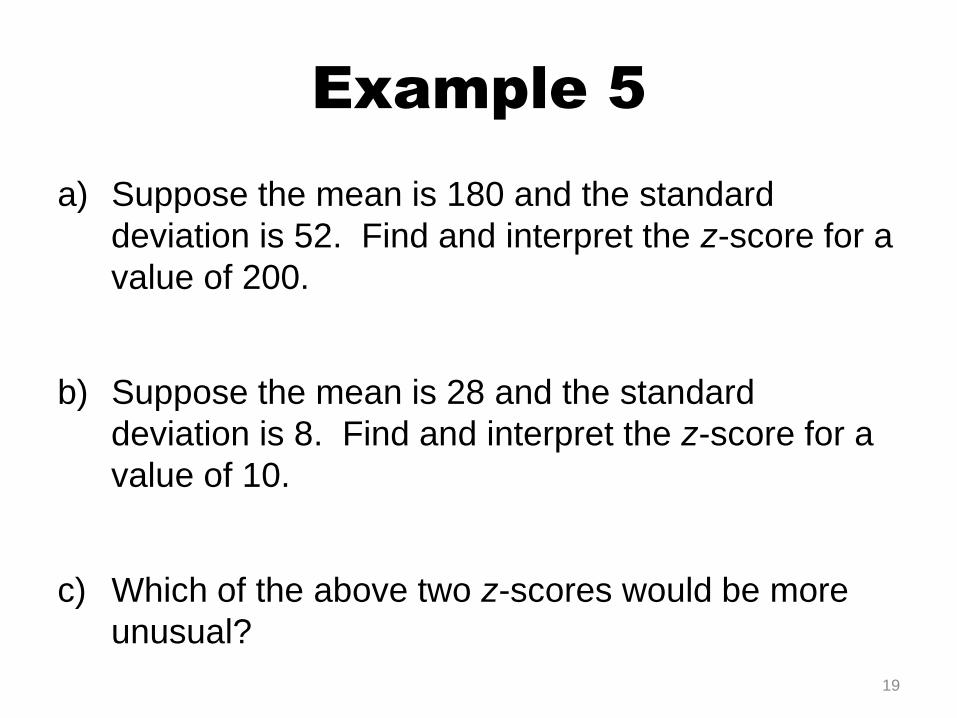
Example 5
a) Suppose the mean is 180 and the standard
deviation is 52. Find and interpret the z-score for a
value of 200.
b) Suppose the mean is 28 and the standard
deviation is 8. Find and interpret the z-score for a
value of 10.
c) Which of the above two z-scores would be more
unusual?
19
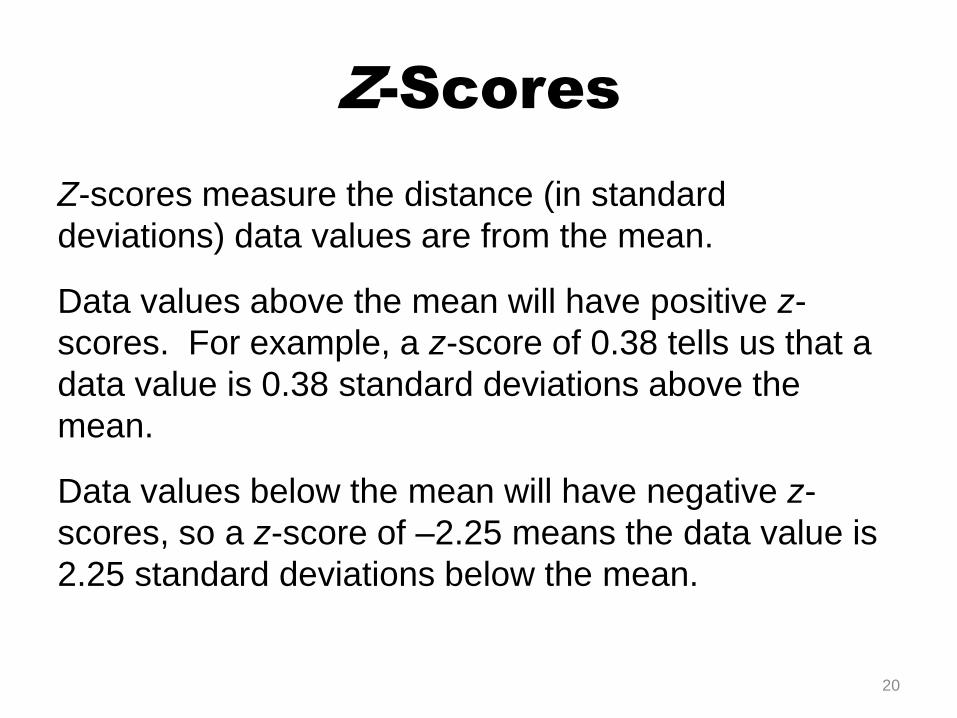
Z-Scores
Z-scores measure the distance (in standard
deviations) data values are from the mean.
Data values above the mean will have positive z-
scores. For example, a z-score of 0.38 tells us that a
data value is 0.38 standard deviations above the
mean.
Data values below the mean will have negative z-
scores, so a z-score of –2.25 means the data value is
2.25 standard deviations below the mean.
20
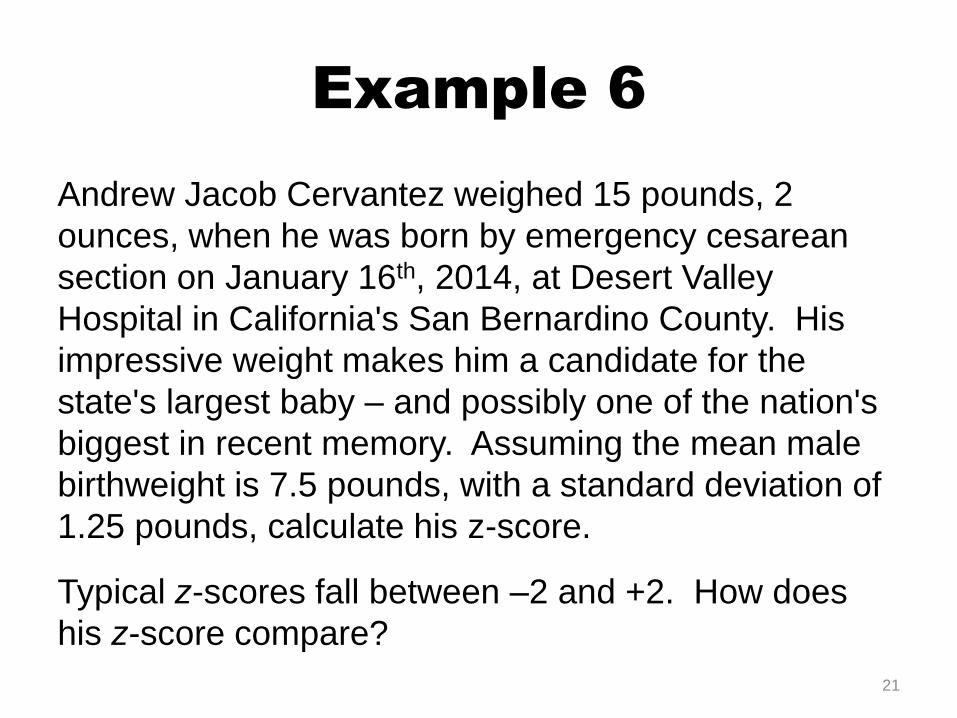
Example 6
Andrew Jacob Cervantez weighed 15 pounds, 2
ounces, when he was born by emergency cesarean
section on January 16th, 2014, at Desert Valley
Hospital in California's San Bernardino County. His
impressive weight makes him a candidate for the
state's largest baby – and possibly one of the nation's
biggest in recent memory. Assuming the mean male
birthweight is 7.5 pounds, with a standard deviation of
1.25 pounds, calculate his z-score.
Typical z-scores fall between –2 and +2. How does
his z-score compare?
21
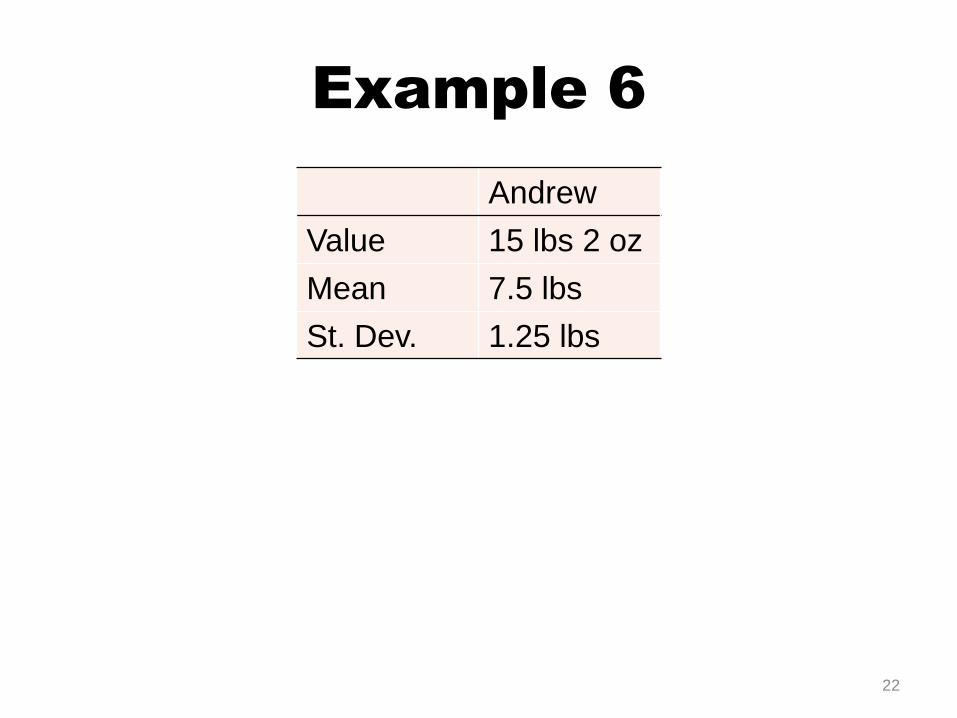
Example 6
22
Andrew
Value 15 lbs 2 oz
Mean 7.5 lbs
St. Dev. 1.25 lbs
Z-Scores
Z-scores allow us to compare observations in one
group with those in another, even if the two groups
are measured in different units or under different
conditions, such as inches and pounds.
23
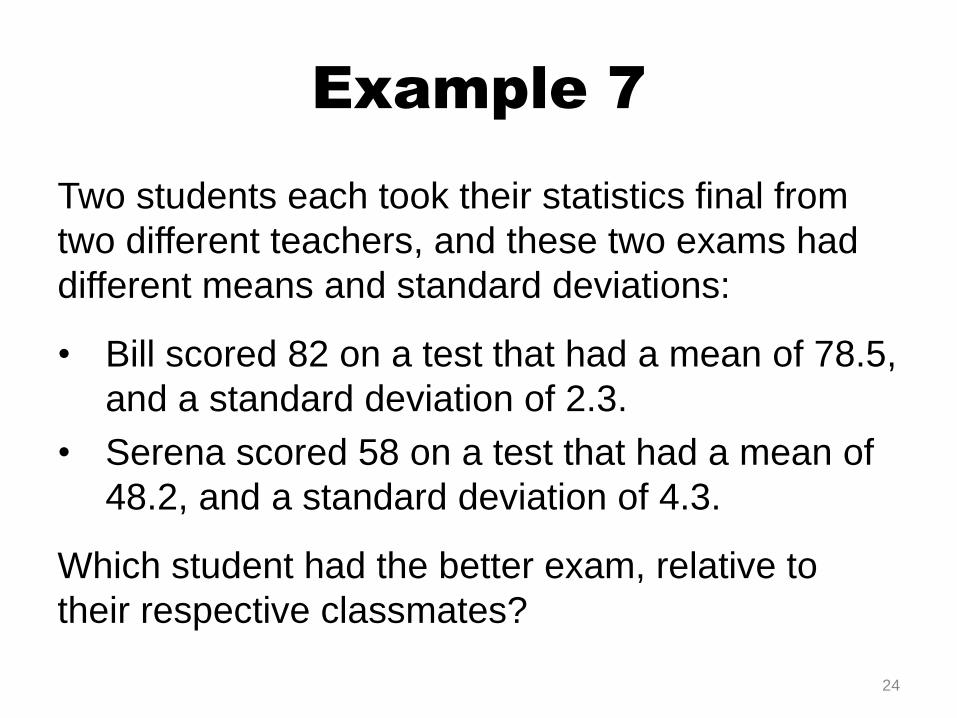
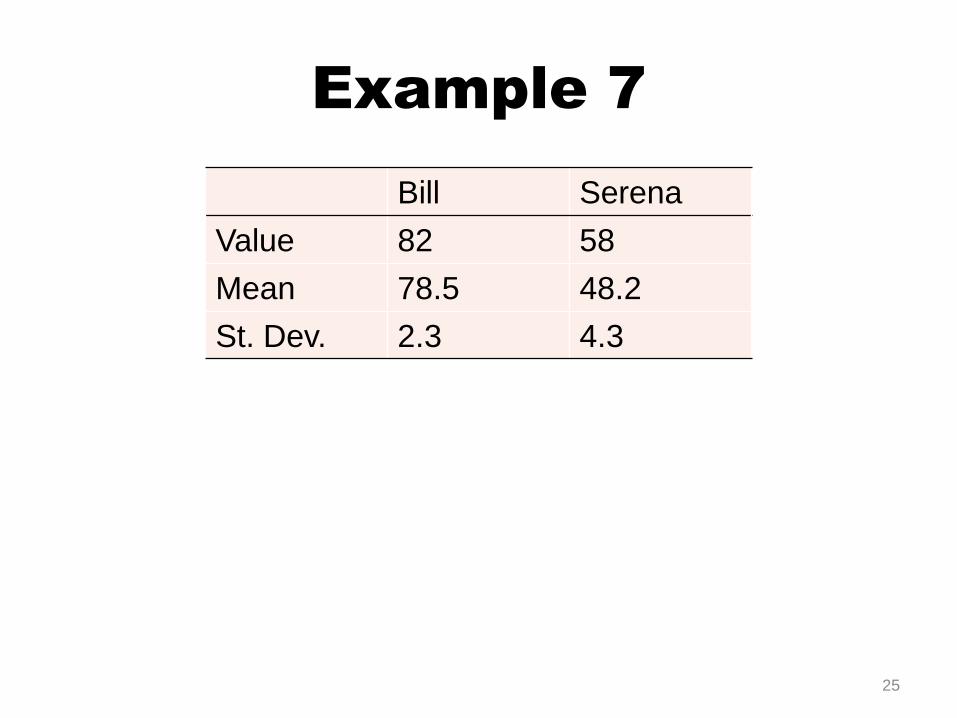
Example 7
Two students each took their statistics final from
two different teachers, and these two exams had
different means and standard deviations:
• Bill scored 82 on a test that had a mean of 78.5,
and a standard deviation of 2.3.
• Serena scored 58 on a test that had a mean of
48.2, and a standard deviation of 4.3.
Which student had the better exam, relative to
their respective classmates?
24
Example 7
25
Bill Serena
Value 82 58
Mean 78.5 48.2
St. Dev. 2.3 4.3