Embed Size (px)
Citation preview

MATH& 146
Lesson 8
Section 1.6
Averages and Variation
1

Summarizing Data
The distribution of a variable is the overall pattern
of how often the possible values occur. For
numerical variables, three summary characteristics
of the overall distribution of the data tend to be of
the most interest:
• The Average (Typical Value)
• The Variability (Spread)
• The Shape
2

Averages
Averages provide information about what is
considered the "typical" value. If you were to take
all of your data and try to reduce it to a single
number, that number would be considered the
average.
There are many ways to describe the average, but
we will focus on just three: the mean, the median,
and the mode.
3

Averages
• MEAN – or arithmetic mean. It is the sum of all
values divided by the count of values. It is the most
important of the averages.
• MEDIAN – the middle value in a collection when the
values are arranged in order of increasing size. It is
the average of choice when outliers are present.
• MODE – the most common value(s) in a dataset. It
can be used for any type of data, and it is the only
average for regular categorical data.
4

Notation for the Sample
Mean
There are two ways to symbolize the sample
mean:
1) with the symbol x-bar, , or
2) with a capital letter, M. (APA notation)
x
5

The Mean
The mean of a collection of values is the sum of all
values divided by the count of values. The formula
for a mean is
where Σ x is the sum of the values and n is the
count, or sample size.
xx
n
6

The Mean
The mean feels like a typical value because it is
the point where the data "balances".
7
5.4 the center of gravity, or balance pointx

Example 1
Compute the mean of the following two lists of
numbers:
a) 13, 24, 25, 34, 37
b) 13, 24, 25, 34, 370
How did changing the last number from 37 to 370
affect the mean?
8

Notation for the Median
Unlike the mean, there is no standard way to
symbolize the median. Some common
abbreviations include:
1) with the abbreviation, Med (calculator notation),
or
2) with the abbreviation, Mdn (APA notation).
9

The Median
The median is the middle of your data, with at
most half the data values less than it and at most
half the data more than it.
You can think of it as the value that divides the
sorted data into two equal sets of numbers.
10

The Median
Let a collection of n values be written in order of
increasing size.
If n is odd, the median is the middle value in the list.
Data set 1:
24, 25, 25, 27, 29, 31, 32, 34, 37 (n = 9, odd)
29Med
11

The Median
If n is even, the median is the average of the two
middle values.
Data set 2:
42, 42, 43, 44, 44, 46, 47, 47, 47, 49 (n = 10, even)
45Med
average
12

Example 2
Compute the median of the following list of
numbers:
34, 13, 37, 24, 25, 13, 41, 23, 28, 31
13

Example 3
Compute the median of the following two lists of
numbers:
a) 13, 24, 25, 34, 37
b) 13, 24, 25, 34, 370
How did changing the last number from 37 to 370
affect the median?
14

The Mode
A mode of a collection of values is the value (or
values) that occurs the most frequently.
For example, the set
1, 2, 2, 3, 6, 6, 6, 6, 7, 8, 10
has a mode at 6.
15

The Mode
If two or more values occur equally often and more
frequently than all other values, then they each
would be considered modes.
For example, the set
2, 2, 2, 3, 4, 6, 6, 6, 7, 8
has modes at 2 and 6
16

The Mode
If no number occurs more than once, then no
mode exists.
For example,
1, 3, 5, 6, 8, 11, 12
has no mode.
17

Why Modes?
The mean can only be used for numerical data,
while the median can be used for numerical and
ordinal data. The mode can be found for all data.
For instance, for the following sample of colors:
red, green, orange, orange, blue, orange
the mean and median would be impossible to find.
We can still describe the mode as the color
orange, however.
18

Example 4
Find the mode of the following collection of fruit:
19
Fruit Frequency
Apples 11
Oranges 12
Pears 16
Kiwis 10
Bananas 12

Example 5
Statistics exam scores for 20 students are as
follows:
50; 53; 59; 59; 63; 63; 72; 72; 72; 72; 72;
76; 78; 81; 83; 84; 84; 84; 90; 93
Find the mode.
20

Variation
In addition to describing the average, we should
also describe the variation, or spread. Measures
of variation tell us how far the numbers are
scattered about the center value of the set.
The most common ways to measure variation are
the range, interquartile range, and standard
deviation.
21

Variation
• RANGE – the difference between the maximum
and minimum data values.
• INTERQUARTILE RANGE – the difference
between the upper and lower quartiles.
• STANDARD DEVIATION – the typical distance
the data values are from the mean.
22
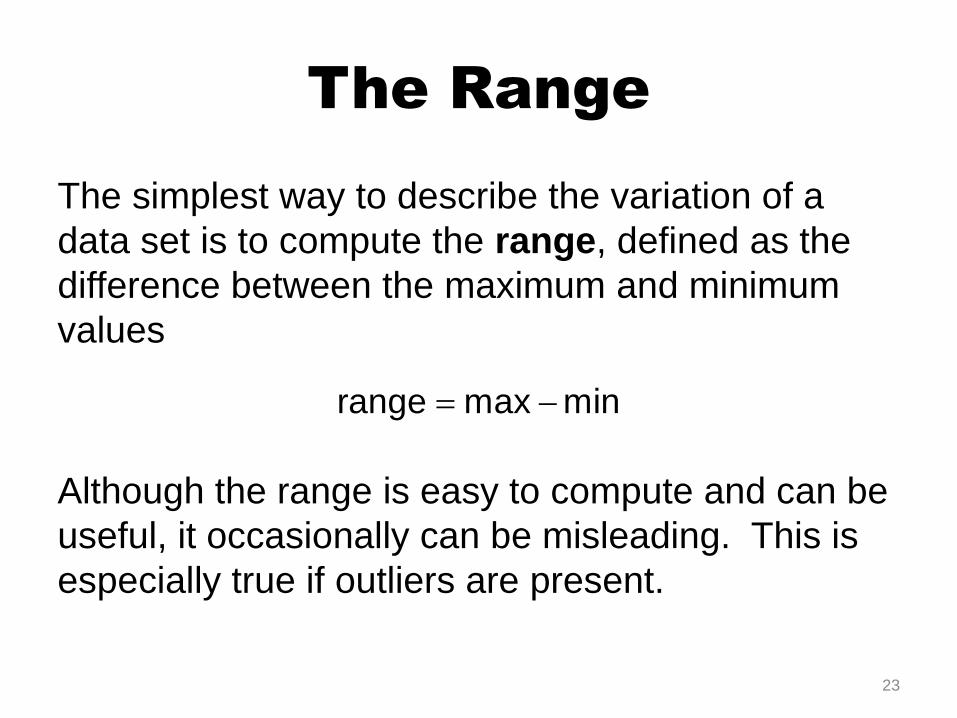
The Range
The simplest way to describe the variation of a
data set is to compute the range, defined as the
difference between the maximum and minimum
values
Although the range is easy to compute and can be
useful, it occasionally can be misleading. This is
especially true if outliers are present.
range max min
23

Example 6
Consider the following two sets of quiz scores for nine students. Which set has the greater range? Would you also say that the scores in this set are more varied?
Quiz 1 Scores:
1 10 10 10 10 10 10 10 10
Quiz 2 Scores:
2 3 4 5 6 7 8 9 10
24

Quartiles
Quartiles are numbers that separate the data into
quarters.
To find the quartiles, first find the median and
divide the data into two halves: the lower half are
the numbers to the left of the median and the
upper half are the numbers to the right. The
quartiles will then be the medians of each of the
halves.
25

Quartiles
The lower (or first) quartile (denoted Q1) is the median of the lower half of the data. This is the point in which at most 1/4 of the values are smaller than it and at most 3/4 of the values are larger than it.
The upper (or third) quartile (denoted Q3) is the median of the upper half of the data. This is the point in which at most 3/4 of the values are smaller than it and at most 1/4 of the values are larger than it.
26

Example 7
A group of eight children have the following heights
(in inches):
48, 48, 53, 53.5, 54, 60, 62, 71
Find the quartiles for the distribution of the
children's heights.
27

Interquartile Range
When you are using the median to describe the
average, an appropriate measure of variation is
called the interquartile range.
The interquartile range, IQR, tells us how much
space the middle 50% of the data roughly occupy.
It is given by the formula
3 1IQR .Q Q
28
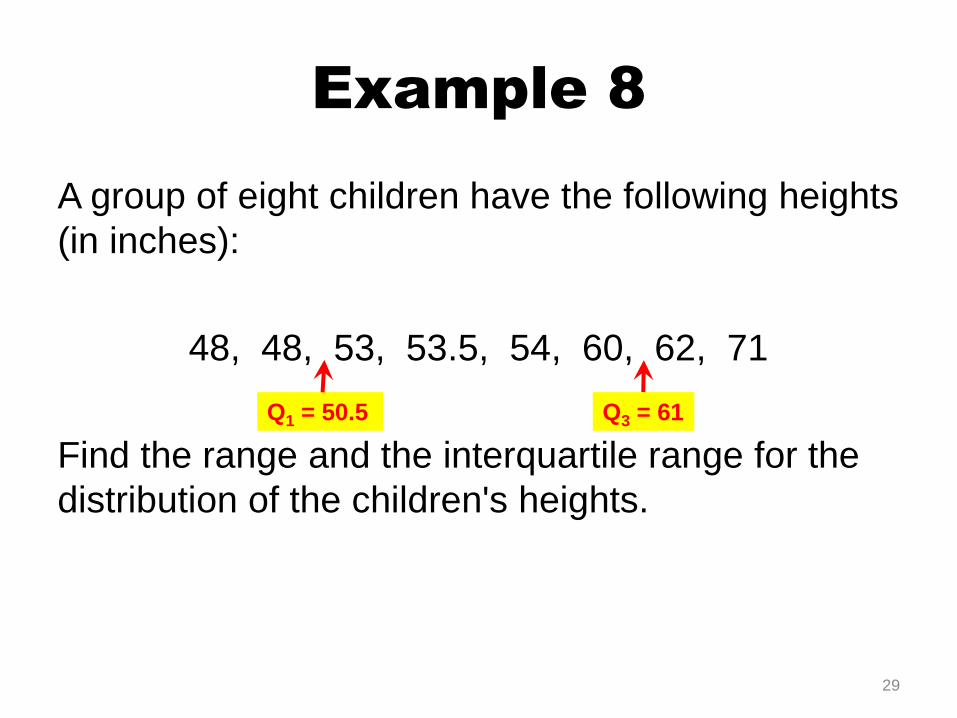
Example 8
A group of eight children have the following heights
(in inches):
48, 48, 53, 53.5, 54, 60, 62, 71
Find the range and the interquartile range for the
distribution of the children's heights.
29
Q1 = 50.5 Q3 = 61

Example 9
Returning to an Example 6, compute the IQR for each
set of quiz scores. Does the IQR appear to be more
reliable than the range? Why or why not?
Quiz 1 Scores:
1 10 10 10 10 10 10 10 10
Quiz 2 Scores:
2 3 4 5 6 7 8 9 10
30