Embed Size (px)
Citation preview
1
A Phase 2 Clinical Trial Of Bapineuzumab (AAB-001)
July 29, 2008
Safe Harbor Statement
2
This presentation will involve forward-looking statements that are subject to material risks and uncertainties.Please refer to the joint press release issued by the companies earlier today describing forward-looking statements.The companies assume no obligation to update any forward-looking statements, whether as a result of new information, future events or otherwise.
3
• Ron Black, M.D., Wyeth Research, Assistant Vice President, Neuroscience
• Sid Gilman, M.D., F.R.C.P., University of Michigan, Chair of Bapineuzumab Safety Monitoring Committee
• Allison Hulme, Ph.D., Elan, Executive Vice President and Head of Global Development
• Dale Schenk, Ph.D., Elan, Executive Vice President and Chief Scientific Officer
• Gary L. Stiles, M.D., Wyeth Pharmaceuticals, Executive Vice President and Chief Medical Officer
Bapineuzumab Phase 2: Study Objectives and Design
4
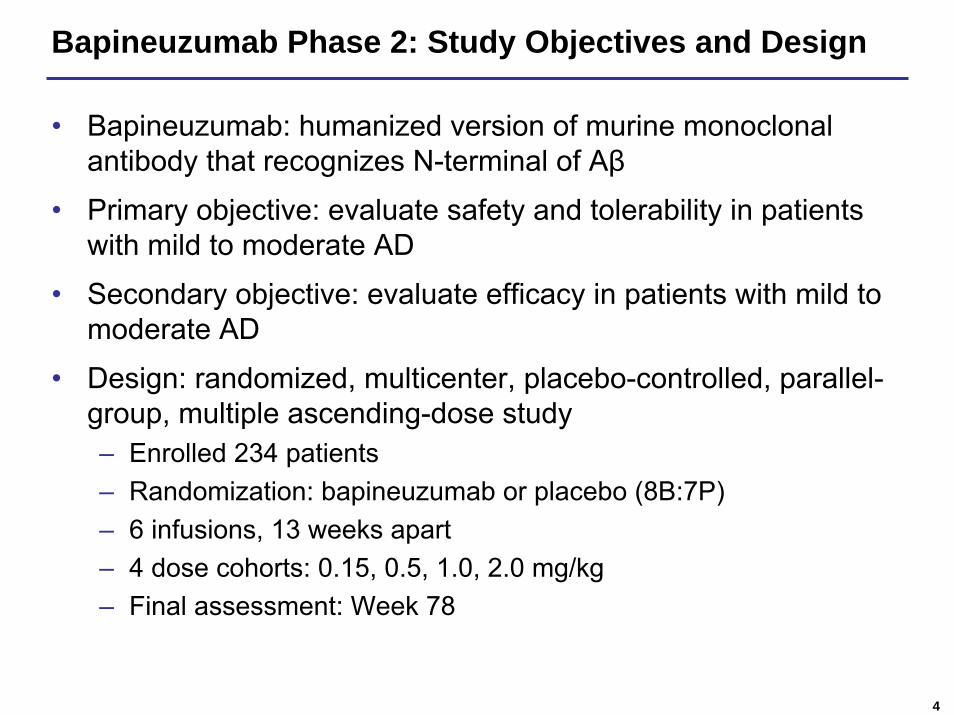
• Bapineuzumab: humanized version of murine monoclonal antibody that recognizes N-terminal of Aβ
• Primary objective: evaluate safety and tolerability in patients with mild to moderate AD
• Secondary objective: evaluate efficacy in patients with mild to moderate AD
• Design: randomized, multicenter, placebo-controlled, parallel-group, multiple ascending-dose study– Enrolled 234 patients– Randomization: bapineuzumab or placebo (8B:7P)– 6 infusions, 13 weeks apart– 4 dose cohorts: 0.15, 0.5, 1.0, 2.0 mg/kg– Final assessment: Week 78
5
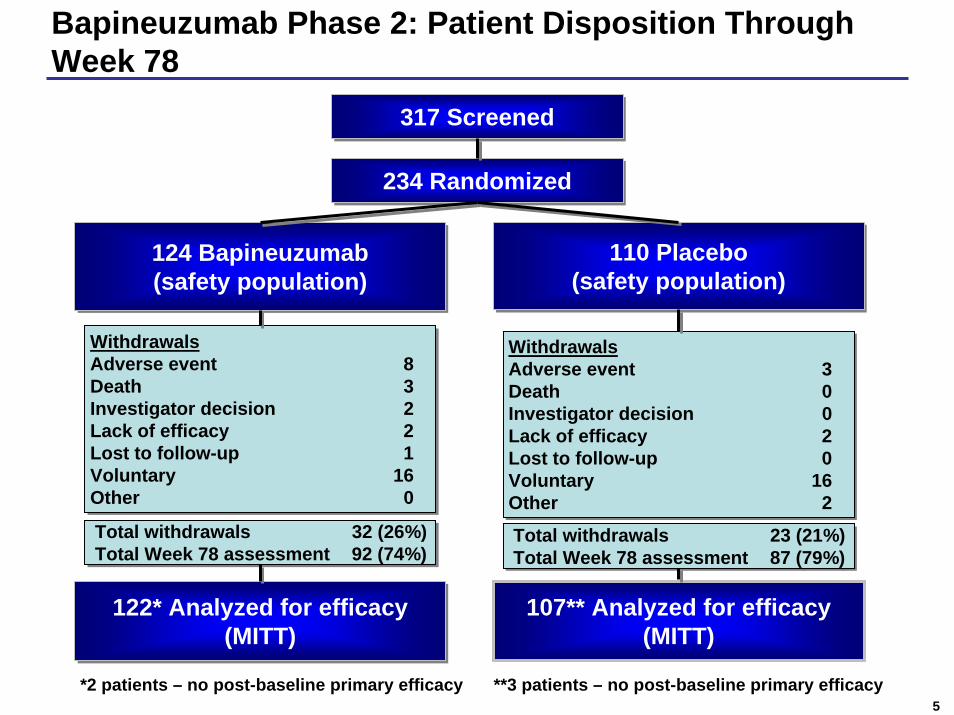
Bapineuzumab Phase 2: Patient Disposition Through Week 78
317 Screened317 Screened
234 Randomized234 Randomized
110 Placebo (safety population)
110 Placebo (safety population)
124 Bapineuzumab (safety population)124 Bapineuzumab (safety population)
WithdrawalsAdverse event 3Death 0Investigator decision 0Lack of efficacy 2Lost to follow-up 0Voluntary 16Other 2
WithdrawalsAdverse event 3Death 0Investigator decision 0Lack of efficacy 2Lost to follow-up 0Voluntary 16Other 2
122* Analyzed for efficacy (MITT)
122* Analyzed for efficacy (MITT)
Total withdrawals 23 (21%)Total Week 78 assessment 87 (79%)Total withdrawals 23 (21%)Total Week 78 assessment 87 (79%)
107** Analyzed for efficacy (MITT)
Total withdrawals 32 (26%)Total Week 78 assessment 92 (74%)Total withdrawals 32 (26%)Total Week 78 assessment 92 (74%)
WithdrawalsAdverse event 8Death 3Investigator decision 2Lack of efficacy 2Lost to follow-up 1Voluntary 16Other 0
WithdrawalsAdverse event 8Death 3Investigator decision 2Lack of efficacy 2Lost to follow-up 1Voluntary 16Other 0
*2 patients – no post-baseline primary efficacy **3 patients – no post-baseline primary efficacy
6
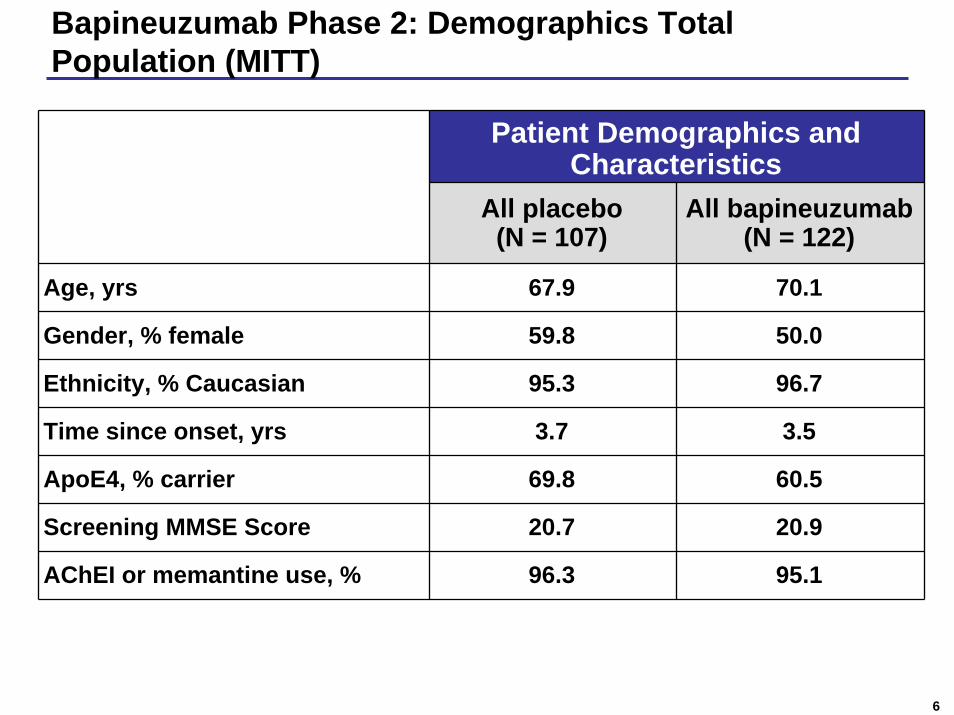
Bapineuzumab Phase 2: Demographics Total Population (MITT)
Patient Demographics and Characteristics
All placebo(N = 107)
All bapineuzumab(N = 122)
Age, yrs 67.9 70.1
Gender, % female 59.8 50.0
Ethnicity, % Caucasian 95.3 96.7
Time since onset, yrs 3.7 3.5
ApoE4, % carrier 69.8 60.5
Screening MMSE Score 20.7 20.9
AChEI or memantine use, % 96.3 95.1
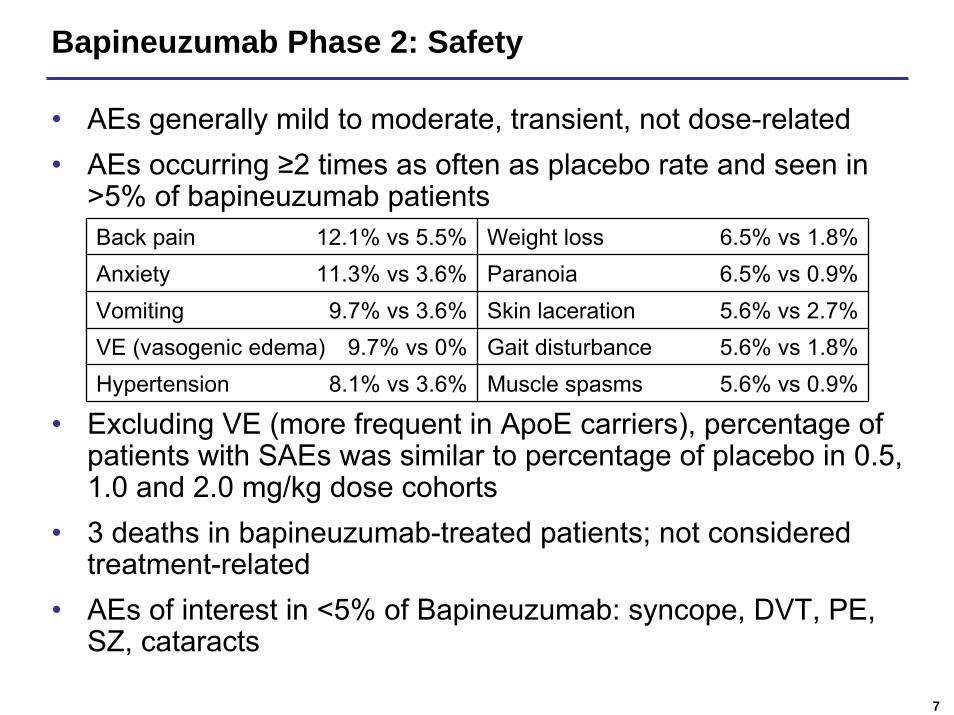
Bapineuzumab Phase 2: Safety
7
• AEs generally mild to moderate, transient, not dose-related• AEs occurring ≥2 times as often as placebo rate and seen in
>5% of bapineuzumab patients
• Excluding VE (more frequent in ApoE carriers), percentage of patients with SAEs was similar to percentage of placebo in 0.5, 1.0 and 2.0 mg/kg dose cohorts
• 3 deaths in bapineuzumab-treated patients; not considered treatment-related
• AEs of interest in <5% of Bapineuzumab: syncope, DVT, PE, SZ, cataracts
Back pain 12.1% vs 5.5% Weight loss 6.5% vs 1.8%Anxiety 11.3% vs 3.6% Paranoia 6.5% vs 0.9%Vomiting 9.7% vs 3.6% Skin laceration 5.6% vs 2.7%VE (vasogenic edema) 9.7% vs 0% Gait disturbance 5.6% vs 1.8%Hypertension 8.1% vs 3.6% Muscle spasms 5.6% vs 0.9%
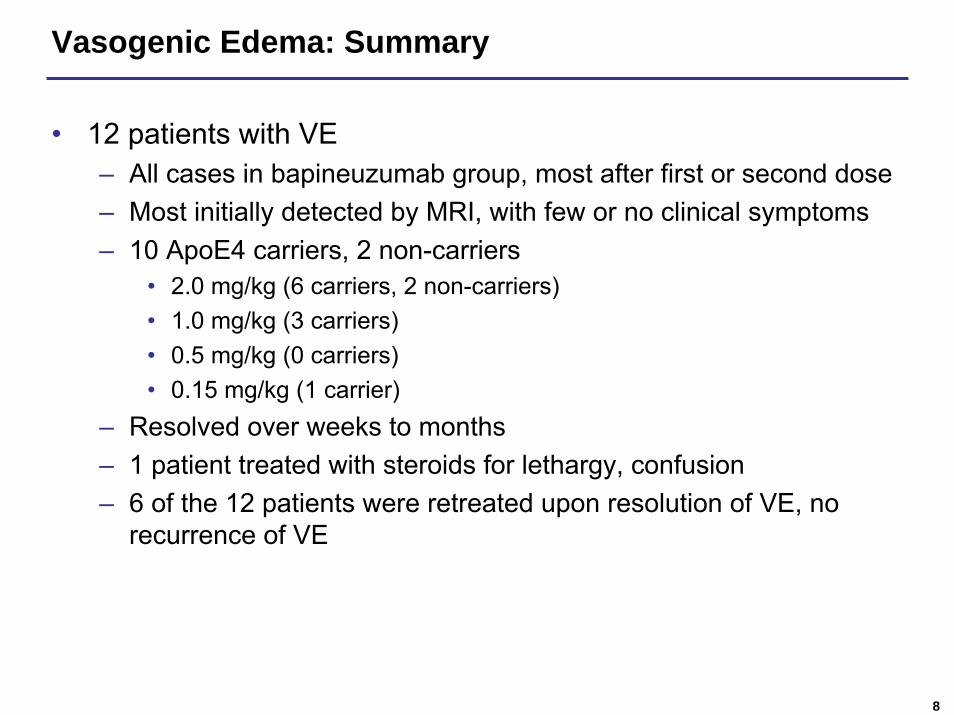
Vasogenic Edema: Summary
8
• 12 patients with VE – All cases in bapineuzumab group, most after first or second dose– Most initially detected by MRI, with few or no clinical symptoms– 10 ApoE4 carriers, 2 non-carriers
• 2.0 mg/kg (6 carriers, 2 non-carriers)• 1.0 mg/kg (3 carriers)• 0.5 mg/kg (0 carriers)• 0.15 mg/kg (1 carrier)
– Resolved over weeks to months– 1 patient treated with steroids for lethargy, confusion– 6 of the 12 patients were retreated upon resolution of VE, no
recurrence of VE
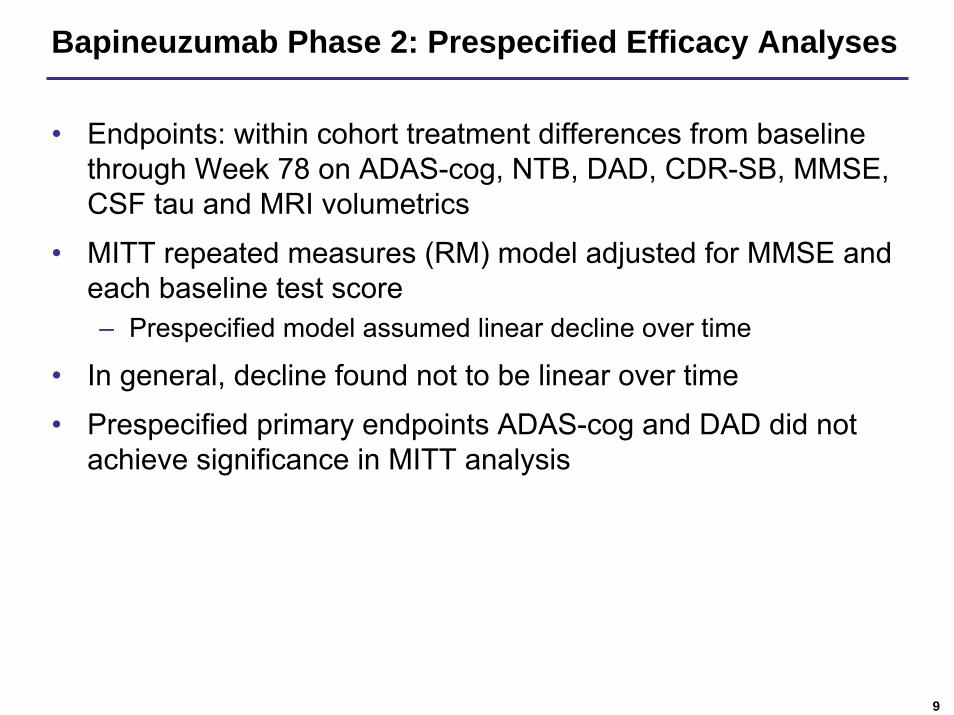
Bapineuzumab Phase 2: Prespecified Efficacy Analyses
9
• Endpoints: within cohort treatment differences from baseline through Week 78 on ADAS-cog, NTB, DAD, CDR-SB, MMSE, CSF tau and MRI volumetrics
• MITT repeated measures (RM) model adjusted for MMSE and each baseline test score – Prespecified model assumed linear decline over time
• In general, decline found not to be linear over time
• Prespecified primary endpoints ADAS-cog and DAD did not achieve significance in MITT analysis
Bapineuzumab Phase 2: Post-hoc Efficacy Analyses
10
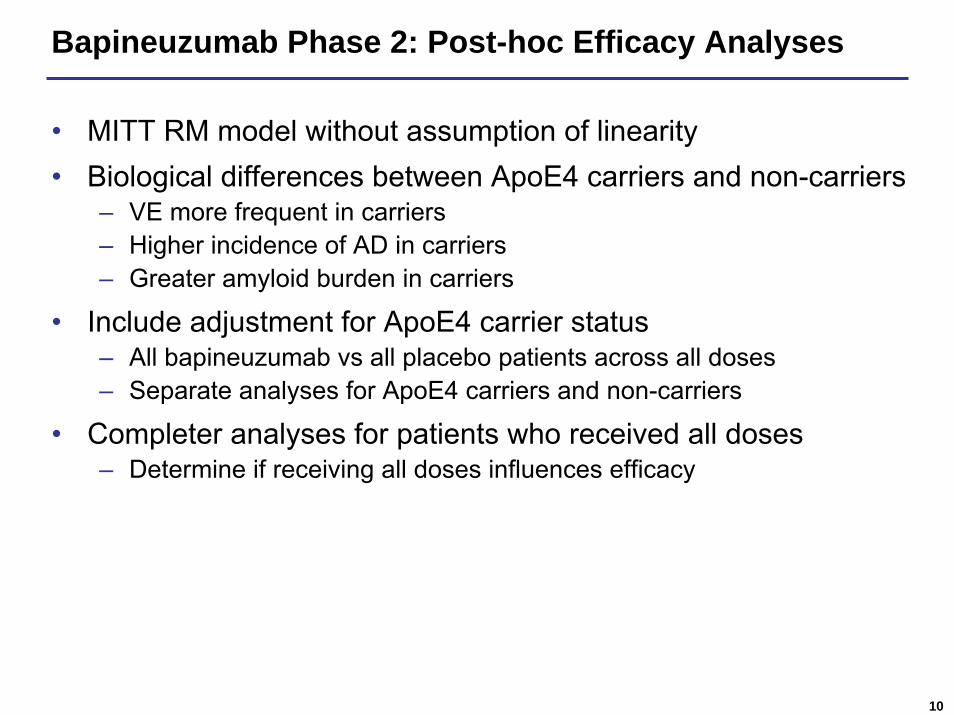
• MITT RM model without assumption of linearity• Biological differences between ApoE4 carriers and non-carriers
– VE more frequent in carriers– Higher incidence of AD in carriers– Greater amyloid burden in carriers
• Include adjustment for ApoE4 carrier status– All bapineuzumab vs all placebo patients across all doses– Separate analyses for ApoE4 carriers and non-carriers
• Completer analyses for patients who received all doses– Determine if receiving all doses influences efficacy
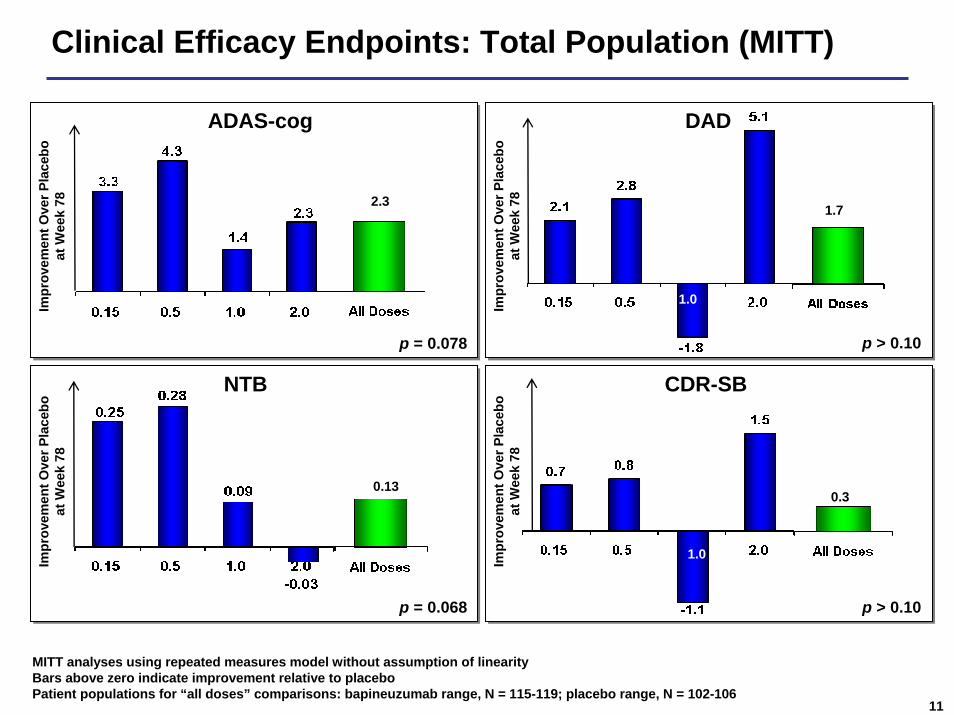
Clinical Efficacy Endpoints: Total Population (MITT)
11
ADAS-cog
NTB
p = 0.078
Impr
ovem
ent O
ver P
lace
bo
at W
eek
78Im
prov
emen
t Ove
r Pla
cebo
at
Wee
k 78
DAD
CDR-SB
p > 0.10
p > 0.10
1.0
1.0
Impr
ovem
ent O
ver P
lace
bo
at W
eek
78Im
prov
emen
t Ove
r Pla
cebo
at
Wee
k 78
p = 0.068
MITT analyses using repeated measures model without assumption of linearityBars above zero indicate improvement relative to placeboPatient populations for “all doses” comparisons: bapineuzumab range, N = 115-119; placebo range, N = 102-106
2.3 1.7
0.130.3
12
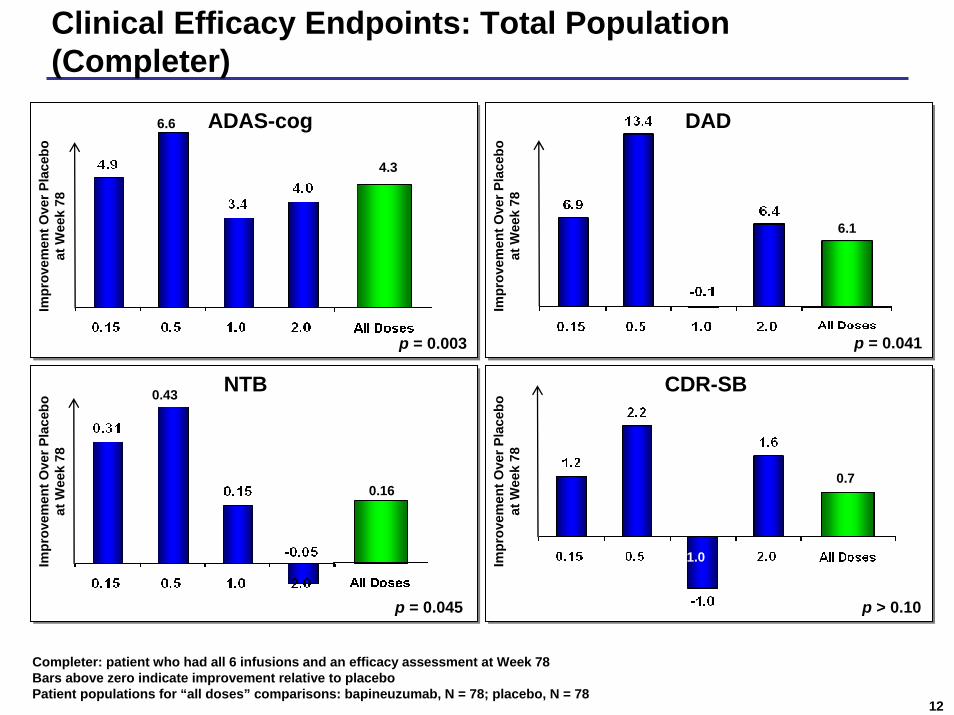
Clinical Efficacy Endpoints: Total Population (Completer)
p = 0.003
p = 0.045
0.43
ADAS-cog
NTB
Impr
ovem
ent O
ver P
lace
bo
at W
eek
78Im
prov
emen
t Ove
r Pla
cebo
at
Wee
k 78
6.6
p = 0.041
p > 0.10
1.0
DAD
CDR-SB
Impr
ovem
ent O
ver P
lace
bo
at W
eek
78Im
prov
emen
t Ove
r Pla
cebo
at
Wee
k 78
Completer: patient who had all 6 infusions and an efficacy assessment at Week 78Bars above zero indicate improvement relative to placeboPatient populations for “all doses” comparisons: bapineuzumab, N = 78; placebo, N = 78
6.1
0.16
4.3
0.7
13
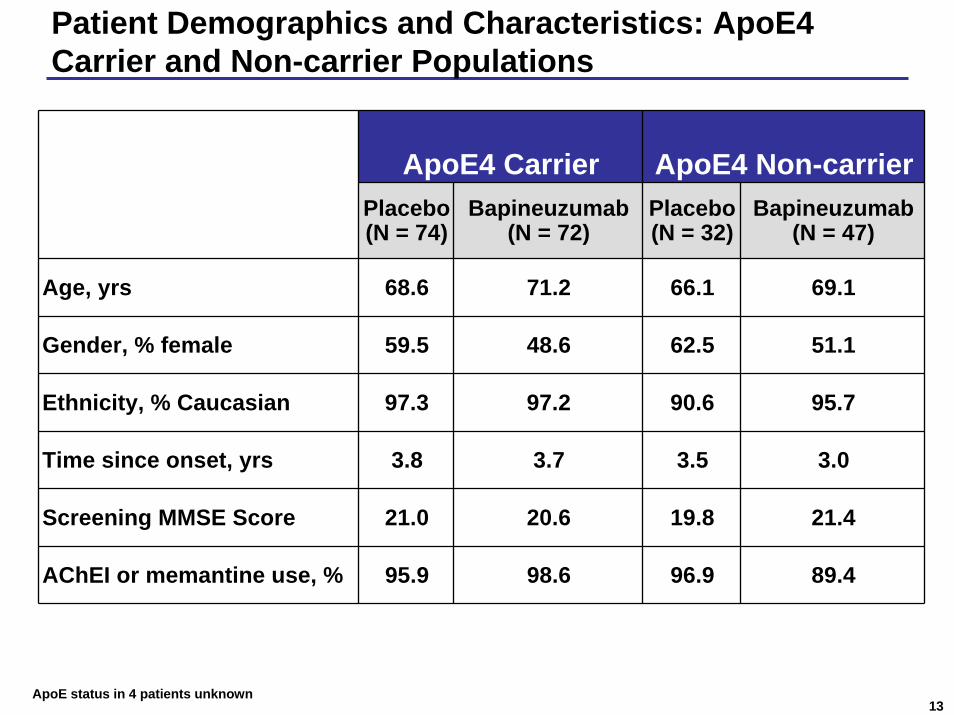
Patient Demographics and Characteristics: ApoE4 Carrier and Non-carrier Populations
ApoE4 Carrier ApoE4 Non-carrierPlacebo(N = 74)
Bapineuzumab(N = 72)
Placebo (N = 32)
Bapineuzumab(N = 47)
Age, yrs 68.6 71.2 66.1 69.1
Gender, % female 59.5 48.6 62.5 51.1
Ethnicity, % Caucasian 97.3 97.2 90.6 95.7
Time since onset, yrs 3.8 3.7 3.5 3.0
Screening MMSE Score 21.0 20.6 19.8 21.4
AChEI or memantine use, % 95.9 98.6 96.9 89.4
ApoE status in 4 patients unknown
14
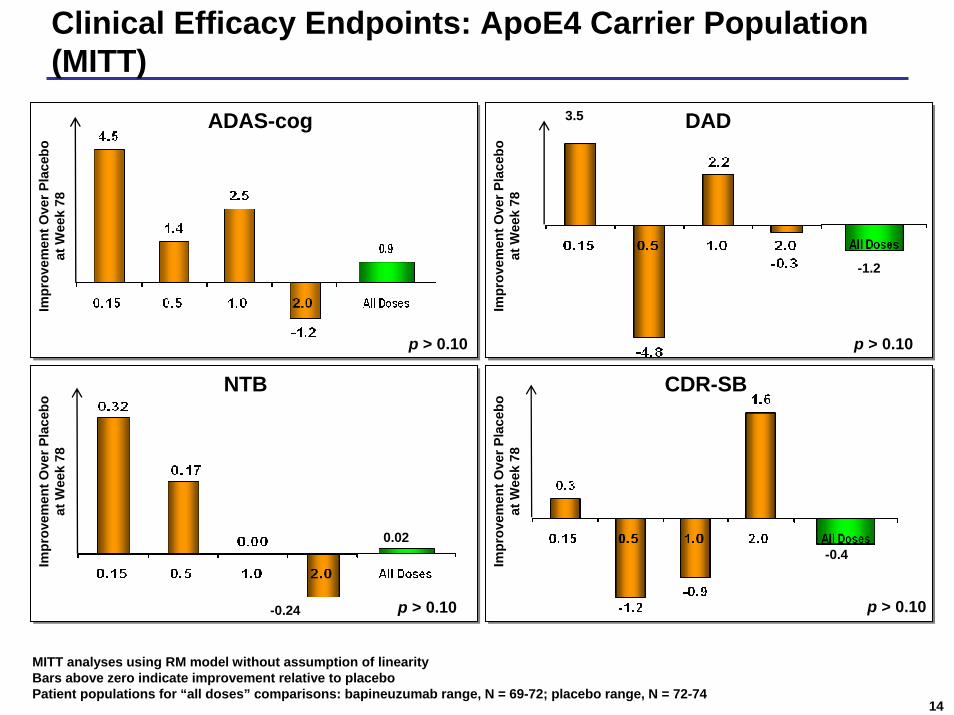
p > 0.10 p > 0.10
p > 0.10 p > 0.10 -0.24
Clinical Efficacy Endpoints: ApoE4 Carrier Population (MITT)
ADAS-cog DAD
NTB CDR-SB
Impr
ovem
ent O
ver P
lace
bo
at W
eek
78Im
prov
emen
t Ove
r Pla
cebo
at
Wee
k 78
Impr
ovem
ent O
ver P
lace
bo
at W
eek
78Im
prov
emen
t Ove
r Pla
cebo
at
Wee
k 78
-1.2
3.5
0.02-0.4
MITT analyses using RM model without assumption of linearity Bars above zero indicate improvement relative to placeboPatient populations for “all doses” comparisons: bapineuzumab range, N = 69-72; placebo range, N = 72-74
15
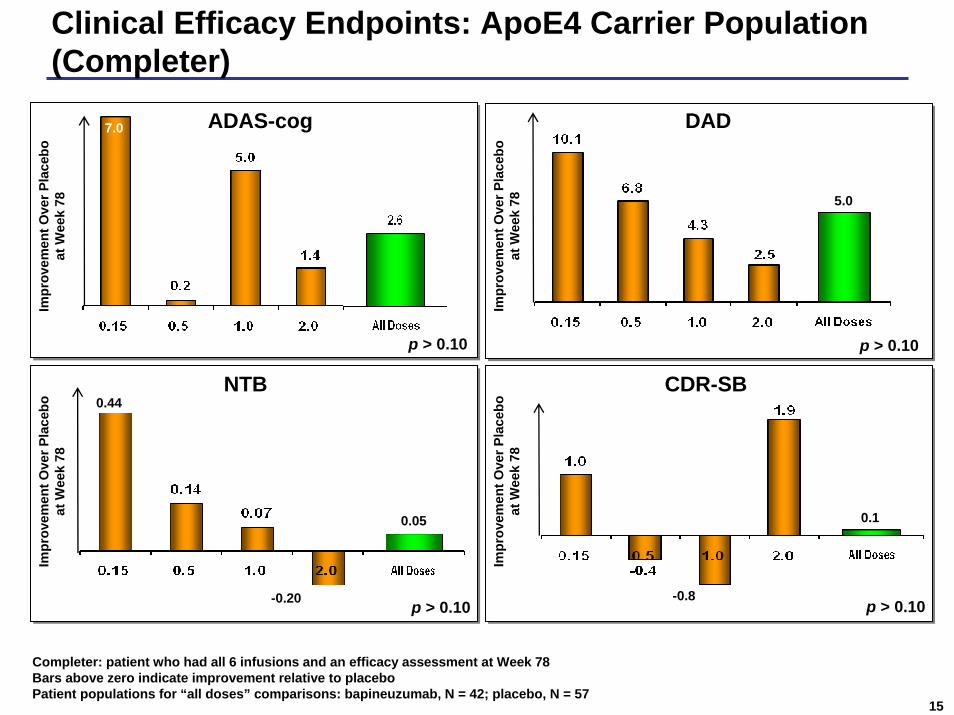
Clinical Efficacy Endpoints: ApoE4 Carrier Population (Completer)
Impr
ovem
ent O
ver P
lace
bo
at W
eek
78Im
prov
emen
t Ove
r Pla
cebo
at
Wee
k 78
Impr
ovem
ent O
ver P
lace
bo
at W
eek
78Im
prov
emen
t Ove
r Pla
cebo
at
Wee
k 78
p > 0.10 p > 0.10
p > 0.10 p > 0.10
0.44
-0.20
ADAS-cog DAD
NTB CDR-SB
7.0
5.0
0.05
-0.8
0.1
Completer: patient who had all 6 infusions and an efficacy assessment at Week 78Bars above zero indicate improvement relative to placeboPatient populations for “all doses” comparisons: bapineuzumab, N = 42; placebo, N = 57
16
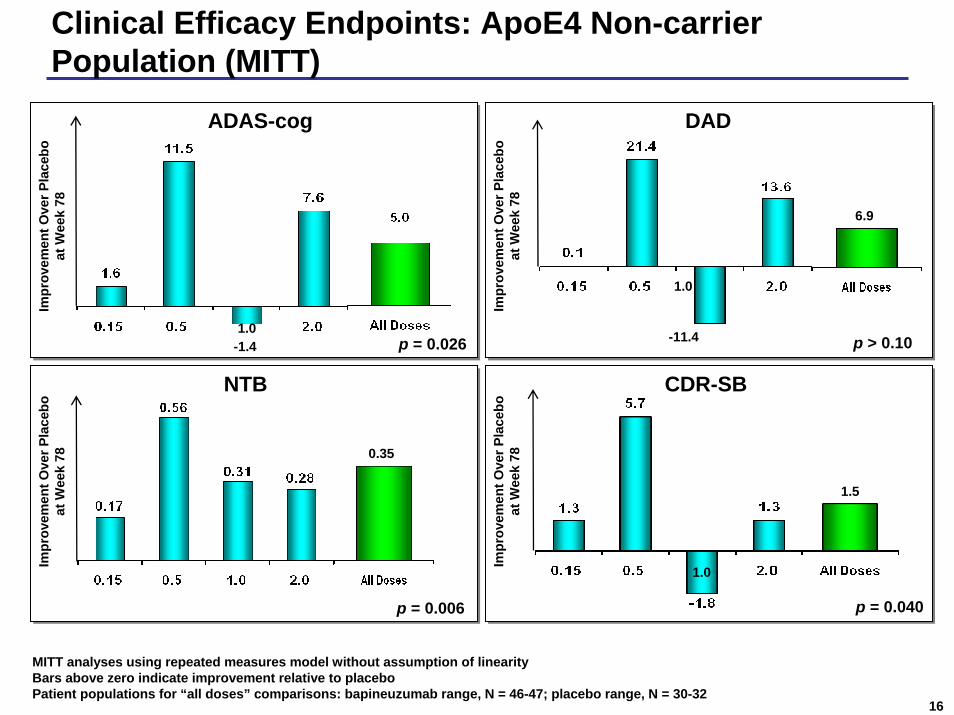
Clinical Efficacy Endpoints: ApoE4 Non-carrier Population (MITT)
p = 0.026
ADAS-cog
NTB
Impr
ovem
ent O
ver P
lace
bo
at W
eek
78Im
prov
emen
t Ove
r Pla
cebo
at
Wee
k 78
p > 0.10
p = 0.040
1.0
DAD
CDR-SB
Impr
ovem
ent O
ver P
lace
bo
at W
eek
78Im
prov
emen
t Ove
r Pla
cebo
at
Wee
k 78
6.9
-11.41.0-1.4
0.35
1.5
1.0
p = 0.006
MITT analyses using repeated measures model without assumption of linearity Bars above zero indicate improvement relative to placeboPatient populations for “all doses” comparisons: bapineuzumab range, N = 46-47; placebo range, N = 30-32
17
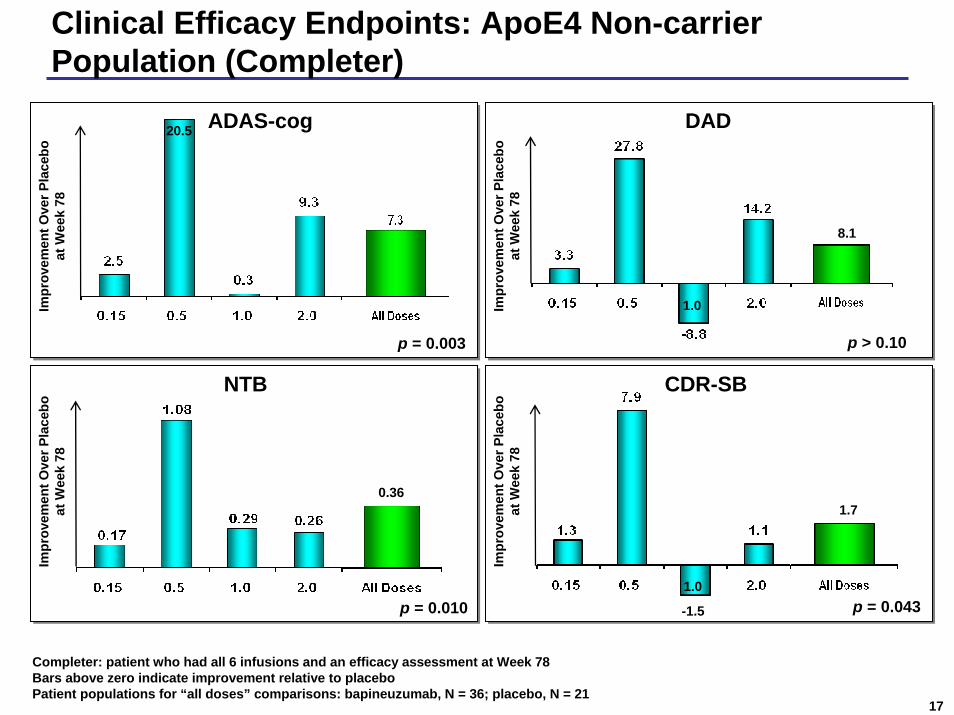
Clinical Efficacy Endpoints: ApoE4 Non-carrier Population (Completer)
p = 0.003 p > 0.10
p = 0.043p = 0.010
20.5
1.0
ADAS-cog DAD
NTB CDR-SB
Impr
ovem
ent O
ver P
lace
bo
at W
eek
78Im
prov
emen
t Ove
r Pla
cebo
at
Wee
k 78
Impr
ovem
ent O
ver P
lace
bo
at W
eek
78Im
prov
emen
t Ove
r Pla
cebo
at
Wee
k 78
8.1
0.361.7
1.0
-1.5
Completer: patient who had all 6 infusions and an efficacy assessment at Week 78Bars above zero indicate improvement relative to placeboPatient populations for “all doses” comparisons: bapineuzumab, N = 36; placebo, N = 21

18
Rx difference at Week 78 = 5.0p = 0.026
DAD
Rx difference at Week 78 = 6.9p > 0.10
MITT analysis using RM model without linearity assumption
N = 32N = 47
N = 32N = 47
ADAS-cogBapineuzumabPlacebo
Clinical Efficacy Endpoints: ApoE4 Non-carrier Population (MITT)
BapineuzumabPlacebo
CDR-SB
Rx difference at Week 78 = 1.54p = 0.040
N = 30N = 46
NTB
Rx difference at Week 78 = 0.35p = 0.006
N = 32
N = 47
BapineuzumabPlacebo
BapineuzumabPlacebo
0
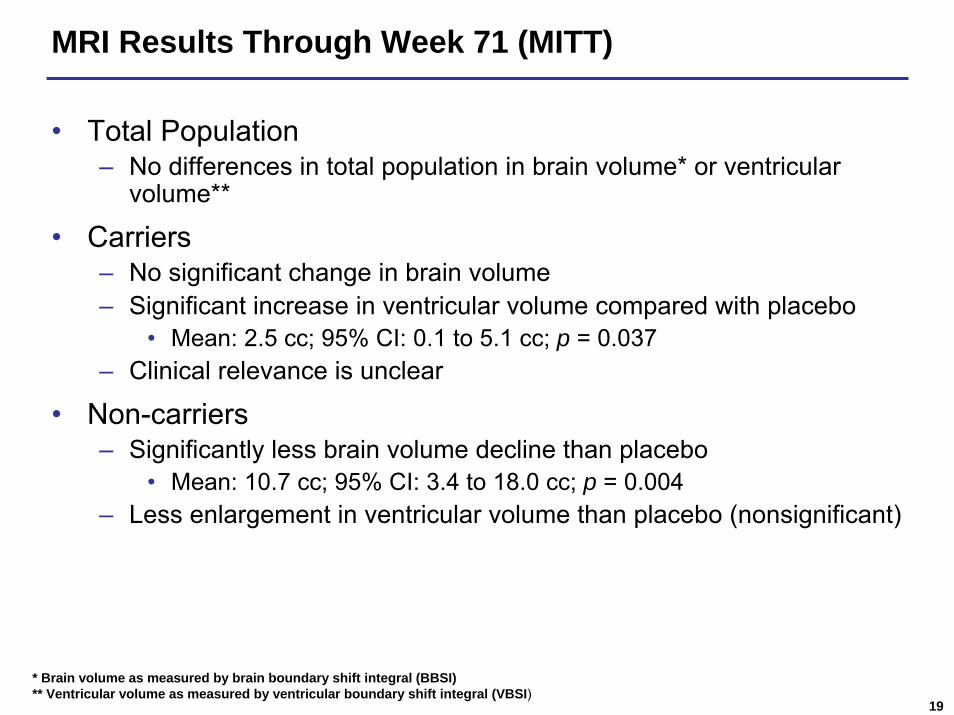
MRI Results Through Week 71 (MITT)
19
• Total Population– No differences in total population in brain volume* or ventricular
volume**
• Carriers– No significant change in brain volume– Significant increase in ventricular volume compared with placebo
• Mean: 2.5 cc; 95% CI: 0.1 to 5.1 cc; p = 0.037– Clinical relevance is unclear
• Non-carriers– Significantly less brain volume decline than placebo
• Mean: 10.7 cc; 95% CI: 3.4 to 18.0 cc; p = 0.004– Less enlargement in ventricular volume than placebo (nonsignificant)
* Brain volume as measured by brain boundary shift integral (BBSI)** Ventricular volume as measured by ventricular boundary shift integral (VBSI)
20
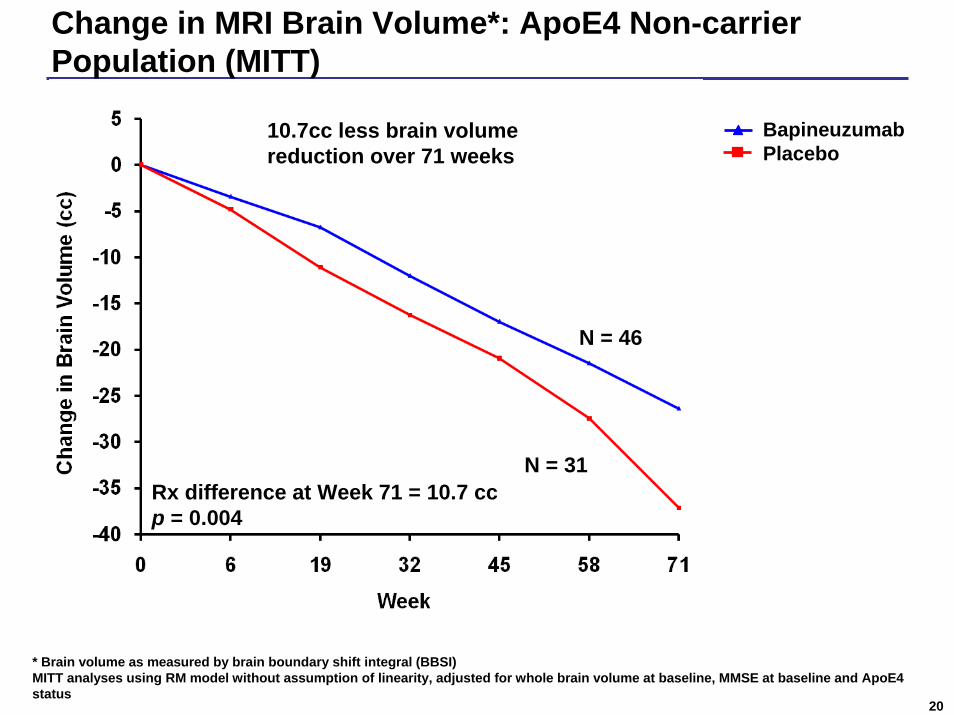
N = 46
N = 31
10.7cc less brain volume reduction over 71 weeks
Rx difference at Week 71 = 10.7 ccp = 0.004
Change in MRI Brain Volume*: ApoE4 Non-carrier Population (MITT)
* Brain volume as measured by brain boundary shift integral (BBSI)MITT analyses using RM model without assumption of linearity, adjusted for whole brain volume at baseline, MMSE at baseline and ApoE4 status
BapineuzumabPlacebo
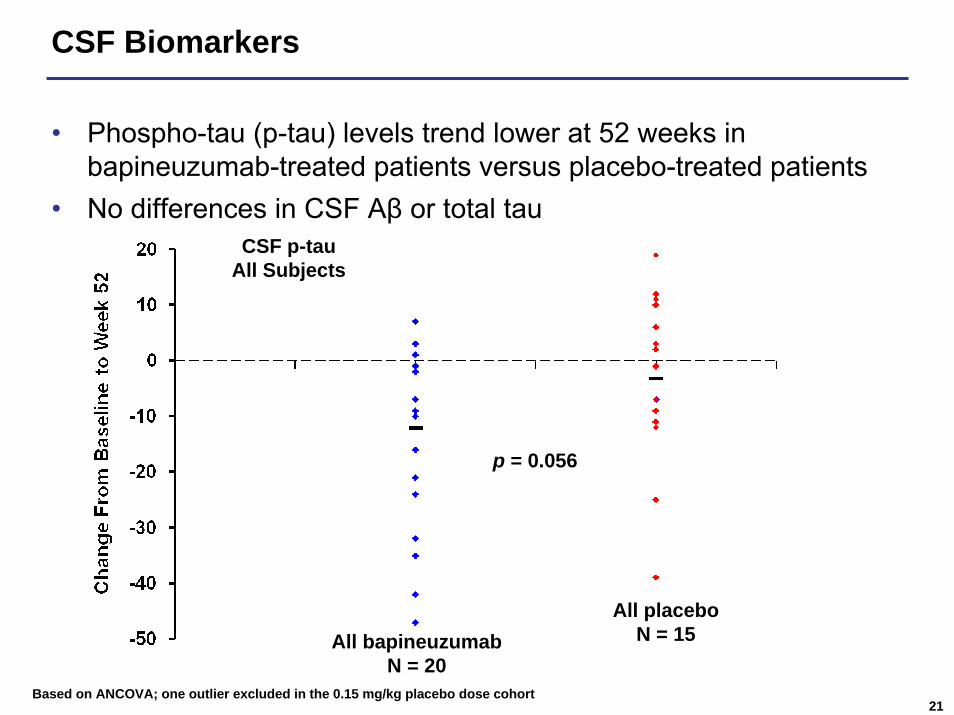
CSF Biomarkers
21
• Phospho-tau (p-tau) levels trend lower at 52 weeks in bapineuzumab-treated patients versus placebo-treated patients
• No differences in CSF Aβ or total tau
p = 0.056
All placeboN = 15All bapineuzumab
N = 20
CSF p-tauAll Subjects
Based on ANCOVA; one outlier excluded in the 0.15 mg/kg placebo dose cohort
Conclusions
22
Overall Assessment:• Results support the design and further evaluation of
bapineuzumab in the ongoing Phase 3 trials• Bapineuzumab generally safe and well-tolerated• VE dose related, more frequent in carriers which influenced in
Phase 3 program design• Pre-specified efficacy analysis did not reach significance in the
total populationIn Post Hoc Analyses:• Trends were observed in the cognitive endpoints ADAS-cog
and NTB in the total population• Evidence of significant efficacy in non-carriers (clinical and
MRI)• Favorable directional changes in carriers on some efficacy
measures• Potential efficacy signals over a range of doses without a clear
dose response

23