Embed Size (px)
Citation preview

3Q16 ResultsOctober 21, 2016
17,449 16,071 15,738
15,047 16,348
13,839
17,379
1Q15 2Q15 3Q15 4Q15 1Q16 2Q16 3Q16
2
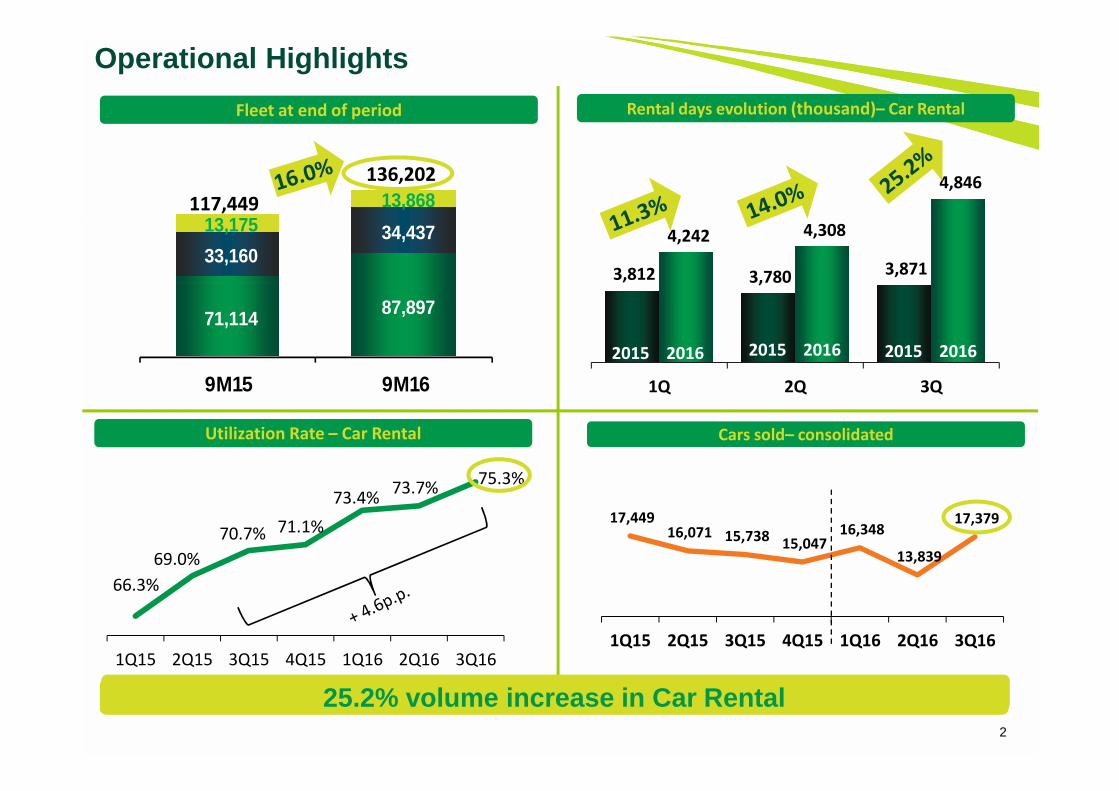
Operational Highlights
Fleet at end of period
Utilization Rate – Car Rental Cars sold– consolidated
Rental days evolution (thousand)– Car Rental
3,812 3,780 3,871
4,242 4,308
4,846
1Q 2Q 3Q
66.3%
69.0%
70.7% 71.1%
73.4%73.7%
75.3%
1Q15 2Q15 3Q15 4Q15 1Q16 2Q16 3Q16
71,114 87,897
33,160 34,437 13,175 13,868
9M15 9M16
117,449
136,202
25.2% volume increase in Car Rental
2015 2016 2015 2016 2015 2016
25.2% volume increase in Car Rental
3
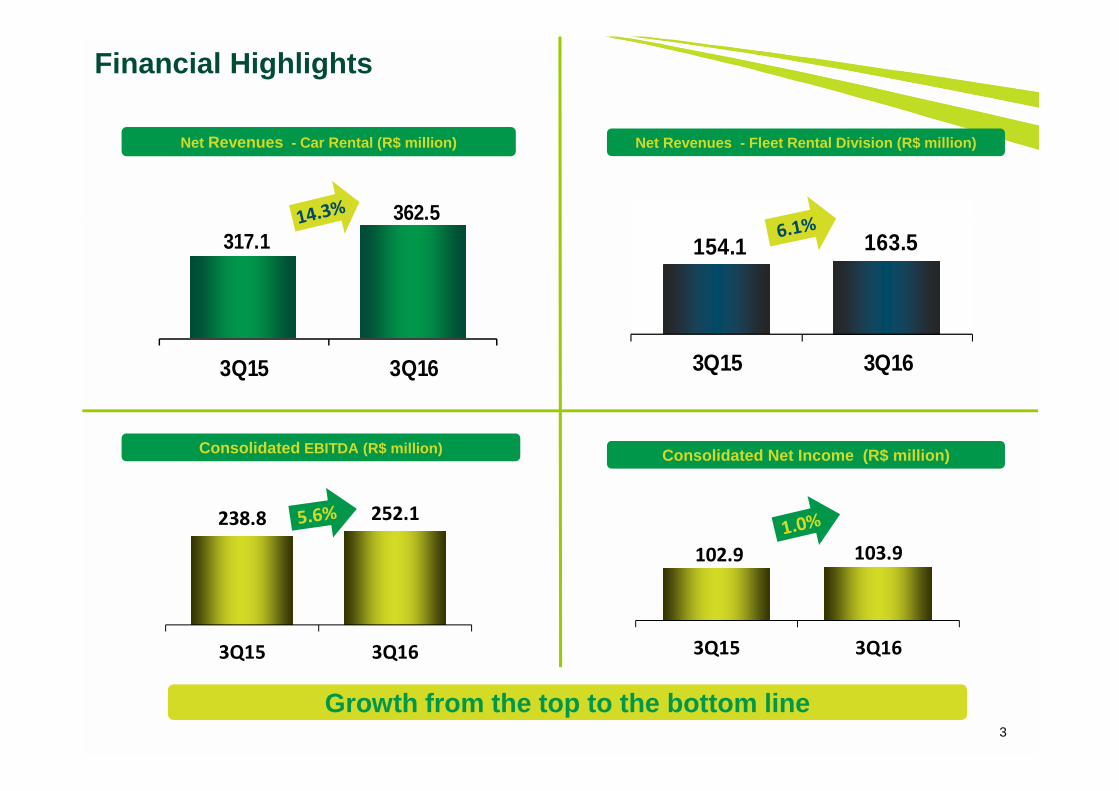
Financial Highlights
Net Revenues - Car Rental (R$ million) Net Revenues - Fleet Rental Division (R$ million)
317.1 362.5
3Q15 3Q16
154.1 163.5
3Q15 3Q16
238.8 252.1
3Q15 3Q16
102.9 103.9
3Q15 3Q16
Consolidated EBITDA (R$ million) Consolidated Net Income (R$ million)
Growth from the top to the bottom line
4
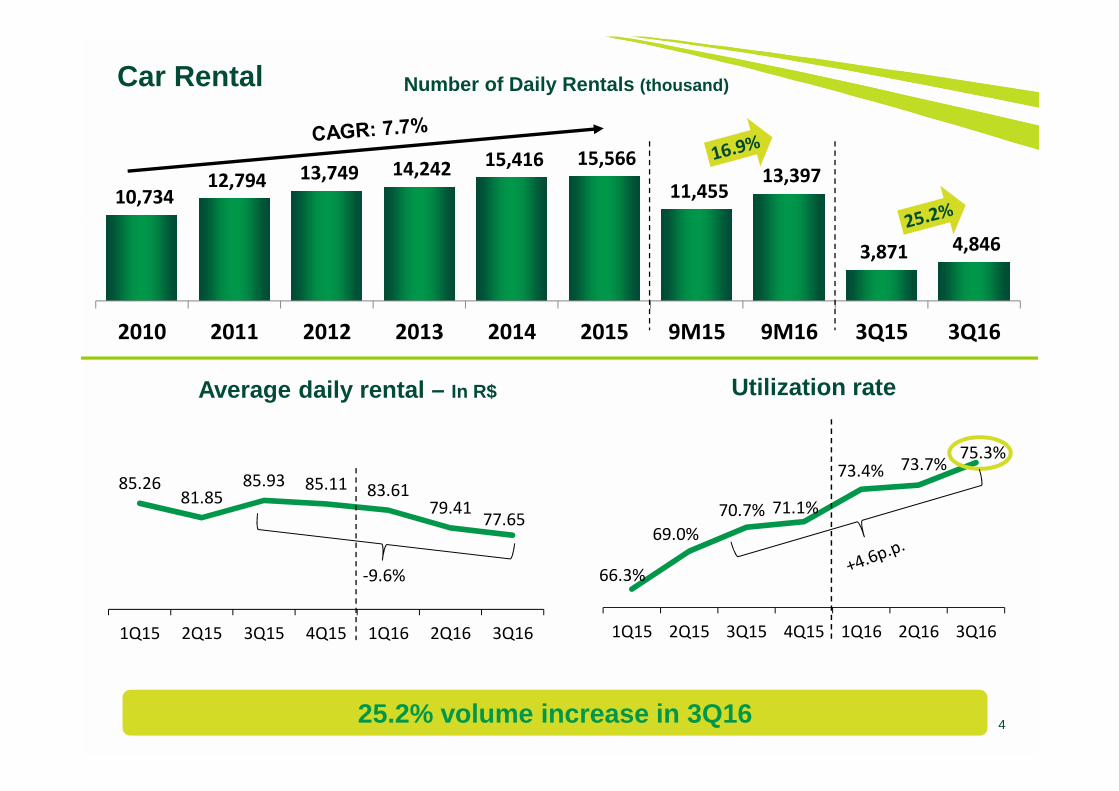
Number of Daily Rentals (thousand)
25.2% volume increase in 3Q16
10,734 12,794 13,749 14,242 15,416 15,566
11,455 13,397
3,871 4,846
2010 2011 2012 2013 2014 2015 9M15 9M16 3Q15 3Q16
Car Rental
Average daily rental – In R$ Utilization rate
66.3%
69.0%
70.7% 71.1%
73.4% 73.7%75.3%
1Q15 2Q15 3Q15 4Q15 1Q16 2Q16 3Q16
85.2681.85
85.93 85.11 83.6179.41
77.65
1Q15 2Q15 3Q15 4Q15 1Q16 2Q16 3Q16
-9.6%
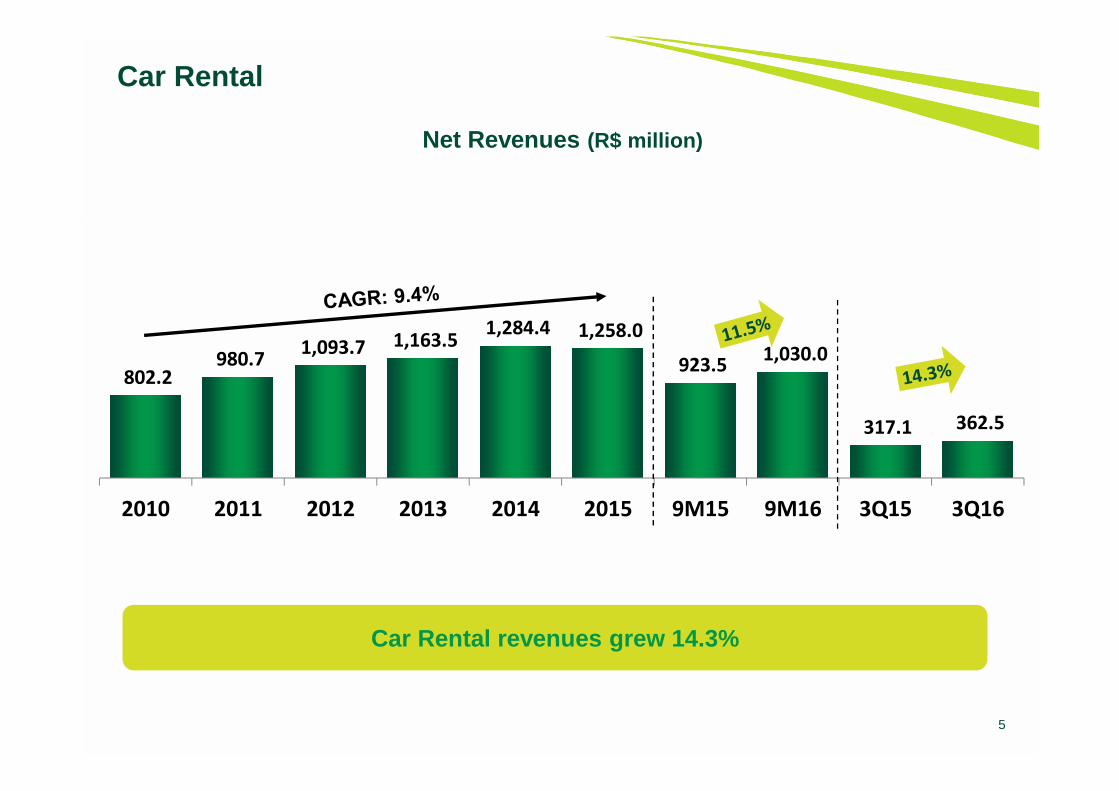
5
Car Rental revenues grew 14.3%
802.2 980.7
1,093.7 1,163.5 1,284.4 1,258.0
923.5 1,030.0
317.1 362.5
2010 2011 2012 2013 2014 2015 9M15 9M16 3Q15 3Q16
Net Revenues (R$ million)
Car Rental
6
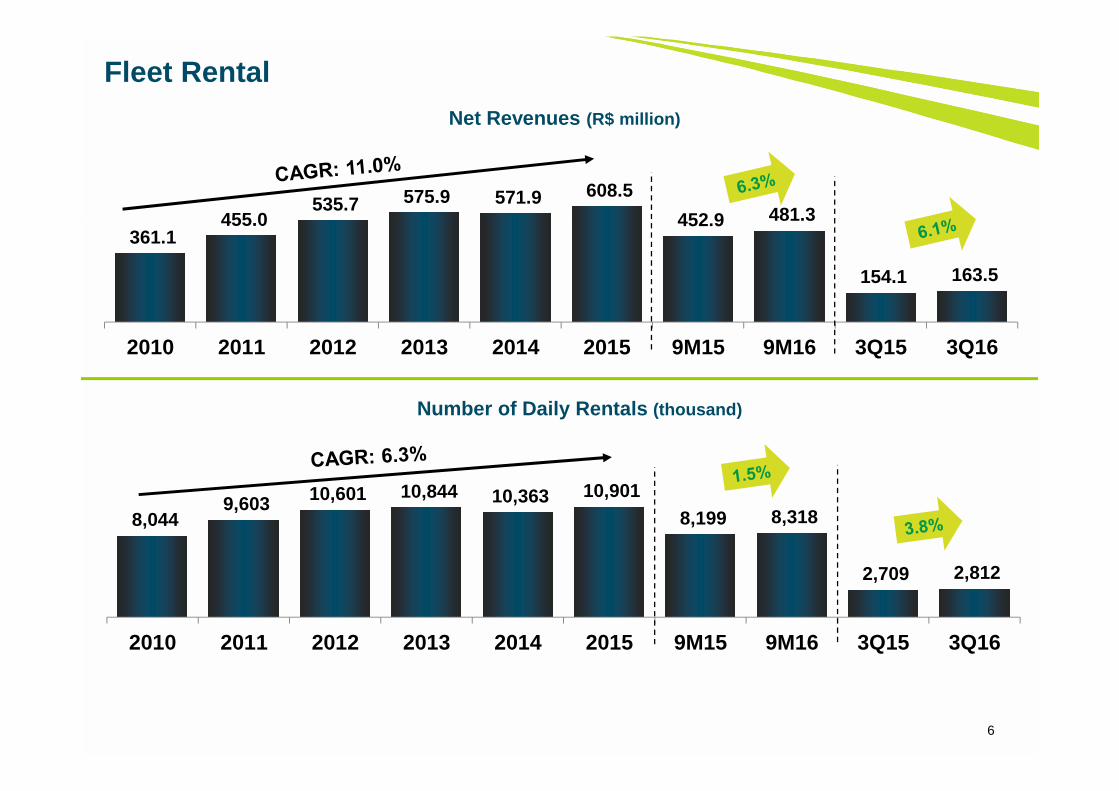
Fleet Rental
361.1 455.0
535.7 575.9 571.9 608.5
452.9 481.3
154.1 163.5
2010 2011 2012 2013 2014 2015 9M15 9M16 3Q15 3Q16
8,044 9,603 10,601 10,844 10,363 10,901
8,199 8,318
2,709 2,812
2010 2011 2012 2013 2014 2015 9M15 9M16 3Q15 3Q16
Net Revenues (R$ million)
Number of Daily Rentals (thousand)
Purchases (includes accessories) Used c ar sales net revenues
Cars purchased Cars sold
7
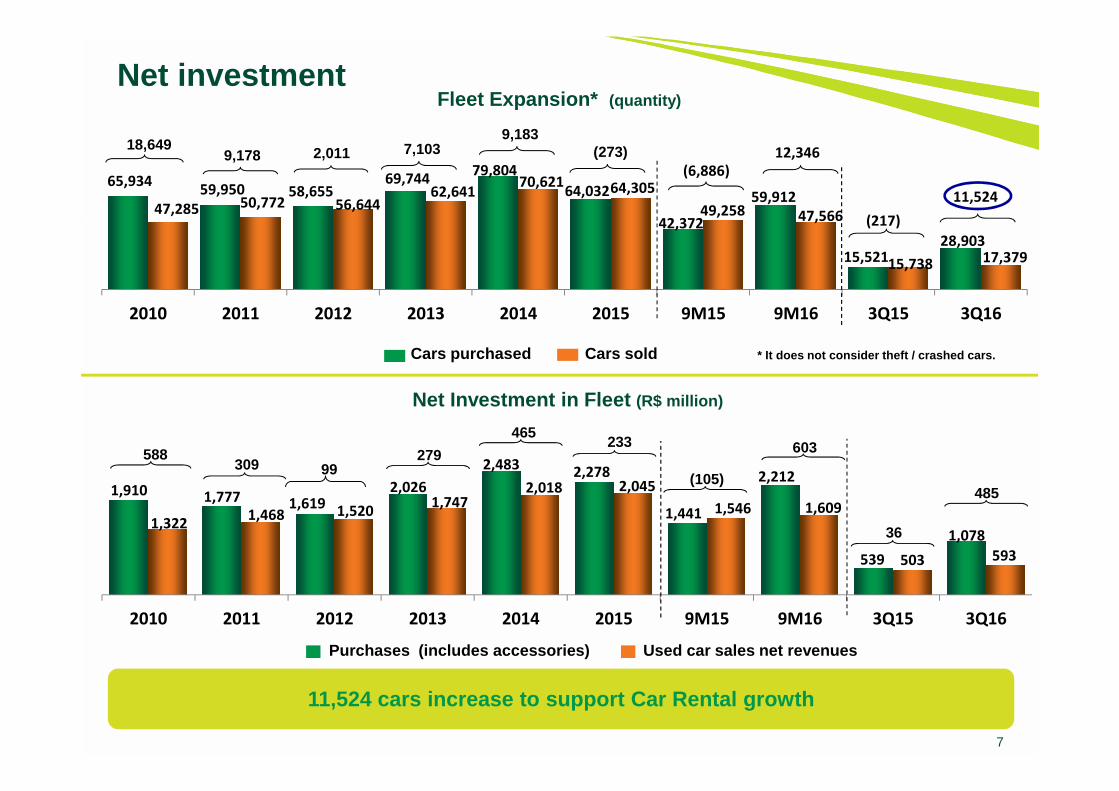
Net investmentFleet Expansion* (quantity)
Net Investment in Fleet (R$ million)
9,178 2,011 7,10318,649
* It does not consider theft / crashed cars.
9,183
465
(273)
65,934 59,950 58,655
69,744 79,804
64,032
42,372
59,912
15,521 28,903
47,285 50,772 56,644 62,641
70,621 64,305
49,258 47,566
15,738 17,379
2010 2011 2012 2013 2014 2015 9M15 9M16 3Q15 3Q16
1,910 1,777 1,6192,026
2,4832,278
1,441
2,212
539
1,0781,322
1,468 1,5201,747
2,018 2,045
1,546 1,609
503 593
2010 2011 2012 2013 2014 2015 9M15 9M16 3Q15 3Q16
11,524 cars increase to support Car Rental growth
309 99588 279
233
(105)
603
36
485
(6,886)12,346
(217)
11,524
8
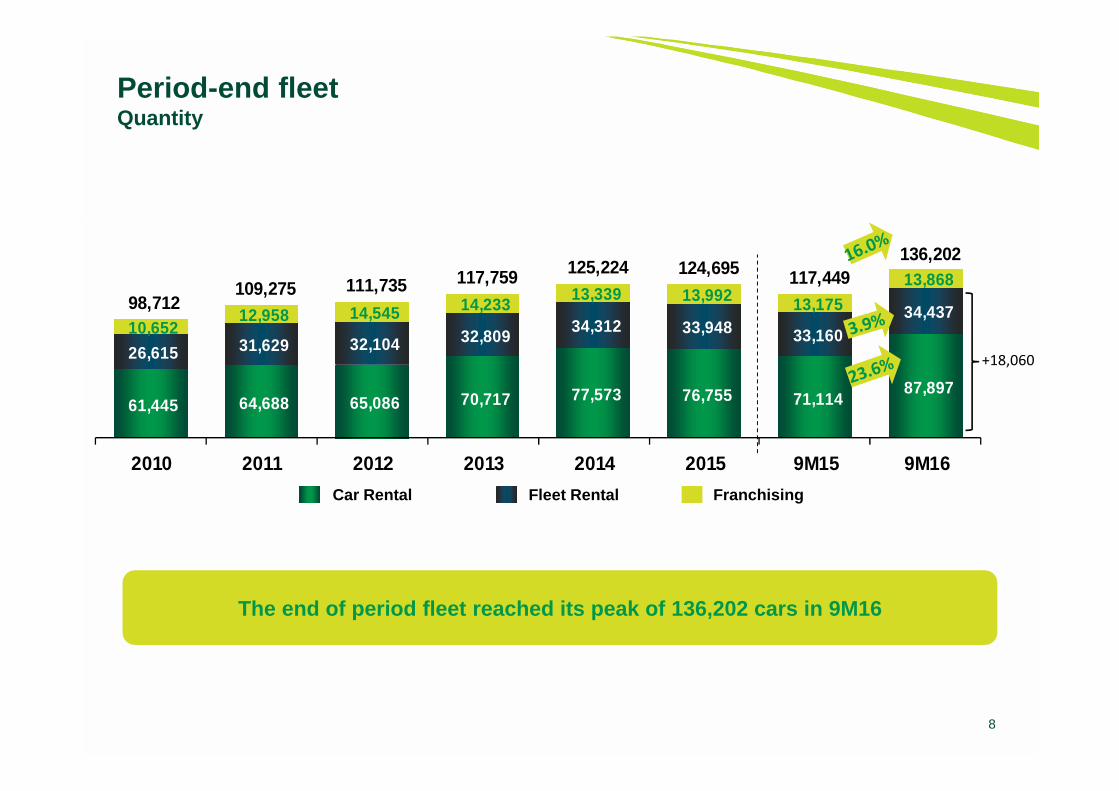
Period-end fleetQuantity
61,445 64,688 65,086 70,717 77,573 76,755 71,114 87,897
26,615 31,629 32,104 32,809 34,312 33,948 33,160
34,437 98,712 109,275 111,735 117,759 125,224 124,695 117,449
136,202
10,652 12,958 14,545 14,233
13,339 13,992 13,175 13,868
2010 2011 2012 2013 2014 2015 9M15 9M16
Car Rental Fleet Rental Franchising
The end of period fleet reached its peak of 136,202 cars in 9M16
+18,060
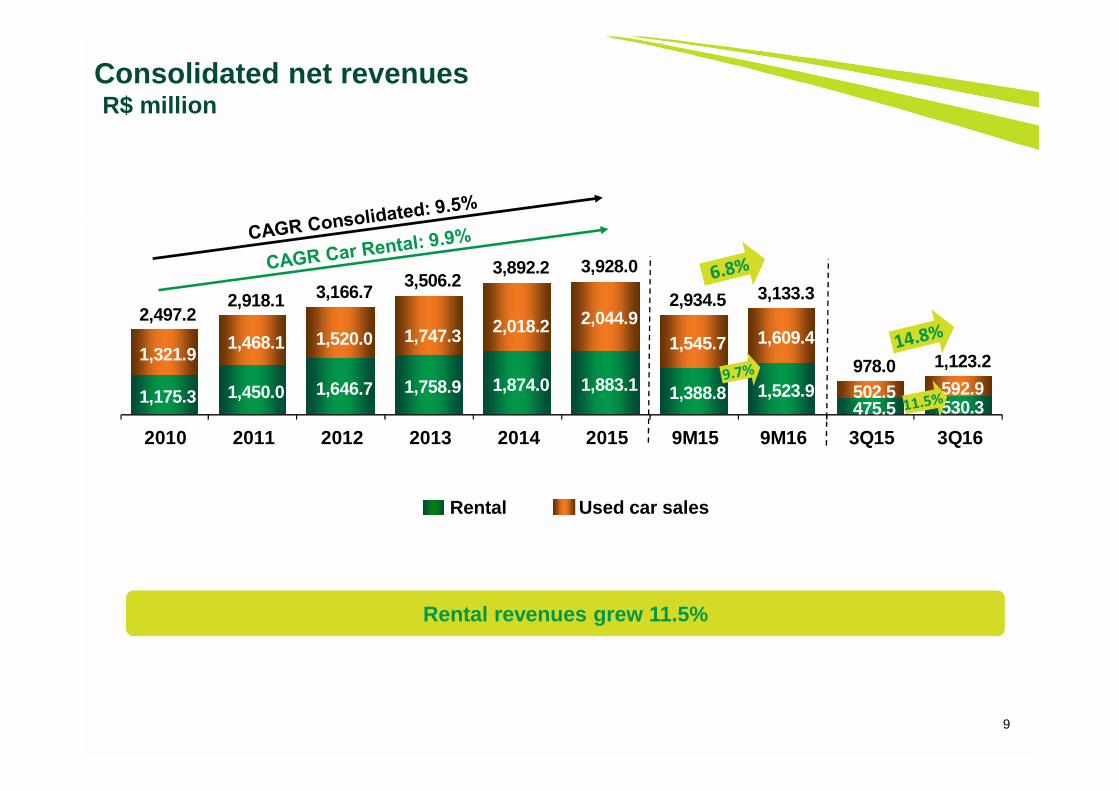
1,175.3 1,450.0 1,646.7 1,758.9 1,874.0 1,883.1 1,388.8 1,523.9 475.5 530.3
1,321.9 1,468.1 1,520.0 1,747.3 2,018.2 2,044.9
1,545.7 1,609.4
502.5 592.9
2,497.2 2,918.1 3,166.7
3,506.2 3,892.2 3,928.0
2,934.5 3,133.3
978.0 1,123.2
2010 2011 2012 2013 2014 2015 9M15 9M16 3Q15 3Q16
9
Consolidated net revenuesR$ million
Rental Used car sales
Rental revenues grew 11.5%
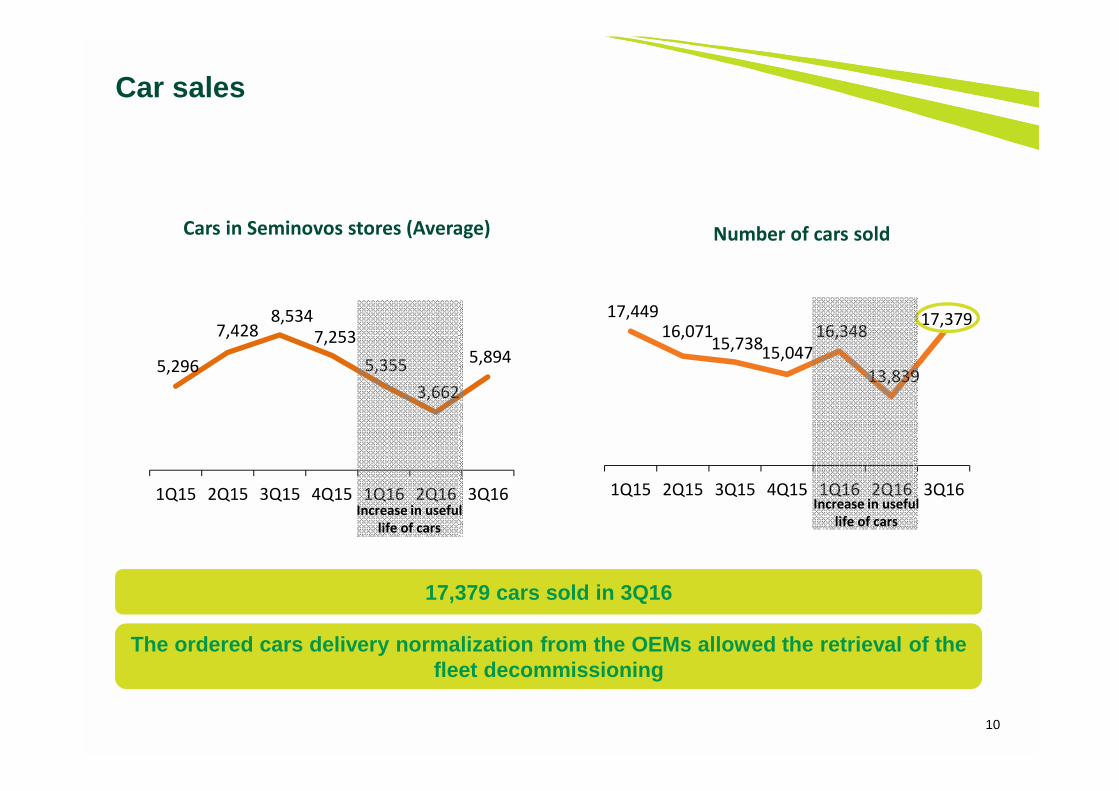
Car sales
17,379 cars sold in 3Q16
17,449 16,071
15,738 15,047
16,348
13,839
17,379
1Q15 2Q15 3Q15 4Q15 1Q16 2Q16 3Q16
Number of cars sold
10
5,296
7,428 8,534
7,253
5,355
3,662
5,894
1Q15 2Q15 3Q15 4Q15 1Q16 2Q16 3Q16
Cars in Seminovos stores (Average)
The ordered cars delivery normalization from the OE Ms allowed the retrieval of the fleet decommissioning
Increase in useful
life of cars
Increase in useful
life of cars
11
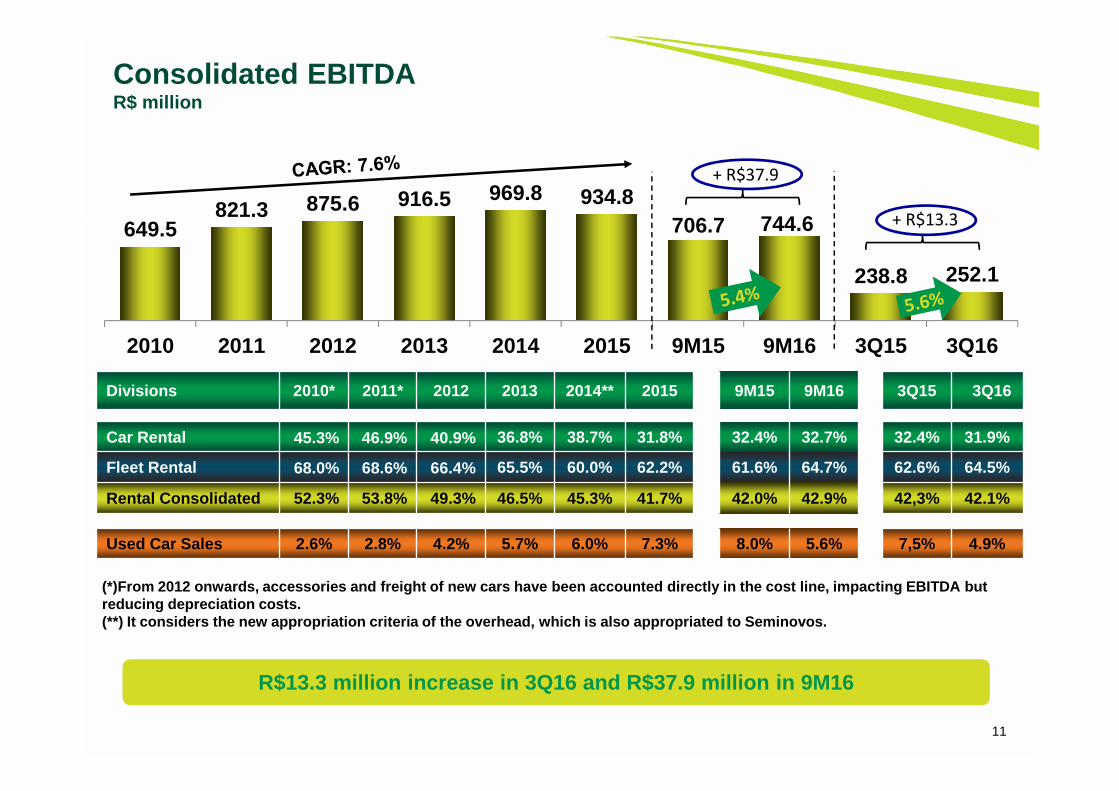
Consolidated EBITDA R$ million
(*)From 2012 onwards, accessories and freight of ne w cars have been accounted directly in the cost lin e, impacting EBITDA but reducing depreciation costs.(**) It considers the new appropriation criteria of the overhead, which is also appropriated to Semino vos.
Divisions 2010* 2011* 2012 2013 2014** 2015 9M15 9M16 3Q15 3Q 16
Car Rental 45.3% 46.9% 40.9% 36.8% 38.7% 31.8% 32.4% 32.7% 32.4% 31.9%
Fleet Rental 68.0% 68.6% 66.4% 65.5% 60.0% 62.2% 61.6% 64.7% 62.6% 64.5%
Rental Consolidated 52.3% 53.8% 49.3% 46.5% 45.3% 41.7% 42. 0% 42.9% 42,3% 42.1%
Used Car Sales 2.6% 2.8% 4.2% 5.7% 6.0% 7.3% 8.0% 5.6% 7,5% 4. 9%
R$13.3 million increase in 3Q16 and R$37.9 million in 9M16
649.5821.3 875.6 916.5 969.8 934.8
706.7 744.6
238.8 252.1
2010 2011 2012 2013 2014 2015 9M15 9M16 3Q15 3Q16
+ R$37.9
+ R$13.3
12
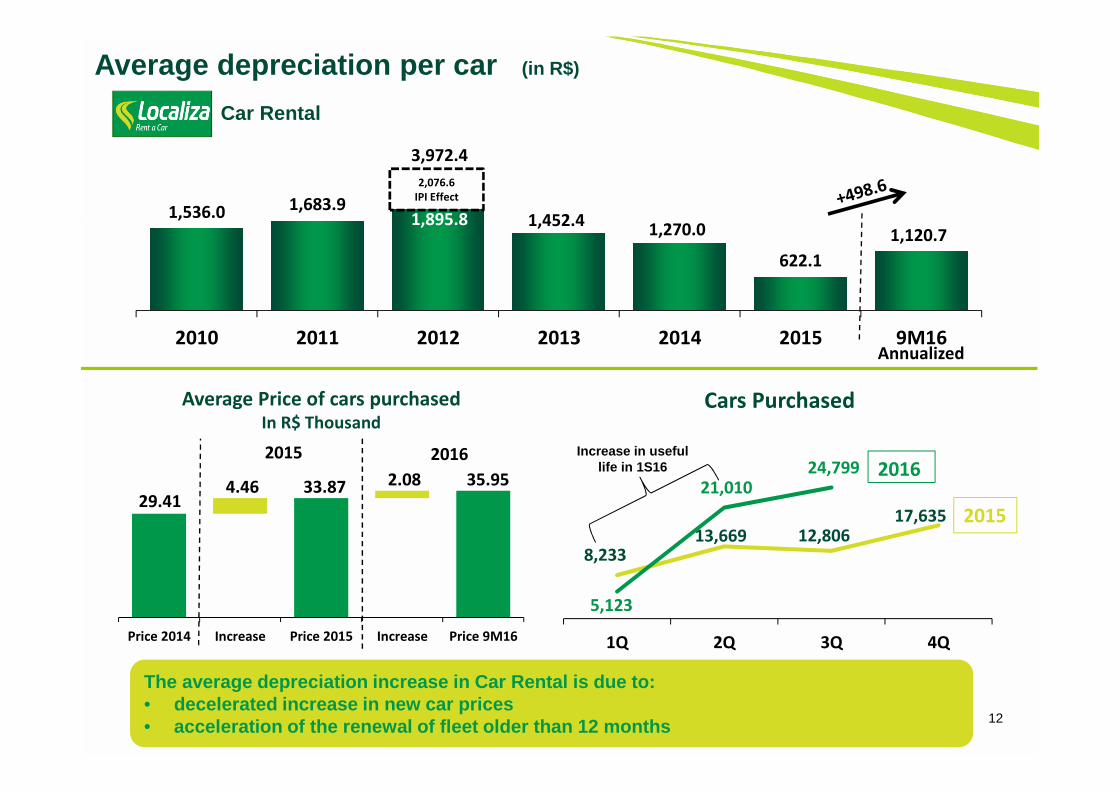
Average depreciation per car (in R$)
Car Rental
The average depreciation increase in Car Rental is due to:• decelerated increase in new car prices• acceleration of the renewal of fleet older than 12 months
1,536.0 1,683.91,895.8 1,452.4
1,270.0
622.1
1,120.7
2010 2011 2012 2013 2014 2015 9M16
2,076.6
IPI Effect
3,972.4
Annualized
Average Price of cars purchasedIn R$ Thousand
29.41 33.87 35.95 4.46 2.08
Price 2014 Increase Price 2015 Increase Price 9M16
8,233 13,669 12,806
17,635
5,123
21,010 24,799
1Q 2Q 3Q 4Q
2016
2015
Cars Purchased
Increase in usefullife in 1S16
2015 2016
13
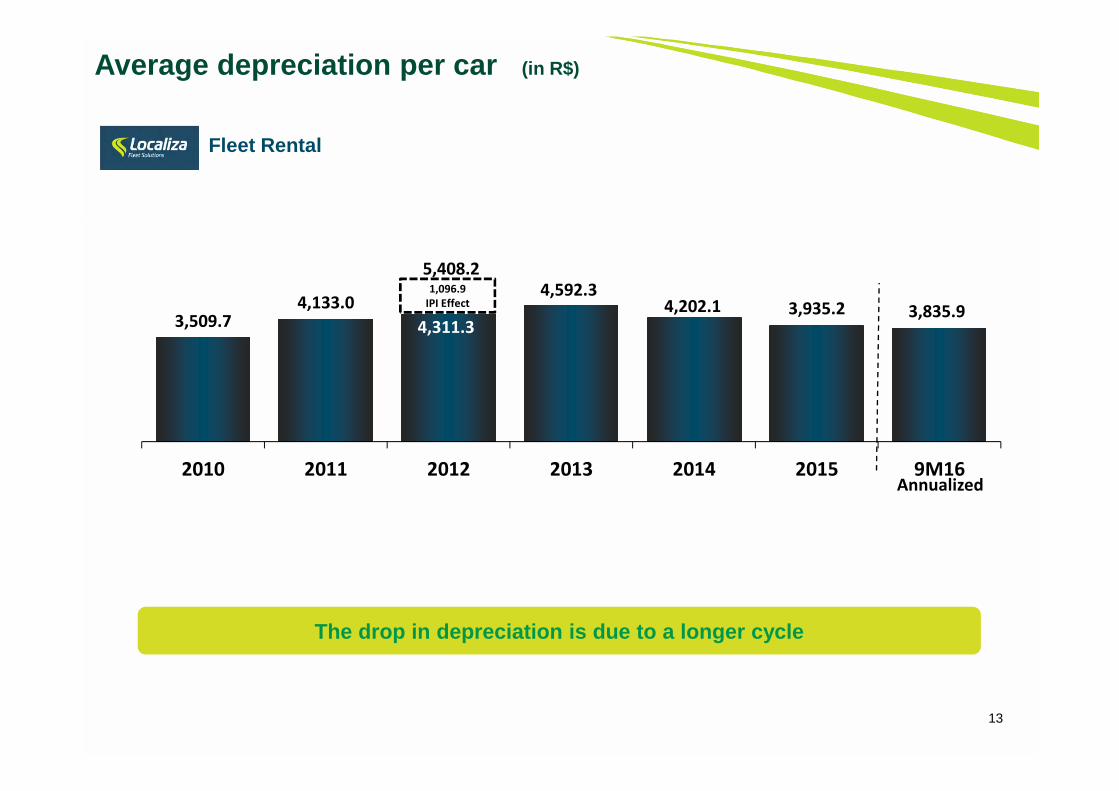
Average depreciation per car (in R$)
The drop in depreciation is due to a longer cycle
3,509.74,133.0
4,311.3
4,592.34,202.1 3,935.2 3,835.9
2010 2011 2012 2013 2014 2015 9M16
1,096.9
IPI Effect
5,408.2
Annualized
Fleet Rental
14
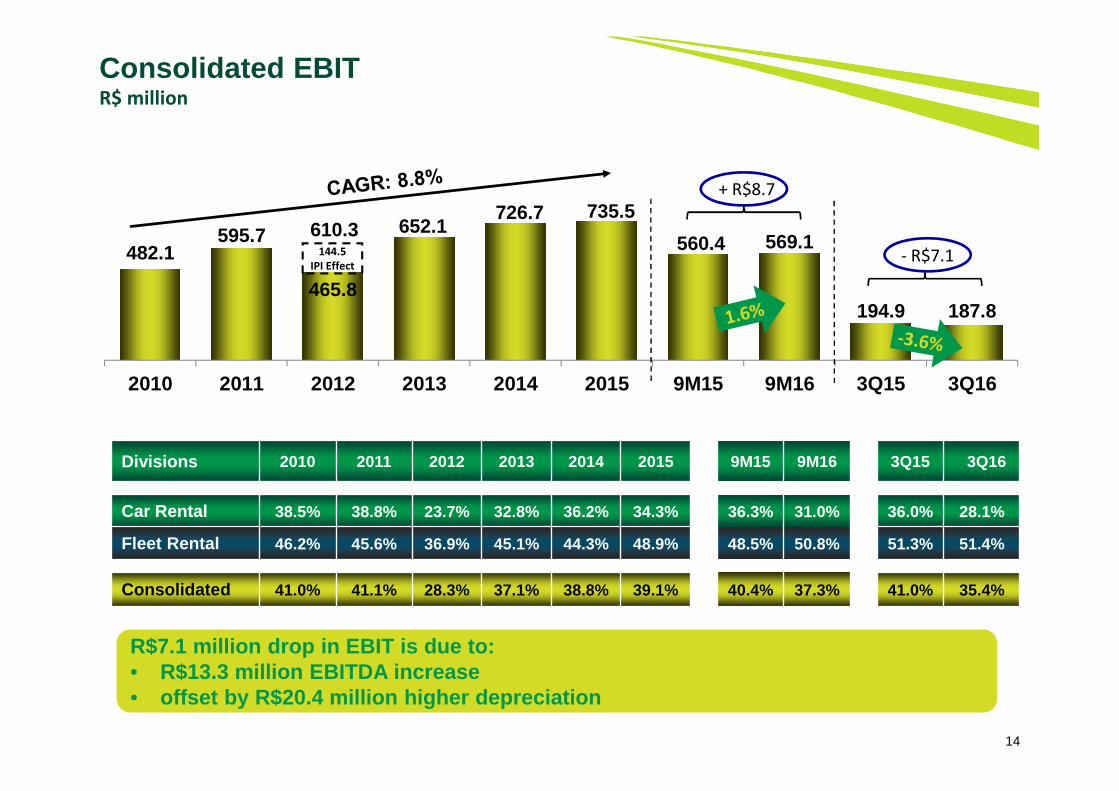
Consolidated EBIT R$ million
Divisions 2010 2011 2012 2013 2014 2015 9M15 9M16 3Q15 3Q16
Car Rental 38.5% 38.8% 23.7% 32.8% 36.2% 34.3% 36.3% 31.0% 36.0% 28.1%
Fleet Rental 46.2% 45.6% 36.9% 45.1% 44.3% 48.9% 48.5% 50.8% 51.3% 51.4%
Consolidated 41.0% 41.1% 28.3% 37.1% 38.8% 39.1% 40.4% 37.3% 41.0% 35.4%
R$7.1 million drop in EBIT is due to:• R$13.3 million EBITDA increase• offset by R$20.4 million higher depreciation
482.1595.7
465.8
652.1726.7 735.5
560.4 569.1
194.9 187.8
2010 2011 2012 2013 2014 2015 9M15 9M16 3Q15 3Q16
144.5
IPI Effect
610.3
+ R$8.7
- R$7.1
15
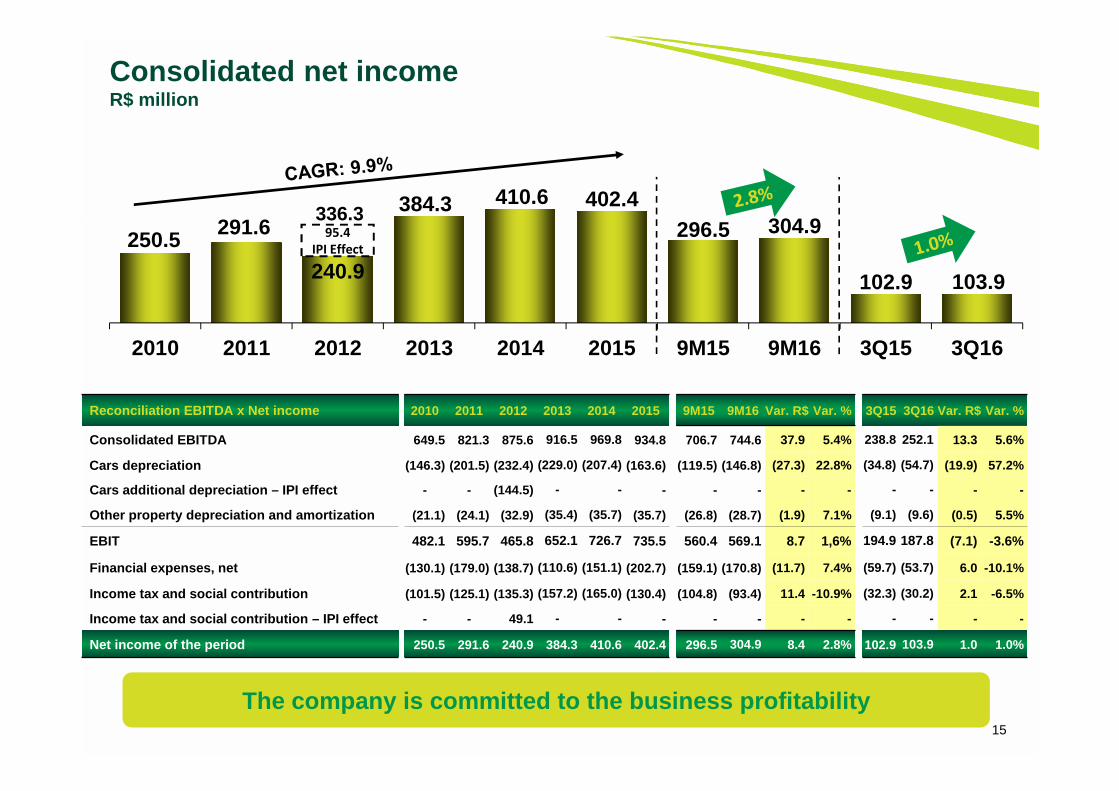
Consolidated net incomeR$ million
The company is committed to the business profitabil ity
250.5291.6
240.9
384.3 410.6 402.4296.5 304.9
102.9 103.9
2010 2011 2012 2013 2014 2015 9M15 9M16 3Q15 3Q16
336.395.4
IPI Effect
Reconciliation EBITDA x Net income 2010 2011 2012 2013 2014 2015 9M15 9M16 Var. R$ Var. % 3Q15 3Q16 Var. R$ Var. %
Consolidated EBITDA 649.5 821.3 875.6 916.5 969.8 934.8 706.7 744.6 37.9 5.4% 238.8 252.1 13.3 5.6%
Cars depreciation (146.3) (201.5) (232.4) (229.0) (207.4) (163.6) (119.5) (146.8) (27.3) 22.8% (34.8) (54.7) (19.9) 57.2%
Cars additional depreciation – IPI effect - - (144.5) - - - - - - - - - - -
Other property depreciation and amortization (21.1) (24.1) (32.9) (35.4) (35.7) (35.7) (26.8) (28.7) (1.9) 7.1% (9.1) (9.6) (0.5) 5.5%
EBIT 482.1 595.7 465.8 652.1 726.7 735.5 560.4 569.1 8.7 1,6% 194.9 187.8 (7.1) -3.6%
Financial expenses, net (130.1) (179.0) (138.7) (110.6) (151.1) (202.7) (159.1) (170.8) (11.7) 7.4% (59.7) (53.7) 6.0 -10.1%
Income tax and social contribution (101.5) (125.1) (135.3) (157.2) (165.0) (130.4) (104.8) (93.4) 11.4 -10.9% (32.3) (30.2) 2.1 -6.5%
Income tax and social contribution – IPI effect - - 49.1 - - - - - - - - - - -
Net income of the period 250.5 291.6 240.9 384.3 410.6 402.4 296.5 304.9 8.4 2.8% 102.9 103.9 1.0 1.0%
16
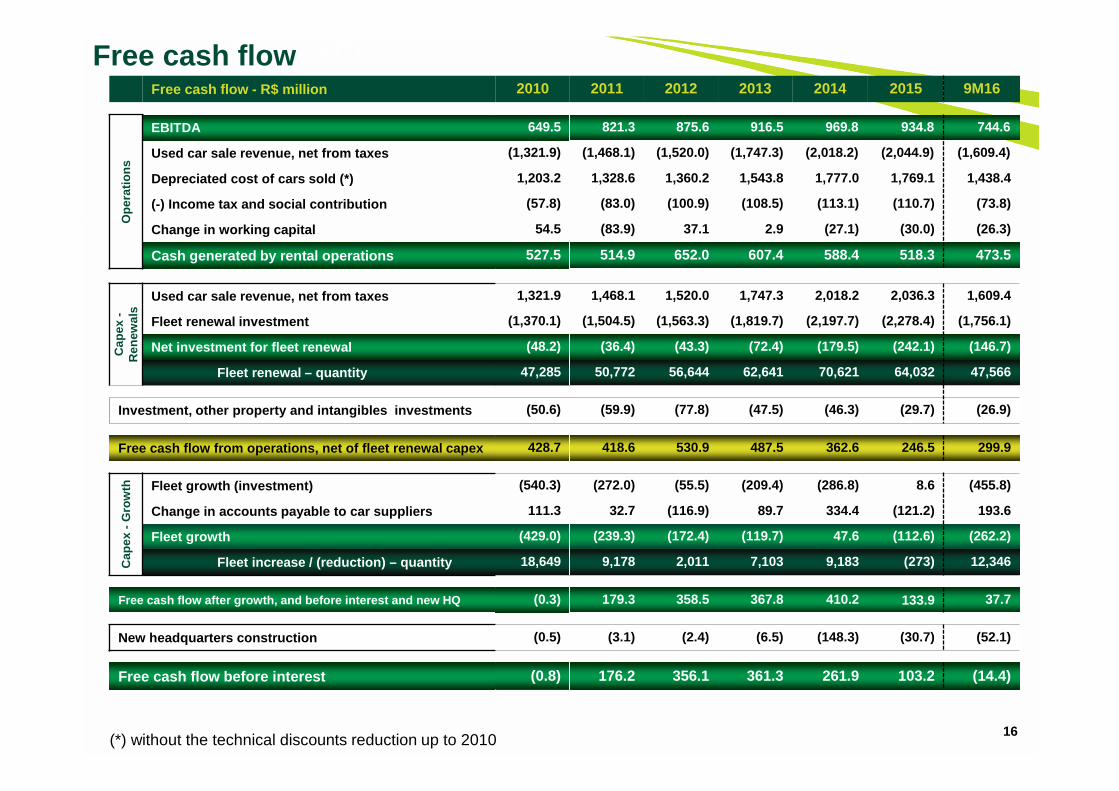
Free cash flow - FCFFree cash flow - R$ million 2010 2011 2012 2013 2014 2015 9M16
w
Ope
ratio
nsEBITDA 649.5 821.3 875.6 916.5 969.8 934.8 744.6
Used car sale revenue, net from taxes (1,321.9) (1,468.1) (1,520.0) (1,747.3) (2,018.2) (2,044.9) (1,609.4)
Depreciated cost of cars sold (*) 1,203.2 1,328.6 1,360.2 1,543.8 1,777.0 1,769.1 1,438.4
(-) Income tax and social contribution (57.8) (83.0) (100.9) (108.5) (113.1) (110.7) (73.8)
Change in working capital 54.5 (83.9) 37.1 2.9 (27.1) (30.0) (26.3)
Cash generated by rental operations 527.5 514.9 652.0 607.4 588.4 518.3 473.5
Cap
ex -
Ren
ewal
s
Used car sale revenue, net from taxes 1,321.9 1,468.1 1,520.0 1,747.3 2,018.2 2,036.3 1,609.4
Fleet renewal investment (1,370.1) (1,504.5) (1,563.3) (1,819.7) (2,197.7) (2,278.4) (1,756.1)
Net investment for fleet renewal (48.2) (36.4) (43.3) (72.4) (179.5) (242.1) (146.7)
Fleet renewal – quantity 47,285 50,772 56,644 62,641 70,621 64,032 47,566
Investment, other property and intangibles investm ents (50.6) (59.9) (77.8) (47.5) (46.3) (29.7) (26.9)
Free cash flow from operations, net of fleet renewa l capex 428.7 418.6 530.9 487.5 362.6 246.5 299.9
Cap
ex -
Gro
wth Fleet growth (investment) (540.3) (272.0) (55.5) (209.4) (286.8) 8.6 (455.8)
Change in accounts payable to car suppliers 111.3 32.7 (116.9) 89.7 334.4 (121.2) 193.6
Fleet growth (429.0) (239.3) (172.4) (119.7) 47.6 (112.6) (262.2)
Fleet increase / (reduction) – quantity 18,649 9,178 2,011 7,103 9,183 (273) 12,346
Free cash flow after growth, and before interest an d new HQ (0.3) 179.3 358.5 367.8 410.2 133.9 37.7
New headquarters construction (0.5) (3.1) (2.4) (6.5) (148.3) (30.7) (52.1)
Free cash flow before interest (0.8) 176.2 356.1 361.3 261.9 103.2 (14.4)
Free cash flow
(*) without the technical discounts reduction up to 2010
17
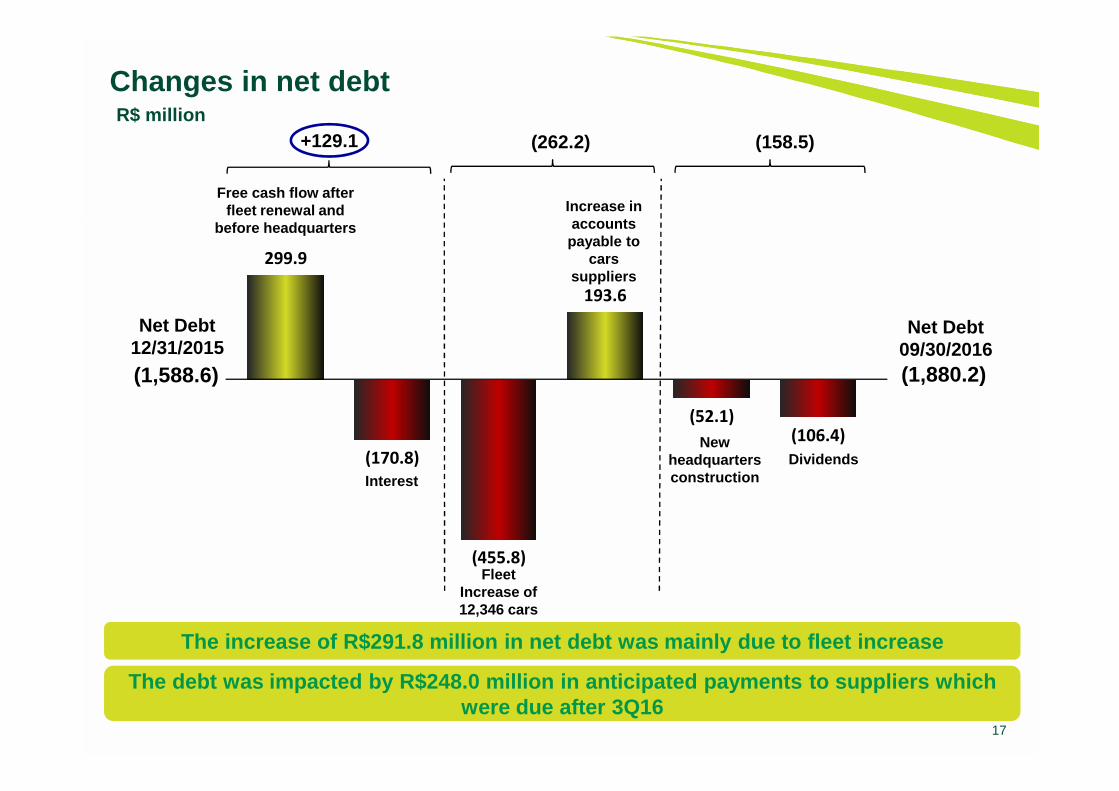
Changes in net debt R$ million
The increase of R$291.8 million in net debt was mai nly due to fleet increase
299.9
(170.8)
(455.8)
193.6
(52.1)(106.4)
(1,880.2)
Net Debt09/30/2016
(1,588.6)
Net Debt12/31/2015
Free cash flow after fleet renewal and
before headquarters
Interest
Fleet Increase of 12,346 cars
Increase in accounts
payable to cars
suppliers
New headquarters construction
Dividends
+129.1 (262.2) (158.5)
The debt was impacted by R$248.0 million in anticip ated payments to suppliers which were due after 3Q16
18
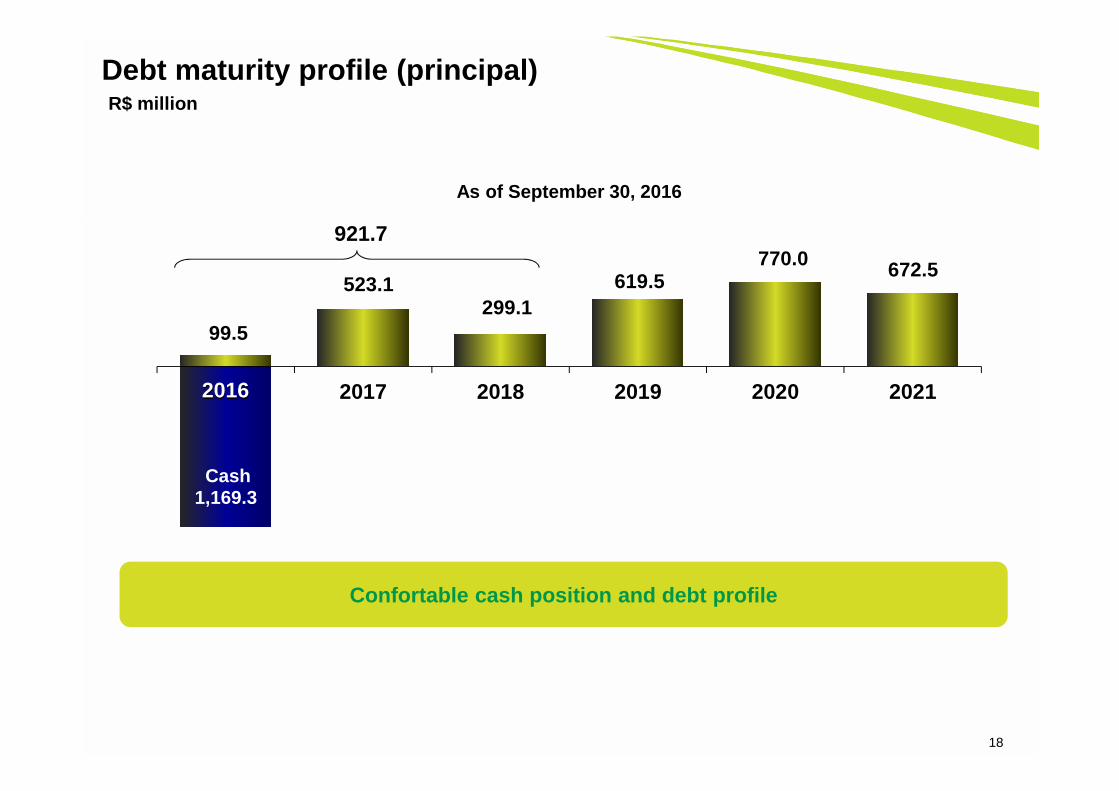
Debt maturity profile (principal)R$ million
Confortable cash position and debt profile
As of September 30, 2016
99.5
523.1 299.1
619.5 770.0 672.5
2016 2017 2018 2019 2020 2021
Cash1,169.3
2016
921.7
19
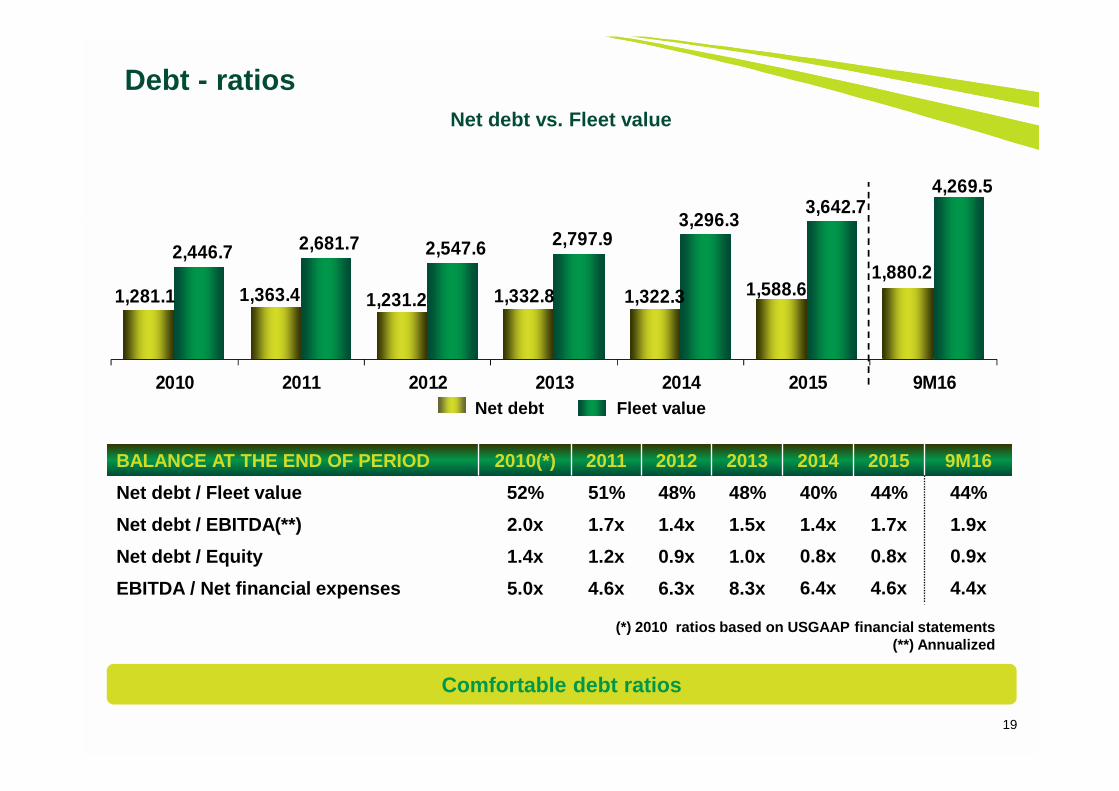
Debt - ratiosNet debt vs. Fleet value
BALANCE AT THE END OF PERIOD 2010(*) 2011 2012 2013 2014 2015 9M16
Net debt / Fleet value 52% 51% 48% 48% 40% 44% 44%
Net debt / EBITDA(**) 2.0x 1.7x 1.4x 1.5x 1.4x 1.7x 1.9x
Net debt / Equity 1.4x 1.2x 0.9x 1.0x 0.8x 0.8x 0.9x
EBITDA / Net financial expenses 5.0x 4.6x 6.3x 8.3x 6.4x 4.6x 4.4x
(*) 2010 ratios based on USGAAP financial statemen ts(**) Annualized
Net debt Fleet value
Comfortable debt ratios
1,281.1 1,363.4 1,231.2 1,332.8 1,322.3 1,588.6 1,880.2
2,446.7 2,681.7 2,547.6 2,797.9 3,296.3
3,642.7 4,269.5
2010 2011 2012 2013 2014 2015 9M16
20
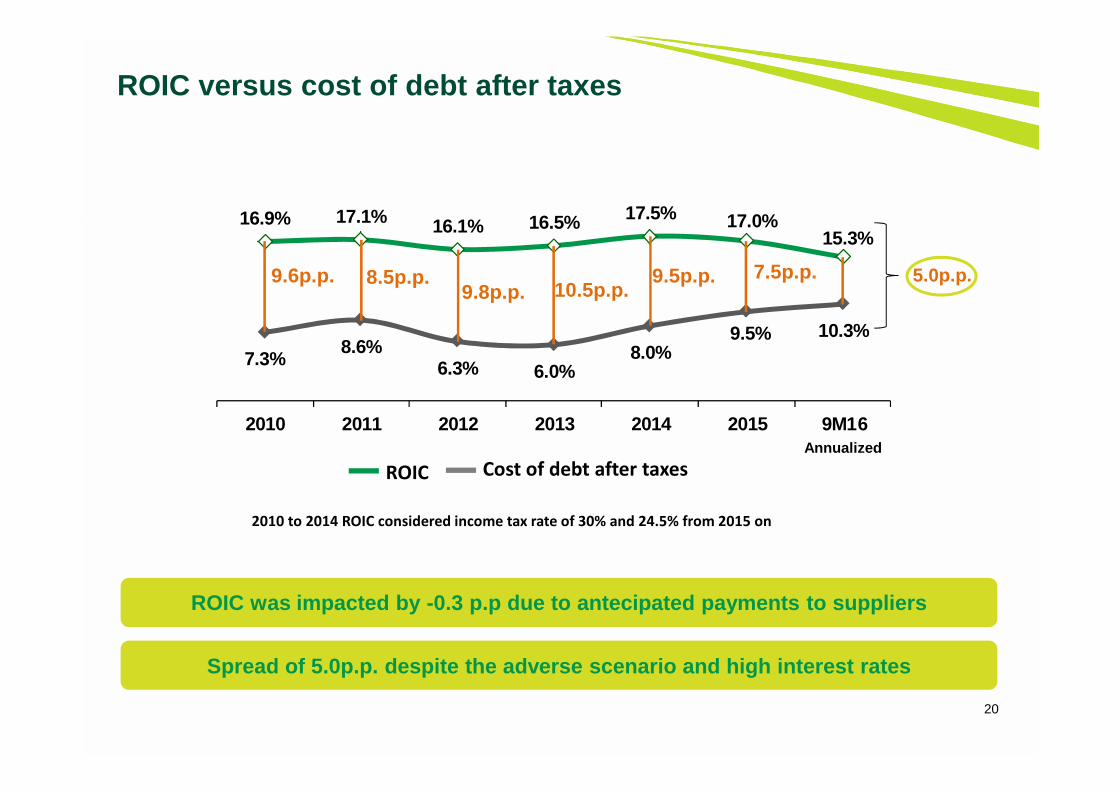
ROIC versus cost of debt after taxes
ROIC was impacted by -0.3 p.p due to antecipated paym ents to suppliers
7.3%8.6%
6.3% 6.0%8.0%
9.5% 10.3%
16.9% 17.1% 16.1% 16.5% 17.5% 17.0%15.3%
2010 2011 2012 2013 2014 2015 9M16
9.6p.p. 8.5p.p. 9.5p.p.9.8p.p. 10.5p.p.
7.5p.p. 5.0p.p.
2010 to 2014 ROIC considered income tax rate of 30% and 24.5% from 2015 on
Annualized
ROIC Cost of debt after taxes
Spread of 5.0p.p. despite the adverse scenario and h igh interest rates
Thank You!
The material presented is a presentation of general backgro und information about LOCALIZA as of the date of the presenta tion. It is information in summaryform and does not purport to be complete. It is not intended to be relied upon as advice to potential investors. No represen tation or warranty, express orimplied, is made concerning, and no reliance should be place d on, the accuracy, fairness, or completeness of the informa tion presented herein.
This presentation contains statements that are forward-lo oking within the meaning of Section 27A of the Securities Act of 1933 and Section 21E of theSecurities Exchange Act of 1934. Such forward-looking stat ements are only projections and are not guarantees of future performance. Investors are cautionedthat any such forward-looking statements are and will be, as the case may be, subject to many risks, uncertainties and fac tors relating to the operations andbusiness environments of LOCALIZA and its subsidiaries tha t may cause the actual results of the companies to be material ly different from any future resultsexpressed or implied in such forward-looking statements.
Although LOCALIZA believes that the expectations and assum ptions reflected in the forward-looking statements are rea sonable based on informationcurrently available to LOCALIZA’s management, LOCALIZA ca nnot guarantee future results or events. LOCALIZA expressl y disclaims a duty to update any ofthe forward-looking statement.
Securities may not be offered or sold in the United States unl ess they are registered or exempt from registration under th e Securities Act of 1933.
This presentation does not constitute an offer, invitation or solicitation of an offer to subscribe to or purchase any securities. Neither this presentation nor anythingcontained herein shall form the basis of any contract or commitment whatsoever.
www.localiza.com/ri
Email: [email protected]
Tel: 55 31 3247-7024
Disclaimer