Embed Size (px)
Citation preview
UAL Corporation2001 Annual Report
3 3 3 3 3 3 3 3 3 3 3
UAL #30899 Assm: TF
541 541#2
30899_Cvr 3/22/02 6:12 PM Page 1
TABLE OF CONTENTS
Selected Financial Data 1
Chairman’s Letter 2-3
Aircraft Fleet 4
Description of Business 5-7
Management’s Discussion and Analysis 8-19
UAL Corporation’s Consolidated Financial Statements 20-24
Notes to Consolidated Financial Statements 25-44
Management’s Letter 45
Report of Independent Public Accountants 45
Directors and Officers 46-47
Stockholder Information 48
3 3 3 3 3 3 3 3 3 3 3 K
UAL #30899 Assm: TF30899_Cvr 3/22/02 6:12 PM Page 2
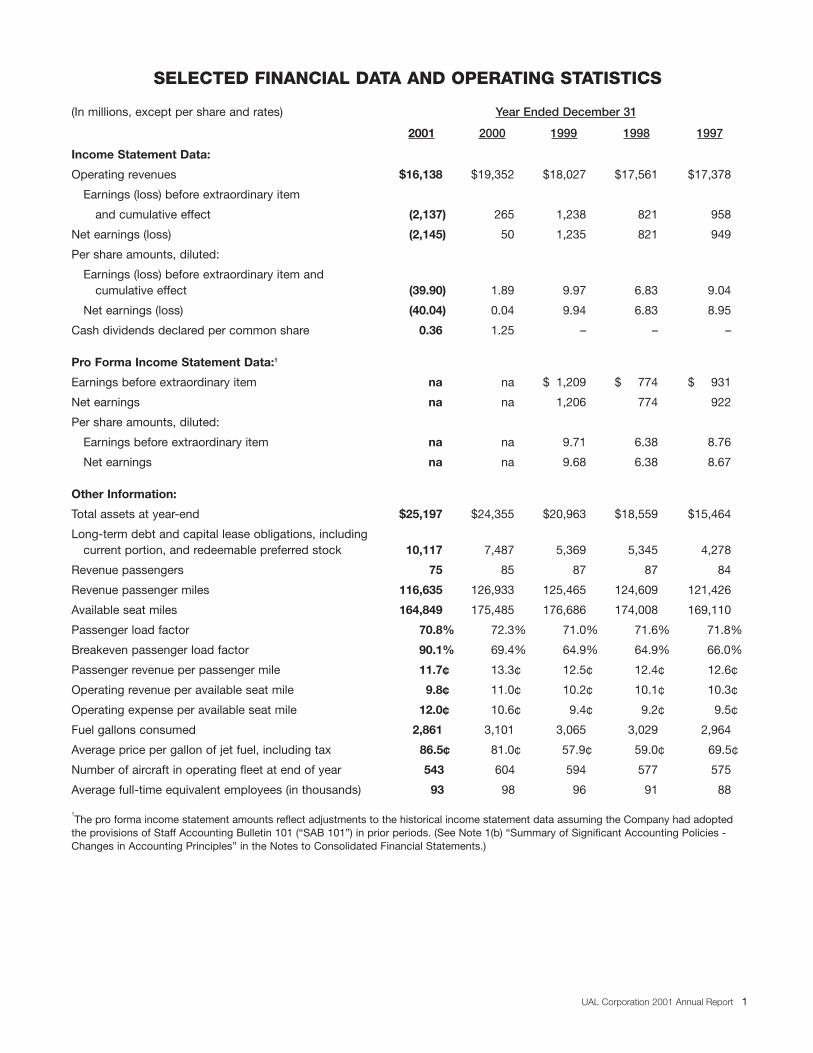
SELECTED FINANCIAL DATA AND OPERATING STATISTICS
(In millions, except per share and rates) Year Ended December 31
2001 2000 1999 1998 1997
Income Statement Data:
Operating revenues $16,138 $19,352 $18,027 $17,561 $17,378
Earnings (loss) before extraordinary item
and cumulative effect (2,137) 265 1,238 821 958
Net earnings (loss) (2,145) 50 1,235 821 949
Per share amounts, diluted:
Earnings (loss) before extraordinary item and cumulative effect (39.90) 1.89 9.97 6.83 9.04
Net earnings (loss) (40.04) 0.04 9.94 6.83 8.95
Cash dividends declared per common share 0.36 1.25 – – –
Pro Forma Income Statement Data:1
Earnings before extraordinary item na na $ 1,209 $ 774 $ 931
Net earnings na na 1,206 774 922
Per share amounts, diluted:
Earnings before extraordinary item na na 9.71 6.38 8.76
Net earnings na na 9.68 6.38 8.67
Other Information:
Total assets at year-end $25,197 $24,355 $20,963 $18,559 $15,464
Long-term debt and capital lease obligations, including current portion, and redeemable preferred stock 10,117 7,487 5,369 5,345 4,278
Revenue passengers 75 85 87 87 84
Revenue passenger miles 116,635 126,933 125,465 124,609 121,426
Available seat miles 164,849 175,485 176,686 174,008 169,110
Passenger load factor 70.8% 72.3% 71.0% 71.6% 71.8%
Breakeven passenger load factor 90.1% 69.4% 64.9% 64.9% 66.0%
Passenger revenue per passenger mile 11.7¢ 13.3¢ 12.5¢ 12.4¢ 12.6¢
Operating revenue per available seat mile 9.8¢ 11.0¢ 10.2¢ 10.1¢ 10.3¢
Operating expense per available seat mile 12.0¢ 10.6¢ 9.4¢ 9.2¢ 9.5¢
Fuel gallons consumed 2,861 3,101 3,065 3,029 2,964
Average price per gallon of jet fuel, including tax 86.5¢ 81.0¢ 57.9¢ 59.0¢ 69.5¢
Number of aircraft in operating fleet at end of year 543 604 594 577 575
Average full-time equivalent employees (in thousands) 93 98 96 91 88
1The pro forma income statement amounts reflect adjustments to the historical income statement data assuming the Company had adoptedthe provisions of Staff Accounting Bulletin 101 (“SAB 101”) in prior periods. (See Note 1(b) “Summary of Significant Accounting Policies -Changes in Accounting Principles” in the Notes to Consolidated Financial Statements.)
UAL Corporation 2001 Annual Report 1
KS
PO
TS
PO
TU
AL
#30
899
Ass
m:
NS
30899_Body 3/22/02 6:16 PM Page 1
Dear Stockholders:
The tragic events of September 11, 2001, had a devastating impact on the world as we know itand on United Airlines in particular. We continue to mourn the loss of our employees and passen-gers who were on board United Airlines’ Flights 93 and 175, as well as the many other victims ofthe day’s tragedies – and we continue to hold their families and loved ones close in our hearts.
It takes an incredibly resilient organization to survive the loss of 18 of its employees and 93 of itscustomers, the use of its property as instruments of terror and the resulting disruption of its oper-ations. In my short tenure as United’s chairman and chief executive officer, I’ve observed a level ofresilience among our employees that I’ve frankly not encountered anywhere else during my career.I’ve witnessed not only the strength of our employees’ commitment, but the warmth with whichthey display it to our customers and each other. That heartfelt dedication, that resiliency, that steelydetermination to overcome all obstacles, is what makes me confident that we can rebuild thiscompany and live up to the promise of our 75-year history.
Even prior to the events of September 11, United faced significant challenges in 2001. We took anumber of aggressive actions to bolster our financial condition throughout the year, including cuttingour spending across the board. When the terrorist attacks exacerbated our company’s already-difficult economic situation, we undertook the largest schedule reduction and employee furlough inour company’s history. These moves enabled us to weather the worst of the blows and positionedus for survival, but there is still a long way to go for us to return to financial stability.
As previously reported, UAL Corporation’s losses for 2001 totaled $2.1 billion, including special itemsexplained in the detailed financial statements that accompany this letter – for a loss of $40.04 perbasic share. Our losses excluding special items totaled $1.8 billion, or a loss per basic share of $33.23.Our passenger revenues for the quarter were down 39 percent year-over-year, but our expenseswere down 23 percent year-over-year as a result of our immediate cost-cutting initiatives.
As we move forward, we will leave no stone unturned as we look for ways to further reduce ourcosts. We will continue to move aggressively on all fronts to ensure that all our costs, including labor,remain in line with our revenues. We have actively engaged our employees and their union repre-sentatives in discussions about ways to improve our finances and restore our profitability. We haveasked for their help in finding creative solutions to the economic challenges we face and are con-fident they will rise to this occasion as they have all others.
While we endeavor to pare costs wherever we can, we will be doing so in the context of other priorities:
• We will continue to focus on strengthening our revenues, seizing upon every opportunityto bolster United’s sales, income and profits in order to restore our financial stability.
• We will continue to serve as a leader in safety and security. I am extremely proud ofUnited’s ability to consistently lead the industry in security innovations.
• We will continue to operate reliably and dependably. We witnessed dramatic improve-ments here during the 2001 holiday season, traditionally one of the toughest times ofthe year to deliver a solid operational performance.
• We will continue to identify ways to provide customers with the products and servicethey expect within the new operating environment.
2 UAL Corporation 2001 Annual Report
KS
PO
TS
PO
TU
AL #30899 A
ssm:
NS
30899_Body 3/22/02 6:16 PM Page 2
3
There is no question that our industry changed dramatically following September’s terrorist attacks.But let me close this letter with a true story that I believe illustrates our potential. I was on a Unitedflight last year where one of the cabin crew told the customers that I was on board. Afterwards,several customers came up to let me know they were behind us and wanted us to succeed.“United is my airline,” one note read, “and I really want you guys to pull through.”
It reminded me that many of our customers look at United as being their airline, just as we do. It isa very personal connection, one we can never afford to forget – and we won’t. We want to pullthrough, too. And we will.
I am confident that United's employees will respond to our economic challenges with courage,energy, determination, innovation, warmth and commitment – and I’m proud and humbled to countmyself as one of them.
John W. Creighton
March 8, 2002
UAL Corporation 2001 Annual Report
KS
PO
TS
PO
TU
AL
#30
899
Ass
m:
NS
30899_Body 3/22/02 6:16 PM Page 3
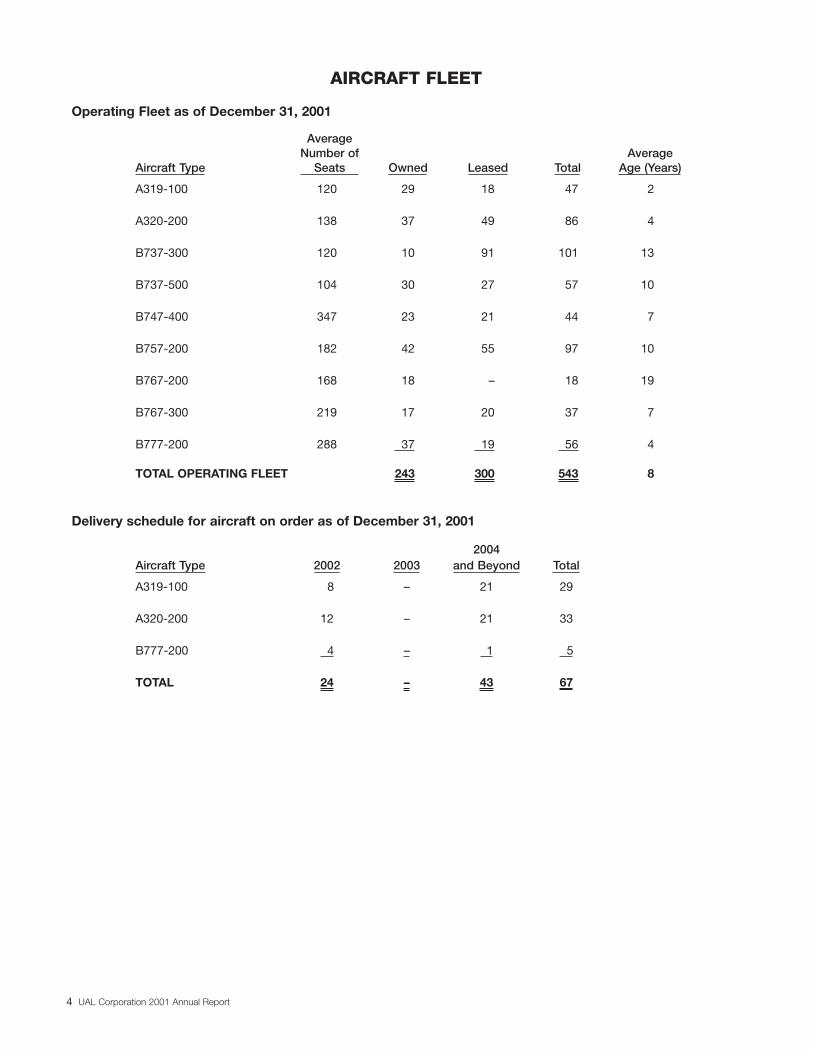
AIRCRAFT FLEET
Operating Fleet as of December 31, 2001
AverageNumber of Average
Aircraft Type Seats Owned Leased Total Age (Years)
A319-100 120 29 18 47 2
A320-200 138 37 49 86 4
B737-300 120 10 91 101 13
B737-500 104 30 27 57 10
B747-400 347 23 21 44 7
B757-200 182 42 55 97 10
B767-200 168 18 – 18 19
B767-300 219 17 20 37 7
B777-200 288 37 19 56 4
TOTAL OPERATING FLEET 243 300 543 8
Delivery schedule for aircraft on order as of December 31, 2001
2004Aircraft Type 2002 2003 and Beyond Total
A319-100 8 – 21 29
A320-200 12 – 21 33
B777-200 4 – 1 5
TOTAL 24 – 43 67
4 UAL Corporation 2001 Annual Report
KS
PO
TS
PO
TU
AL #30899 A
ssm:
NS
30899_Body 3/22/02 6:16 PM Page 4
5
DESCRIPTION OF BUSINESSUAL Corporation (“UAL” or the “Company”) is a holding company, whose principal subsidiary is United AirLines, Inc. (“United”), which is wholly owned. United accounted for most of the Company's revenues andexpenses in 2001. United is a major commercial air transportation company, engaged in the transportation ofpersons, property and mail throughout the U.S. and abroad.
Airline Operations
During 2001, United carried, on average, more than 210,000 passengers per day and flew more than 108 billionrevenue passenger miles. United’s network, supplemented with strategic airline alliances, provides comprehen-sive transportation service within its North America segment and to international destinations within its Pacific,Atlantic and Latin America segments. Operating revenues attributed to United’s North America segment were$10.7 billion in 2001, $13.1 billion in 2000 and $12.5 billion in 1999. Operating revenues attributed to United’sinternational segments were $5.4 billion in 2001, $6.2 billion in 2000 and $5.5 billion in 1999.
North America. United operates hubs in Chicago, Denver, Los Angeles, San Francisco and Washington-Dulles.United’s North America operations accounted for 66.3% of United’s revenues in 2001.
Pacific. Via its Tokyo hub, United provides passenger service between its U.S. gateway cities (Chicago,Honolulu, Los Angeles, New York, San Francisco and Seattle) and the Asian cities of Bangkok, Beijing, HongKong, Seoul and Singapore. United also provides nonstop service between Hong Kong and each of Chicagoand San Francisco; between San Francisco and each of Osaka, Shanghai, Sydney and Taipei; between LosAngeles and each of Auckland and Sydney; between Chicago and Beijing; and between Sydney and each ofAuckland and Melbourne.
In August 2001, United cancelled nonstop service between Hong Kong and New York.
The air services agreement between the U.S. and Japan provides an unlimited number of frequencies to certaincarriers, including United. United also holds significant traffic rights from beyond Japan. These rights and the2002 opening of Tokyo’s Narita airport’s second runway will provide United with the opportunity to add servicefrom Japan to other Asian points as regulatory, competitive and economic conditions warrant.
United’s Pacific operations accounted for 16.6% of United’s operating revenues in 2001.
Atlantic. Washington-Dulles is United’s primary gateway to Europe, serving Amsterdam, Brussels, Dusseldorf,Frankfurt, London, Milan, Munich and Paris. Chicago is United’s secondary gateway to Europe, with nonstopservice to Dusseldorf, Frankfurt, London and Paris. Although United currently offers direct service betweenChicago and Dusseldorf, service will be discontinued and transitioned to its daily nonstop service betweenWashington-Dulles and Dusseldorf. United also provides nonstop service between London and each of Boston,Los Angeles, Newark, New York and San Francisco; between Frankfurt and San Francisco; and between Parisand San Francisco.
In 2001, United’s Atlantic operations accounted for 12.9% of United’s operating revenues.
Latin America. United’s primary gateway to Latin America is Miami, providing service from Miami to BuenosAires, Caracas, Montevideo (one-stop), Rio de Janeiro, Santiago and Sao Paulo. United also provides servicebetween Mexico City and each of Chicago, Los Angeles, San Francisco, Washington, and San Jose (CostaRica); between Los Angeles and each of Guatemala City and San Salvador; between Chicago and each ofAruba, San Juan, St. Thomas, and Sao Paulo; between New York and each of Buenos Aires and San Juan;between Washington and each of San Juan and St. Thomas; and between Guatemala City and San Jose.United intends to suspend its direct service between Chicago and Buenos Aires, effective March 5, 2002.
In 2001, United’s Latin America operations accounted for 4.2% of United’s revenues.
United Cargo®. United Cargo offers both domestic and international shipping through its Small PackageDelivery, T.D. GuaranteedSM, First Freight, International Freight, UA-2Day® service, and a door-to-door small package delivery service – United SameDaySM. Freight accounts for most of United Cargo’s shipments, with mail making up the balance.
For the year 2001, United Cargo generated over $700 million in freight and mail revenue, which represents a
UAL Corporation 2001 Annual Report
KS
PO
TS
PO
TU
AL
#30
899
Ass
m:
NS
30899_Body 3/22/02 6:16 PM Page 5
6
24% decrease versus 2000, driven mainly by the discontinuation of the dedicated freighter operation, the soft-ening economy and the impact of September 11. Following the events of September 11, traffic graduallyimproved, but volumes remained below pre-September 11 levels in part due to restrictions imposed by theFederal Aviation Administration (“FAA”) on passenger carriers transporting mail over sixteen ounces.
United Cargo opened new warehouse facilities in Miami and Newark in 2001, and a new facility in Chicago inJanuary 2002. United Cargo also opened a new facility in Los Angeles on February 11, 2002.
United Cargo’s premium international time-definite service, T.D. Guaranteed, was recently expanded to offerservice in United’s widebody domestic markets within the U.S. United believes this added widebody capacity,combined with the stabilization of United Cargo’s recurring customer traffic and revenue initiatives, should leadto a more stable revenue environment in 2002.
In February 2002, United Cargo introduced United SameDay PlusSM, which offers door-to-door delivery of heavy freight.
Marketing Strategy
Besides offering convenient scheduling throughout its domestic and international segments, United seeks toattract high-yield customers and create customer preference by providing a comprehensive network, an attrac-tive frequent-flyer program and enhanced product and service offerings.
Alliances. United has formed bilateral alliances with other airlines to provide its customers more choices and to participate worldwide in markets that it cannot serve directly for commercial or governmental reasons. Analliance is a collaborative marketing arrangement between carriers, which can include joint frequent flyer partici-pation; code-sharing of flight operations; coordination of reservations, baggage handling and flight schedules;and other resource-sharing activities. “Code-sharing” is an agreement under which a carrier’s flights can bemarketed under the two-letter airline designator code of another carrier. Through an alliance, carriers can pro-vide their customers a seamless global travel network under their own airline code. United now participates in a multilateral alliance, Star AllianceTM.
Star Alliance is a global integrated airline network, whose mission is to deliver a smooth travel experience andoffer rewards and recognition to passengers traveling across its global network. Collectively, based on first quarter2002 scheduling, Star Alliance carriers serve more than 727 destinations in over 127 countries with 11,033 dailyflights. This puts Star Alliance ahead of the closest competition, oneworld, with 550 destinations. Star Allianceenables its member carriers to more effectively compete with other worldwide alliances. Founded in 1997, StarAlliance has grown to 15 carriers. Besides United, Star Alliance includes: Air Canada, Air New Zealand, All NipponAirways, Ansett Australia, Austrian Airlines, bmi british midland, Lauda Air, Lufthansa, Mexicana, SAS, SingaporeAirways, Thai International Airways, Tyrolean and Varig. United currently holds bilateral immunity with Air Canadaand integrated antitrust immunity with Lufthansa, SAS, and the Austrian Airlines Group. United is currently pur-suing the addition of bmi british midland to its existing antitrust immunity with Lufthansa, SAS and AustrianAirlines Group.
Ansett Australia ceased operations in September 2001. In March 2002, the Management Conference Board ofthe Star Alliance recommended to the Chief Executives Board of the Star Alliance to remove Ansett Australiafrom the Alliance. The Chief Executives Board is expected to act on the recommendation by mid-March.
United has also formed independent alliances with other air carriers. Currently, United has agreements withAloha, BWIA West Indies Airways, Continental Connection (operated by Gulfstream), Emirates, Saudi ArabianAirlines and Spanair Airlines. United continually evaluates the need for relationships with these and other carriersand from time to time will change its alliance partners as conditions warrant.
In addition, United has a marketing program in North America known as United Express®, under which independent regional carriers, utilizing turboprop equipment and regional jets, feed United’s major airports and international gateways. The carriers in the United Express program serve small and medium-sized cities in the U.S., linking those cities to United’s hubs. United Express carriers include Air Wisconsin Airlines, AtlanticCoast Airlines and Sky West Airlines.
United also has a code-share agreement with Great Lakes Aviation, a regional carrier.
UAL Corporation 2001 Annual Report
KS
PO
TS
PO
TU
AL #30899 A
ssm:
NS
30899_Body 3/22/02 6:16 PM Page 6
7
UAL Loyalty Services, Inc. In December 2001, UAL renamed United New Ventures, Inc., its wholly owned subsidiary, as UAL Loyalty Services, Inc. (“ULS”). ULS focuses on expanding the profitable non-core marketingbusinesses of UAL and building customer loyalty for United. ULS operates in four areas: loyalty programs, traveldistribution, direct-to-consumer services and media assets.
ULS operates substantially all United-branded travel distribution and customer loyalty e-commerce activities,such as united.com. It also owns and manages all of UAL’s interests in various e-commerce enterprises, suchas Orbitz and Hotwire (see Note 6 “Investments” in the Notes to Consolidated Financial Statements). In addition,as of January 1, 2002, ULS operates United’s Mileage Plus® frequent flyer program; United Vacations®, United’sleisure vacation product; Silver Wings PlusSM, a discounted travel program for individuals 55 and older;Cruise4MilesSM, a program offering Mileage Plus miles for purchases of cruises; and the Premier Group, a busi-ness-meeting planner. In the first quarter of 2002, the Company intends to complete the transfer of ownership ofthese assets to ULS.
Although ULS is responsible for member relationships, communications, and account management of MileagePlus, United continues to be responsible for the elite frequent flyer aspects of the program, including thePremier®, Premier Executive® and 1K® programs. United also retains responsibility for managing the relationshipwith Mileage Plus’ airline partners. Mileage Plus’ relationships with non-airline business partners are the soleresponsibility of ULS.
In July 2001, ULS completed a tender offer for all of the outstanding stock of MyPoints.com, which is now awholly owned subsidiary of ULS. MyPoints operates an on-line loyalty program under which registered con-sumers earn points by purchasing goods or services through the MyPoints.com web site from participating vendors. The consumer can then redeem the points through the web site for goods or services of participatingvendors. See Note 7 “Acquisitions” in the Notes to Consolidated Financial Statements.
Mileage Plus. Mileage Plus was created to develop and retain passenger loyalty by offering awards and ser-vices to frequent travelers. Over 40 million members have enrolled in Mileage Plus since it was started in 1981.Mileage Plus members earn mileage credit for flights on United, United Express, the Star Alliance carriers andcertain other airlines that participate in the program. Miles can also be earned by utilizing the goods and ser-vices of non-airline program participants, such as hotels, car rental companies, bank credit card issuers and avariety of other businesses. Mileage credits can be redeemed for free, discounted or upgrade travel and non-travel awards.
Travel awards can be redeemed at the “Standard” or “Saver” level for any unsold seat on any United flight toevery destination served by United. Redemption at the “Saver” award level, however, is restricted with capacitycontrolled inventory, thereby limiting the use of Saver awards on certain flights.
Economy Plus®. During 2001, United began reconfiguring its fleet of three-cabin international aircraft to createEconomy Plus seating, which is a reconfiguration of the first six to eleven rows of the United Economy® cabinson aircraft serving the North America market. This reconfigured area provides four to five additional inches oflegroom for United’s Premier frequent-flyers and full-fare United Economy customers, many of whom often travel in the United Economy cabin. United became the first U.S. airline to offer premium seating in the front of its economy cabin on both its North America and international flights. As part of this international reconfigu-ration program, United also is enhancing United Business® class to offer customers an additional seven inchesof legroom.
Distribution Channels. The overwhelming majority of United’s airline inventory continues to be distributedthrough the traditional channels of travel agencies and global distribution systems (“GDS”). On October 1, 2001,United completed the sale of its approximately 18% equity interest in Galileo International to Cendant Corporation.The completion of this transaction relieves United of GDS participation obligations mandated by the Departmentof Transportation. This allows United the flexibility to select the GDS systems in which it wishes to participate aswell as to determine the level of participation in each system. United uses the Apollo reservation system, whichis hosted by Galileo International. The hosting agreement with Galileo continues through 2004.
UAL Corporation 2001 Annual Report
KS
PO
TS
PO
TU
AL
#30
899
Ass
m:
NS
30899_Body 3/22/02 6:16 PM Page 7
8 UAL Corporation 2001 Annual Report
MANAGEMENT’S DISCUSSION AND ANALYSIS OF FINANCIAL CONDITION AND RESULTS OF OPERATIONS
This section contains various forward-looking statements within the meaning of Section 27A of the Securities Act of 1933,as amended, and Section 21E of the Securities Exchange Act of 1934, as amended, which are identified with an asterisk(*). Forward-looking statements represent the Company’s expectations and beliefs concerning future events, based oninformation available to the Company as of the date of this report. The Company undertakes no obligation to publiclyupdate or revise any forward-looking statements, whether as a result of new information, future events or otherwise.Factors that could significantly impact the expected results referenced in the forward-looking statements are listed in thelast paragraph of the section, “Outlook for 2002.”
September 11 Terrorist Attacks
On September 11, 2001, two United aircraft were hijacked and destroyed in terrorist attacks on The WorldTrade Center in New York City and in a crash near Johnstown, Pennsylvania. On the same day, two AmericanAirlines aircraft were also hijacked and used in terrorist attacks on The World Trade Center and the Pentagon. In addition to the loss of all passengers and crew on board the aircraft, these attacks resulted in numerousdeaths and injuries to persons on the ground and massive property damage. In the immediate aftermath of the attacks, the FAA ordered all aircraft operating in the U.S. grounded immediately. This grounding effectivelylasted for three days, and the Company was able to operate only a portion of its scheduled flights for severaldays thereafter. Passenger traffic and yields on the Company’s flights declined significantly when flights werepermitted to resume, and the Company refunded significant numbers of tickets for the period from September11 to September 25. Since that time, the Company has experienced significantly reduced revenue and negative cash flows as compared to its forecasts made prior to September 11, 2001. Although domestic and internation-al load factors on the Company’s flights are gradually increasing to levels similar to what it experienced prior toSeptember 11 (although on significantly less capacity), yields remain at unusually low levels.
In a direct response to the adverse impact on air travel as a result of the terrorist attacks, United has reduced itscapacity by 23% based on systemwide available seat miles compared to levels prior to September 11. Thisschedule reduction allowed for the retirement of the entire B727-200 and B737-200 fleets, effective November 1,2001. On September 19, United announced that it would furlough approximately 20,000 employees. Additionally,United has converted six stations to United Express and announced the closing of five reservations offices in2002. During the fourth quarter 2001, United restructured its aircraft delivery program with both Boeing andAirbus Industrie to defer deliveries of new aircraft for 2002 and 2003 from the 67 originally planned to 24 aircraft.United will only take delivery of 24 of 49 aircraft scheduled for the year 2002 and none of the 18 aircraft sched-uled for 2003. This action reduced planned capital spending by 50% for 2002 to $1.2 billion. The remaining 43aircraft have been deferred into 2004 and beyond. United’s future schedule will vary as the Company reacts tocontinuing changes in demand and yields, as well as normal factors such as seasonality and fleet composition.
On September 22, 2001, the President signed the Air Transportation Safety and System Stabilization Act (the“Act”). The Act is intended to compensate victims of the terrorist attacks as well as air carriers for lossesincurred as a result of such attacks. Among other things, the Act provides: (1) for the payment of an aggregateof $5 billion to air carriers for losses incurred as a result of the ground stop order issued on September 11 andincremental losses incurred by air carriers through December 31, 2001 as a direct result of the terrorist attacks;(2) that the liability of any air carrier, including United, for all claims arising out of the terrorist attacks will not begreater than the limits of the liability coverage maintained by that carrier; (3) for the issuance of loan guaranteesof up to an aggregate of $10 billion in debt of air carriers; (4) for the authority of the Secretary of Transportationto reimburse air carriers for the increase in insurance premiums for coverage through October 1, 2002 and, atthe discretion of the Secretary of Transportation, to limit the liability of U.S. air carriers for acts of terrorism com-mitted during a 180-day period following the date of the Act; (5) for a compensation program for victims and theirrelatives; (6) for an extension of the due date for payment of excise and payroll taxes by U.S. air carriers; and (7)that communities that had air service prior to September 11 will continue to receive adequate air service.
The Company anticipates that its liability from claims arising from the events of September 11, 2001 will be sig-nificant, after considering the liability protections provided for by the Act; however, the Company expects thatany amounts paid on such claims will be borne by its insurance carriers as claims are resolved and, in any event,the Company believes that, under the Act, its liability will be limited to the amount of its insurance coverage.
KS
PO
TS
PO
TU
AL #30899 A
ssm:
NS
30899_Body 3/22/02 6:16 PM Page 8
9UAL Corporation 2001 Annual Report
United’s war risk liability insurance for losses resulting from war perils (terrorism, sabotage, hijacking and othersimilar perils) was cancelled effective September 26, 2001. United obtained replacement coverage, although itis being charged significantly higher premiums for this replacement coverage, and this new coverage is in asubstantially reduced amount for claims not involving aircraft passengers. The FAA is providing excess liabilitycoverage for third party war risk liability for losses to persons other than passengers up to two times the airline’slimit of liability available prior to September 11, 2001, for renewable periods up to a year at a time. United’s cov-erage under this FAA policy has been renewed through March 20, 2002, and is likely to be renewed further,subject to the federal government’s determination that such coverage is necessary to the national interest.
In addition, United maintains hull war risk insurance which is worldwide, excluding certain countries. This coverage is for war and associated perils, including hijacking and confiscation. United experienced a significantlyhigher premium for reduced coverage due to the events of September 11.
As of December 31, 2001, United had received $652 million in compensation under the Act. This amount isrecorded as non-operating income in the Statements of Consolidated Operations. For further discussion of theimpact of the attacks and the Act on the Company’s financial statements, see Note 2 “Special Charges Relatedto the September 11 Terrorist Attacks” in the Notes to Consolidated Financial Statements.
Results of Operations
Summary of Results -During early 2001, the weakening U.S. economy had a significant impact on the airline industry as corporationsreduced their business travel budgets and changed their travel behavior. During the first six months of the year, the industry experienced a significant revenue decline as a result of the decrease in business traffic, whichimpacted both unit revenues and yields, particularly in the domestic markets. Airline industry domestic unit revenues, as reported to the Air Transport Association, declined by 12% to 13% in each of the months fromMay through August, respectively. United, due to its significant reliance on high-yield business traffic, was disproportionately affected during this period.
In addition, United’s revenues, yield, revenue passenger miles and available passenger miles were significantlyimpacted by the events of September 11 and the resulting reduction in the Company’s operations. The Companyestimates that the September 11 terrorist attacks negatively impacted the Company’s revenues by approximately$1.7 billion.
During 2000, the Company experienced significant operational disruptions, as a result of labor-related delaysand cancellations, as well as weather and air traffic control limitations, which adversely affected both revenueand expense performance. The Company attempted to mitigate the impact of these operational difficulties byreducing capacity, particularly in the domestic markets, where most of the problems were concentrated. TheCompany estimated the revenue shortfall arising from these disruptions and associated schedule reductionsand cancellations to be somewhere between $700 and $750 million for the year.
UAL’s loss from operations was $(3.8) billion in 2001, compared to operating earnings of $654 million in 2000.UAL’s net loss for 2001 was $(2.1) billion ($(39.90) per share) before the cumulative effect of an accountingchange, compared to 2000 net earnings before the cumulative effect of an accounting change and an extra-ordinary loss on debt of $265 million ($1.89 per share, diluted).
During 2001, United recorded a special charge of $834 million, net of tax, in operating expense and $31 million,net of tax, in non-operating expense for amounts relating to the September 11 terrorist attacks and the resultingimpact on the Company’s schedule and operations. In addition, through December 31, United has recognized$652 million (pre-tax) in non-operating income as compensation under the Act. (See Note 2 “Special ChargesRelated to the September 11 Terrorist Attacks” in the Notes to Consolidated Financial Statements.)
Also during 2001, UAL recognized a special charge of $74 million, net of tax, for costs associated with a termi-nated merger with US Airways Group, Inc., including a $50 million termination fee. In addition, the Companyrecorded a gain of $166 million, net of tax, on the sale of certain investments, as further described in Note 6“Investments” in the Notes to Consolidated Financial Statements.
The 2000 earnings include a special charge of $88 million, net of tax, relating to asset retirements, losses onleased equipment and write-downs on non-operating equipment, as well as an impairment loss of $38 million,net of tax, related to the Company’s equity investment in Priceline.com. In addition, the 2000 earnings include
KS
PO
TS
PO
TU
AL
#30
899
Ass
m:
NS
30899_Body 3/22/02 6:16 PM Page 9
10 UAL Corporation 2001 Annual Report
an extraordinary loss of $6 million, net of tax, on early extinguishment of debt and the cumulative effect of achange in accounting principle of $209 million, net of tax.
The 1999 earnings include an extraordinary loss of $3 million, net of tax, on early extinguishment of debt and again of $468 million, net of tax, on the sale of certain of the Company’s investments, as further described inNote 6 “Investments” in the Notes to Consolidated Financial Statements.
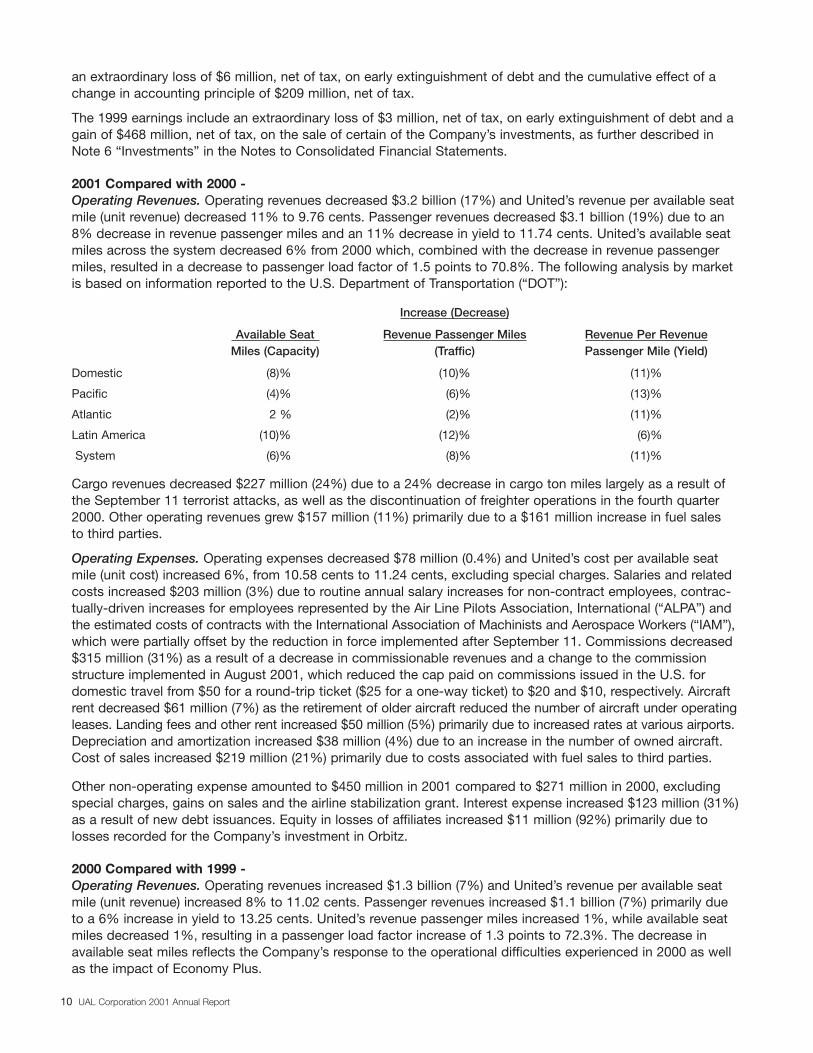
2001 Compared with 2000 -Operating Revenues. Operating revenues decreased $3.2 billion (17%) and United’s revenue per available seatmile (unit revenue) decreased 11% to 9.76 cents. Passenger revenues decreased $3.1 billion (19%) due to an8% decrease in revenue passenger miles and an 11% decrease in yield to 11.74 cents. United’s available seatmiles across the system decreased 6% from 2000 which, combined with the decrease in revenue passengermiles, resulted in a decrease to passenger load factor of 1.5 points to 70.8%. The following analysis by marketis based on information reported to the U.S. Department of Transportation (“DOT”):
Increase (Decrease)
Available Seat Revenue Passenger Miles Revenue Per RevenueMiles (Capacity) (Traffic) Passenger Mile (Yield)
Domestic (8)% (10)% (11)%
Pacific (4)% (6)% (13)%
Atlantic 2 % (2)% (11)%
Latin America (10)% (12)% (6)%
System (6)% (8)% (11)%
Cargo revenues decreased $227 million (24%) due to a 24% decrease in cargo ton miles largely as a result ofthe September 11 terrorist attacks, as well as the discontinuation of freighter operations in the fourth quarter2000. Other operating revenues grew $157 million (11%) primarily due to a $161 million increase in fuel sales to third parties.
Operating Expenses. Operating expenses decreased $78 million (0.4%) and United’s cost per available seatmile (unit cost) increased 6%, from 10.58 cents to 11.24 cents, excluding special charges. Salaries and relatedcosts increased $203 million (3%) due to routine annual salary increases for non-contract employees, contrac-tually-driven increases for employees represented by the Air Line Pilots Association, International (“ALPA”) andthe estimated costs of contracts with the International Association of Machinists and Aerospace Workers (“IAM”),which were partially offset by the reduction in force implemented after September 11. Commissions decreased$315 million (31%) as a result of a decrease in commissionable revenues and a change to the commissionstructure implemented in August 2001, which reduced the cap paid on commissions issued in the U.S. fordomestic travel from $50 for a round-trip ticket ($25 for a one-way ticket) to $20 and $10, respectively. Aircraftrent decreased $61 million (7%) as the retirement of older aircraft reduced the number of aircraft under operatingleases. Landing fees and other rent increased $50 million (5%) primarily due to increased rates at various airports.Depreciation and amortization increased $38 million (4%) due to an increase in the number of owned aircraft.Cost of sales increased $219 million (21%) primarily due to costs associated with fuel sales to third parties.
Other non-operating expense amounted to $450 million in 2001 compared to $271 million in 2000, excludingspecial charges, gains on sales and the airline stabilization grant. Interest expense increased $123 million (31%)as a result of new debt issuances. Equity in losses of affiliates increased $11 million (92%) primarily due tolosses recorded for the Company’s investment in Orbitz.
2000 Compared with 1999 -Operating Revenues. Operating revenues increased $1.3 billion (7%) and United’s revenue per available seatmile (unit revenue) increased 8% to 11.02 cents. Passenger revenues increased $1.1 billion (7%) primarily dueto a 6% increase in yield to 13.25 cents. United’s revenue passenger miles increased 1%, while available seatmiles decreased 1%, resulting in a passenger load factor increase of 1.3 points to 72.3%. The decrease inavailable seat miles reflects the Company’s response to the operational difficulties experienced in 2000 as wellas the impact of Economy Plus.
KS
PO
TS
PO
TU
AL #30899 A
ssm:
NS
30899_Body 3/22/02 6:16 PM Page 10
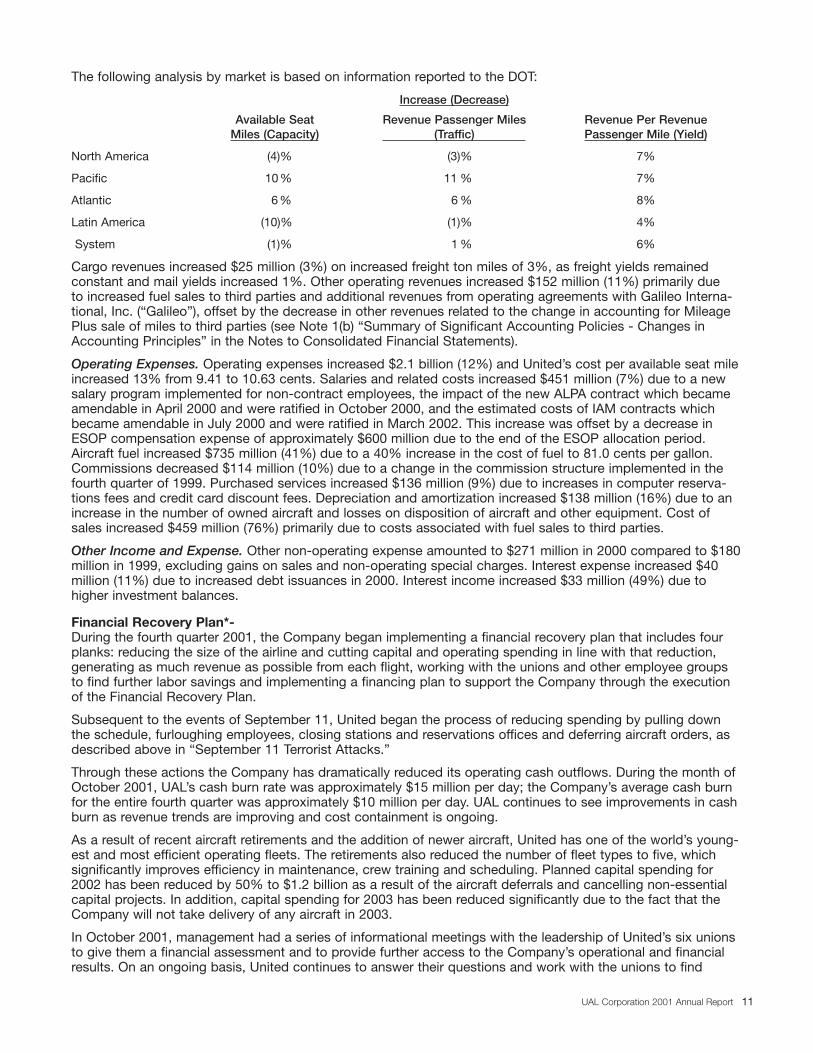
The following analysis by market is based on information reported to the DOT:
Increase (Decrease)
Available Seat Revenue Passenger Miles Revenue Per RevenueMiles (Capacity) (Traffic) Passenger Mile (Yield)
North America (4)% (3)% 7%
Pacific 10% 11 % 7%
Atlantic 6% 6 % 8%
Latin America (10)% (1)% 4%
System (1)% 1 % 6%
Cargo revenues increased $25 million (3%) on increased freight ton miles of 3%, as freight yields remained constant and mail yields increased 1%. Other operating revenues increased $152 million (11%) primarily due to increased fuel sales to third parties and additional revenues from operating agreements with Galileo Interna-tional, Inc. (“Galileo”), offset by the decrease in other revenues related to the change in accounting for MileagePlus sale of miles to third parties (see Note 1(b) “Summary of Significant Accounting Policies - Changes inAccounting Principles” in the Notes to Consolidated Financial Statements).
Operating Expenses. Operating expenses increased $2.1 billion (12%) and United’s cost per available seat mileincreased 13% from 9.41 to 10.63 cents. Salaries and related costs increased $451 million (7%) due to a newsalary program implemented for non-contract employees, the impact of the new ALPA contract which becameamendable in April 2000 and were ratified in October 2000, and the estimated costs of IAM contracts whichbecame amendable in July 2000 and were ratified in March 2002. This increase was offset by a decrease inESOP compensation expense of approximately $600 million due to the end of the ESOP allocation period.Aircraft fuel increased $735 million (41%) due to a 40% increase in the cost of fuel to 81.0 cents per gallon.Commissions decreased $114 million (10%) due to a change in the commission structure implemented in thefourth quarter of 1999. Purchased services increased $136 million (9%) due to increases in computer reserva-tions fees and credit card discount fees. Depreciation and amortization increased $138 million (16%) due to anincrease in the number of owned aircraft and losses on disposition of aircraft and other equipment. Cost ofsales increased $459 million (76%) primarily due to costs associated with fuel sales to third parties.
Other Income and Expense. Other non-operating expense amounted to $271 million in 2000 compared to $180million in 1999, excluding gains on sales and non-operating special charges. Interest expense increased $40million (11%) due to increased debt issuances in 2000. Interest income increased $33 million (49%) due tohigher investment balances.
Financial Recovery Plan*-During the fourth quarter 2001, the Company began implementing a financial recovery plan that includes fourplanks: reducing the size of the airline and cutting capital and operating spending in line with that reduction,generating as much revenue as possible from each flight, working with the unions and other employee groupsto find further labor savings and implementing a financing plan to support the Company through the executionof the Financial Recovery Plan.
Subsequent to the events of September 11, United began the process of reducing spending by pulling downthe schedule, furloughing employees, closing stations and reservations offices and deferring aircraft orders, asdescribed above in “September 11 Terrorist Attacks.”
Through these actions the Company has dramatically reduced its operating cash outflows. During the month ofOctober 2001, UAL’s cash burn rate was approximately $15 million per day; the Company’s average cash burnfor the entire fourth quarter was approximately $10 million per day. UAL continues to see improvements in cashburn as revenue trends are improving and cost containment is ongoing.
As a result of recent aircraft retirements and the addition of newer aircraft, United has one of the world’s young-est and most efficient operating fleets. The retirements also reduced the number of fleet types to five, whichsignificantly improves efficiency in maintenance, crew training and scheduling. Planned capital spending for2002 has been reduced by 50% to $1.2 billion as a result of the aircraft deferrals and cancelling non-essentialcapital projects. In addition, capital spending for 2003 has been reduced significantly due to the fact that theCompany will not take delivery of any aircraft in 2003.
In October 2001, management had a series of informational meetings with the leadership of United’s six unionsto give them a financial assessment and to provide further access to the Company’s operational and financialresults. On an ongoing basis, United continues to answer their questions and work with the unions to find
11UAL Corporation 2001 Annual Report
KS
PO
TS
PO
TU
AL
#30
899
Ass
m:
NS
30899_Body 3/22/02 6:16 PM Page 11
12 UAL Corporation 2001 Annual Report
creative solutions that move the Company toward financial stability. The Company believes that it must reducelabor costs, as well as other operating costs, in order to stabilize United’s financial situation in the currentindustry environment and position United to participate in an industry revenue recovery. The settlement of opencontracts as discussed in the “Labor Agreements” section is an important step towards achieving participationby all union groups in a program to reduce operating costs.
While UAL is in the process of developing a complete financing plan, the Company has identified various possi-ble sources of financing, including, but not limited to: (1) receipt of the final installment of grant money underthe Act; (2) receipt of $113 million held in trust under a services agreement with Galileo International (see Note6 “Investments” in the Notes to Consolidated Financial Statements); (3) various types of secured debt financings,including committed back-stop financing from aircraft manufacturers; (4) sale-leaseback transactions of ownedproperty, including aircraft and other equipment; (5) securitization of future operating receipts; (6) unsecuredborrowings and equity issuances; and (7) federal loan guarantees as provided under the Act. However, there isno assurance that any or all of these financing sources will be available at all times or at terms satisfactory tothe Company.
Finally, the Company is exploring various initiatives to increase revenue, including reviewing pricing strategies, themanagement of inventory internally and profitable enhancements to service and product offerings. For example,United has announced plans to add an additional 127 daily departures in April over the current schedule.
These efforts have resulted in a gradual improvement in unit revenue since the events of September 11, with year-over-year declines in unit revenue of 29%, 23% and 20%, respectively for October, November and December2001. The Company expects unit revenue for January 2002 to be only 15% to 17% below last year’s levels.
Liquidity and Capital Resources
Liquidity -UAL’s total of cash and cash equivalents and short-term investments was $2.6 billion at December 31, 2001,compared to $2.3 billion at December 31, 2000. Operating activities during the year used $160 million, includingthe effects of the grant received from the federal government.
Property additions, including aircraft, aircraft spare parts, facilities and ground equipment, amounted to $2.0 billion, while property dispositions resulted in proceeds of $178 million. In 2001, United took delivery of fifteenA319, eighteen A320, two B767 and eight B777 aircraft. All of these aircraft were purchased. One of the aircraftpurchased was sold and then leased back under an operating lease. In addition, United acquired three B737 andtwo B757 off lease during the year and retired its remaining DC10-30 fleet and all of its B727 and B737-200 fleets.
Financing activities included the issuance of $1.5 billion in equipment trust certificates, as well as principal payments under debt and capital lease obligations of $176 million and $289 million, respectively. Additionally,UAL issued $1.0 billion in long-term debt during the period to finance the acquisition of aircraft. As of December31, 2001, the Company has borrowed $133 million under a separate short-term borrowing facility and pledgedreceivables of approximately $145 million. UAL may also from time to time repurchase on the open market, inprivately negotiated purchases or otherwise, its debt and equity securities.
At December 31, 2001, United guaranteed approximately $100 million of third-party debt.
Certain of United’s surety bonds for worker’s compensation have been cancelled in various states where Unitedis self-insured. As a result, United has been and may, in the future, be required to post collateral in the form ofcash deposits or letters of credit. Subsequent to December 31, 2001, United has posted $187 million in depositsfor various states where United is self-insured for worker’s compensation claims.
In addition, during January, United paid $290 million in federal transportation taxes that had been deferred as aresult of September 11. The Company also closed on a private debt financing which raised approximately $250million in cash and sold its remaining investment in Cendant Corporation for approximately $137 million (see Note6 “Investments” in the Notes to Consolidated Financial Statements).
As of December 31, 2001, UAL had a working capital deficit of $3.0 billion as compared to $1.7 billion atDecember 31, 2000. The Company has historically relied on working capital to fund a significant portion of itsongoing operations. Historically, UAL has operated with a working capital deficit; however, since September 11,2001, the Company has not generated positive cash flow from its operations. Due to the lack of predictability offuture traffic, business mix and yields, the Company is unable to estimate when it will again generate positive cashflow from operations to meet its operating requirements, as well as short-term and long-term capital requirements.
Prior Years. Operating activities in 2000 generated cash flows of $2.5 billion. Cash was used primarily to fundnet additions to property and equipment ($2.2 billion) and to repurchase common stock ($81 million). Financing
KS
PO
TS
PO
TU
AL #30899 A
ssm:
NS
30899_Body 3/22/02 6:16 PM Page 12
UAL Corporation 2001 Annual Report
activities included the issuance of $2.4 billion in equipment trust certificates, as well as principal paymentsunder debt and capital lease obligations of $441 million and $283 million, respectively. Additionally, theCompany retired $116 million of long-term debt prior to maturity.
Operating activities in 1999 generated cash flows of $2.4 billion and the Company’s sale of part of its invest-ments in Galileo and Equant provided $828 million in cash. Cash was used primarily to fund net additions toproperty and equipment ($2.2 billion) and to repurchase common stock ($261 million). Financing activities alsoincluded principal payments under debt and capital lease obligations of $513 million and $248 million, respectively.
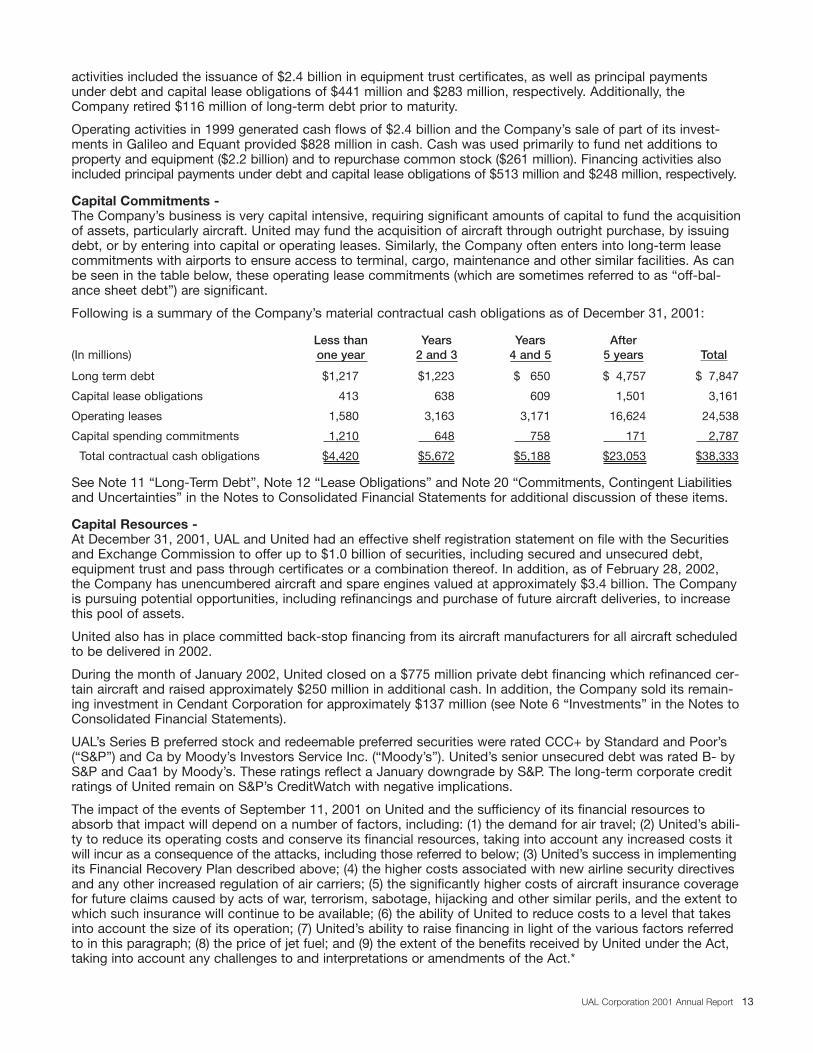
Capital Commitments -The Company’s business is very capital intensive, requiring significant amounts of capital to fund the acquisitionof assets, particularly aircraft. United may fund the acquisition of aircraft through outright purchase, by issuingdebt, or by entering into capital or operating leases. Similarly, the Company often enters into long-term leasecommitments with airports to ensure access to terminal, cargo, maintenance and other similar facilities. As canbe seen in the table below, these operating lease commitments (which are sometimes referred to as “off-bal-ance sheet debt”) are significant.
Following is a summary of the Company’s material contractual cash obligations as of December 31, 2001:
Less than Years Years After(In millions) one year 2 and 3 4 and 5 5 years Total
Long term debt $1,217 $1,223 $ 650 $ 4,757 $ 7,847
Capital lease obligations 413 638 609 1,501 3,161
Operating leases 1,580 3,163 3,171 16,624 24,538
Capital spending commitments 1,210 648 758 171 2,787
Total contractual cash obligations $4,420 $5,672 $5,188 $23,053 $38,333
See Note 11 “Long-Term Debt”, Note 12 “Lease Obligations” and Note 20 “Commitments, Contingent Liabilitiesand Uncertainties” in the Notes to Consolidated Financial Statements for additional discussion of these items.
Capital Resources -At December 31, 2001, UAL and United had an effective shelf registration statement on file with the Securitiesand Exchange Commission to offer up to $1.0 billion of securities, including secured and unsecured debt,equipment trust and pass through certificates or a combination thereof. In addition, as of February 28, 2002,the Company has unencumbered aircraft and spare engines valued at approximately $3.4 billion. The Companyis pursuing potential opportunities, including refinancings and purchase of future aircraft deliveries, to increasethis pool of assets.
United also has in place committed back-stop financing from its aircraft manufacturers for all aircraft scheduledto be delivered in 2002.
During the month of January 2002, United closed on a $775 million private debt financing which refinanced cer-tain aircraft and raised approximately $250 million in additional cash. In addition, the Company sold its remain-ing investment in Cendant Corporation for approximately $137 million (see Note 6 “Investments” in the Notes toConsolidated Financial Statements).
UAL’s Series B preferred stock and redeemable preferred securities were rated CCC+ by Standard and Poor’s(“S&P”) and Ca by Moody’s Investors Service Inc. (“Moody’s”). United’s senior unsecured debt was rated B- byS&P and Caa1 by Moody’s. These ratings reflect a January downgrade by S&P. The long-term corporate creditratings of United remain on S&P’s CreditWatch with negative implications.
The impact of the events of September 11, 2001 on United and the sufficiency of its financial resources toabsorb that impact will depend on a number of factors, including: (1) the demand for air travel; (2) United’s abili-ty to reduce its operating costs and conserve its financial resources, taking into account any increased costs itwill incur as a consequence of the attacks, including those referred to below; (3) United’s success in implementingits Financial Recovery Plan described above; (4) the higher costs associated with new airline security directivesand any other increased regulation of air carriers; (5) the significantly higher costs of aircraft insurance coveragefor future claims caused by acts of war, terrorism, sabotage, hijacking and other similar perils, and the extent towhich such insurance will continue to be available; (6) the ability of United to reduce costs to a level that takesinto account the size of its operation; (7) United’s ability to raise financing in light of the various factors referredto in this paragraph; (8) the price of jet fuel; and (9) the extent of the benefits received by United under the Act,taking into account any challenges to and interpretations or amendments of the Act.*
13
KS
PO
TS
PO
TU
AL
#30
899
Ass
m:
NS
30899_Body 3/22/02 6:16 PM Page 13
14 UAL Corporation 2001 Annual Report
At this point, due in part to the lack of predictability of future traffic, business mix and yields, United is unableto fully estimate the impact on it of the events of September 11, 2001, and their consequences and the suffi-ciency of its financial resources to absorb that impact, including the mitigating effects of the Act and theCompany’s aggressive actions to reduce its costs. However, given the magnitude of these unprecedentedevents and the possible subsequent effects, United expects that the adverse impact to its financial condition,its operations and its prospects will continue to be material.*
Other Information
Labor Agreements -On July 12, 2000, the Company’s contracts with the IAM became amendable. The Company has been in negotia-tions with both IAM District 141M (representing mechanics) and 141 (representing public contact, ramp and stores,food services and security employees) since December 1999 for new contracts. Since September 2000, the nego-tiations have been conducted under the auspices of the National Mediation Board (“NMB”). Under the terms of the Railway Labor Act, United’s current agreements with the IAM remain in effect as negotiations continue.
On November 19, 2001, the NMB released both parties in the mechanics negotiations from mediation andoffered both sides binding arbitration, which was accepted by United but declined by the IAM, effectivelybeginning a 30-day “cooling-off period,” which could have resulted in a strike in December 2001. Instead, onDecember 20, 2001, President Bush appointed a Presidential Emergency Board (“PEB”) as permitted by theRailway Labor Act, to study the issues between the parties and recommend a solution, effectively postponing a possible strike for 60 days. On January 20, 2002, the PEB presented its recommendations to the Companyand the IAM which included immediate pay increases of as much as 37% for United’s mechanics, as well asproviding for payment of retroactive wages, of a lesser amount, to July 12, 2000. United accepted the recom-mendations of the PEB and they were submitted to the IAM for ratification. However, on February 12, themechanics rejected the recommendations and authorized a strike which could have occurred as early asFebruary 20 at 12:01 a.m. On February 15, the two parties reconvened to continue negotiations and onFebruary 18, the Company and the IAM announced that they had reached a new tentative agreement. OnMarch 5, 2002, the IAM ratified the tentative agreement, which contains some improvements over the PEB-recommended proposal, including payment of retroactive wages in eight equal quarterly installments, including6% interest, commencing December 2002.
Mediated negotiations with IAM District 141 are continuing.
Avolar -In May 2001, UAL announced the formation of United BizJet Holdings, Inc. (now known as “Avolar”), a whollyowned subsidiary, to address the travel needs of premium customers who may not use commercial aviationservices. Avolar operates and sells fractional ownership interests in premium business aircraft and providescharter services, fleet management services and a domestic and international shuttle product.
In May 2001, UAL’s Board of Directors authorized the investment of up to $250 million in the subsidiary. ThroughJanuary 2002, UAL has invested $102 million in Avolar, which includes advance payments on aircraft purchasesand the funding of operational expenses. Following the events of September 11, UAL decided to investigateoptions to reduce its future funding obligations, including a possible sale of a majority of Avolar to third-partyinvestors. Avolar is now pursuing a new business plan to enable it to realize its value without additional invest-ment from UAL or the involvement of private equity investors. In connection with this action, UAL intends todiscontinue its financial commitment to Avolar effective March 31. Avolar’s business is still in the startup phaseof operations and the amounts invested but not yet expensed could result in a significant write-off at UAL if thisbusiness plan proves unsuccessful.*
As of December 31, 2001, Avolar has agreements with Gulfstream Aerospace Corporation and Dassault FalconJet to purchase 82 aircraft for $1.9 billion (after deducting advance payments) to be delivered beginning in 2002,with options to purchase an additional 142 aircraft. Avolar has the right to cancel the purchase of specific air-craft under the agreements subject to, among other things, termination fees or other make-whole provisions.
Deferred Tax Assets -UAL’s consolidated balance sheet at December 31, 2001 includes a net deferred tax asset of $369 million,including $255 million of alternative minimum tax (“AMT”) credits which have an indefinite carryforward period,compared to a net deferred tax liability of $1.0 billion at December 31, 2000. Note 8 “Income Taxes” in the Notesto Consolidated Financial Statements describes the items included in the deferred tax assets and liabilities.
Management believes that a majority of the deferred tax assets will be realized through reversals of existingdeferred tax liabilities with similar reversal patterns and the balance will be realized as a result of generatingfuture taxable income. UAL needs to generate approximately $4 billion in future taxable income in order to
KS
PO
TS
PO
TU
AL #30899 A
ssm:
NS
30899_Body 3/22/02 6:16 PM Page 14
realize the benefits of the remaining deferred tax assets. Between 1994 and 2000, UAL has generated approxi-mately $5.7 billion in taxable income.
While the book and tax loss in 2001 was largely attributable to events beyond management’s control, includingthe events of September 11 and the recession in the U.S., UAL has taken several steps to reduce costs andimprove profitability, as described in “Financial Recovery Plan” above.
UAL’s ability to generate sufficient amounts of taxable income from future operations is dependent upon numerousfactors, including general economic conditions, inflation, fuel costs, the state of the industry and other factorsbeyond management’s control. There can be no assurances that UAL will meet its expectations of future taxableincome. However, based on the extended period over which postretirement benefits will be recognized, thetwenty-year federal tax carryforward period, the Company’s prior history of taxable income, the utilization of all prior federal net operating loss carryforwards and the indefinite carryforward period for AMT credits, man-agement believes it is more likely than not that future taxable income will be sufficient to utilize the deferred taxassets at December 31, 2001.*
Foreign Operations -United generates revenues and incurs expenses in numerous foreign currencies. These expenses include air-craft leases, commissions, catering, personnel expense, advertising and distribution costs, customer serviceexpenses and aircraft maintenance. Changes in foreign currency exchange rates impact operating incomethrough changes in foreign currency-denominated operating revenues and expenses. Despite the adverse(favorable) effects a strengthening (weakening) foreign currency may have on U.S. originating traffic, a strength-ening (weakening) of foreign currencies tends to increase (decrease) reported revenue and operating incomebecause United’s foreign currency-denominated operating revenue generally exceeds its foreign currency-denominated operating expense for each currency.
With a worldwide network and significant sales and marketing efforts in the U.S. as well as every major economicregion in the world, United is able to mitigate its exposure to fluctuations in any single foreign currency. TheCompany’s biggest net exposures are typically for Japanese yen, Hong Kong dollars, Australian dollars andBritish pounds. During 2001, yen-denominated operating revenue net of yen-denominated operating expensewas approximately 16 billion yen (approximately $135 million), Hong Kong dollar-denominated operating rev-enue net of Hong Kong dollar-denominated operating expense was approximately 1.1 billion Hong Kong dollars(approximately $135 million), British pound-denominated operating revenue net of British pound-denominatedoperating expense was approximately 85 million British pounds (approximately $123 million), and Australiandollar-denominated operating revenue net of Australian dollar-denominated operating expense was approxi-mately 94 million Australian dollars (approximately $48 million).
As the Company has limited operations in Argentina, United’s cash on deposit in Argentina was less than $4million at December 31, 2001.
To reduce the impact of exchange rate fluctuations on United’s financial results, the Company hedged some ofthe risk of exchange rate volatility on its anticipated future foreign currency revenues by purchasing put options(consisting of Japanese yen, euro, Australian dollars and British pounds) and selling Hong Kong dollar forwards.To reduce hedging costs, the Company sells a correlation option in the first four currencies referred to above.United also attempts to reduce its exposure to transaction gains and losses by converting excess local curren-cies generated to U.S. dollars on a timely basis and by entering into currency forward or exchange contracts.The total notional amount of outstanding currency options and forward exchange contracts, and their respec-tive fair market values as of December 31, 2001, are summarized in “Quantitative and Qualitative DisclosuresAbout Market Risk.”
United’s foreign operations involve insignificant amounts of physical assets; however, the Company does have sizable intangible assets related to acquisitions of Atlantic and Latin America route authorities. Operatingauthorities in international markets are governed by bilateral aviation agreements between the U.S. and foreigncountries. Changes in U.S. or foreign government aviation policies can lead to the alteration or termination ofexisting air service agreements that could adversely impact the value of United’s international route authority.Significant changes in such policies could also have a material impact on UAL’s operating revenues and resultsof operations. During 2001, the Financial Accounting Standards Board (“FASB”) issued Statement of FinancialStandards No. 142, “Goodwill and Other Intangible Assets” (“SFAS No. 142”) which could impact the Company’saccounting for these assets. For further details, see “New Accounting Pronouncements” below.
Airport Rents and Landing Fees -United is charged facility rental and/or landing fees at every airport at which it operates. In recent years, manyairports have increased or sought to increase rates charged to airlines as a means of compensating for increas-ing demands upon airport revenues. Airlines have challenged certain of these increases through litigation and in
15UAL Corporation 2001 Annual Report
KS
PO
TS
PO
TU
AL
#30
899
Ass
m:
NS
30899_Body 3/22/02 6:16 PM Page 15
some cases have not been successful. The FAA and the DOT have instituted an administrative hearing processto judge whether rate increases are legal and valid. However, to the extent the limitations on such charges are relaxed or the ability of airlines to challenge such charges is restricted, the rates charged by airports mayincrease substantially. Management cannot predict either the likelihood or the magnitude of any such increase.*
Environmental and Legal Contingencies -United has been named as a Potentially Responsible Party at certain Environmental Protection Agency (“EPA”)cleanup sites which have been designated as Superfund Sites. United’s alleged proportionate contributions atthe sites are minimal; however, at sites where the EPA has commenced litigation, potential liability is joint andseveral. Additionally, United has participated and is participating in remediation actions at certain other sites,primarily airports. The estimated cost of these actions is accrued when it is determined that it is probable thatUnited is liable. Environmental regulations and remediation processes are subject to future change, and deter-mining the actual cost of remediation will require further investigation and remediation experience. Therefore, theultimate disposition cannot be determined at this time. However, while such cost may vary from United’s currentestimate, United believes the difference between its accrued reserve and the ultimate liability will not be material.*
UAL has certain other contingencies resulting from this and other litigation and claims incident to the ordinarycourse of business. Management believes, after considering a number of factors, including (but not limited to) theviews of legal counsel, the nature of such contingencies and prior experience, that the ultimate disposition ofthese contingencies is not likely to materially affect UAL’s financial condition, operating results or liquidity.*
Critical Accounting Policies - Critical accounting policies are defined as those that are reflective of significant judgments and uncertaintiesand potentially result in materially different results under different assumptions and conditions. UAL has pre-pared the accompanying financial statements in conformity with generally accepted accounting principles,which require management to make estimates and assumptions that affect the reported amounts in the financial statements and accompanying notes. Actual results could differ from those estimates under differentassumptions or conditions. The Company has identified the following critical accounting policies utilized in thepreparation of these financial statements.
Revenue Recognition. As discussed in Note 1(d) “Summary of Significant Accounting Policies - Airline Revenues”in the Notes to Consolidated Financial Statements, passenger ticket sales are recorded as operating revenueswhen the transportation is furnished. The value of unused passenger tickets is included in advance ticket salesas a liability on the balance sheet. United performs periodic evaluations of this liability and any adjustments,which can be significant, are included in the results of operations for the periods in which the evaluations arecompleted. These adjustments result from differences between the Company’s estimation of certain revenuetransactions and the related sales price, and are impacted by various factors, including a complex pricingstructure and interline agreements throughout the industry, which effect the timing of revenue recognition.
Accounting for Long-Lived Assets. The Company has approximately $17 billion in operating property andequipment at December 31, 2001. In addition to the original cost of these assets, their recorded value isimpacted by a number of policy elections made by the Company, including the estimation of useful lives, salvage values and in 2001, impairment charges. See Note 1(h) “Summary of Significant Accounting Policies -Operating Property and Equipment” and Note 2 “Special Charges Related to the September 11 Terrorist Attacks”in the Notes to Consolidated Financial Statements for additional information regarding United’s policies onaccounting for long-lived assets.
Frequent Flyer Accounting. The Company utilizes a number of estimates in accounting for its Mileage Plus frequentflyer program which are consistent with industry practices. Additional information regarding the Mileage Plusfrequent flyer program is included in Note 1(b) “Summary of Significant Accounting Policies - Changes inAccounting Principles” and Note 1(i) “Summary of Significant Accounting Policies - Mileage Plus Awards” in the Notes to Consolidated Financial Statements. In addition, the Emerging Issues Task Force of the FASB iscurrently reviewing the accounting for both multiple-deliverable revenue arrangements and volume-based salesincentive offers, but has not yet reached a consensus that would apply to programs such as the Mileage Plusprogram. The issuance of new accounting standards could have a significant impact on the Company’s frequentflyer liability in the year of change as well as future years.
Pensions and Other Postretirement Benefits. The Company’s pension and other postretirement benefit costsare calculated using various actuarial assumptions and methodologies as prescribed under Statement ofFinancial Accounting Standards No. 87, “Employers’ Accounting for Pensions” and Statement of FinancialAccounting Standards No. 106, “Employers’ Accounting for Postretirement Benefits Other Than Pensions.” TheCompany’s assumptions, which include the selection of the discount rate, the expected return on plan assetsand the expected health care cost trend rate, are identified in Note 18 “Retirement and Postretirement Plans” inthe Notes to Consolidated Financial Statements. The discount rate is based on the Company’s review of high
16 UAL Corporation 2001 Annual Report
KS
PO
TS
PO
TU
AL #30899 A
ssm:
NS
30899_Body 3/22/02 6:16 PM Page 16
quality corporate bond rates and the change in these rates during the year. The expected return on plan assetsand health care cost trend rate are based on an evaluation of the Company’s historical trends and experiencetaking into consideration current and expected market conditions. In addition, the Company’s future pension andother postretirement benefit costs and liabilities will be impacted by the new labor agreements with the IAM.
Valuation Allowance for Deferred Tax Assets. At December 31, 2001, the Company had a net deferred taxasset of $369 million, which the Company has determined is more likely than not to be realized. A valuationallowance of $6 million was calculated for those state net operating losses with carryforward periods of sevenyears or less, using assumptions and methodologies as prescribed under Statement of Financial AccountingStandards No. 109, “Accounting for Income Taxes” and as described in “Deferred Tax Assets” above. See alsoNote 8 “Income Taxes” in the Notes to Consolidated Financial Statements for additional information.
New Accounting Pronouncements -In June 2001, the FASB issued Statement of Financial Accounting Standards No. 141 “Business Combinations”(“SFAS No. 141”) and SFAS No. 142. SFAS No. 141 is effective for combinations initiated after June 30, 2001and requires the use of the purchase method in accounting for business combinations. SFAS No. 142 is effectivefor fiscal years beginning after December 15, 2001 and requires companies to test all goodwill and indefinite-lived intangible assets for impairment and to cease amortization of such assets. The Company intends to adoptSFAS No. 142 beginning in the first quarter 2002 and currently estimates discontinuing approximately $17 millionin amortization expense in 2002. In accordance with SFAS No. 142, the Company will perform an evaluation ofits intangibles in the first quarter after adoption.
In June 2001, the FASB issued Statement of Financial Accounting Standards No. 143 “Accounting for AssetRetirement Obligations” (“SFAS No. 143”), which addresses the accounting and reporting for obligations associated with the retirement of long-lived assets and associated asset retirement costs. Under SFAS No. 143, the fair value of a liability for an asset retirement obligation must be recognized in the period in which it isincurred if a reasonable estimate of fair value can be made. In addition, the associated asset retirement costsare capitalized as part of the carrying amount of the long-lived asset. SFAS No. 143 is effective for fiscal yearsbeginning after June 15, 2002. The Company has not yet quantified the impact of SFAS No. 143 on theCompany’s financial statements.
In August 2001, the FASB issued Statement of Financial Accounting Standards No. 144 “Accounting for theImpairment or Disposal of Long-Lived Assets” (“SFAS No. 144”), which addresses the accounting and reportingfor the impairment or disposal of long-lived assets. SFAS No. 144 supersedes Statement of Financial AccountingStandards No. 121, “Accounting for the Impairment of Long-Lived Assets and for Long-Lived Assets to BeDisposed Of” (“SFAS No. 121”) but retains SFAS No. 121’s fundamental provisions for recognition/measurementof impairment of long-lived assets to be held and used and measurement of long-lived assets to be disposed ofby sale. SFAS No. 144 is effective for fiscal years beginning after December 15, 2001. The Company does notexpect SFAS No. 144 to have a material impact on the Company’s financial statements upon adoption.
Outlook for 2002* -While starting to see some positive revenue trends, the Company expects to report a significant loss in the firstquarter of 2002. Capacity for the first quarter is expected to be down 19% and unit costs, excluding United’s fuelsubsidiary, are expected to increase 7% year-over-year. First-quarter fuel price is projected to be down 24%year-over-year.
The Company expects January 2002 passenger unit revenue to be 15% to 17% below last year. United’sbooked load factor for February is ahead of last year, while March is about the same as last year.
Information included in the above “Outlook” paragraphs, as well as certain statements made throughout theManagement’s Discussion and Analysis of Financial Condition and Results of Operations that are identified withan asterisk (*) is forward-looking and involves risks and uncertainties that could result in actual results differingmaterially from expected results. Forward-looking statements represent the Company’s expectations and beliefsconcerning future events, based on information available to the Company on the date of this report. Some factorsthat could significantly impact net earnings, revenues, expenses, unit costs, fuel, load factor and capacity include,without limitation, the adverse impact of the September 11 terrorist attacks on the economy in general; thedemand for air travel; the ability to reduce operating costs and conserve financial resources; the higher costsassociated with new airline security directives and any other increased regulation of air carriers; the significantlyhigher costs of aircraft insurance coverage for future claims caused by acts of war, terrorism, sabotage, hijackingand other similar perils, and the extent to which such insurance will continue to be available; the ability to raiseand the cost of financing in light of the September 11 events; the price of jet fuel; the airline pricing environment;industry capacity decisions; competitors’ route decisions; the success of the Company’s cost-reduction efforts;the success of the Company’s implementation of the Financial Recovery Plan; the results of union contractnegotiations and wage rate reduction discussions and their impact on labor costs and operations; the willing-
17UAL Corporation 2001 Annual Report
KS
PO
TS
PO
TU
AL
#30
899
Ass
m:
NS
30899_Body 3/22/02 6:16 PM Page 17
18 UAL Corporation 2001 Annual Report
ness of customers to travel; actions of the U.S., foreign and local governments; foreign currency exchange ratefluctuations; the economic environment of the airline industry and the economic environment in general.
Investors should not place undue reliance on the forward-looking information contained herein, which speaks onlyas of the date of this report. UAL disclaims any intent or obligation to update or alter any of the forward-lookingstatements, whether in response to new information, unforeseen events, changed circumstances or otherwise.
Quantitative and Qualitative Disclosures About Market Risk
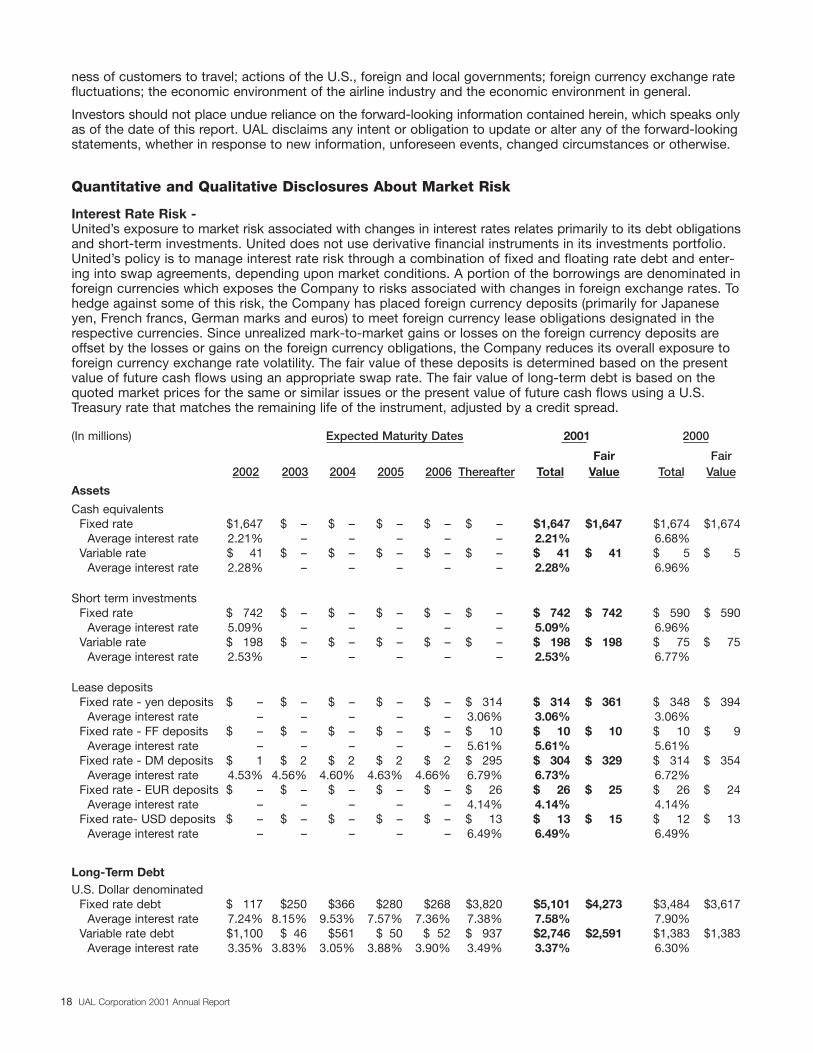
Interest Rate Risk - United’s exposure to market risk associated with changes in interest rates relates primarily to its debt obligationsand short-term investments. United does not use derivative financial instruments in its investments portfolio.United’s policy is to manage interest rate risk through a combination of fixed and floating rate debt and enter-ing into swap agreements, depending upon market conditions. A portion of the borrowings are denominated inforeign currencies which exposes the Company to risks associated with changes in foreign exchange rates. Tohedge against some of this risk, the Company has placed foreign currency deposits (primarily for Japaneseyen, French francs, German marks and euros) to meet foreign currency lease obligations designated in therespective currencies. Since unrealized mark-to-market gains or losses on the foreign currency deposits are offset by the losses or gains on the foreign currency obligations, the Company reduces its overall exposure toforeign currency exchange rate volatility. The fair value of these deposits is determined based on the presentvalue of future cash flows using an appropriate swap rate. The fair value of long-term debt is based on thequoted market prices for the same or similar issues or the present value of future cash flows using a U.S.Treasury rate that matches the remaining life of the instrument, adjusted by a credit spread.
(In millions) Expected Maturity Dates 2001 2000
Fair Fair2002 2003 2004 2005 2006 Thereafter Total Value Total Value
Assets
Cash equivalentsFixed rate $1,647 $ – $ – $ – $ – $ – $1,647 $1,647 $1,674 $1,674
Average interest rate 2.21% – – – – – 2.21% 6.68%Variable rate $ 41 $ – $ – $ – $ – $ – $ 41 $ 41 $ 5 $ 5
Average interest rate 2.28% – – – – – 2.28% 6.96%
Short term investmentsFixed rate $ 742 $ – $ – $ – $ – $ – $ 742 $ 742 $ 590 $ 590
Average interest rate 5.09% – – – – – 5.09% 6.96%Variable rate $ 198 $ – $ – $ – $ – $ – $ 198 $ 198 $ 75 $ 75
Average interest rate 2.53% – – – – – 2.53% 6.77%
Lease depositsFixed rate - yen deposits $ – $ – $ – $ – $ – $ 314 $ 314 $ 361 $ 348 $ 394
Average interest rate – – – – – 3.06% 3.06% 3.06%Fixed rate - FF deposits $ – $ – $ – $ – $ – $ 10 $ 10 $ 10 $ 10 $ 9
Average interest rate – – – – – 5.61% 5.61% 5.61%Fixed rate - DM deposits $ 1 $ 2 $ 2 $ 2 $ 2 $ 295 $ 304 $ 329 $ 314 $ 354
Average interest rate 4.53% 4.56% 4.60% 4.63% 4.66% 6.79% 6.73% 6.72%Fixed rate - EUR deposits $ – $ – $ – $ – $ – $ 26 $ 26 $ 25 $ 26 $ 24
Average interest rate – – – – – 4.14% 4.14% 4.14%Fixed rate- USD deposits $ – $ – $ – $ – $ – $ 13 $ 13 $ 15 $ 12 $ 13
Average interest rate – – – – – 6.49% 6.49% 6.49%
Long-Term DebtU.S. Dollar denominated
Fixed rate debt $ 117 $250 $366 $280 $268 $3,820 $5,101 $4,273 $3,484 $3,617Average interest rate 7.24% 8.15% 9.53% 7.57% 7.36% 7.38% 7.58% 7.90%
Variable rate debt $1,100 $ 46 $561 $ 50 $ 52 $ 937 $2,746 $2,591 $1,383 $1,383Average interest rate 3.35% 3.83% 3.05% 3.88% 3.90% 3.49% 3.37% 6.30%
KS
PO
TS
PO
TU
AL #30899 A
ssm:
NS
30899_Body 3/22/02 6:16 PM Page 18
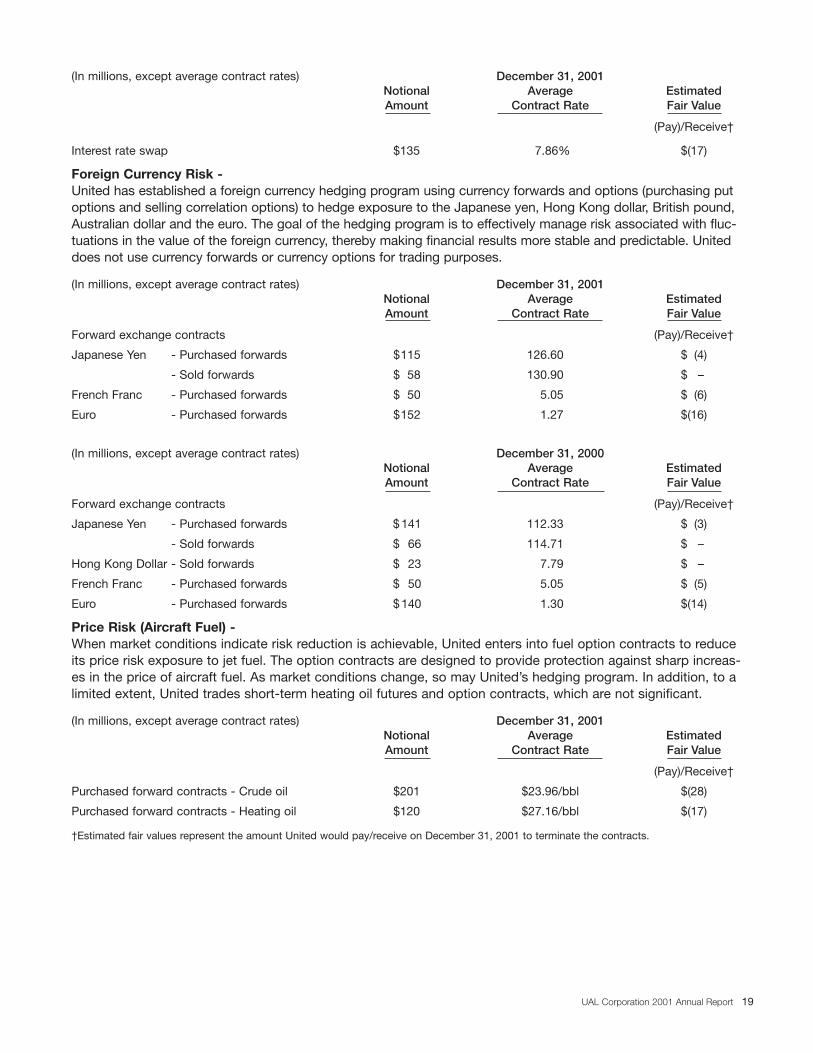
(In millions, except average contract rates) December 31, 2001Notional Average EstimatedAmount Contract Rate Fair Value
(Pay)/Receive†
Interest rate swap $135 7.86% $(17)
Foreign Currency Risk -United has established a foreign currency hedging program using currency forwards and options (purchasing putoptions and selling correlation options) to hedge exposure to the Japanese yen, Hong Kong dollar, British pound,Australian dollar and the euro. The goal of the hedging program is to effectively manage risk associated with fluc-tuations in the value of the foreign currency, thereby making financial results more stable and predictable. Uniteddoes not use currency forwards or currency options for trading purposes.
(In millions, except average contract rates) December 31, 2001Notional Average EstimatedAmount Contract Rate Fair Value
Forward exchange contracts (Pay)/Receive†
Japanese Yen - Purchased forwards $115 126.60 $ (4)
- Sold forwards $ 58 130.90 $ –
French Franc - Purchased forwards $ 50 5.05 $ (6)
Euro - Purchased forwards $152 1.27 $(16)
(In millions, except average contract rates) December 31, 2000Notional Average EstimatedAmount Contract Rate Fair Value
Forward exchange contracts (Pay)/Receive†
Japanese Yen - Purchased forwards $141 112.33 $ (3)
- Sold forwards $ 66 114.71 $ –
Hong Kong Dollar - Sold forwards $ 23 7.79 $ –
French Franc - Purchased forwards $ 50 5.05 $ (5)
Euro - Purchased forwards $140 1.30 $(14)
Price Risk (Aircraft Fuel) -When market conditions indicate risk reduction is achievable, United enters into fuel option contracts to reduceits price risk exposure to jet fuel. The option contracts are designed to provide protection against sharp increas-es in the price of aircraft fuel. As market conditions change, so may United’s hedging program. In addition, to alimited extent, United trades short-term heating oil futures and option contracts, which are not significant.
(In millions, except average contract rates) December 31, 2001Notional Average EstimatedAmount Contract Rate Fair Value
(Pay)/Receive†
Purchased forward contracts - Crude oil $201 $23.96/bbl $(28)
Purchased forward contracts - Heating oil $120 $27.16/bbl $(17)
†Estimated fair values represent the amount United would pay/receive on December 31, 2001 to terminate the contracts.
19UAL Corporation 2001 Annual Report
KS
PO
TS
PO
TU
AL
#30
899
Ass
m:
NS
30899_Body 3/22/02 6:16 PM Page 19
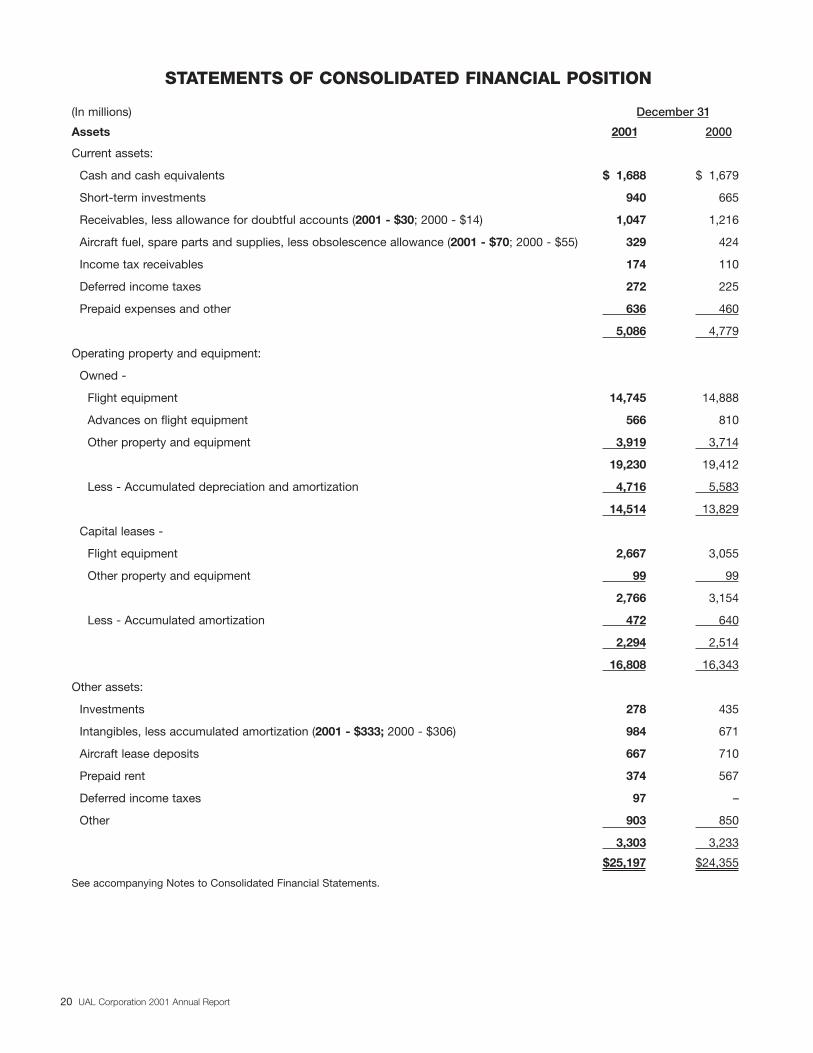
20 UAL Corporation 2001 Annual Report
STATEMENTS OF CONSOLIDATED FINANCIAL POSITION
(In millions) December 31
Assets 2001 2000
Current assets:
Cash and cash equivalents $ 1,688 $ 1,679
Short-term investments 940 665
Receivables, less allowance for doubtful accounts (2001 - $30; 2000 - $14) 1,047 1,216
Aircraft fuel, spare parts and supplies, less obsolescence allowance (2001 - $70; 2000 - $55) 329 424
Income tax receivables 174 110
Deferred income taxes 272 225
Prepaid expenses and other 636 460
5,086 4,779
Operating property and equipment:
Owned -
Flight equipment 14,745 14,888
Advances on flight equipment 566 810
Other property and equipment 3,919 3,714
19,230 19,412
Less - Accumulated depreciation and amortization 4,716 5,583
14,514 13,829
Capital leases -
Flight equipment 2,667 3,055
Other property and equipment 99 99
2,766 3,154
Less - Accumulated amortization 472 640
2,294 2,514
16,808 16,343
Other assets:
Investments 278 435
Intangibles, less accumulated amortization (2001 - $333; 2000 - $306) 984 671
Aircraft lease deposits 667 710
Prepaid rent 374 567
Deferred income taxes 97 –
Other 903 850
3,303 3,233
$25,197 $24,355
See accompanying Notes to Consolidated Financial Statements.
KS
PO
TS
PO
TU
AL #30899 A
ssm:
NS
30899_Body 3/22/02 6:16 PM Page 20
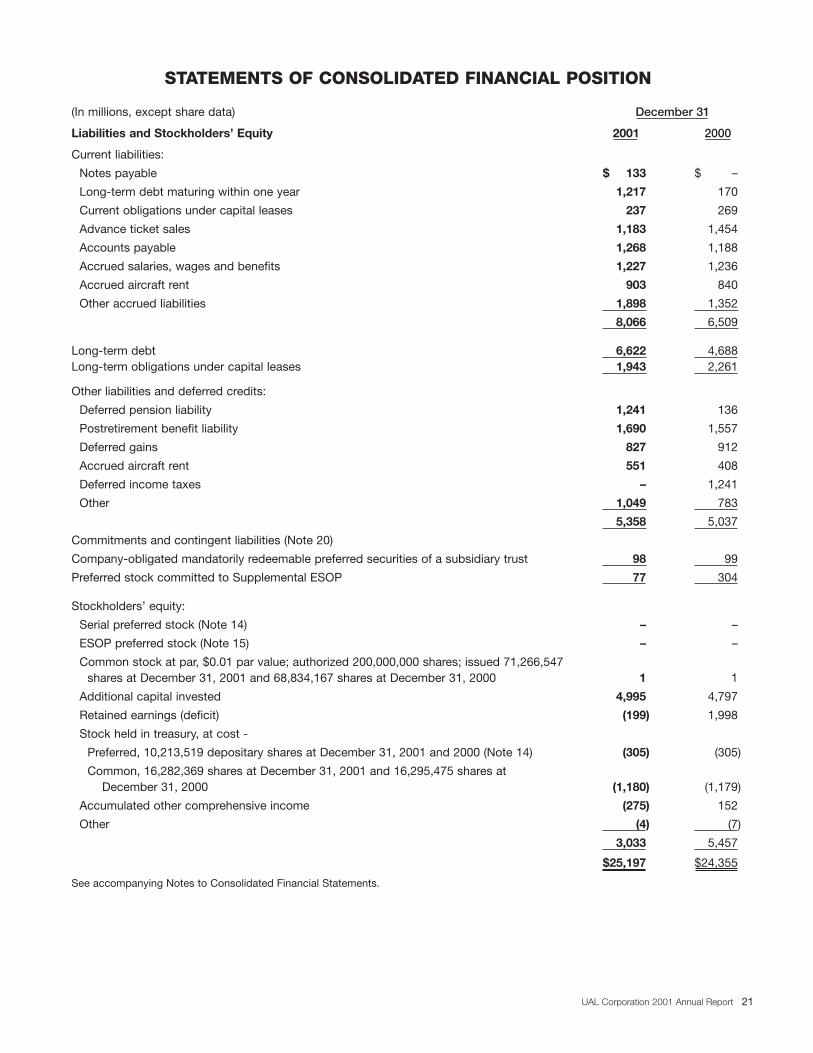
21UAL Corporation 2001 Annual Report
STATEMENTS OF CONSOLIDATED FINANCIAL POSITION
(In millions, except share data) December 31
Liabilities and Stockholders’ Equity 2001 2000
Current liabilities:
Notes payable $ 133 $ –
Long-term debt maturing within one year 1,217 170
Current obligations under capital leases 237 269
Advance ticket sales 1,183 1,454
Accounts payable 1,268 1,188
Accrued salaries, wages and benefits 1,227 1,236
Accrued aircraft rent 903 840
Other accrued liabilities 1,898 1,352
8,066 6,509
Long-term debt 6,622 4,688Long-term obligations under capital leases 1,943 2,261
Other liabilities and deferred credits:
Deferred pension liability 1,241 136
Postretirement benefit liability 1,690 1,557
Deferred gains 827 912
Accrued aircraft rent 551 408
Deferred income taxes – 1,241
Other 1,049 783
5,358 5,037
Commitments and contingent liabilities (Note 20)
Company-obligated mandatorily redeemable preferred securities of a subsidiary trust 98 99
Preferred stock committed to Supplemental ESOP 77 304
Stockholders’ equity:
Serial preferred stock (Note 14) – –
ESOP preferred stock (Note 15) – –
Common stock at par, $0.01 par value; authorized 200,000,000 shares; issued 71,266,547shares at December 31, 2001 and 68,834,167 shares at December 31, 2000 1 1
Additional capital invested 4,995 4,797
Retained earnings (deficit) (199) 1,998
Stock held in treasury, at cost -
Preferred, 10,213,519 depositary shares at December 31, 2001 and 2000 (Note 14) (305) (305)
Common, 16,282,369 shares at December 31, 2001 and 16,295,475 shares at December 31, 2000 (1,180) (1,179)
Accumulated other comprehensive income (275) 152
Other (4) (7)
3,033 5,457
$25,197 $24,355
See accompanying Notes to Consolidated Financial Statements.
KS
PO
TS
PO
TU
AL
#30
899
Ass
m:
NS
30899_Body 3/22/02 6:16 PM Page 21
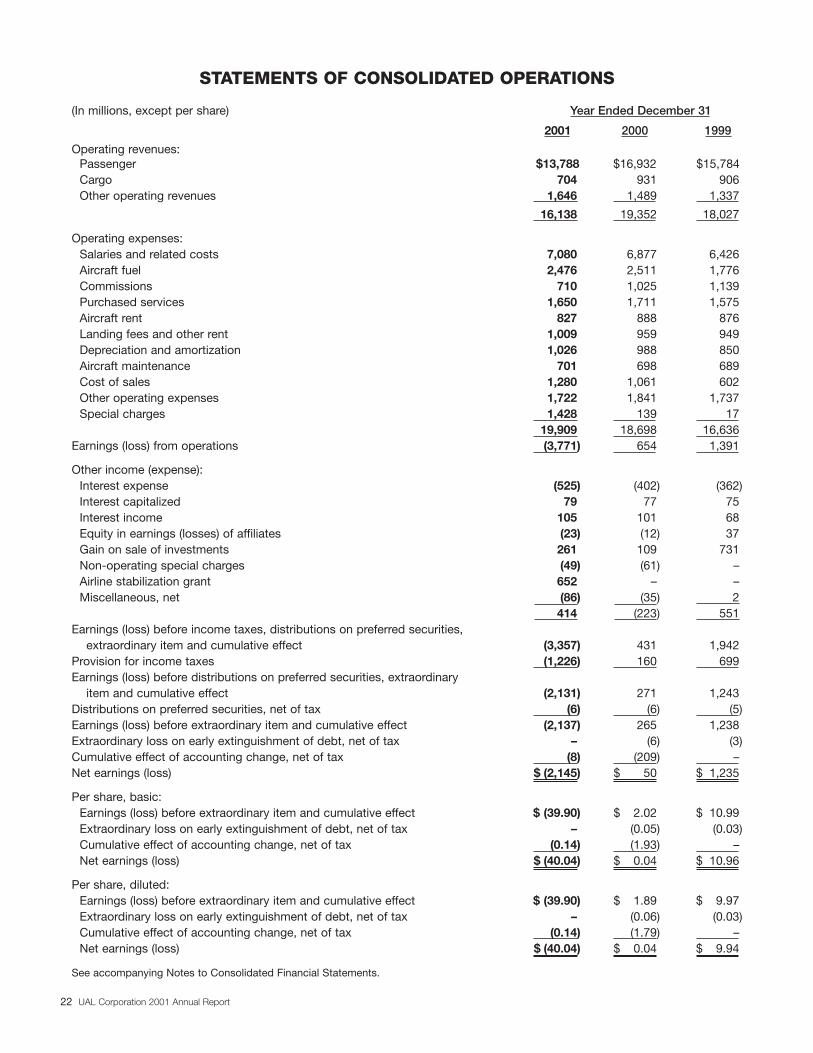
22 UAL Corporation 2001 Annual Report
KS
PO
TS
PO
TU
AL #30899 A
ssm:
NS
STATEMENTS OF CONSOLIDATED OPERATIONS
(In millions, except per share) Year Ended December 31
2001 2000 1999
Operating revenues:Passenger $13,788 $16,932 $15,784Cargo 704 931 906Other operating revenues 1,646 1,489 1,337
16,138 19,352 18,027
Operating expenses:Salaries and related costs 7,080 6,877 6,426Aircraft fuel 2,476 2,511 1,776Commissions 710 1,025 1,139Purchased services 1,650 1,711 1,575Aircraft rent 827 888 876Landing fees and other rent 1,009 959 949Depreciation and amortization 1,026 988 850Aircraft maintenance 701 698 689Cost of sales 1,280 1,061 602Other operating expenses 1,722 1,841 1,737Special charges 1,428 139 17
19,909 18,698 16,636Earnings (loss) from operations (3,771) 654 1,391
Other income (expense):Interest expense (525) (402) (362)Interest capitalized 79 77 75Interest income 105 101 68Equity in earnings (losses) of affiliates (23) (12) 37Gain on sale of investments 261 109 731Non-operating special charges (49) (61) –Airline stabilization grant 652 – –Miscellaneous, net (86) (35) 2
414 (223) 551Earnings (loss) before income taxes, distributions on preferred securities,
extraordinary item and cumulative effect (3,357) 431 1,942Provision for income taxes (1,226) 160 699Earnings (loss) before distributions on preferred securities, extraordinary
item and cumulative effect (2,131) 271 1,243Distributions on preferred securities, net of tax (6) (6) (5)Earnings (loss) before extraordinary item and cumulative effect (2,137) 265 1,238Extraordinary loss on early extinguishment of debt, net of tax – (6) (3)Cumulative effect of accounting change, net of tax (8) (209) –Net earnings (loss) $ (2,145) $ 50 $ 1,235
Per share, basic:Earnings (loss) before extraordinary item and cumulative effect $ (39.90) $ 2.02 $ 10.99Extraordinary loss on early extinguishment of debt, net of tax – (0.05) (0.03)Cumulative effect of accounting change, net of tax (0.14) (1.93) –Net earnings (loss) $ (40.04) $ 0.04 $ 10.96
Per share, diluted:Earnings (loss) before extraordinary item and cumulative effect $ (39.90) $ 1.89 $ 9.97Extraordinary loss on early extinguishment of debt, net of tax – (0.06) (0.03)Cumulative effect of accounting change, net of tax (0.14) (1.79) –Net earnings (loss) $ (40.04) $ 0.04 $ 9.94
See accompanying Notes to Consolidated Financial Statements.
30899_Body 3/22/02 6:16 PM Page 22
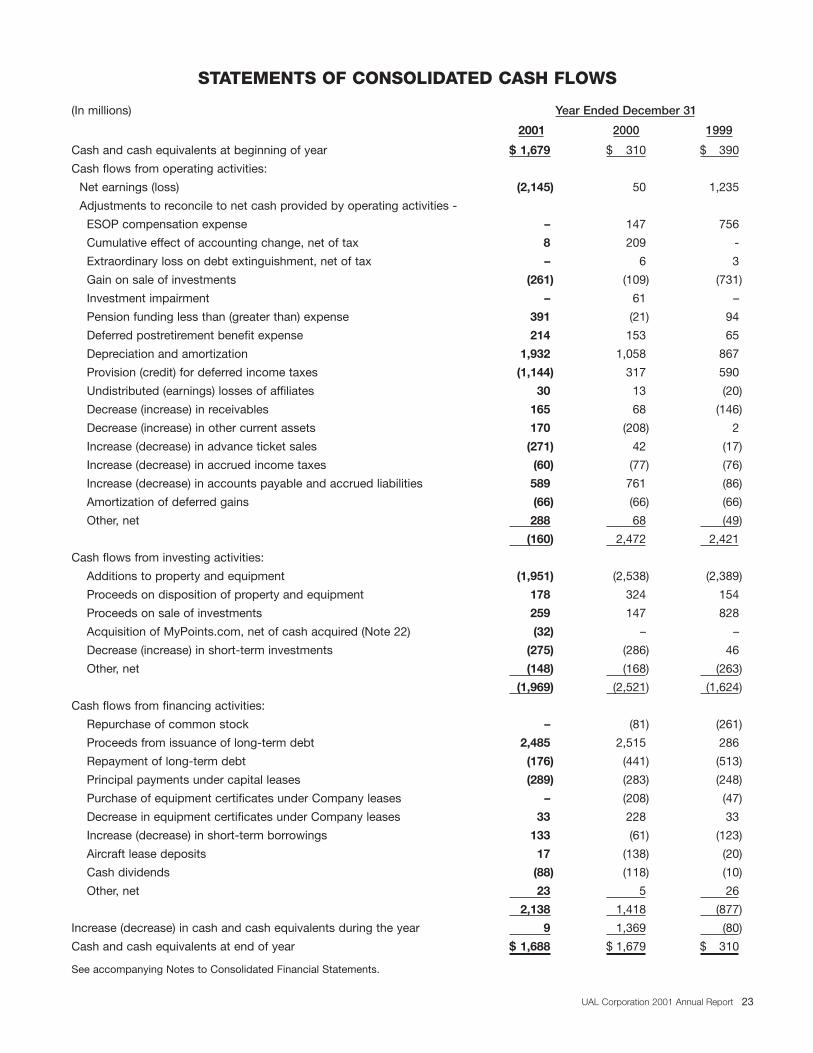
23UAL Corporation 2001 Annual Report
STATEMENTS OF CONSOLIDATED CASH FLOWS
(In millions) Year Ended December 31
2001 2000 1999
Cash and cash equivalents at beginning of year $ 1,679 $ 310 $ 390
Cash flows from operating activities:
Net earnings (loss) (2,145) 50 1,235
Adjustments to reconcile to net cash provided by operating activities -
ESOP compensation expense – 147 756
Cumulative effect of accounting change, net of tax 8 209 -
Extraordinary loss on debt extinguishment, net of tax – 6 3
Gain on sale of investments (261) (109) (731)
Investment impairment – 61 –
Pension funding less than (greater than) expense 391 (21) 94
Deferred postretirement benefit expense 214 153 65
Depreciation and amortization 1,932 1,058 867
Provision (credit) for deferred income taxes (1,144) 317 590
Undistributed (earnings) losses of affiliates 30 13 (20)
Decrease (increase) in receivables 165 68 (146)
Decrease (increase) in other current assets 170 (208) 2
Increase (decrease) in advance ticket sales (271) 42 (17)
Increase (decrease) in accrued income taxes (60) (77) (76)
Increase (decrease) in accounts payable and accrued liabilities 589 761 (86)
Amortization of deferred gains (66) (66) (66)
Other, net 288 68 (49)
(160) 2,472 2,421
Cash flows from investing activities:
Additions to property and equipment (1,951) (2,538) (2,389)
Proceeds on disposition of property and equipment 178 324 154
Proceeds on sale of investments 259 147 828
Acquisition of MyPoints.com, net of cash acquired (Note 22) (32) – –
Decrease (increase) in short-term investments (275) (286) 46
Other, net (148) (168) (263)
(1,969) (2,521) (1,624)
Cash flows from financing activities:
Repurchase of common stock – (81) (261)
Proceeds from issuance of long-term debt 2,485 2,515 286
Repayment of long-term debt (176) (441) (513)
Principal payments under capital leases (289) (283) (248)
Purchase of equipment certificates under Company leases – (208) (47)
Decrease in equipment certificates under Company leases 33 228 33
Increase (decrease) in short-term borrowings 133 (61) (123)
Aircraft lease deposits 17 (138) (20)
Cash dividends (88) (118) (10)
Other, net 23 5 26
2,138 1,418 (877)
Increase (decrease) in cash and cash equivalents during the year 9 1,369 (80)
Cash and cash equivalents at end of year $ 1,688 $ 1,679 $ 310
See accompanying Notes to Consolidated Financial Statements.
KS
PO
TS
PO
TU
AL
#30
899
Ass
m:
NS
30899_Body 3/22/02 6:16 PM Page 23
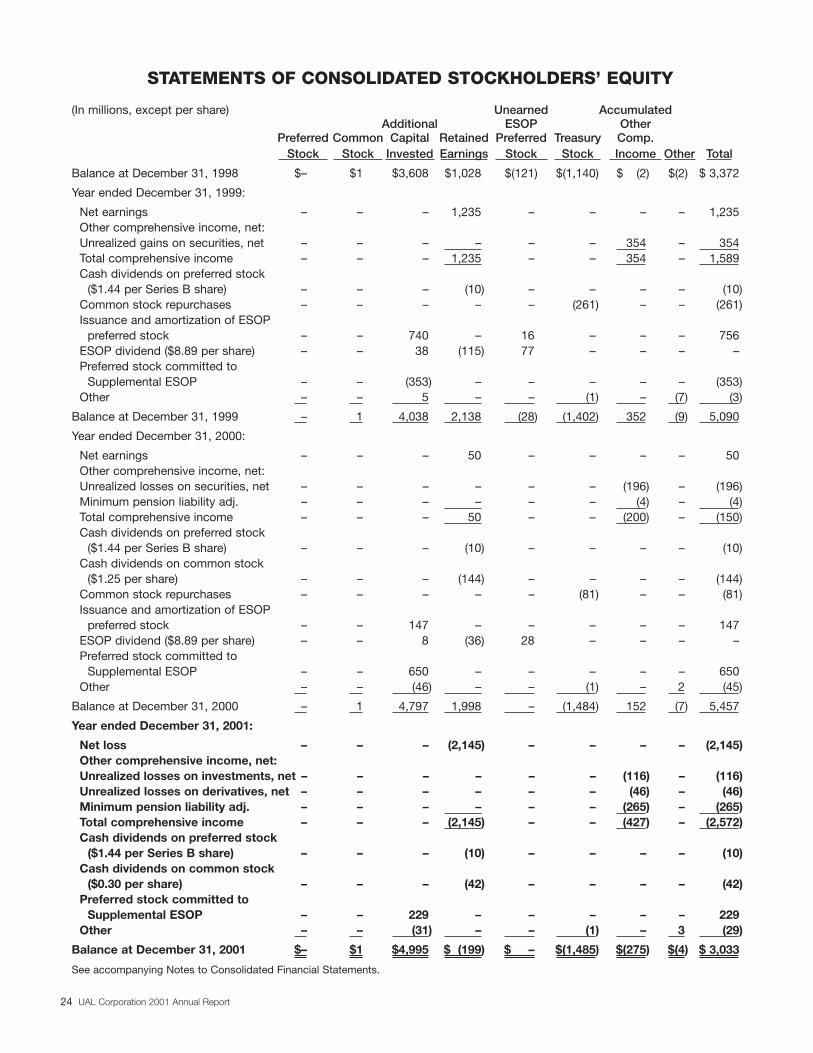
STATEMENTS OF CONSOLIDATED STOCKHOLDERS’ EQUITY
(In millions, except per share) Unearned AccumulatedAdditional ESOP Other
Preferred Common Capital Retained Preferred Treasury Comp.Stock Stock Invested Earnings Stock Stock Income Other Total
Balance at December 31, 1998 $– $1 $3,608 $1,028 $(121) $(1,140) $ (2) $(2) $ 3,372
Year ended December 31, 1999:
Net earnings – – – 1,235 – – – – 1,235Other comprehensive income, net:Unrealized gains on securities, net – – – – – – 354 – 354Total comprehensive income – – – 1,235 – – 354 – 1,589Cash dividends on preferred stock
($1.44 per Series B share) – – – (10) – – – – (10)Common stock repurchases – – – – – (261) – – (261)Issuance and amortization of ESOP
preferred stock – – 740 – 16 – – – 756ESOP dividend ($8.89 per share) – – 38 (115) 77 – – – –Preferred stock committed to
Supplemental ESOP – – (353) – – – – – (353)Other – – 5 – – (1) – (7) (3)
Balance at December 31, 1999 – 1 4,038 2,138 (28) (1,402) 352 (9) 5,090
Year ended December 31, 2000:
Net earnings – – – 50 – – – – 50Other comprehensive income, net:Unrealized losses on securities, net – – – – – – (196) – (196)Minimum pension liability adj. – – – – – – (4) – (4)Total comprehensive income – – – 50 – – (200) – (150)Cash dividends on preferred stock
($1.44 per Series B share) – – – (10) – – – – (10)Cash dividends on common stock
($1.25 per share) – – – (144) – – – – (144)Common stock repurchases – – – – – (81) – – (81)Issuance and amortization of ESOP
preferred stock – – 147 – – – – – 147ESOP dividend ($8.89 per share) – – 8 (36) 28 – – – –Preferred stock committed to
Supplemental ESOP – – 650 – – – – – 650Other – – (46) – – (1) – 2 (45)
Balance at December 31, 2000 – 1 4,797 1,998 – (1,484) 152 (7) 5,457
Year ended December 31, 2001:
Net loss – – – (2,145) – – – – (2,145)Other comprehensive income, net:Unrealized losses on investments, net – – – – – – (116) – (116)Unrealized losses on derivatives, net – – – – – – (46) – (46)Minimum pension liability adj. – – – – – – (265) – (265)Total comprehensive income – – – (2,145) – – (427) – (2,572)Cash dividends on preferred stock
($1.44 per Series B share) – – – (10) – – – – (10)Cash dividends on common stock
($0.30 per share) – – – (42) – – – – (42)Preferred stock committed to
Supplemental ESOP – – 229 – – – – – 229Other – – (31) – – (1) – 3 (29)
Balance at December 31, 2001 $– $1 $4,995 $ (199) $ – $(1,485) $(275) $(4) $ 3,033
See accompanying Notes to Consolidated Financial Statements.
24 UAL Corporation 2001 Annual Report
KS
PO
TS
PO
TU
AL #30899 A
ssm:
NS
30899_Body 3/22/02 6:16 PM Page 24
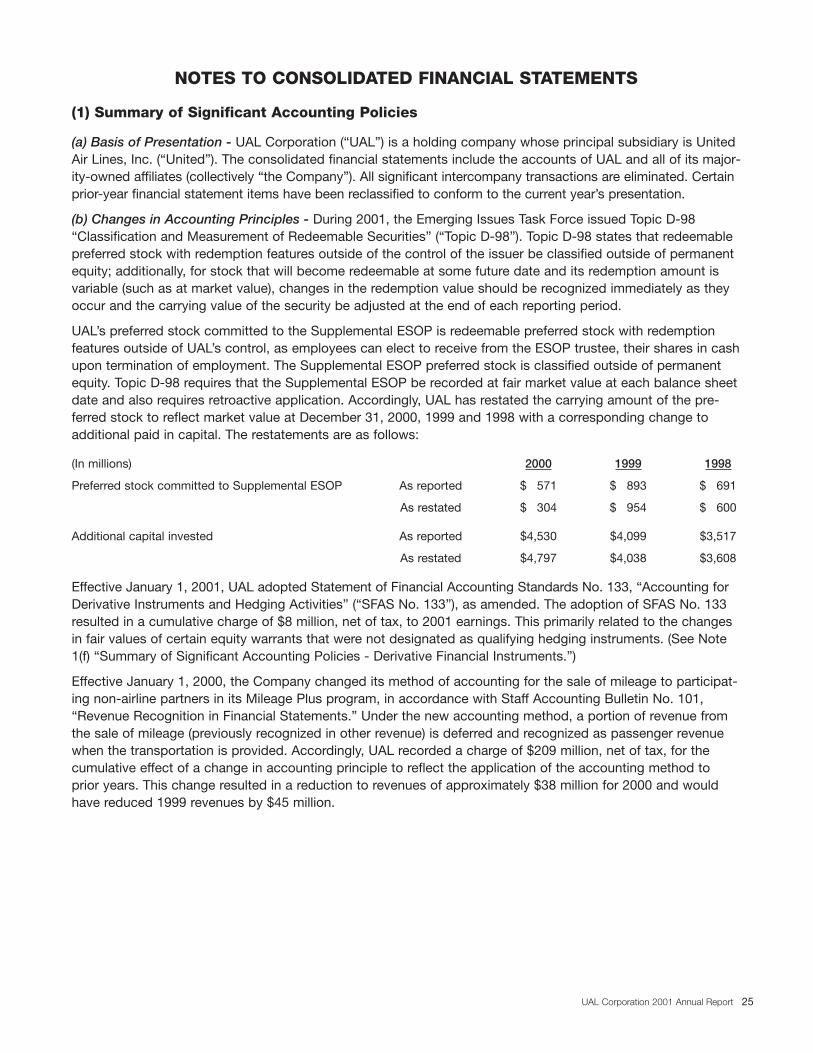
NOTES TO CONSOLIDATED FINANCIAL STATEMENTS
(1) Summary of Significant Accounting Policies
(a) Basis of Presentation - UAL Corporation (“UAL”) is a holding company whose principal subsidiary is UnitedAir Lines, Inc. (“United”). The consolidated financial statements include the accounts of UAL and all of its major-ity-owned affiliates (collectively “the Company”). All significant intercompany transactions are eliminated. Certainprior-year financial statement items have been reclassified to conform to the current year’s presentation.
(b) Changes in Accounting Principles - During 2001, the Emerging Issues Task Force issued Topic D-98“Classification and Measurement of Redeemable Securities” (“Topic D-98”). Topic D-98 states that redeemablepreferred stock with redemption features outside of the control of the issuer be classified outside of permanentequity; additionally, for stock that will become redeemable at some future date and its redemption amount isvariable (such as at market value), changes in the redemption value should be recognized immediately as theyoccur and the carrying value of the security be adjusted at the end of each reporting period.
UAL’s preferred stock committed to the Supplemental ESOP is redeemable preferred stock with redemptionfeatures outside of UAL’s control, as employees can elect to receive from the ESOP trustee, their shares in cashupon termination of employment. The Supplemental ESOP preferred stock is classified outside of permanentequity. Topic D-98 requires that the Supplemental ESOP be recorded at fair market value at each balance sheetdate and also requires retroactive application. Accordingly, UAL has restated the carrying amount of the pre-ferred stock to reflect market value at December 31, 2000, 1999 and 1998 with a corresponding change toadditional paid in capital. The restatements are as follows:
(In millions) 2000 1999 1998
Preferred stock committed to Supplemental ESOP As reported $ 571 $ 893 $ 691
As restated $ 304 $ 954 $ 600
Additional capital invested As reported $4,530 $4,099 $3,517
As restated $4,797 $4,038 $3,608
Effective January 1, 2001, UAL adopted Statement of Financial Accounting Standards No. 133, “Accounting forDerivative Instruments and Hedging Activities” (“SFAS No. 133”), as amended. The adoption of SFAS No. 133resulted in a cumulative charge of $8 million, net of tax, to 2001 earnings. This primarily related to the changesin fair values of certain equity warrants that were not designated as qualifying hedging instruments. (See Note1(f) “Summary of Significant Accounting Policies - Derivative Financial Instruments.”)
Effective January 1, 2000, the Company changed its method of accounting for the sale of mileage to participat-ing non-airline partners in its Mileage Plus program, in accordance with Staff Accounting Bulletin No. 101,“Revenue Recognition in Financial Statements.” Under the new accounting method, a portion of revenue fromthe sale of mileage (previously recognized in other revenue) is deferred and recognized as passenger revenuewhen the transportation is provided. Accordingly, UAL recorded a charge of $209 million, net of tax, for thecumulative effect of a change in accounting principle to reflect the application of the accounting method toprior years. This change resulted in a reduction to revenues of approximately $38 million for 2000 and wouldhave reduced 1999 revenues by $45 million.
25UAL Corporation 2001 Annual Report
KS
PO
TS
PO
TU
AL
#30
899
Ass
m:
NS
30899_Body 3/22/02 6:16 PM Page 25
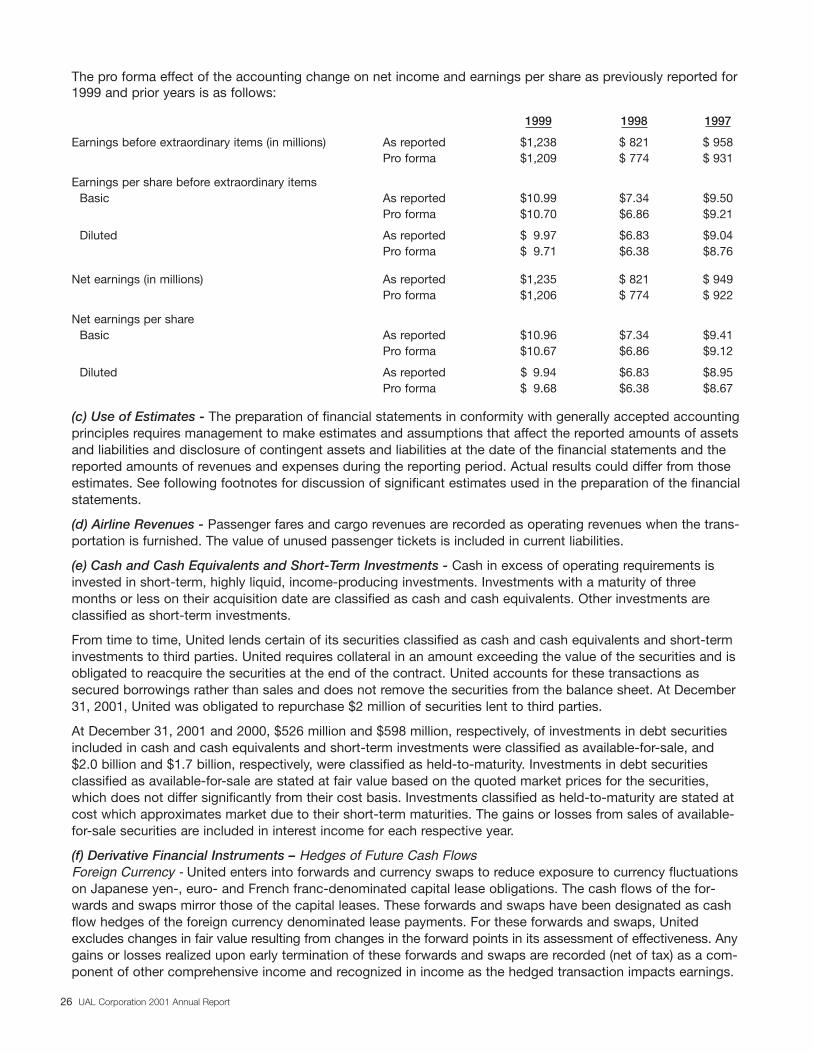
The pro forma effect of the accounting change on net income and earnings per share as previously reported for1999 and prior years is as follows:
1999 1998 1997
Earnings before extraordinary items (in millions) As reported $1,238 $ 821 $ 958Pro forma $1,209 $ 774 $ 931
Earnings per share before extraordinary itemsBasic As reported $10.99 $7.34 $9.50
Pro forma $10.70 $6.86 $9.21
Diluted As reported $ 9.97 $6.83 $9.04Pro forma $ 9.71 $6.38 $8.76
Net earnings (in millions) As reported $1,235 $ 821 $ 949Pro forma $1,206 $ 774 $ 922
Net earnings per shareBasic As reported $10.96 $7.34 $9.41
Pro forma $10.67 $6.86 $9.12
Diluted As reported $ 9.94 $6.83 $8.95Pro forma $ 9.68 $6.38 $8.67
(c) Use of Estimates - The preparation of financial statements in conformity with generally accepted accountingprinciples requires management to make estimates and assumptions that affect the reported amounts of assetsand liabilities and disclosure of contingent assets and liabilities at the date of the financial statements and thereported amounts of revenues and expenses during the reporting period. Actual results could differ from thoseestimates. See following footnotes for discussion of significant estimates used in the preparation of the financialstatements.
(d) Airline Revenues - Passenger fares and cargo revenues are recorded as operating revenues when the trans-portation is furnished. The value of unused passenger tickets is included in current liabilities.
(e) Cash and Cash Equivalents and Short-Term Investments - Cash in excess of operating requirements isinvested in short-term, highly liquid, income-producing investments. Investments with a maturity of threemonths or less on their acquisition date are classified as cash and cash equivalents. Other investments areclassified as short-term investments.
From time to time, United lends certain of its securities classified as cash and cash equivalents and short-terminvestments to third parties. United requires collateral in an amount exceeding the value of the securities and isobligated to reacquire the securities at the end of the contract. United accounts for these transactions assecured borrowings rather than sales and does not remove the securities from the balance sheet. At December31, 2001, United was obligated to repurchase $2 million of securities lent to third parties.
At December 31, 2001 and 2000, $526 million and $598 million, respectively, of investments in debt securitiesincluded in cash and cash equivalents and short-term investments were classified as available-for-sale, and$2.0 billion and $1.7 billion, respectively, were classified as held-to-maturity. Investments in debt securitiesclassified as available-for-sale are stated at fair value based on the quoted market prices for the securities,which does not differ significantly from their cost basis. Investments classified as held-to-maturity are stated atcost which approximates market due to their short-term maturities. The gains or losses from sales of available-for-sale securities are included in interest income for each respective year.
(f) Derivative Financial Instruments – Hedges of Future Cash FlowsForeign Currency - United enters into forwards and currency swaps to reduce exposure to currency fluctuationson Japanese yen-, euro- and French franc-denominated capital lease obligations. The cash flows of the for-wards and swaps mirror those of the capital leases. These forwards and swaps have been designated as cashflow hedges of the foreign currency denominated lease payments. For these forwards and swaps, Unitedexcludes changes in fair value resulting from changes in the forward points in its assessment of effectiveness. Anygains or losses realized upon early termination of these forwards and swaps are recorded (net of tax) as a com-ponent of other comprehensive income and recognized in income as the hedged transaction impacts earnings.
26 UAL Corporation 2001 Annual Report
KS
PO
TS
PO
TU
AL #30899 A
ssm:
NS
30899_Body 3/22/02 6:16 PM Page 26
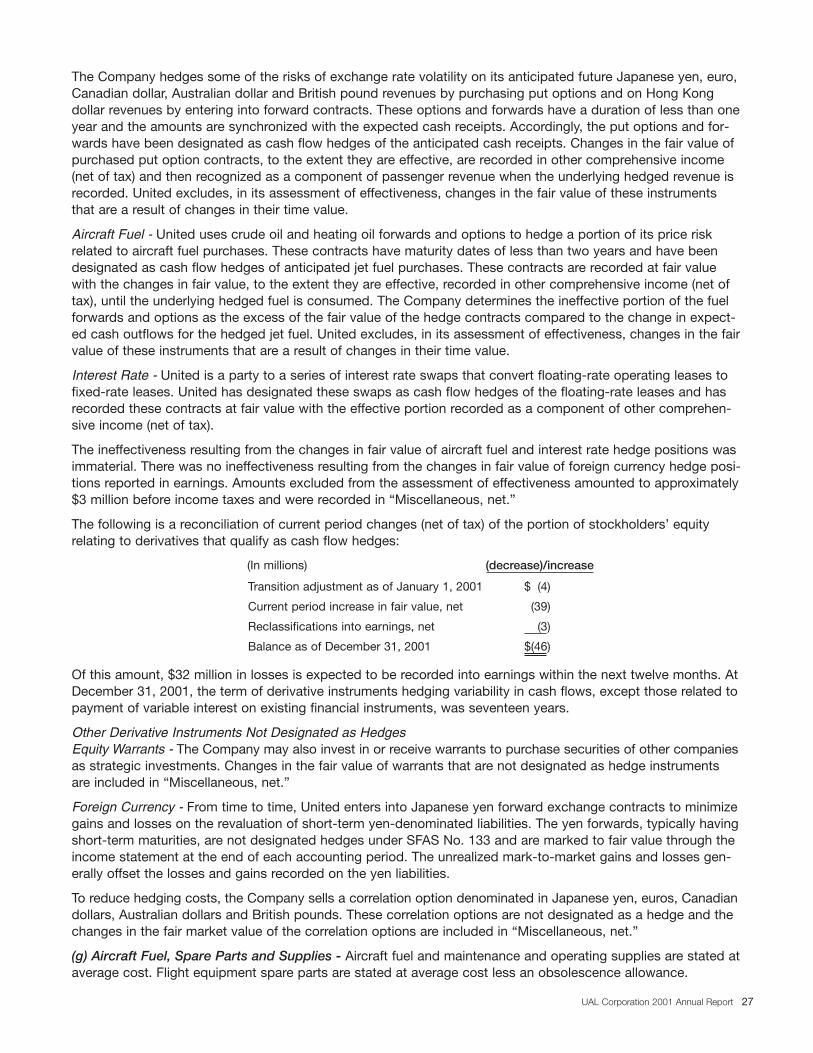
The Company hedges some of the risks of exchange rate volatility on its anticipated future Japanese yen, euro,Canadian dollar, Australian dollar and British pound revenues by purchasing put options and on Hong Kongdollar revenues by entering into forward contracts. These options and forwards have a duration of less than oneyear and the amounts are synchronized with the expected cash receipts. Accordingly, the put options and for-wards have been designated as cash flow hedges of the anticipated cash receipts. Changes in the fair value ofpurchased put option contracts, to the extent they are effective, are recorded in other comprehensive income(net of tax) and then recognized as a component of passenger revenue when the underlying hedged revenue isrecorded. United excludes, in its assessment of effectiveness, changes in the fair value of these instrumentsthat are a result of changes in their time value.
Aircraft Fuel - United uses crude oil and heating oil forwards and options to hedge a portion of its price riskrelated to aircraft fuel purchases. These contracts have maturity dates of less than two years and have beendesignated as cash flow hedges of anticipated jet fuel purchases. These contracts are recorded at fair valuewith the changes in fair value, to the extent they are effective, recorded in other comprehensive income (net oftax), until the underlying hedged fuel is consumed. The Company determines the ineffective portion of the fuelforwards and options as the excess of the fair value of the hedge contracts compared to the change in expect-ed cash outflows for the hedged jet fuel. United excludes, in its assessment of effectiveness, changes in the fairvalue of these instruments that are a result of changes in their time value.
Interest Rate - United is a party to a series of interest rate swaps that convert floating-rate operating leases tofixed-rate leases. United has designated these swaps as cash flow hedges of the floating-rate leases and hasrecorded these contracts at fair value with the effective portion recorded as a component of other comprehen-sive income (net of tax).
The ineffectiveness resulting from the changes in fair value of aircraft fuel and interest rate hedge positions wasimmaterial. There was no ineffectiveness resulting from the changes in fair value of foreign currency hedge posi-tions reported in earnings. Amounts excluded from the assessment of effectiveness amounted to approximately$3 million before income taxes and were recorded in “Miscellaneous, net.”
The following is a reconciliation of current period changes (net of tax) of the portion of stockholders’ equityrelating to derivatives that qualify as cash flow hedges:
(In millions) (decrease)/increase
Transition adjustment as of January 1, 2001 $ (4)
Current period increase in fair value, net (39)
Reclassifications into earnings, net (3)
Balance as of December 31, 2001 $(46)
Of this amount, $32 million in losses is expected to be recorded into earnings within the next twelve months. AtDecember 31, 2001, the term of derivative instruments hedging variability in cash flows, except those related topayment of variable interest on existing financial instruments, was seventeen years.
Other Derivative Instruments Not Designated as HedgesEquity Warrants - The Company may also invest in or receive warrants to purchase securities of other companiesas strategic investments. Changes in the fair value of warrants that are not designated as hedge instrumentsare included in “Miscellaneous, net.”
Foreign Currency - From time to time, United enters into Japanese yen forward exchange contracts to minimizegains and losses on the revaluation of short-term yen-denominated liabilities. The yen forwards, typically havingshort-term maturities, are not designated hedges under SFAS No. 133 and are marked to fair value through theincome statement at the end of each accounting period. The unrealized mark-to-market gains and losses gen-erally offset the losses and gains recorded on the yen liabilities.
To reduce hedging costs, the Company sells a correlation option denominated in Japanese yen, euros, Canadiandollars, Australian dollars and British pounds. These correlation options are not designated as a hedge and thechanges in the fair market value of the correlation options are included in “Miscellaneous, net.”
(g) Aircraft Fuel, Spare Parts and Supplies - Aircraft fuel and maintenance and operating supplies are stated ataverage cost. Flight equipment spare parts are stated at average cost less an obsolescence allowance.
27UAL Corporation 2001 Annual Report
KS
PO
TS
PO
TU
AL
#30
899
Ass
m:
NS
30899_Body 3/22/02 6:16 PM Page 27
(h) Operating Property and Equipment - Owned operating property and equipment is stated at cost. Propertyunder capital leases, and the related obligation for future lease payments, are initially recorded at an amountequal to the then present value of those lease payments.
Depreciation and amortization of owned depreciable assets is based on the straight-line method over their estimated service lives. Leasehold improvements are amortized over the remaining period of the lease or theestimated service life of the related asset, whichever is less. Aircraft are depreciated to estimated salvage values,generally over lives of 4 to 30 years; buildings are depreciated over lives of 25 to 45 years; and other propertyand equipment are depreciated over lives of 3 to 15 years.
Properties under capital leases are amortized on the straight-line method over the life of the lease, or in the case ofcertain aircraft, over their estimated service lives. Lease terms are 10 to 30 years for aircraft and flight simulatorsand 25 years for buildings. Amortization of capital leases is included in depreciation and amortization expense.
Maintenance and repairs, including the cost of minor replacements, are charged to maintenance expenseaccounts. Costs of additions to and renewals of units of property are charged to property and equipment accounts.
(i) Mileage Plus Awards - United accrues the estimated incremental cost of providing free travel awards earnedunder its Mileage Plus frequent flyer program when such award levels are reached. United, through its whollyowned subsidiary, Mileage Plus Holdings, Inc., sells mileage credits to participating partners in the Mileage Plus program.
(j) Deferred Gains - Gains on aircraft sale and leaseback transactions are deferred and amortized over the livesof the leases as a reduction of rental expense.
(k) United Express - United has marketing agreements under which independent regional carriers, flying underthe United Express name, feed United’s mainline flying. United pays these carriers on a fee-per-departure basis and includes the revenues derived from the carriers in passenger revenue, net of expenses. In addition,United has call options that are exercisable under certain conditions, on 22 regional jets owned or leased bythese carriers.
(l) Advertising - Advertising costs, which are included in other operating expenses, are expensed as incurred.Advertising expense was $217 million, $269 million and $232 million for the years ended December 31, 2001,2000 and 1999, respectively.
(m) Intangibles - Intangibles consist primarily of route acquisition costs and intangible pension assets (see Note18 “Retirement and Postretirement Plans”). Route acquisition costs are amortized over 40 years. During 2001,the Financial Accounting Standards Board (“FASB”) issued Statement of Accounting Standards No. 142,“Goodwill and Other Intangible Assets” (“SFAS No. 142”) which the Company intends to adopt in January 2002.See Other Information, “New Accounting Pronouncements” in Management’s Discussion and Analysis ofFinancial Condition and Results of Operations.
(n) Measurement of Impairments - In accordance with Statement of Financial Accounting Standards No. 121,“Accounting for the Impairment of Long-Lived Assets and for Long-Lived Assets to be Disposed Of” (“SFASNo. 121”), the Company records impairment losses on long-lived assets used in operations when events andcircumstances indicate that the assets might be impaired and the undiscounted cash flows estimated to begenerated by those assets are less than the carrying value of those assets. In August 2001, the FASB issuedSFAS No. 144 which supersedes SFAS No. 121. See Other Information, “New Accounting Pronouncements” inManagement’s Discussion and Analysis of Financial Condition and Results of Operations.
(2) Special Charges Related to the September 11 Terrorist Attacks
On September 11, 2001, two United aircraft were hijacked and destroyed in terrorist attacks on The WorldTrade Center in New York City and in a crash near Johnstown, Pennsylvania. On the same day, two AmericanAirlines aircraft were also hijacked and used in terrorist attacks on The World Trade Center and the Pentagon. Inaddition to the loss of all passengers and crew on board the aircraft, these attacks resulted in numerous deathsand injuries to persons on the ground and massive property damage. In the immediate aftermath of the attacks,the Federal Aviation Administration (“FAA”) ordered all aircraft operating in the U.S. grounded immediately. Thisgrounding effectively lasted for three days, and the Company was able to operate only a portion of its scheduledflights for several days thereafter. When flights were permitted to resume, passenger traffic and yields were
28 UAL Corporation 2001 Annual Report
KS
PO
TS
PO
TU
AL #30899 A
ssm:
NS
30899_Body 3/22/02 6:16 PM Page 28
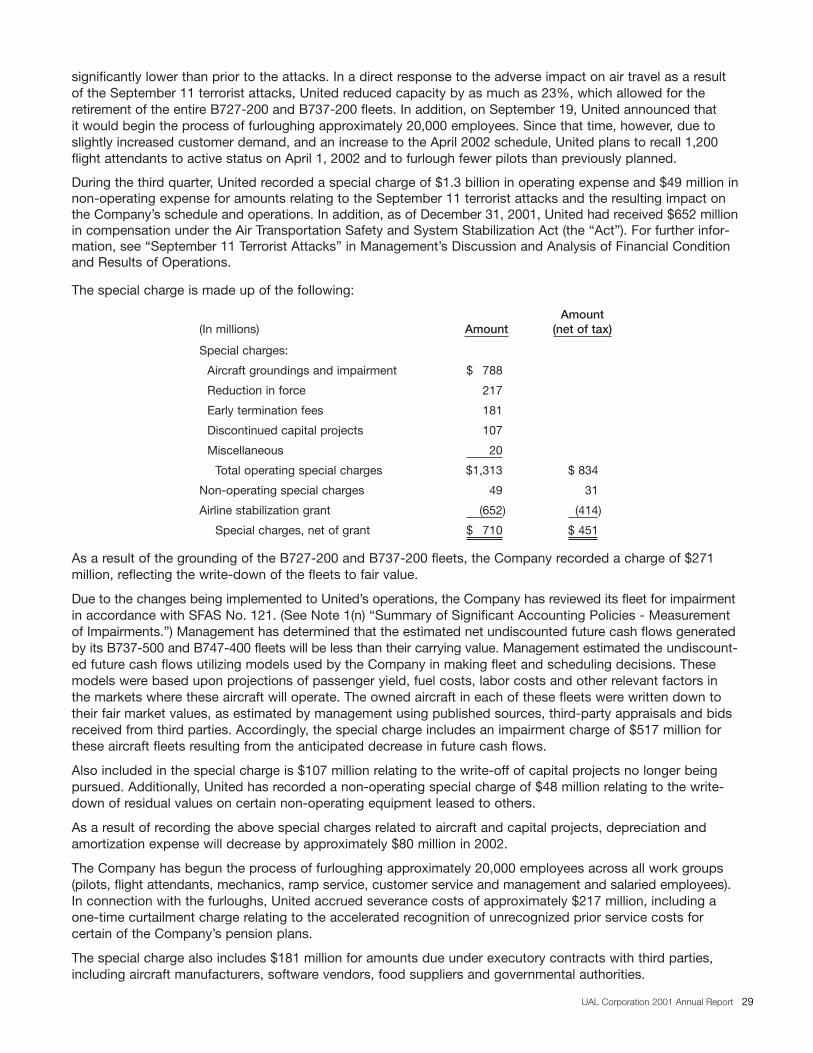
significantly lower than prior to the attacks. In a direct response to the adverse impact on air travel as a resultof the September 11 terrorist attacks, United reduced capacity by as much as 23%, which allowed for theretirement of the entire B727-200 and B737-200 fleets. In addition, on September 19, United announced that it would begin the process of furloughing approximately 20,000 employees. Since that time, however, due toslightly increased customer demand, and an increase to the April 2002 schedule, United plans to recall 1,200flight attendants to active status on April 1, 2002 and to furlough fewer pilots than previously planned.
During the third quarter, United recorded a special charge of $1.3 billion in operating expense and $49 million innon-operating expense for amounts relating to the September 11 terrorist attacks and the resulting impact onthe Company’s schedule and operations. In addition, as of December 31, 2001, United had received $652 millionin compensation under the Air Transportation Safety and System Stabilization Act (the “Act”). For further infor-mation, see “September 11 Terrorist Attacks” in Management’s Discussion and Analysis of Financial Conditionand Results of Operations.
The special charge is made up of the following:
Amount(In millions) Amount (net of tax)
Special charges:
Aircraft groundings and impairment $ 788
Reduction in force 217
Early termination fees 181
Discontinued capital projects 107
Miscellaneous 20
Total operating special charges $1,313 $ 834
Non-operating special charges 49 31
Airline stabilization grant (652) (414)
Special charges, net of grant $ 710 $ 451
As a result of the grounding of the B727-200 and B737-200 fleets, the Company recorded a charge of $271 million, reflecting the write-down of the fleets to fair value.
Due to the changes being implemented to United’s operations, the Company has reviewed its fleet for impairmentin accordance with SFAS No. 121. (See Note 1(n) “Summary of Significant Accounting Policies - Measurementof Impairments.”) Management has determined that the estimated net undiscounted future cash flows generatedby its B737-500 and B747-400 fleets will be less than their carrying value. Management estimated the undiscount-ed future cash flows utilizing models used by the Company in making fleet and scheduling decisions. Thesemodels were based upon projections of passenger yield, fuel costs, labor costs and other relevant factors in the markets where these aircraft will operate. The owned aircraft in each of these fleets were written down totheir fair market values, as estimated by management using published sources, third-party appraisals and bidsreceived from third parties. Accordingly, the special charge includes an impairment charge of $517 million forthese aircraft fleets resulting from the anticipated decrease in future cash flows.
Also included in the special charge is $107 million relating to the write-off of capital projects no longer beingpursued. Additionally, United has recorded a non-operating special charge of $48 million relating to the write-down of residual values on certain non-operating equipment leased to others.
As a result of recording the above special charges related to aircraft and capital projects, depreciation andamortization expense will decrease by approximately $80 million in 2002.
The Company has begun the process of furloughing approximately 20,000 employees across all work groups(pilots, flight attendants, mechanics, ramp service, customer service and management and salaried employees).In connection with the furloughs, United accrued severance costs of approximately $217 million, including aone-time curtailment charge relating to the accelerated recognition of unrecognized prior service costs for certain of the Company’s pension plans.
The special charge also includes $181 million for amounts due under executory contracts with third parties,including aircraft manufacturers, software vendors, food suppliers and governmental authorities.
29UAL Corporation 2001 Annual Report
KS
PO
TS
PO
TU
AL
#30
899
Ass
m:
NS
30899_Body 3/22/02 6:16 PM Page 29
Since the announcement of the reduction in force, approximately 19,000 employees have been furloughed, separated, elected special leave of absence, or retired. Of this amount, approximately 4,200 employees are onspecial leave with full benefits for up to two years.
United had accrued $134 million related to the reduction in force and $181 million related to early terminationfees at September 30, 2001. During the fourth quarter, United paid $47 million in severance-related costs and$10 million in early termination fees, bringing the accruals for the reduction in force and early termination feesto $87 million and $171 million, respectively, at December 31, 2001.
(3) Employee Stock Ownership Plans and Recapitalization
On July 12, 1994, the stockholders of UAL approved a plan of recapitalization to provide an approximately 55%equity interest in UAL to certain employees of United in exchange for wage concessions and work-rule changes.The employees’ equity interest was allocated to individual employees through the year 2000 under EmployeeStock Ownership Plans (“ESOPs”) which were created as a part of the recapitalization.
The ESOPs cover employees represented by the Air Line Pilots Association, International (“ALPA”), the Interna-tional Association of Machinists and Aerospace Workers (“IAM”) and U.S. management and salaried employees andinclude a “Leveraged ESOP,” a “Non-Leveraged ESOP” and a “Supplemental ESOP.” Both the Leveraged ESOPand the Non-Leveraged ESOP are tax-qualified plans while the Supplemental ESOP is not a tax-qualified plan.
The equity interests were delivered to employees through two classes of preferred stock (Class 1 and Class 2ESOP Preferred Stock, collectively “ESOP Preferred Stock”), and the voting interests were delivered throughthree separate classes of preferred stocks (Class P, M and S Voting Preferred Stock, collectively, “Voting Pre-ferred Stock”). The Class 1 ESOP Preferred Stock was delivered to an ESOP trust in seven separate salesunder the Leveraged ESOP, the last of which occurred on January 5, 2000. Based on Internal Revenue CodeLimitations, shares of the Class 2 ESOP Preferred Stock were either contributed to the Non-Leveraged ESOP or allocated as “book entry” shares to the Supplemental ESOP annually through the year 2000. The classes ofpreferred stock are described more fully in Note 15 “ESOP Preferred Stock.”
Shares of ESOP Preferred Stock were legally released or allocated to employee accounts as of year-end. Thefinal allocation of shares occurred in March 2001 as follows: 669,966 shares of Class 1 ESOP Preferred Stock,167,523 shares of Class 2 ESOP Preferred Stock and 834,726 shares of Voting Preferred Stock were allocatedto employee accounts, and another 20,007 shares of Class 2 ESOP Preferred Stock were allocated in the formof “book entry” shares, effective December 31, 2000. In addition, during 2001, 152,620 shares of Class 2 ESOPPreferred Stock previously allocated in book entry form were issued and either contributed to the qualified planor converted and sold on behalf of terminating employees.
For the Class 2 ESOP Preferred Stock committed to be contributed to employees under the SupplementalESOP, employees can elect to receive their “book entry” shares in cash upon termination of employment. AtDecember 31, 2001, there were 1,430,536 book entry shares outstanding under the Supplemental ESOP. Theestimated fair value of such shares at December 31, 2001 and 2000 is reflected in the Statements of Consoli-dated Financial Position as discussed in Note 1(b) “Summary of Significant Accounting Policies - Changes inAccounting Principles.”
(4) Other Income (Expense) - Miscellaneous
Included in Other income (expense) - “Miscellaneous, net” was $(21) million, $(22) million and $4 million of foreignexchange gains (losses) in 2001, 2000 and 1999, respectively.
(5) Per Share Amounts
Basic earnings per share were computed by dividing net income before extraordinary item and cumulativeeffect by the weighted-average number of shares of common stock outstanding during the year and potentialparticipating ESOP preferred shares in periods where such shares are dilutive using the if-converted method. In addition, diluted earnings per share amounts include potential common shares, including common sharesissuable upon conversion of ESOP shares committed to be released.
30 UAL Corporation 2001 Annual Report
KS
PO
TS
PO
TU
AL #30899 A
ssm:
NS
30899_Body 3/22/02 6:16 PM Page 30
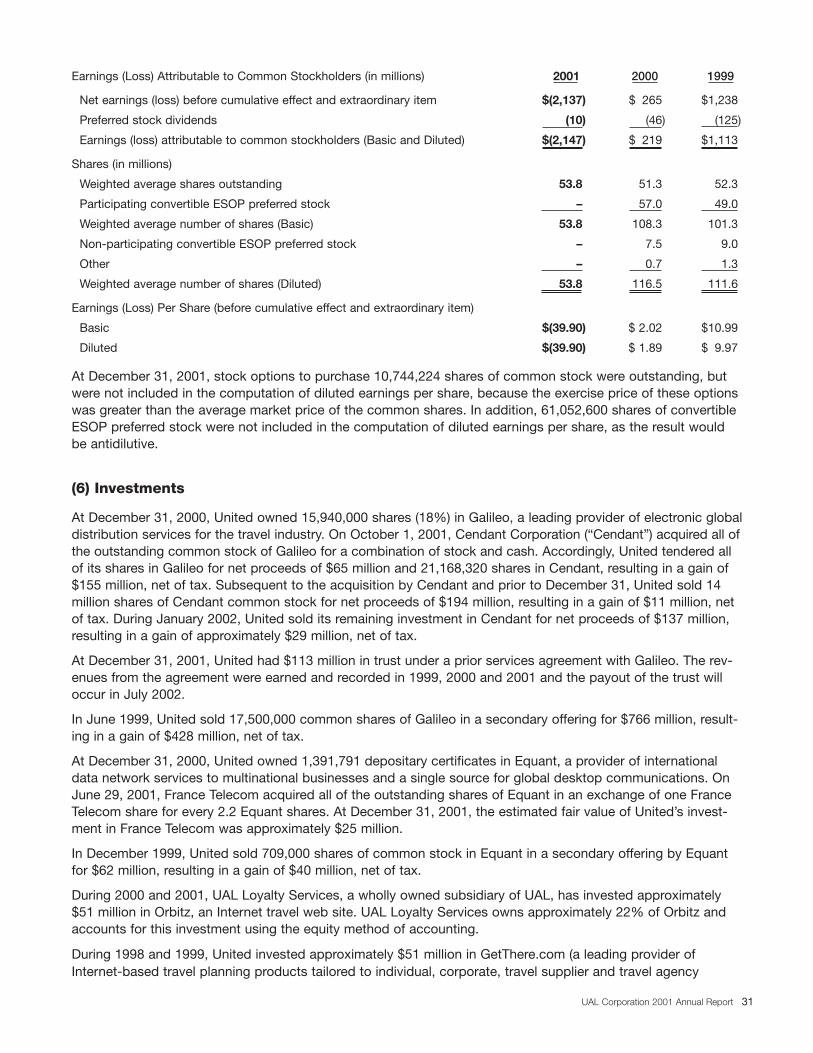
Earnings (Loss) Attributable to Common Stockholders (in millions) 2001 2000 1999
Net earnings (loss) before cumulative effect and extraordinary item $(2,137) $ 265 $1,238
Preferred stock dividends (10) (46) (125)
Earnings (loss) attributable to common stockholders (Basic and Diluted) $(2,147) $ 219 $1,113
Shares (in millions)
Weighted average shares outstanding 53.8 51.3 52.3
Participating convertible ESOP preferred stock – 57.0 49.0
Weighted average number of shares (Basic) 53.8 108.3 101.3
Non-participating convertible ESOP preferred stock – 7.5 9.0
Other – 0.7 1.3
Weighted average number of shares (Diluted) 53.8 116.5 111.6
Earnings (Loss) Per Share (before cumulative effect and extraordinary item)
Basic $(39.90) $ 2.02 $10.99
Diluted $(39.90) $ 1.89 $ 9.97
At December 31, 2001, stock options to purchase 10,744,224 shares of common stock were outstanding, butwere not included in the computation of diluted earnings per share, because the exercise price of these optionswas greater than the average market price of the common shares. In addition, 61,052,600 shares of convertibleESOP preferred stock were not included in the computation of diluted earnings per share, as the result wouldbe antidilutive.
(6) Investments
At December 31, 2000, United owned 15,940,000 shares (18%) in Galileo, a leading provider of electronic globaldistribution services for the travel industry. On October 1, 2001, Cendant Corporation (“Cendant”) acquired all ofthe outstanding common stock of Galileo for a combination of stock and cash. Accordingly, United tendered allof its shares in Galileo for net proceeds of $65 million and 21,168,320 shares in Cendant, resulting in a gain of$155 million, net of tax. Subsequent to the acquisition by Cendant and prior to December 31, United sold 14million shares of Cendant common stock for net proceeds of $194 million, resulting in a gain of $11 million, netof tax. During January 2002, United sold its remaining investment in Cendant for net proceeds of $137 million,resulting in a gain of approximately $29 million, net of tax.
At December 31, 2001, United had $113 million in trust under a prior services agreement with Galileo. The rev-enues from the agreement were earned and recorded in 1999, 2000 and 2001 and the payout of the trust willoccur in July 2002.
In June 1999, United sold 17,500,000 common shares of Galileo in a secondary offering for $766 million, result-ing in a gain of $428 million, net of tax.
At December 31, 2000, United owned 1,391,791 depositary certificates in Equant, a provider of internationaldata network services to multinational businesses and a single source for global desktop communications. OnJune 29, 2001, France Telecom acquired all of the outstanding shares of Equant in an exchange of one FranceTelecom share for every 2.2 Equant shares. At December 31, 2001, the estimated fair value of United’s invest-ment in France Telecom was approximately $25 million.
In December 1999, United sold 709,000 shares of common stock in Equant in a secondary offering by Equantfor $62 million, resulting in a gain of $40 million, net of tax.
During 2000 and 2001, UAL Loyalty Services, a wholly owned subsidiary of UAL, has invested approximately$51 million in Orbitz, an Internet travel web site. UAL Loyalty Services owns approximately 22% of Orbitz andaccounts for this investment using the equity method of accounting.
During 1998 and 1999, United invested approximately $51 million in GetThere.com (a leading provider ofInternet-based travel planning products tailored to individual, corporate, travel supplier and travel agency
31UAL Corporation 2001 Annual Report
KS
PO
TS
PO
TU
AL
#30
899
Ass
m:
NS
30899_Body 3/22/02 6:16 PM Page 31
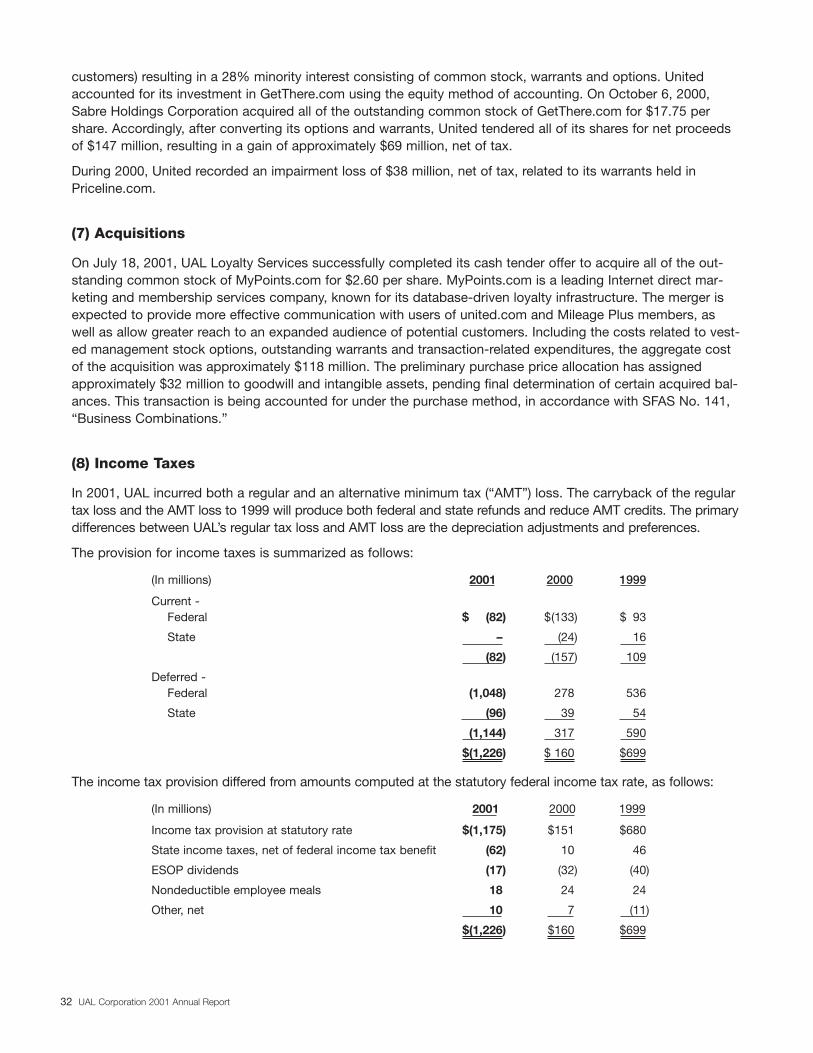
customers) resulting in a 28% minority interest consisting of common stock, warrants and options. Unitedaccounted for its investment in GetThere.com using the equity method of accounting. On October 6, 2000,Sabre Holdings Corporation acquired all of the outstanding common stock of GetThere.com for $17.75 pershare. Accordingly, after converting its options and warrants, United tendered all of its shares for net proceedsof $147 million, resulting in a gain of approximately $69 million, net of tax.
During 2000, United recorded an impairment loss of $38 million, net of tax, related to its warrants held inPriceline.com.
(7) Acquisitions
On July 18, 2001, UAL Loyalty Services successfully completed its cash tender offer to acquire all of the out-standing common stock of MyPoints.com for $2.60 per share. MyPoints.com is a leading Internet direct mar-keting and membership services company, known for its database-driven loyalty infrastructure. The merger isexpected to provide more effective communication with users of united.com and Mileage Plus members, aswell as allow greater reach to an expanded audience of potential customers. Including the costs related to vest-ed management stock options, outstanding warrants and transaction-related expenditures, the aggregate costof the acquisition was approximately $118 million. The preliminary purchase price allocation has assignedapproximately $32 million to goodwill and intangible assets, pending final determination of certain acquired bal-ances. This transaction is being accounted for under the purchase method, in accordance with SFAS No. 141,“Business Combinations.”
(8) Income Taxes
In 2001, UAL incurred both a regular and an alternative minimum tax (“AMT”) loss. The carryback of the regulartax loss and the AMT loss to 1999 will produce both federal and state refunds and reduce AMT credits. The primarydifferences between UAL’s regular tax loss and AMT loss are the depreciation adjustments and preferences.
The provision for income taxes is summarized as follows:
(In millions) 2001 2000 1999
Current -Federal $ (82) $(133) $ 93
State – (24) 16
(82) (157) 109
Deferred -Federal (1,048) 278 536
State (96) 39 54
(1,144) 317 590
$(1,226) $ 160 $699
The income tax provision differed from amounts computed at the statutory federal income tax rate, as follows:
(In millions) 2001 2000 1999
Income tax provision at statutory rate $(1,175) $151 $680
State income taxes, net of federal income tax benefit (62) 10 46
ESOP dividends (17) (32) (40)
Nondeductible employee meals 18 24 24
Other, net 10 7 (11)
$(1,226) $160 $699
32 UAL Corporation 2001 Annual Report
KS
PO
TS
PO
TU
AL #30899 A
ssm:
NS
30899_Body 3/22/02 6:16 PM Page 32
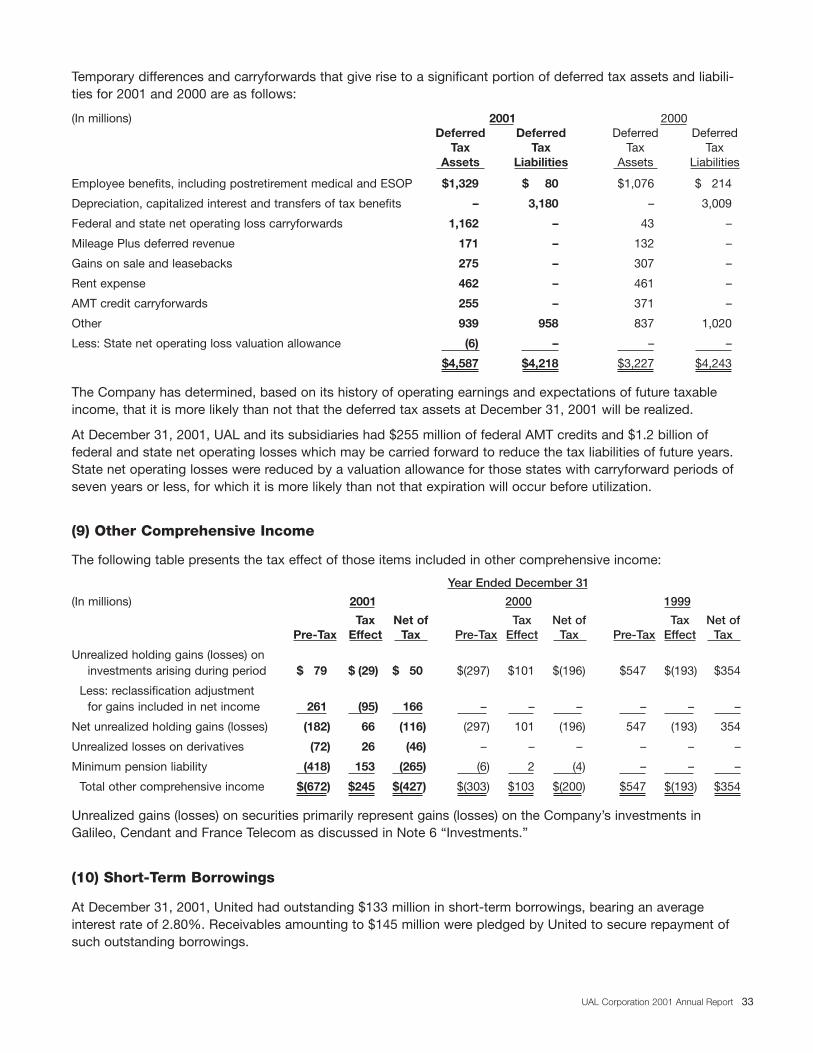
Temporary differences and carryforwards that give rise to a significant portion of deferred tax assets and liabili-ties for 2001 and 2000 are as follows:
(In millions) 2001 2000Deferred Deferred Deferred Deferred
Tax Tax Tax TaxAssets Liabilities Assets Liabilities
Employee benefits, including postretirement medical and ESOP $1,329 $ 80 $1,076 $ 214
Depreciation, capitalized interest and transfers of tax benefits – 3,180 – 3,009
Federal and state net operating loss carryforwards 1,162 – 43 –
Mileage Plus deferred revenue 171 – 132 –
Gains on sale and leasebacks 275 – 307 –
Rent expense 462 – 461 –
AMT credit carryforwards 255 – 371 –
Other 939 958 837 1,020
Less: State net operating loss valuation allowance (6) – – –
$4,587 $4,218 $3,227 $4,243
The Company has determined, based on its history of operating earnings and expectations of future taxableincome, that it is more likely than not that the deferred tax assets at December 31, 2001 will be realized.
At December 31, 2001, UAL and its subsidiaries had $255 million of federal AMT credits and $1.2 billion of federal and state net operating losses which may be carried forward to reduce the tax liabilities of future years.State net operating losses were reduced by a valuation allowance for those states with carryforward periods ofseven years or less, for which it is more likely than not that expiration will occur before utilization.
(9) Other Comprehensive Income
The following table presents the tax effect of those items included in other comprehensive income:
Year Ended December 31
(In millions) 2001 2000 1999
Tax Net of Tax Net of Tax Net ofPre-Tax Effect Tax Pre-Tax Effect Tax Pre-Tax Effect Tax
Unrealized holding gains (losses) oninvestments arising during period $ 79 $ (29) $ 50 $(297) $101 $(196) $547 $(193) $354
Less: reclassification adjustment for gains included in net income 261 (95) 166 – – – – – –
Net unrealized holding gains (losses) (182) 66 (116) (297) 101 (196) 547 (193) 354
Unrealized losses on derivatives (72) 26 (46) – – – – – –
Minimum pension liability (418) 153 (265) (6) 2 (4) – – –
Total other comprehensive income $(672) $245 $(427) $(303) $103 $(200) $547 $(193) $354
Unrealized gains (losses) on securities primarily represent gains (losses) on the Company’s investments inGalileo, Cendant and France Telecom as discussed in Note 6 “Investments.”
(10) Short-Term Borrowings
At December 31, 2001, United had outstanding $133 million in short-term borrowings, bearing an average interest rate of 2.80%. Receivables amounting to $145 million were pledged by United to secure repayment ofsuch outstanding borrowings.
33UAL Corporation 2001 Annual Report
KS
PO
TS
PO
TU
AL
#30
899
Ass
m:
NS
30899_Body 3/22/02 6:16 PM Page 33
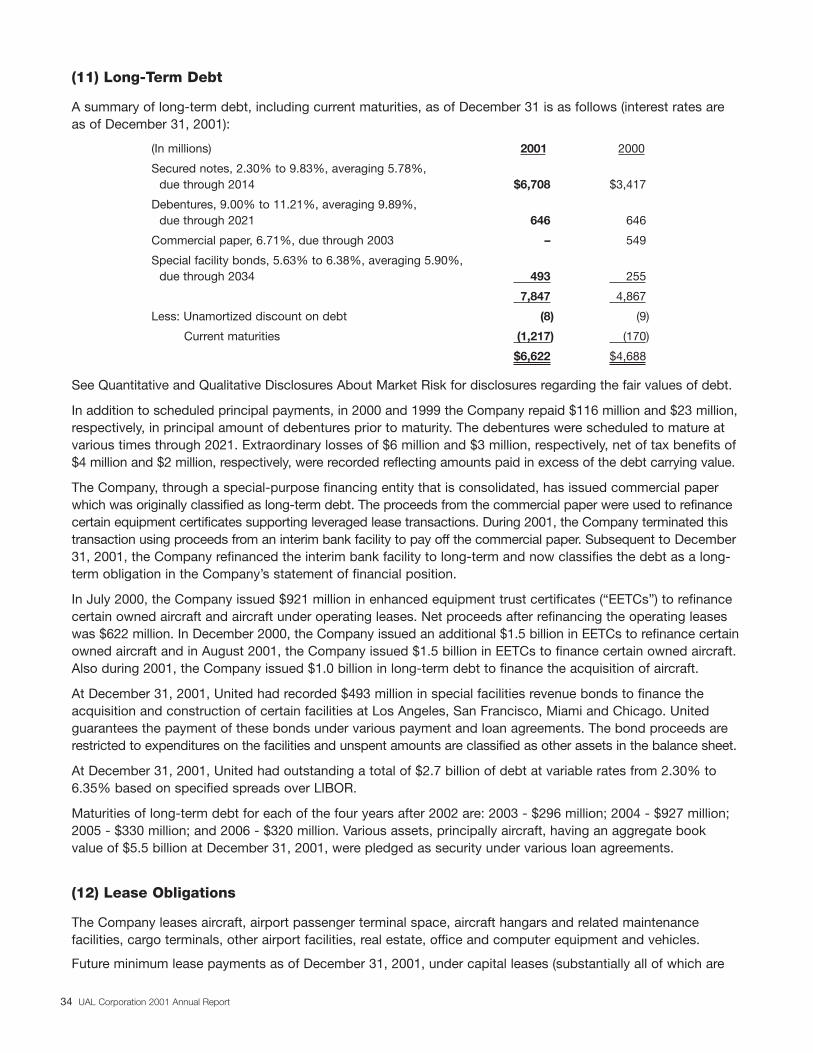
(11) Long-Term Debt
A summary of long-term debt, including current maturities, as of December 31 is as follows (interest rates areas of December 31, 2001):
(In millions) 2001 2000
Secured notes, 2.30% to 9.83%, averaging 5.78%, due through 2014 $6,708 $3,417
Debentures, 9.00% to 11.21%, averaging 9.89%, due through 2021 646 646
Commercial paper, 6.71%, due through 2003 – 549
Special facility bonds, 5.63% to 6.38%, averaging 5.90%, due through 2034 493 255
7,847 4,867
Less: Unamortized discount on debt (8) (9)
Current maturities (1,217) (170)
$6,622 $4,688
See Quantitative and Qualitative Disclosures About Market Risk for disclosures regarding the fair values of debt.
In addition to scheduled principal payments, in 2000 and 1999 the Company repaid $116 million and $23 million,respectively, in principal amount of debentures prior to maturity. The debentures were scheduled to mature atvarious times through 2021. Extraordinary losses of $6 million and $3 million, respectively, net of tax benefits of$4 million and $2 million, respectively, were recorded reflecting amounts paid in excess of the debt carrying value.
The Company, through a special-purpose financing entity that is consolidated, has issued commercial paperwhich was originally classified as long-term debt. The proceeds from the commercial paper were used to refinancecertain equipment certificates supporting leveraged lease transactions. During 2001, the Company terminated thistransaction using proceeds from an interim bank facility to pay off the commercial paper. Subsequent to December31, 2001, the Company refinanced the interim bank facility to long-term and now classifies the debt as a long-term obligation in the Company’s statement of financial position.
In July 2000, the Company issued $921 million in enhanced equipment trust certificates (“EETCs”) to refinancecertain owned aircraft and aircraft under operating leases. Net proceeds after refinancing the operating leaseswas $622 million. In December 2000, the Company issued an additional $1.5 billion in EETCs to refinance certainowned aircraft and in August 2001, the Company issued $1.5 billion in EETCs to finance certain owned aircraft.Also during 2001, the Company issued $1.0 billion in long-term debt to finance the acquisition of aircraft.
At December 31, 2001, United had recorded $493 million in special facilities revenue bonds to finance theacquisition and construction of certain facilities at Los Angeles, San Francisco, Miami and Chicago. Unitedguarantees the payment of these bonds under various payment and loan agreements. The bond proceeds arerestricted to expenditures on the facilities and unspent amounts are classified as other assets in the balance sheet.
At December 31, 2001, United had outstanding a total of $2.7 billion of debt at variable rates from 2.30% to6.35% based on specified spreads over LIBOR.
Maturities of long-term debt for each of the four years after 2002 are: 2003 - $296 million; 2004 - $927 million;2005 - $330 million; and 2006 - $320 million. Various assets, principally aircraft, having an aggregate bookvalue of $5.5 billion at December 31, 2001, were pledged as security under various loan agreements.
(12) Lease Obligations
The Company leases aircraft, airport passenger terminal space, aircraft hangars and related maintenance facilities, cargo terminals, other airport facilities, real estate, office and computer equipment and vehicles.
Future minimum lease payments as of December 31, 2001, under capital leases (substantially all of which are
34 UAL Corporation 2001 Annual Report
KS
PO
TS
PO
TU
AL #30899 A
ssm:
NS
30899_Body 3/22/02 6:16 PM Page 34
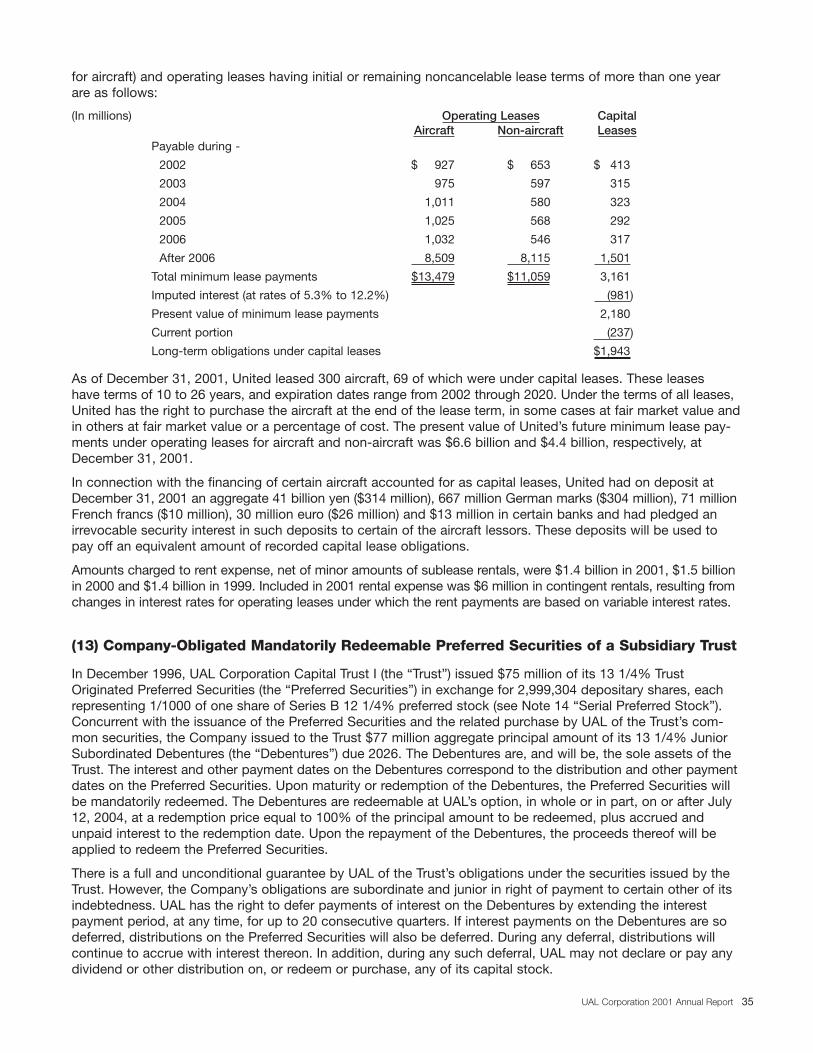
for aircraft) and operating leases having initial or remaining noncancelable lease terms of more than one yearare as follows:
(In millions) Operating Leases CapitalAircraft Non-aircraft Leases
Payable during -
2002 $ 927 $ 653 $ 413
2003 975 597 315
2004 1,011 580 323
2005 1,025 568 292
2006 1,032 546 317
After 2006 8,509 8,115 1,501
Total minimum lease payments $13,479 $11,059 3,161
Imputed interest (at rates of 5.3% to 12.2%) (981)
Present value of minimum lease payments 2,180
Current portion (237)
Long-term obligations under capital leases $1,943
As of December 31, 2001, United leased 300 aircraft, 69 of which were under capital leases. These leases have terms of 10 to 26 years, and expiration dates range from 2002 through 2020. Under the terms of all leases,United has the right to purchase the aircraft at the end of the lease term, in some cases at fair market value andin others at fair market value or a percentage of cost. The present value of United’s future minimum lease pay-ments under operating leases for aircraft and non-aircraft was $6.6 billion and $4.4 billion, respectively, atDecember 31, 2001.
In connection with the financing of certain aircraft accounted for as capital leases, United had on deposit atDecember 31, 2001 an aggregate 41 billion yen ($314 million), 667 million German marks ($304 million), 71 millionFrench francs ($10 million), 30 million euro ($26 million) and $13 million in certain banks and had pledged anirrevocable security interest in such deposits to certain of the aircraft lessors. These deposits will be used topay off an equivalent amount of recorded capital lease obligations.
Amounts charged to rent expense, net of minor amounts of sublease rentals, were $1.4 billion in 2001, $1.5 billionin 2000 and $1.4 billion in 1999. Included in 2001 rental expense was $6 million in contingent rentals, resulting fromchanges in interest rates for operating leases under which the rent payments are based on variable interest rates.
(13) Company-Obligated Mandatorily Redeemable Preferred Securities of a Subsidiary Trust
In December 1996, UAL Corporation Capital Trust I (the “Trust”) issued $75 million of its 13 1/4% TrustOriginated Preferred Securities (the “Preferred Securities”) in exchange for 2,999,304 depositary shares, eachrepresenting 1/1000 of one share of Series B 12 1/4% preferred stock (see Note 14 “Serial Preferred Stock”).Concurrent with the issuance of the Preferred Securities and the related purchase by UAL of the Trust’s com-mon securities, the Company issued to the Trust $77 million aggregate principal amount of its 13 1/4% JuniorSubordinated Debentures (the “Debentures”) due 2026. The Debentures are, and will be, the sole assets of theTrust. The interest and other payment dates on the Debentures correspond to the distribution and other paymentdates on the Preferred Securities. Upon maturity or redemption of the Debentures, the Preferred Securities willbe mandatorily redeemed. The Debentures are redeemable at UAL’s option, in whole or in part, on or after July12, 2004, at a redemption price equal to 100% of the principal amount to be redeemed, plus accrued andunpaid interest to the redemption date. Upon the repayment of the Debentures, the proceeds thereof will beapplied to redeem the Preferred Securities.
There is a full and unconditional guarantee by UAL of the Trust’s obligations under the securities issued by theTrust. However, the Company’s obligations are subordinate and junior in right of payment to certain other of itsindebtedness. UAL has the right to defer payments of interest on the Debentures by extending the interest payment period, at any time, for up to 20 consecutive quarters. If interest payments on the Debentures are sodeferred, distributions on the Preferred Securities will also be deferred. During any deferral, distributions willcontinue to accrue with interest thereon. In addition, during any such deferral, UAL may not declare or pay anydividend or other distribution on, or redeem or purchase, any of its capital stock.
35UAL Corporation 2001 Annual Report
KS
PO
TS
PO
TU
AL
#30
899
Ass
m:
NS
30899_Body 3/22/02 6:16 PM Page 35
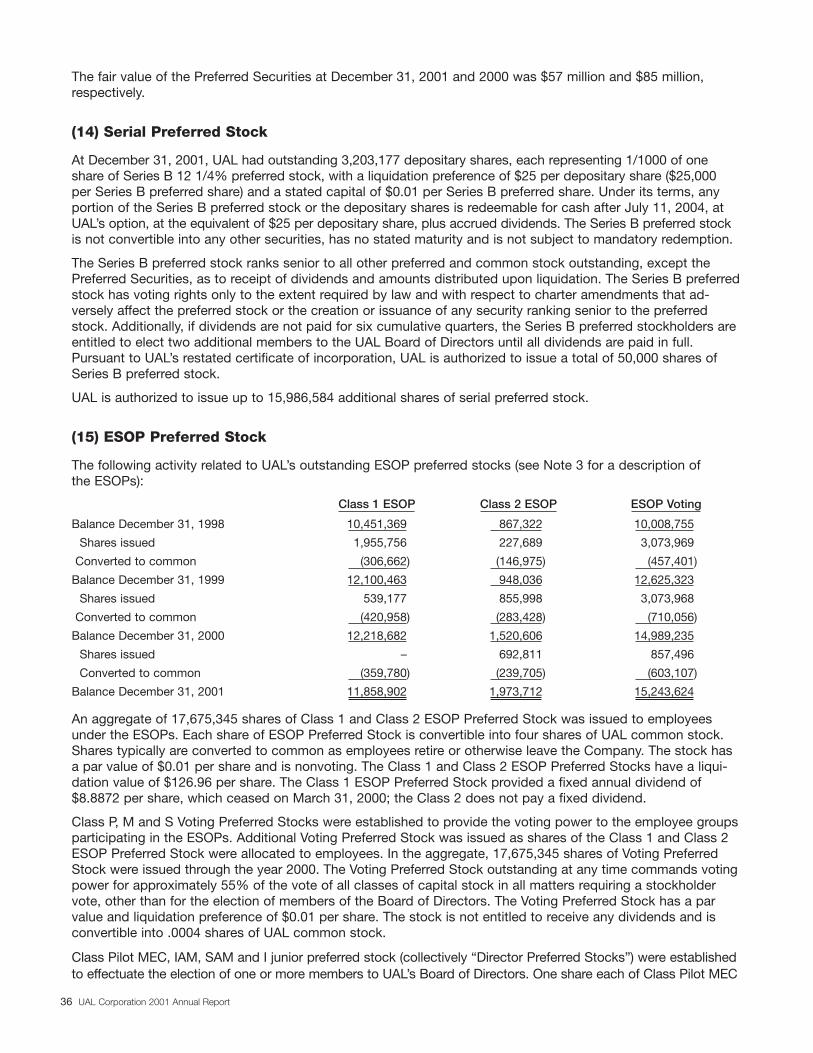
The fair value of the Preferred Securities at December 31, 2001 and 2000 was $57 million and $85 million,respectively.
(14) Serial Preferred Stock
At December 31, 2001, UAL had outstanding 3,203,177 depositary shares, each representing 1/1000 of oneshare of Series B 12 1/4% preferred stock, with a liquidation preference of $25 per depositary share ($25,000per Series B preferred share) and a stated capital of $0.01 per Series B preferred share. Under its terms, anyportion of the Series B preferred stock or the depositary shares is redeemable for cash after July 11, 2004, atUAL’s option, at the equivalent of $25 per depositary share, plus accrued dividends. The Series B preferred stockis not convertible into any other securities, has no stated maturity and is not subject to mandatory redemption.
The Series B preferred stock ranks senior to all other preferred and common stock outstanding, except thePreferred Securities, as to receipt of dividends and amounts distributed upon liquidation. The Series B preferredstock has voting rights only to the extent required by law and with respect to charter amendments that ad-versely affect the preferred stock or the creation or issuance of any security ranking senior to the preferredstock. Additionally, if dividends are not paid for six cumulative quarters, the Series B preferred stockholders areentitled to elect two additional members to the UAL Board of Directors until all dividends are paid in full.Pursuant to UAL’s restated certificate of incorporation, UAL is authorized to issue a total of 50,000 shares ofSeries B preferred stock.
UAL is authorized to issue up to 15,986,584 additional shares of serial preferred stock.
(15) ESOP Preferred Stock
The following activity related to UAL’s outstanding ESOP preferred stocks (see Note 3 for a description of the ESOPs):
Class 1 ESOP Class 2 ESOP ESOP Voting
Balance December 31, 1998 10,451,369 867,322 10,008,755
Shares issued 1,955,756 227,689 3,073,969
Converted to common (306,662) (146,975) (457,401)
Balance December 31, 1999 12,100,463 948,036 12,625,323
Shares issued 539,177 855,998 3,073,968
Converted to common (420,958) (283,428) (710,056)
Balance December 31, 2000 12,218,682 1,520,606 14,989,235
Shares issued – 692,811 857,496
Converted to common (359,780) (239,705) (603,107)
Balance December 31, 2001 11,858,902 1,973,712 15,243,624
An aggregate of 17,675,345 shares of Class 1 and Class 2 ESOP Preferred Stock was issued to employeesunder the ESOPs. Each share of ESOP Preferred Stock is convertible into four shares of UAL common stock.Shares typically are converted to common as employees retire or otherwise leave the Company. The stock hasa par value of $0.01 per share and is nonvoting. The Class 1 and Class 2 ESOP Preferred Stocks have a liqui-dation value of $126.96 per share. The Class 1 ESOP Preferred Stock provided a fixed annual dividend of$8.8872 per share, which ceased on March 31, 2000; the Class 2 does not pay a fixed dividend.
Class P, M and S Voting Preferred Stocks were established to provide the voting power to the employee groupsparticipating in the ESOPs. Additional Voting Preferred Stock was issued as shares of the Class 1 and Class 2ESOP Preferred Stock were allocated to employees. In the aggregate, 17,675,345 shares of Voting PreferredStock were issued through the year 2000. The Voting Preferred Stock outstanding at any time commands votingpower for approximately 55% of the vote of all classes of capital stock in all matters requiring a stockholdervote, other than for the election of members of the Board of Directors. The Voting Preferred Stock has a parvalue and liquidation preference of $0.01 per share. The stock is not entitled to receive any dividends and isconvertible into .0004 shares of UAL common stock.
Class Pilot MEC, IAM, SAM and I junior preferred stock (collectively “Director Preferred Stocks”) were establishedto effectuate the election of one or more members to UAL’s Board of Directors. One share each of Class Pilot MEC
36 UAL Corporation 2001 Annual Report
KS
PO
TS
PO
TU
AL #30899 A
ssm:
NS
30899_Body 3/22/02 6:16 PM Page 36
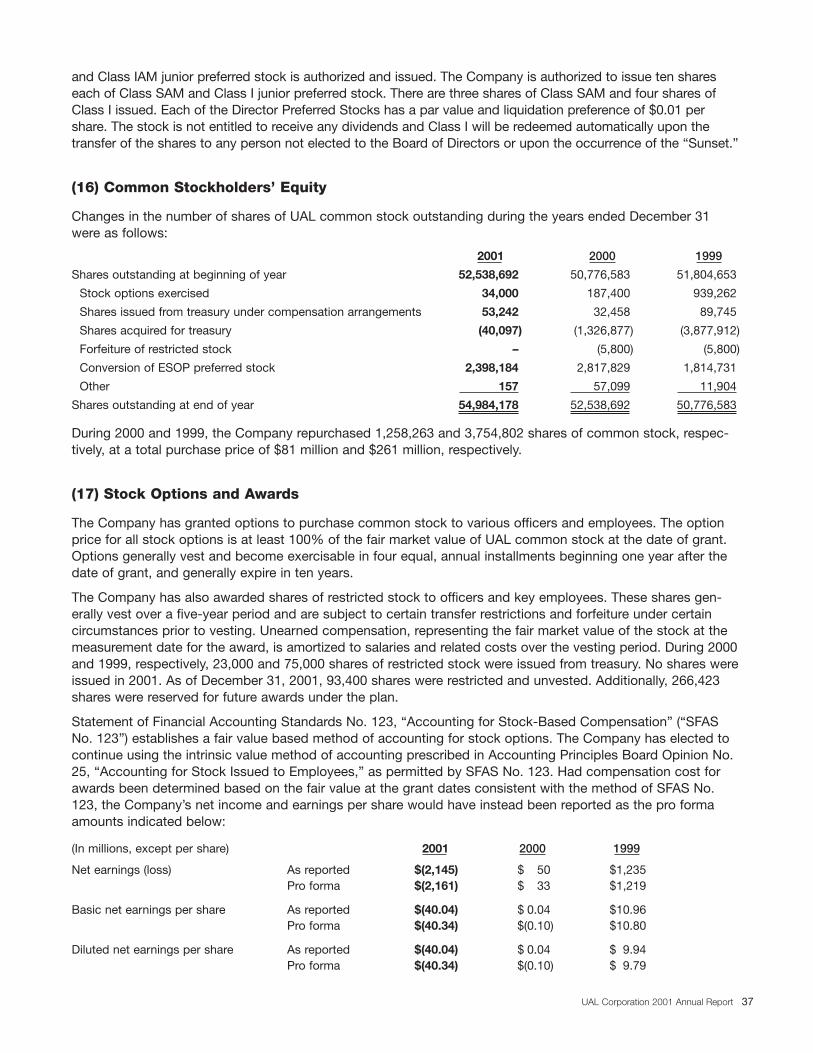
and Class IAM junior preferred stock is authorized and issued. The Company is authorized to issue ten shareseach of Class SAM and Class I junior preferred stock. There are three shares of Class SAM and four shares ofClass I issued. Each of the Director Preferred Stocks has a par value and liquidation preference of $0.01 pershare. The stock is not entitled to receive any dividends and Class I will be redeemed automatically upon thetransfer of the shares to any person not elected to the Board of Directors or upon the occurrence of the “Sunset.”
(16) Common Stockholders’ Equity
Changes in the number of shares of UAL common stock outstanding during the years ended December 31 were as follows:
2001 2000 1999
Shares outstanding at beginning of year 52,538,692 50,776,583 51,804,653
Stock options exercised 34,000 187,400 939,262
Shares issued from treasury under compensation arrangements 53,242 32,458 89,745
Shares acquired for treasury (40,097) (1,326,877) (3,877,912)
Forfeiture of restricted stock – (5,800) (5,800)
Conversion of ESOP preferred stock 2,398,184 2,817,829 1,814,731
Other 157 57,099 11,904
Shares outstanding at end of year 54,984,178 52,538,692 50,776,583
During 2000 and 1999, the Company repurchased 1,258,263 and 3,754,802 shares of common stock, respec-tively, at a total purchase price of $81 million and $261 million, respectively.
(17) Stock Options and Awards
The Company has granted options to purchase common stock to various officers and employees. The optionprice for all stock options is at least 100% of the fair market value of UAL common stock at the date of grant.Options generally vest and become exercisable in four equal, annual installments beginning one year after thedate of grant, and generally expire in ten years.
The Company has also awarded shares of restricted stock to officers and key employees. These shares gen-erally vest over a five-year period and are subject to certain transfer restrictions and forfeiture under certain circumstances prior to vesting. Unearned compensation, representing the fair market value of the stock at themeasurement date for the award, is amortized to salaries and related costs over the vesting period. During 2000and 1999, respectively, 23,000 and 75,000 shares of restricted stock were issued from treasury. No shares wereissued in 2001. As of December 31, 2001, 93,400 shares were restricted and unvested. Additionally, 266,423shares were reserved for future awards under the plan.
Statement of Financial Accounting Standards No. 123, “Accounting for Stock-Based Compensation” (“SFAS No. 123”) establishes a fair value based method of accounting for stock options. The Company has elected tocontinue using the intrinsic value method of accounting prescribed in Accounting Principles Board Opinion No.25, “Accounting for Stock Issued to Employees,” as permitted by SFAS No. 123. Had compensation cost forawards been determined based on the fair value at the grant dates consistent with the method of SFAS No.123, the Company’s net income and earnings per share would have instead been reported as the pro formaamounts indicated below:
(In millions, except per share) 2001 2000 1999
Net earnings (loss) As reported $(2,145) $ 50 $1,235Pro forma $(2,161) $ 33 $1,219
Basic net earnings per share As reported $(40.04) $ 0.04 $10.96Pro forma $(40.34) $(0.10) $10.80
Diluted net earnings per share As reported $(40.04) $ 0.04 $ 9.94Pro forma $(40.34) $(0.10) $ 9.79
37UAL Corporation 2001 Annual Report
KS
PO
TS
PO
TU
AL
#30
899
Ass
m:
NS
30899_Body 3/22/02 6:16 PM Page 37
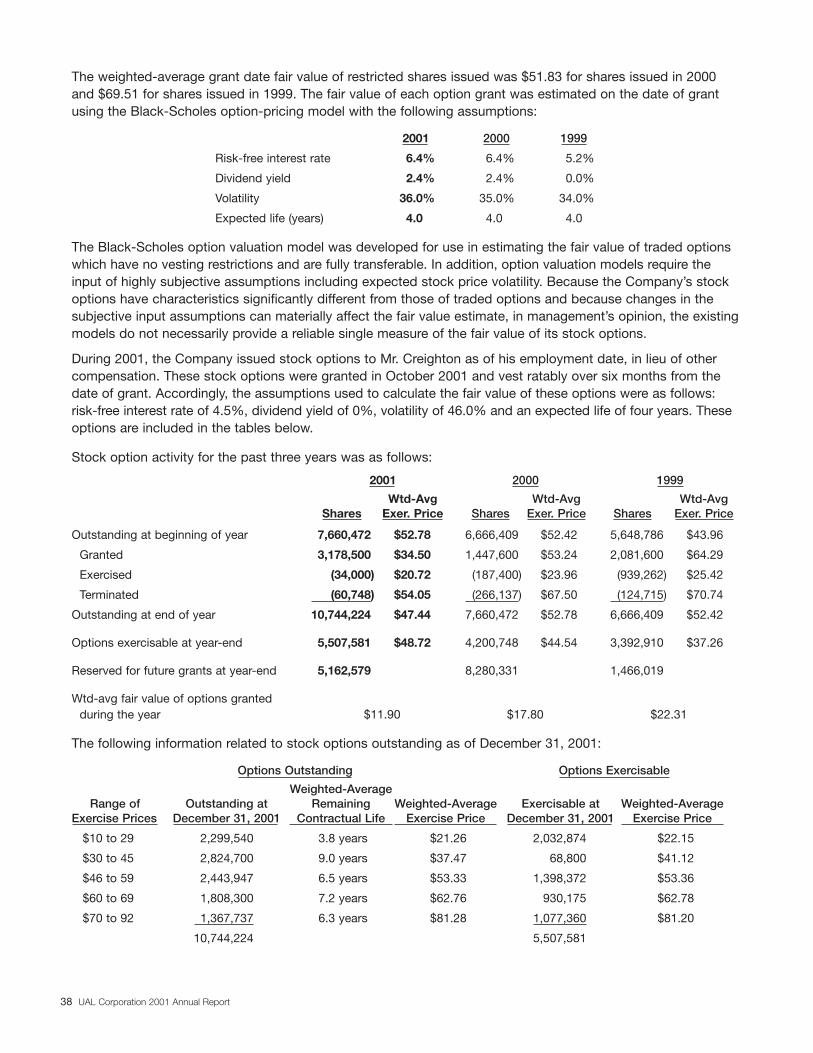
The weighted-average grant date fair value of restricted shares issued was $51.83 for shares issued in 2000and $69.51 for shares issued in 1999. The fair value of each option grant was estimated on the date of grantusing the Black-Scholes option-pricing model with the following assumptions:
2001 2000 1999
Risk-free interest rate 6.4% 6.4% 5.2%
Dividend yield 2.4% 2.4% 0.0%
Volatility 36.0% 35.0% 34.0%
Expected life (years) 4.0 4.0 4.0
The Black-Scholes option valuation model was developed for use in estimating the fair value of traded optionswhich have no vesting restrictions and are fully transferable. In addition, option valuation models require theinput of highly subjective assumptions including expected stock price volatility. Because the Company’s stockoptions have characteristics significantly different from those of traded options and because changes in thesubjective input assumptions can materially affect the fair value estimate, in management’s opinion, the existingmodels do not necessarily provide a reliable single measure of the fair value of its stock options.
During 2001, the Company issued stock options to Mr. Creighton as of his employment date, in lieu of othercompensation. These stock options were granted in October 2001 and vest ratably over six months from thedate of grant. Accordingly, the assumptions used to calculate the fair value of these options were as follows:risk-free interest rate of 4.5%, dividend yield of 0%, volatility of 46.0% and an expected life of four years. Theseoptions are included in the tables below.
Stock option activity for the past three years was as follows:
2001 2000 1999
Wtd-Avg Wtd-Avg Wtd-AvgShares Exer. Price Shares Exer. Price Shares Exer. Price
Outstanding at beginning of year 7,660,472 $52.78 6,666,409 $52.42 5,648,786 $43.96
Granted 3,178,500 $34.50 1,447,600 $53.24 2,081,600 $64.29
Exercised (34,000) $20.72 (187,400) $23.96 (939,262) $25.42
Terminated (60,748) $54.05 (266,137) $67.50 (124,715) $70.74
Outstanding at end of year 10,744,224 $47.44 7,660,472 $52.78 6,666,409 $52.42
Options exercisable at year-end 5,507,581 $48.72 4,200,748 $44.54 3,392,910 $37.26
Reserved for future grants at year-end 5,162,579 8,280,331 1,466,019
Wtd-avg fair value of options granted during the year $11.90 $17.80 $22.31
The following information related to stock options outstanding as of December 31, 2001:
Options Outstanding Options Exercisable
Weighted-AverageRange of Outstanding at Remaining Weighted-Average Exercisable at Weighted-Average
Exercise Prices December 31, 2001 Contractual Life Exercise Price December 31, 2001 Exercise Price
$10 to 29 2,299,540 3.8 years $21.26 2,032,874 $22.15
$30 to 45 2,824,700 9.0 years $37.47 68,800 $41.12
$46 to 59 2,443,947 6.5 years $53.33 1,398,372 $53.36
$60 to 69 1,808,300 7.2 years $62.76 930,175 $62.78
$70 to 92 1,367,737 6.3 years $81.28 1,077,360 $81.20
10,744,224 5,507,581
38 UAL Corporation 2001 Annual Report
KS
PO
TS
PO
TU
AL #30899 A
ssm:
NS
30899_Body 3/22/02 6:16 PM Page 38
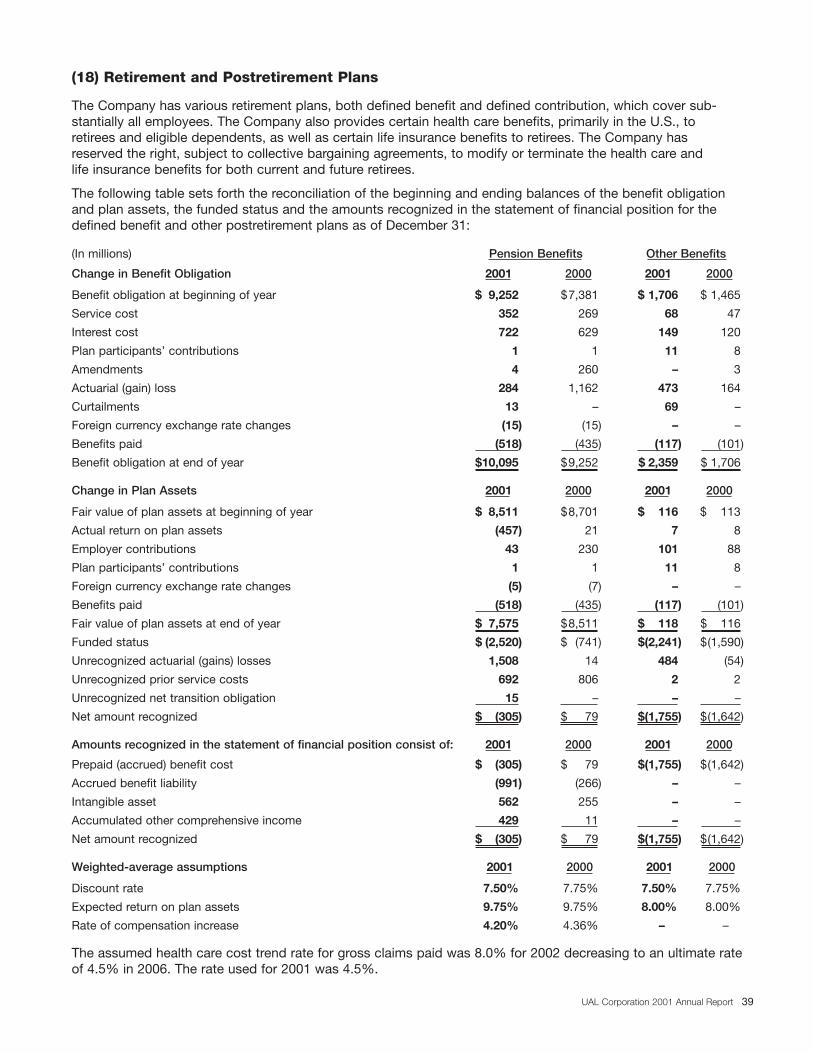
39UAL Corporation 2001 Annual Report
KS
PO
TS
PO
TU
AL
#30
899
Ass
m:
NS
(18) Retirement and Postretirement Plans
The Company has various retirement plans, both defined benefit and defined contribution, which cover sub-stantially all employees. The Company also provides certain health care benefits, primarily in the U.S., to retirees and eligible dependents, as well as certain life insurance benefits to retirees. The Company has reserved the right, subject to collective bargaining agreements, to modify or terminate the health care andlife insurance benefits for both current and future retirees.
The following table sets forth the reconciliation of the beginning and ending balances of the benefit obligationand plan assets, the funded status and the amounts recognized in the statement of financial position for thedefined benefit and other postretirement plans as of December 31:
(In millions) Pension Benefits Other Benefits
Change in Benefit Obligation 2001 2000 2001 2000
Benefit obligation at beginning of year $ 9,252 $7,381 $ 1,706 $ 1,465
Service cost 352 269 68 47
Interest cost 722 629 149 120
Plan participants’ contributions 1 1 11 8
Amendments 4 260 – 3
Actuarial (gain) loss 284 1,162 473 164
Curtailments 13 – 69 –
Foreign currency exchange rate changes (15) (15) – –
Benefits paid (518) (435) (117) (101)
Benefit obligation at end of year $10,095 $9,252 $ 2,359 $ 1,706
Change in Plan Assets 2001 2000 2001 2000
Fair value of plan assets at beginning of year $ 8,511 $8,701 $ 116 $ 113
Actual return on plan assets (457) 21 7 8
Employer contributions 43 230 101 88
Plan participants’ contributions 1 1 11 8
Foreign currency exchange rate changes (5) (7) – –
Benefits paid (518) (435) (117) (101)
Fair value of plan assets at end of year $ 7,575 $8,511 $ 118 $ 116
Funded status $ (2,520) $ (741) $(2,241) $(1,590)
Unrecognized actuarial (gains) losses 1,508 14 484 (54)
Unrecognized prior service costs 692 806 2 2
Unrecognized net transition obligation 15 – – –
Net amount recognized $ (305) $ 79 $(1,755) $(1,642)
Amounts recognized in the statement of financial position consist of: 2001 2000 2001 2000
Prepaid (accrued) benefit cost $ (305) $ 79 $(1,755) $(1,642)
Accrued benefit liability (991) (266) – –
Intangible asset 562 255 – –
Accumulated other comprehensive income 429 11 – –
Net amount recognized $ (305) $ 79 $(1,755) $(1,642)
Weighted-average assumptions 2001 2000 2001 2000
Discount rate 7.50% 7.75% 7.50% 7.75%
Expected return on plan assets 9.75% 9.75% 8.00% 8.00%
Rate of compensation increase 4.20% 4.36% – –
The assumed health care cost trend rate for gross claims paid was 8.0% for 2002 decreasing to an ultimate rateof 4.5% in 2006. The rate used for 2001 was 4.5%.
30899_Body 3/22/02 6:16 PM Page 39
The net periodic benefit cost included the following components:
(In millions) Pension Benefits Other Benefits
2001 2000 1999 2001 2000 1999
Service cost $352 $269 $ 295 $ 68 $ 47 $ 53Interest cost 722 629 583 149 120 116Expected return on plan assets (805) (740) (665) (9) (9) (9)Amortization of prior service cost including
transition obligation/(asset) 73 58 57 – – –Curtailment charge 74 – – 4 – –Recognized actuarial (gain)/loss 16 (7) 1 2 (9) (5)Net period benefit costs $432 $209 $ 271 $214 $149 $155
Total pension expense for all retirement plans (including defined contribution plans) was $629 million in 2001,$302 million in 2000 and $285 million in 1999.
The projected benefit obligation, accumulated benefit obligation, and fair value of plan assets for the plans withaccumulated benefit obligations in excess of plan assets were $10.1 billion, $8.9 billion and $7.6 billion, respective-ly, as of December 31, 2001 and $1.0 billion, $632 million and $61 million, respectively, as of December 31, 2000.
Assumed health care cost trend rates have a significant effect on the amounts reported for the health care plan.A one-percentage-point change in assumed health care trend rate would have the following effects:
(In millions) 1% Increase 1% Decrease
Effect on total service and interest cost $ 36 $ (29)Effect on postretirement benefit obligation $323 $(264)
Changes in interest rates or rates of inflation may impact the assumptions used in the valuation of pension obli-gations and postretirement obligations including discount rates and rates of increase in compensation, resultingin increases or decreases in United’s pension and postretirement liabilities and pension and postretirement costs.
(19) Financial Instruments and Risk Management
See Quantitative and Qualitative Disclosures About Market Risk (“Market Risk Disclosures”) for a discussion ofthe Company’s foreign currency and fuel price risk management activities, and the fair value of all significantfinancial instruments.
Credit Exposures of DerivativesThe Company’s theoretical risk in the derivative financial instruments described in Market Risk Disclosures isthe cost of replacing the contracts at current market rates in the event of default by any of the counterparties.However, the Company does not anticipate such default as counterparties are selected based on credit ratingsand the relative market positions with each counterparty are monitored.
Financial GuaranteesSpecial facility revenue bonds have been issued by certain municipalities to build or improve airport and mainte-nance facilities leased by United. Under the lease agreements, United is required to make rental payments inamounts sufficient to pay the maturing principal and interest payments on the bonds. At December 31, 2001,$1.2 billion principal amount of such bonds was outstanding. As of December 31, 2001, UAL and United hadjointly guaranteed $35 million of such bonds and United had guaranteed $1.2 billion of such bonds, includingaccrued interest. The payments required to satisfy these obligations are included in the future minimum leasepayments disclosed in Note 12 “Lease Obligations.”
At December 31, 2001, United guaranteed approximately $100 million of third-party debt.
Concentrations of Credit RiskThe Company does not believe it is subject to any significant concentration of credit risk. Most of the Company’sreceivables result from sales of tickets to individuals through geographically dispersed travel agents, includingon-line agencies, Company outlets, corporate travel departments or other airlines, often through the use ofmajor credit cards. These receivables are short term, generally being settled shortly after the sale.
40 UAL Corporation 2001 Annual Report
KS
PO
TS
PO
TU
AL #30899 A
ssm:
NS
30899_Body 3/22/02 6:16 PM Page 40

(20) Commitments, Contingent Liabilities and Uncertainties
The Company has certain contingencies resulting from litigation and claims (including environmental issues)incident to the ordinary course of business. Management believes, after considering a number of factors,including (but not limited to) the views of legal counsel, the nature of contingencies to which the Company issubject and its prior experience, that the ultimate disposition of these contingencies is not expected to materiallyaffect UAL’s consolidated financial position or results of operations. UAL records liabilities for legal and environ-mental claims against it in accordance with generally accepted accounting principles. These amounts arerecorded based on the Company’s assessments of the likelihood of their eventual settlements. The amounts of these liabilities could increase or decrease in the near term, based on revisions to estimates relating to thevarious claims.
At December 31, 2001, commitments for the purchase of property and equipment, principally aircraft, approxi-mated $2.8 billion, after deducting advance payments. An estimated $1.2 billion will be spent in 2002, $0.1 bil-lion in 2003, $0.5 billion in 2004 and $1.0 in 2005 and thereafter. The major commitments are for the purchaseof A319, A320 and B777 aircraft, which are scheduled to be delivered through 2007. These commitments takeinto account the previously announced deferral of future aircraft deliveries for 2002 and 2003 from the originallyplanned 67 aircraft to 24 aircraft.
In connection with the construction of the Indianapolis Maintenance Center, United agreed to spend an aggre-gate $800 million on capital investments by the year 2001 and employ at least 7,500 individuals by the year2004. In the event such targets are not reached, United may be required to make certain payments to the cityof Indianapolis and state of Indiana. As a result of the events of September 11 and the subsequent reduction inthe Company’s operations and capital spending, United became obligated to refund approximately $32 millionto the state and local governments during the second quarter of 2002. This amount is included in “OtherAccrued Liabilities” on the Statement of Consolidated Financial Position at December 31, 2001.
Approximately 80% of United’s employees are represented by various labor organizations. The contracts withALPA and the AFA become amendable in 2004 and 2006, respectively.
(21) Segment Information
United has a global route network designed to transport passengers and cargo between destinations in NorthAmerica, the Pacific, the Atlantic and Latin America. These regions constitute United’s four reportable segments.The accounting policies for each of these segments are the same as those described in Note 1 “Summary ofSignificant Accounting Policies,” except that segment financial information has been prepared using a manage-ment approach which is consistent with how the Company’s management internally disaggregates financial infor-mation for the purpose of making internal operating decisions. UAL evaluates performance based on United’searnings before income taxes, special charges and gains on sales. Revenues are attributed to each reportablesegment based on the allocation guidelines provided by the DOT, which classifies flights between the U.S. andforeign destinations as part of each respective region. A reconciliation of the total amounts reported byreportable segments to the applicable amounts in the financial statements follows:
(In millions) Year Ended December 31, 2001
ReportableNorth Latin Segment Consolidated
America Pacific Atlantic America Total Other Total
Revenue $10,664 $2,663 $2,081 $ 679 $16,087 $ 51 $16,138
Interest income 63 16 12 4 95 10 105
Interest expense 329 81 101 29 540 (15) 525
Equity in earnings (losses) of affiliates 4 1 1 – 6 (29) (23)
Depreciation and amortization 689 161 153 18 1,021 5 1,026
Earnings before income taxes, special charges, stabilization grant and gains on sales (1,771) (580) (386) (141) (2,878) 85 (2,793)
41UAL Corporation 2001 Annual Report
KS
PO
TS
PO
TU
AL
#30
899
Ass
m:
NS
30899_Body 3/22/02 6:16 PM Page 41
(In millions) Year Ended December 31, 2000
ReportableNorth Latin Segment Consolidated
America Pacific Atlantic America Total Other Total
Revenue $13,094 $3,161 $2,260 $816 $19,331 $ 21 $19,352
Interest income 55 23 16 5 99 2 101
Interest expense 234 95 66 21 416 (14) 402
Equity in losses of affiliates (5) (2) (1) – (8) (4) (12)
Depreciation and amortization 628 176 141 43 988 – 988
Earnings before income taxes,special charges and gains on sales 285 73 108 12 478 44 522
(In millions) Year Ended December 31, 1999
ReportableNorth Latin Segment Consolidated
America Pacific Atlantic America Total Other Total
Revenue $12,516 $2,691 $1,973 $787 $17,967 $ 60 $18,027
Interest income 40 14 10 4 68 – 68
Interest expense 217 79 55 21 372 (10) 362
Equity in earnings of affiliates 21 9 5 2 37 – 37
Depreciation and amortization 548 145 115 42 850 – 850
Earnings before income taxes,special charges and gains on sales 899 85 166 21 1,171 57 1,228
(In millions) 2001 2000 1999
Total earnings for reportable segments $(2,878) $ 478 $1,171
Special charges (1,428) (139) (17)
Non-operating special charges (49) (61) –
Airline stabilization grant 652 – –
Gains on sales 261 109 731
UAL subsidiary earnings 85 44 57
Total earnings (loss) before income taxes, distributions on preferred securities, extraordinary item and cumulative effect $(3,357) $ 431 $1,942
UAL’s operations involve an insignificant level of dedicated revenue producing assets by reportable segment.The overwhelming majority of UAL’s revenue producing assets can be deployed in any of the four reportablesegments. UAL has significant intangible assets related to the acquisition of its Atlantic and Latin America route authorities. During 2001, the FASB issued SFAS No. 142 which could impact the Company’s accountingfor these assets. For further details, see Other Information, “New Accounting Pronouncements” inManagement’s Discussion and Analysis of Financial Condition and Results of Operations.
42 UAL Corporation 2001 Annual Report
KS
PO
TS
PO
TU
AL #30899 A
ssm:
NS
30899_Body 3/22/02 6:16 PM Page 42
(22) Statement of Consolidated Cash Flows - Supplemental Disclosures
Supplemental disclosures of cash flow information and non-cash investing and financing activities were as follows:
(In millions) 2001 2000 1999
Cash paid during the year for:
Interest (net of amounts capitalized) $ 393 $ 298 $ 260
Income taxes 42 23 296
Acquisition of MyPoints.com:
Fair value of:
Assets acquired 151 – –
Liabilities assumed (33) – –
Cash paid 118 – –
Less cash acquired (86) – –
Net cash paid for acquisitions 32 – –
Non-cash transactions:
Capital lease obligations incurred – 339 482
Long-term debt incurred in connection with additions to equipment 669 32 –
Increase (decrease) in pension intangible assets 307 107 (123)
Net unrealized gain (loss) on investments (173) (196) 354
(23) Selected Quarterly Financial Data (Unaudited)
(In millions, except per share data) 1st 2nd 3rd 4thQuarter Quarter Quarter Quarter Year
2001:
Operating revenues $4,424 $4,658 $ 4,107 $2,949 $16,138
Loss from operations (391) (469) (2,025) (886) (3,771)
Loss before cumulative effect (305) (365) (1,159) (308) (2,137)
Cumulative effect of accounting change, net (8) – – – (8)
Net loss $ (313) $ (365) $(1,159) $ (308) $ (2,145)
Per share amounts, basic and diluted:
Loss before cumulative effect $ (5.82) $ (6.87) $(21.43) $ (5.68) $ (39.90)
Cumulative effect of accounting change, net (0.15) – – – (0.14)
Net loss $ (5.97) $ (6.87) $(21.43) $ (5.68) $ (40.04)
2000:
Operating revenues $4,546 $5,109 $ 4,905 $4,792 $19,352
Earnings (loss) from operations 252 605 (41) (162) 654
Earnings (loss) before extraordinary item and cumulative effect 110 336 (110) (71) 265
Extraordinary loss on early extinguishment of debt, net – – (6) – (6)
Cumulative effect of accounting change, net (209) – – – (209)
Net earnings (loss) $ (99) $ 336 $ (116) $ (71) $ 50
Per share amounts, basic:
Earnings (loss) before extraordinary item and cumulative effect $ 0.68 $ 3.08 $ (2.17) $ (1.40) $ 2.02
Extraordinary loss on early extinguishment of debt, net – – (0.13) – (0.05)
Cumulative effect of accounting change, net (1.97) – – – (1.93)
Net earnings (loss) $ (1.29) $ 3.08 $ (2.30) $ (1.40) $ 0.04
Net earnings (loss) per share, diluted $ (1.18) $ 2.86 $ (2.30) $ (1.40) $ 0.04
43UAL Corporation 2001 Annual Report
KS
PO
TS
PO
TU
AL
#30
899
Ass
m:
NS
30899_Body 3/22/02 6:16 PM Page 43
The sum of quarterly earnings per share amounts is not the same as annual earnings per share amountsbecause of changing numbers of shares outstanding.
During the second quarter of 2001, UAL recorded a special charge of $116 million for costs associated with aterminated merger with US Airways Group, Inc.
During the third quarter of 2001, UAL recorded a special charge of $1.3 billion in operating expense and $49million in non-operating expense for amounts relating to the September 11 terrorist attacks. Additionally, in thethird and fourth quarters of 2001, UAL recognized $391 million and $261 million, respectively, in compensationunder the Act as non-operating income. (See Note 2 “Special Charges Related to the September 11 TerroristAttacks.”)
During the fourth quarter of 2001, United recognized a gain of $261 million on the sale of its investments inGalileo and Cendant. (See Note 6 “Investments.”)
During the third quarter of 2000, UAL recorded an investment impairment of $61 million related to its warrantsin Priceline.com. Additionally, in the fourth quarter 2000, UAL recognized a pre-tax gain of $109 million on thesale of its investment in GetThere.com. (See Note 6 “Investments.”)
44 UAL Corporation 2001 Annual Report
KS
PO
TS
PO
TU
AL #30899 A
ssm:
NS
30899_Body 3/22/02 6:16 PM Page 44
45UAL Corporation 2001 Annual Report
Management Statement on Accounting Controls
The integrity of UAL Corporation’s financial records, from which the financial statements are prepared, is largelydependent on the Company’s system of internal accounting controls. The purpose of the system is to providereasonable assurance that transactions are executed in accordance with management’s authorization; that transactions are appropriately recorded in order to permit preparation of financial statements which, in all materialrespects, are presented in conformity with generally accepted accounting principles consistently applied; andthat assets are properly accounted for and safeguarded against loss from unauthorized use. Underlying this concept of reasonable assurance is the fact that limitations exist in any system of internal accounting controlsbased on the premise that the cost of such controls should not exceed the benefits derived therefrom.
To enhance the effective achievement of internal accounting controls, the Company carefully selects and trainsits employees, gives due emphasis to appropriate division of clearly defined lines of responsibility and developsand communicates written policies and procedures. Based on a review and monitoring of internal accountingcontrols, augmented by an internal auditing function and the oversight responsibilities of the outside directorscomprising the Audit Committee of the Company’s Board of Directors, management believes that the Company’sinternal accounting control system is adequate and appropriately balances the relationship between the cost ofthe system and the benefits it provides.
John W. CreightonChairman and CEO
Frederic F. BraceSenior Vice Presidentand CFO
Report of Independent Public Accountants
To the Stockholders and Board of Directors, UAL Corporation:
We have audited the accompanying statements of consolidated financial position of UAL Corporation (a Delawarecorporation) and subsidiary companies as of December 31, 2001 and 2000, and the related statements of con-solidated operations, consolidated cash flows and consolidated stockholders’ equity for each of the three yearsin the period ended December 31, 2001. These financial statements are the responsibility of the Company'smanagement. Our responsibility is to express an opinion on these financial statements based on our audits.
We conducted our audits in accordance with auditing standards generally accepted in the United States. Thosestandards require that we plan and perform the audit to obtain reasonable assurance about whether the financialstatements are free of material misstatement. An audit includes examining, on a test basis, evidence supportingthe amounts and disclosures in the financial statements. An audit also includes assessing the accounting prin-ciples used and significant estimates made by management, as well as evaluating the overall financial statementpresentation. We believe that our audits provide a reasonable basis for our opinion.
In our opinion, the consolidated financial statements referred to above present fairly, in all material respects, thefinancial position of UAL Corporation and subsidiary companies as of December 31, 2001 and 2000, and theresults of their operations and their cash flows for each of the three years in the period ended December 31, 2001,in conformity with accounting principles generally accepted in the United States.
As explained in Note 1(b) of the Notes to Consolidated Financial Statements, effective January 1, 2001, theCompany changed its accounting principles for the measurement of redeemable preferred ESOP stock as aresult of the adoption of Topic D-98 “Classification and Measurement of Redeemable Securities” and effectiveJanuary 1, 2000, the Company changed certain of its accounting principles for revenue recognition as a resultof the adoption of Staff Accounting Bulletin No. 101 “Revenue Recognition in Financial Statements.”
Chicago, IllinoisFebruary 20, 2002
KS
PO
TS
PO
TU
AL
#30
899
Ass
m:
NS
30899_Body 3/22/02 6:17 PM Page 45
KS
PO
TS
PO
TU
AL #30899 A
ssm:
NS
46 UAL Corporation 2001 Annual Report
John W. Creighton, Jr.Chairman and Chief Executive OfficerUAL CorporationPublic Director - elected October 2001Independent Director - elected 1998(2) (4) (5) (7)
Rono J. DuttaPresidentUAL CorporationPublic Director - elected 1999
W. James FarrellChairman and Chief Executive OfficerIllinois Tool Works, Inc.(Manufacturing and marketing of engineered components)Public Director - elected 2001(1) (2) (3) (4) (8) (9) (10)
W. Douglas FordRetired Chief Executive, Refining & MarketingBP p.l.c.(Petroleum and petrochemicals holding company)Employee Director - appointed 2002(2) (6) (9)
Richard D. McCormickChairman EmeritusUS WEST, Inc.(Telecommunications)Independent Director - elected 1994(1) (2) (3) (5) (6) (7) (10)
James J. O’ConnorRetired Chairman and Chief Executive OfficerUnicom Corporation(Electric utility holding company)Public Director - elected 1984(1) (4) (5) (8) (10)
Hazel R. O’LearyPresidentO’Leary and Associates(Energy services and investment strategy)Independent Director - elected 1999(1) (2) (3) (4) (6) (10)
John F. PeterpaulRetired General Vice PresidentInternational Association of Machinists District #141(Labor union)Employee Director - elected 1994(2) (4) (5) (6) (9)
UAL CORPORATIONBOARD OF DIRECTORS
Paul E. Tierney, Jr.General Partner, Darwin Capital Partners and Managing Member Development Capital, LLC(Investment management)Public Director - elected 1990(1) (4) (7) (8) (10)
John K. Van de KampPresidentThoroughbred Owners of California(Trade association)Independent Director - elected 1994(1) (4) (5) (6) (7) (9) (10)
John H. WalkerChief Executive OfficerWeirton Steel Corporation(Steel manufacturer)Independent Director - appointed 2002(1) (6) (9) (10)
Paul R. Whiteford, Jr.United Airlines Pilots Master Executive Council ChairmanAir Line Pilots Association International(Labor union)Employee Director - elected 2001(2) (4) (5) (6) (9)
UAL CORPORATIONOFFICERS
John W. Creighton, Jr.Chairman and Chief Executive Officer
Rono J. DuttaPresident
Andrew P. StuddertExecutive Vice President and Chief Operating Officer
Frederic F. BraceSenior Vice President and Chief Financial Officer
Francesca M. MaherSenior Vice President, General Counsel and Secretary
Committee Legend:(1) Audit Committee(2) Compensation Committee(3) Compensation Administration Committee(4) CAP (Competitive Action Plan) Committee(5) Executive Committee(6) Independent Director Nomination Committee(7) Labor Committee(8) Outside Public Director Nomination Committee(9) Pension and Welfare Plans Oversight Committee
(10) Transaction Committee
30899_Body 3/22/02 6:17 PM Page 46
KS
PO
TS
PO
TU
AL
#30
899
Ass
m:
NS
47UAL Corporation 2001 Annual Report
John W. Creighton, Jr.*Chairman and Chief Executive Officer
Rono J. Dutta*President
Douglas A. HackerExecutive Vice President
Andrew P. Studdert*Executive Vice President and Chief Operating Officer
Graham W. AtkinsonSenior Vice President - International
Christopher D. Bowers*Senior Vice President - Marketing, Sales and Reservations
Frederic F. Brace*Senior Vice President and Chief Financial Officer
Eric C. DeanSenior Vice President - Information Services and ChiefInformation Officer
Larry D. De ShonSenior Vice President - Onboard Service
Sara A. Fields*Senior Vice President - People Services and Engagement
Stephen A. ForteSenior Vice President - Flight Operations
Shelley A. LongmuirSenior Vice President - Governmental Affairs
Francesca M. Maher*Senior Vice President, General Counsel and Secretary
Peter D. McDonaldSenior Vice President - Airport Operations
Ronald D. UtechtSenior Vice President - Maintenance and Engineering
Stephen M. BeatusVice President - Latin America
Judith A. BishopVice President - Atlantic
James C. BrennanVice President - Pacific - South
Patricia L. CarsonVice President - Human Resources
Sean P. DonohueVice President - North America Sales
Roger A. GibsonVice President - Worldwide Cargo
M. Lynn HughittVice President and Controller
Richard S. JusterVice President - Purchasing
Peter B. KainVice President - Labor Relations
Amos S. KazzazVice President - Corporate Real Estate
James E. KeenanVice President - Engineering and Technical Support
Frank R. KentVice President - North America Sales
John D. KikerVice President - Worldwide Communications
Kevin N. KnightVice President - Resource Planning
Henry P. KrakowskiVice President - Corporate Safety, Security and Quality Assurance
Joseph F. LaughlinVice President - North America Operations
Mark S. LibermanVice President - North America Operations
Rick A. MaloneyVice President - Flight and System Chief Pilot
Patricia A. MashVice President - Revenue Management
William R. NormanVice President - Line Maintenance
M. Scott PravenVice President - E-Commerce
Mark F. SchwabVice President - Pacific - North
Daniel C. WalshVice President - North America Sales
Michael G. WhitakerVice President - International Affairs
Glenn S. WrightVice President - North America Operations
UNITED AIRLINESDIRECTORS* AND OFFICERS
30899_Body 3/22/02 6:17 PM Page 47
KS
PO
TS
PO
TU
AL
#30
899
Ass
m:
NS
48 UAL Corporation 2001 Annual Report
STOCKHOLDER INFORMATION
World Headquarters1200 E. Algonquin RoadElk Grove Township, IL 60007(847) 700-4000
Mailing AddressesUAL CorporationP.O. Box 66919Chicago, IL 60666
United AirlinesP.O. Box 66100Chicago, IL 60666
Stock ListingUAL Corporation’s common stock is listed, under thesymbol UAL, on the following exchanges: New YorkStock Exchange, Chicago Stock Exchange andPacific Stock Exchange.
Stockholder QuestionsInformation relating to a stockholder’s dividends, thedividend reinvestment and direct stock purchaseplans, transfer requirements, lost certificates andother related matters may be obtained from thetransfer agent:
Computershare Investor Services2 N. LaSalle StreetChicago, IL 60602(800) 647-4488
The transfer agent’s “Telephone Response Center” isopen Monday through Friday. (Account information isavailable from 8:30 a.m. CST through 5:00 p.m. CST.)
Stockholders will be asked for their tax identificationnumber, the name(s) in which the shares are registeredand their record address. Alternatively, stockholdersmay write to the office of the Corporate Secretary,UAL Corporation.
Debentures9%, 9.125%, 9.75%, 10.25%, 10.67% and 11.21%
Trustee and Paying AgentThe Bank of New York101 Barclay StreetNew York, NY 10286
Financial InformationA copy of UAL Corporation’s current annual report tothe Securities and Exchange Commission on Form10-K, as well as other financial information, may beobtained without charge from:
Investor RelationsUAL CorporationP.O. Box 66919Chicago, IL [email protected]
This information is also available on United’s website (www.united.com) in the “Investor Relations”section under “Company Information.”
General InformationGeneral background information on the company orinformation regarding the United Airlines Foundationmay be obtained from Worldwide Communications,United Airlines.
UAL CORPORATION COMMON STOCK MARKET PRICES ANDDIVIDEND INFORMATION (PER SHARE)
DividendsHigh Low Paid
2001 First Quarter $45.50 $30.50 $0.3125Second Quarter 38.50 30.50 0.3125Third Quarter 36.54 16.22 0.0500Fourth Quarter 20.10 9.40 –
2000 First Quarter $79 $45 3/4 $ –Second Quarter 65 1/8 49 0.3125Third Quarter 61 5/8 40 1/4 0.3125Fourth Quarter 43 15/16 34 1/16 0.3125
The company paid a quarterly dividend of $0.3125 per share during the first and second quarters of 2001. The Board of Directors reducedthe third quarter dividend from $0.3125 to $0.05 per share on July 3, 2001. The Board of Directors suspended future dividend payments onSeptember 27, 2001. The payment of any future dividends on the common stock, and the amount of any future dividends, will be determinedby the directors of the company based on earnings, the financial condition of the company and other relevant factors.
30899_Body 3/22/02 6:17 PM Page 48

In the interest of conservation, UAL Corporation’s annual report is printed on recycled paper and is recyclable.
3 3 3 3 3 3 3 3 3 3 3 K
UAL #30899 Assm: TF30899_Cvr 3/22/02 6:12 PM Page 3

3 3 3 3 3 3 3 3 3 3 3
UAL #30899 Assm: TF
541 541#2
30899_Cvr 3/22/02 6:12 PM Page 4