Embed Size (px)
Citation preview
SECURITIES AND EXCHANGE COMMISSIONWASHINGTON, D.C. 20549
FORM 10-K(Mark One) [X] ANNUAL REPORT PURSUANT TO SECTION 13 OR 15(d) OF THE SECURITIES EXCHANGE ACT OF 1934 For the fiscal year ended October 31, 2002
OR [ ] TRANSITION REPORT PURSUANT TO SECTION 13 OR 15(d) OF THE SECURITIES EXCHANGE ACT OF 1934 For the transition period from to
Commission file number 1-9186
TOLL BROTHERS, INC. (Exact name of Registrant as specified in its charter)
Delaware 23-2416878 (State or other jurisdiction of I.R.S. Employer incorporation or organization) Identification No.)
3103 Philmont Avenue, Huntingdon Valley, Pennsylvania 19006-4298 (Address of principal executive offices) (Zip Code) Registrant's telephone number, including area code (215) 938-8000
Securities registered pursuant to Section 12(b) of the Act: Name of each exchange on Title of each class which registered Common Stock (par value $.01)* New York Stock Exchange
and Pacific Exchange * Includes associated Right to Purchase Series A Junior Participating Preferred Stock.
Securities registered pursuant to Section 12(g) of the Act: None
Indicate by check mark whether the Registrant (1) has filed all reportsrequired to be filed by Section 13 or 15(d) of the Securities Exchange Act of1934 during the preceding 12 months (or for such shorter period that theRegistrant was required to file such reports), and (2) has been subject tosuch filing requirements for the past 90 days. Yes [ X ] No[ ]
Indicate by check mark if disclosure of delinquent filers pursuant to Item405 of Regulation S-K is not contained herein, and will not be contained, tothe best of Registrant's knowledge, in definitive proxy or informationstatements incorporated by reference in Part III of this Form 10-K or anyamendment to this Form 10-K. [ X ]
Indicate by check mark whether the Registrant is an accelerated filer (asdefined in Exchange Act Rule 12b-2). Yes [ X ] No [ ]
As of December 31, 2002 the aggregate market value of the Common Stock heldby non-affiliates (all persons other than executive officers and directors ofRegistrant) of the Registrant was approximately $1,030,887,000.
As of December 31, 2002, there were 70,493,425 shares of Common Stockoutstanding.
Documents Incorporated by Reference: Portions of the proxy statement of TollBrothers, Inc. with respect to the 2003 Annual Meeting of Stockholders,scheduled to be held on March 20, 2003, are incorporated by reference intoItems 10 through 13 hereof.
PART I
ITEM 1. BUSINESSGeneral
Toll Brothers, Inc., a Delaware corporation formed in May 1986, began doingbusiness through predecessor entities in 1967. When this report uses thewords "we," "us," and "our," these words refer to Toll Brothers, Inc. and itssubsidiaries, unless the context otherwise requires.
We design, build, market and arrange financing for single-family detached andattached homes in middle-income and high-income residential communitiescatering to move-up, empty-nester and active-adult age-qualified homebuyersin 22 states in six regions around the United States. Our communities aregenerally located on land we have either developed or acquired fully approvedand, in some cases, improved. Currently, we operate in the major suburbanresidential areas of:
• southeastern Pennsylvania and Delaware• central New Jersey• the Virginia and Maryland suburbs of Washington, D.C.• Baltimore County, Maryland• the Boston, Massachusetts metropolitan area• Rhode Island• Southern New Hampshire• Fairfield, New Haven and Hartford Counties, Connecticut• Westchester and Dutchess Counties, New York• the Los Angeles metropolitan area and San Diego, California• the San Francisco Bay area of northern California• Palm Springs, California• the Phoenix, Arizona metropolitan area• Raleigh and Charlotte, North Carolina• Dallas, Austin and San Antonio, Texas• the east and west coasts of Florida• Las Vegas, Nevada• Columbus, Ohio• Nashville, Tennessee• Detroit, Michigan• Chicago, Illinois• Denver, Colorado• the Hilton Head area of South Carolina
We continue to explore additional geographic areas for expansion.
We market our homes primarily to middle-income and upper-income buyers,emphasizing high quality construction and customer satisfaction. In the fiveyears ended October 31, 2002, we delivered 19,387 homes from 372 communities,including 4,430 homes from 212 communities delivered in fiscal 2002.
We operate our own land development, architectural, engineering, mortgage,title, security monitoring, landscape, cable T.V., broadband Internet access,lumber distribution, house component assembly and manufacturing operations.We also own and operate golf courses and country clubs in conjunction withseveral of our master planned communities.
2
In order to take advantage of commercial real estate opportunities which maypresent themselves from time to time, we formed Toll Brothers Realty TrustGroup (the "Trust") in 1998. The Trust is owned one-third by us, one-third bya number of our senior executives and/or directors, including Robert I. Toll,Bruce E. Toll (and members of his family), Zvi Barzilay (and members of hisfamily) and Joel H. Rassman, and one-third by the Pennsylvania StateEmployees Retirement System. We provide development, finance and managementservices to the Trust and receive fees for our services. The Trust currentlyowns and operates several office buildings and an apartment complex, aportion of which is rented and a portion of which remains under construction.
At October 31, 2002, we were operating in 243 communities containing over21,800 home sites which we owned or controlled through options. Of the 243communities, 170 were offering homes for sale, 34 had not yet opened for saleand 39 were sold out but all home deliveries had not been completed. AtOctober 31, 2002, we also owned or controlled through options approximately19,000 home sites in 157 proposed communities. We expect to haveapproximately 185 selling communities by October 31, 2003. Of theapproximately 40,800 lots owned or controlled through options at October 31,2002, we owned approximately 25,800 of them.
At October 31, 2002, we were offering single-family detached homes at prices,excluding customized options, generally ranging from $233,000 to $1,493,000with an average base sales price of $501,000. We were offering single-familyattached homes at prices, excluding customized options, generally rangingfrom $166,000 to $622,000, with an average base sales price of $322,000. Onaverage, homebuyers added approximately 21% in options and lot premiums tothe base price of homes delivered in fiscal 2002.
We had backlogs of $1.87 billion (3,366 homes) at October 31, 2002 and $1.41billion (2,727 homes) at October 31, 2001. We expect that substantially allhomes in backlog at October 31, 2002 will be delivered by October 31, 2003.
In recognition of our achievements, we have received numerous awards fromnational, state and local homebuilder publications and associations. We arethe only publicly traded national homebuilder to have won all three of theindustry's highest honors: America's Best Builder (1996), the NationalHousing Quality Award (1995), and Builder of the Year (1988).
We attempt to reduce certain risks homebuilders encounter by controlling landfor future development through options whenever possible, thus allowing us toobtain the necessary governmental approvals before acquiring title to theland; by generally commencing construction of a home only after executing anagreement of sale with a buyer; and by using subcontractors to perform homeconstruction and land development work on a fixed-price basis. In order toobtain better terms or prices, or due to competitive pressures, we maypurchase properties outright, or acquire an underlying mortgage, prior toobtaining all of the governmental approvals necessary to commencedevelopment.
For financial information pertaining to revenues, earnings and assets, pleasesee the accompanying financial statements and notes thereto.
3
Our Communities
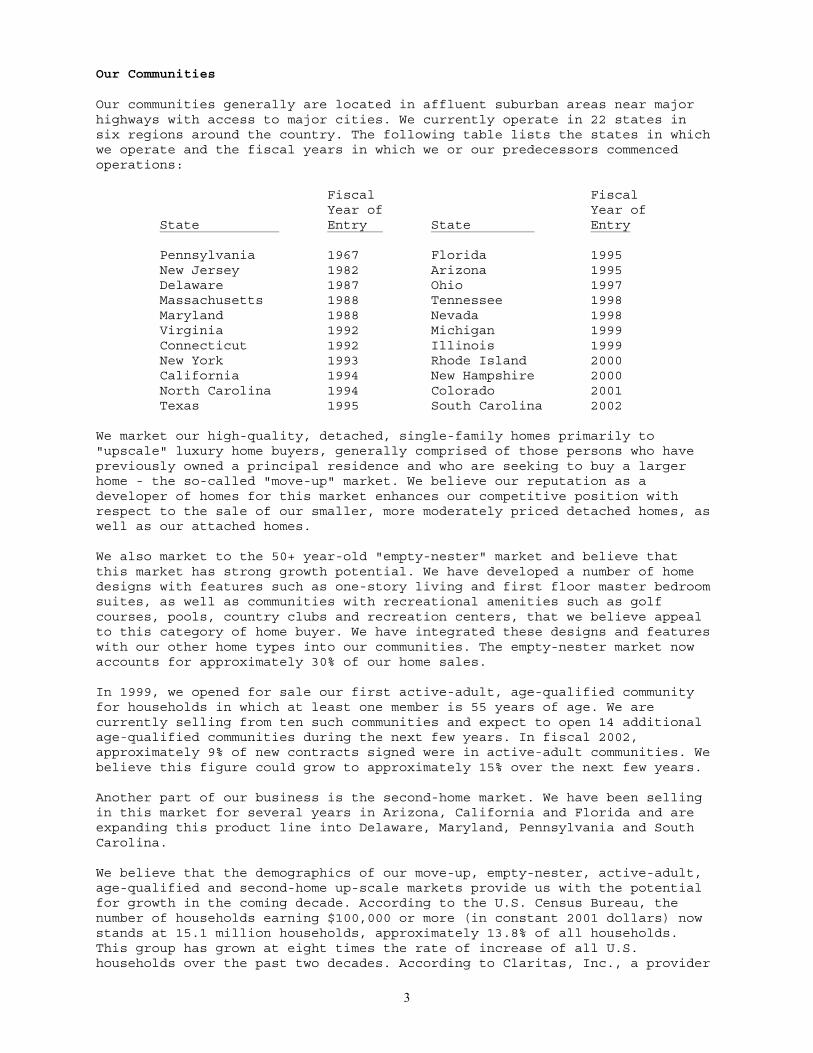
Our communities generally are located in affluent suburban areas near majorhighways with access to major cities. We currently operate in 22 states insix regions around the country. The following table lists the states in whichwe operate and the fiscal years in which we or our predecessors commencedoperations:
Fiscal Fiscal Year of Year of State Entry State Entry
Pennsylvania 1967 Florida 1995 New Jersey 1982 Arizona 1995 Delaware 1987 Ohio 1997 Massachusetts 1988 Tennessee 1998 Maryland 1988 Nevada 1998 Virginia 1992 Michigan 1999 Connecticut 1992 Illinois 1999 New York 1993 Rhode Island 2000 California 1994 New Hampshire 2000 North Carolina 1994 Colorado 2001 Texas 1995 South Carolina 2002
We market our high-quality, detached, single-family homes primarily to"upscale" luxury home buyers, generally comprised of those persons who havepreviously owned a principal residence and who are seeking to buy a largerhome - the so-called "move-up" market. We believe our reputation as adeveloper of homes for this market enhances our competitive position withrespect to the sale of our smaller, more moderately priced detached homes, aswell as our attached homes.
We also market to the 50+ year-old "empty-nester" market and believe thatthis market has strong growth potential. We have developed a number of homedesigns with features such as one-story living and first floor master bedroomsuites, as well as communities with recreational amenities such as golfcourses, pools, country clubs and recreation centers, that we believe appealto this category of home buyer. We have integrated these designs and featureswith our other home types into our communities. The empty-nester market nowaccounts for approximately 30% of our home sales.
In 1999, we opened for sale our first active-adult, age-qualified communityfor households in which at least one member is 55 years of age. We arecurrently selling from ten such communities and expect to open 14 additionalage-qualified communities during the next few years. In fiscal 2002,approximately 9% of new contracts signed were in active-adult communities. Webelieve this figure could grow to approximately 15% over the next few years.
Another part of our business is the second-home market. We have been sellingin this market for several years in Arizona, California and Florida and areexpanding this product line into Delaware, Maryland, Pennsylvania and SouthCarolina.
We believe that the demographics of our move-up, empty-nester, active-adult,age-qualified and second-home up-scale markets provide us with the potentialfor growth in the coming decade. According to the U.S. Census Bureau, thenumber of households earning $100,000 or more (in constant 2001 dollars) nowstands at 15.1 million households, approximately 13.8% of all households.This group has grown at eight times the rate of increase of all U.S.households over the past two decades. According to Claritas, Inc., a provider
4
of demographic information, approximately seven million of these householdsare located in our current markets.
The largest group of baby boomers, the more than four million born annuallybetween 1954 and 1964, are now 38 to 48 years of age and in their peak move-up home buying years. The leading edge of the baby boom generation has nowentered its 50s and the empty-nester market. The number of households withpersons 55 to 64 years old, the focus of our age-qualified communities, isprojected to increase by over 47% by the Year 2010 according to the U.S.Census Bureau. American Demographics magazine predicts that, as the babyboomers mature and become more affluent, second home ownership will grow fromapproximately 6.4 million homes in 2000 to 10 million homes in 2010.
We also develop master planned communities and currently have 14 suchcommunities containing approximately 12,700 home sites. We expect to openseveral additional communities during the next few years. These communities,many of which contain golf courses and other country club type amenities,enable us to offer multiple home types and sizes to a broad range of move-up,empty-nester, active-adult and second-home buyers. We realize efficienciesfrom shared common costs such as land development and infrastructure over theseveral communities within the master planned community. We currently haveopen master planned communities in California, Florida, Michigan, NorthCarolina, Pennsylvania, Virginia and South Carolina.
Each single-family detached-home community offers several home plans, withthe opportunity for homebuyers to select various exterior styles. We designeach community to fit existing land characteristics. We strive to achievediversity among architectural styles within an overall planned community byoffering a variety of house models and several exterior design options foreach house model, by preserving existing trees and foliage wheneverpracticable, and by curving street layouts which allow relatively few homesto be seen from any vantage point. Normally, homes of the same type or colormay not be built next to each other. Our communities have attractiveentrances with distinctive signage and landscaping. We believe that our addedattention to community detail avoids a "development" appearance and giveseach community a diversified neighborhood appearance that enhances homevalues.
Our attached home communities generally offer one- to four-story homes,provide for limited exterior options and often include commonly-ownedrecreational facilities such as playing fields, swimming pools and tenniscourts.
Our Homes
In most of our single-family detached-home communities, we offer at leastfour different house floor plans, each with several substantially differentarchitectural styles. In addition, the exterior of each basic floor plan maybe varied further by the use of stone, stucco, brick or siding. Attached homecommunities generally offer two or three different floor plans with two,three or four bedrooms.
In all of our communities, a wide selection of options is available topurchasers for additional charges. The number and complexity of optionstypically increase with the size and base selling price of our homes. Majoroptions include additional garages, guest suites and other additional rooms,finished lofts and extra fireplaces. On average, options purchased by ourhomebuyers, including lot premiums, added approximately 21% to the base priceof homes purchased in fiscal 2002.
5
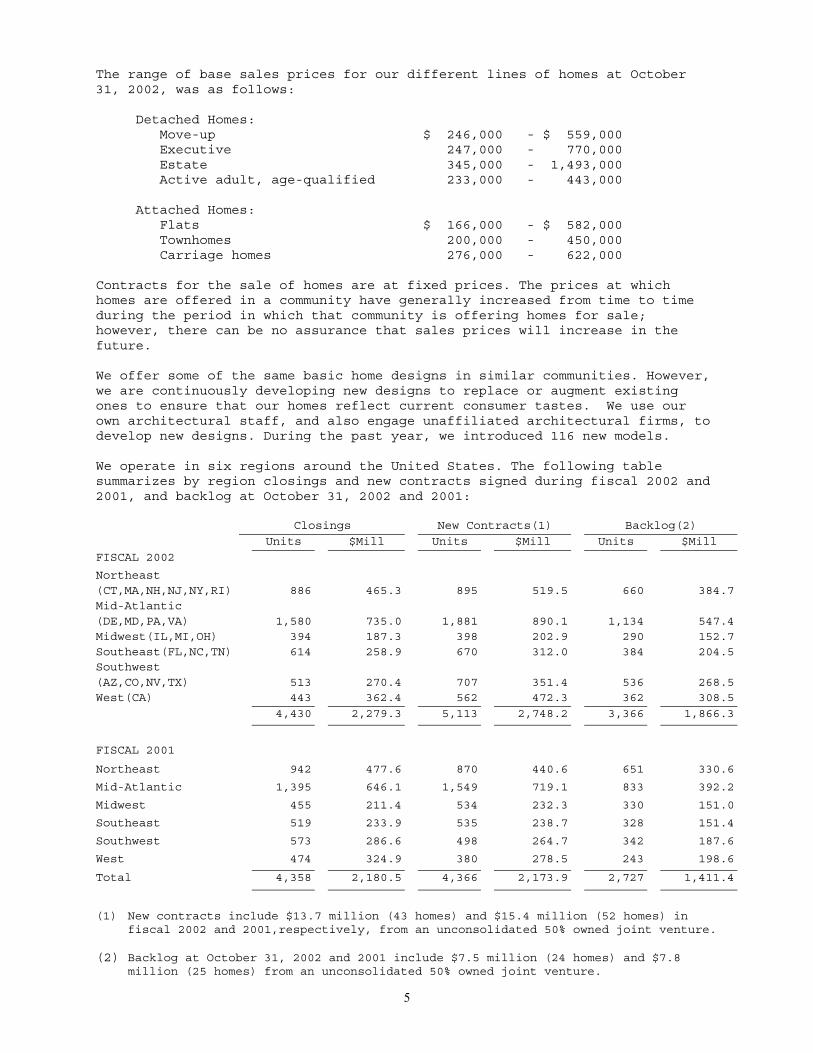
The range of base sales prices for our different lines of homes at October31, 2002, was as follows:
Detached Homes: Move-up $ 246,000 - $ 559,000 Executive 247,000 - 770,000 Estate 345,000 - 1,493,000 Active adult, age-qualified 233,000 - 443,000
Attached Homes: Flats $ 166,000 - $ 582,000 Townhomes 200,000 - 450,000 Carriage homes 276,000 - 622,000
Contracts for the sale of homes are at fixed prices. The prices at whichhomes are offered in a community have generally increased from time to timeduring the period in which that community is offering homes for sale;however, there can be no assurance that sales prices will increase in thefuture.
We offer some of the same basic home designs in similar communities. However,we are continuously developing new designs to replace or augment existingones to ensure that our homes reflect current consumer tastes. We use ourown architectural staff, and also engage unaffiliated architectural firms, todevelop new designs. During the past year, we introduced 116 new models.
We operate in six regions around the United States. The following tablesummarizes by region closings and new contracts signed during fiscal 2002 and2001, and backlog at October 31, 2002 and 2001:
Closings New Contracts(1) Backlog(2)
Units $Mill Units $Mill Units $Mill
FISCAL 2002
Northeast(CT,MA,NH,NJ,NY,RI) 886 465.3 895 519.5 660 384.7Mid-Atlantic(DE,MD,PA,VA) 1,580 735.0 1,881 890.1 1,134 547.4Midwest(IL,MI,OH) 394 187.3 398 202.9 290 152.7Southeast(FL,NC,TN) 614 258.9 670 312.0 384 204.5Southwest(AZ,CO,NV,TX) 513 270.4 707 351.4 536 268.5West(CA) 443 362.4 562 472.3 362 308.5
4,430 2,279.3 5,113 2,748.2 3,366 1,866.3
FISCAL 2001
Northeast 942 477.6 870 440.6 651 330.6
Mid-Atlantic 1,395 646.1 1,549 719.1 833 392.2
Midwest 455 211.4 534 232.3 330 151.0
Southeast 519 233.9 535 238.7 328 151.4
Southwest 573 286.6 498 264.7 342 187.6
West 474 324.9 380 278.5 243 198.6
Total 4,358 2,180.5 4,366 2,173.9 2,727 1,411.4
(1) New contracts include $13.7 million (43 homes) and $15.4 million (52 homes) infiscal 2002 and 2001,respectively, from an unconsolidated 50% owned joint venture.
(2) Backlog at October 31, 2002 and 2001 include $7.5 million (24 homes) and $7.8million (25 homes) from an unconsolidated 50% owned joint venture.
6
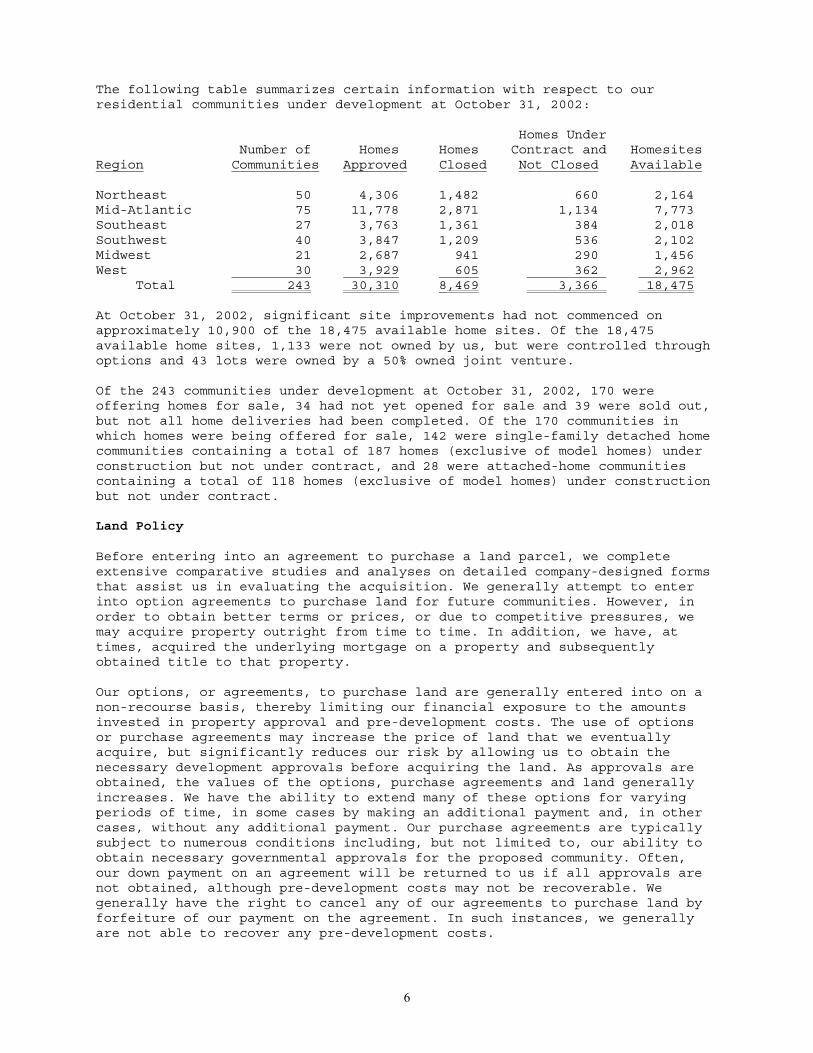
The following table summarizes certain information with respect to ourresidential communities under development at October 31, 2002:
Homes Under Number of Homes Homes Contract and HomesitesRegion Communities Approved Closed Not Closed Available
Northeast 50 4,306 1,482 660 2,164Mid-Atlantic 75 11,778 2,871 1,134 7,773Southeast 27 3,763 1,361 384 2,018Southwest 40 3,847 1,209 536 2,102Midwest 21 2,687 941 290 1,456West 30 3,929 605 362 2,962 Total 243 30,310 8,469 3,366 18,475
At October 31, 2002, significant site improvements had not commenced onapproximately 10,900 of the 18,475 available home sites. Of the 18,475available home sites, 1,133 were not owned by us, but were controlled throughoptions and 43 lots were owned by a 50% owned joint venture.
Of the 243 communities under development at October 31, 2002, 170 wereoffering homes for sale, 34 had not yet opened for sale and 39 were sold out,but not all home deliveries had been completed. Of the 170 communities inwhich homes were being offered for sale, 142 were single-family detached homecommunities containing a total of 187 homes (exclusive of model homes) underconstruction but not under contract, and 28 were attached-home communitiescontaining a total of 118 homes (exclusive of model homes) under constructionbut not under contract.
Land Policy
Before entering into an agreement to purchase a land parcel, we completeextensive comparative studies and analyses on detailed company-designed formsthat assist us in evaluating the acquisition. We generally attempt to enterinto option agreements to purchase land for future communities. However, inorder to obtain better terms or prices, or due to competitive pressures, wemay acquire property outright from time to time. In addition, we have, attimes, acquired the underlying mortgage on a property and subsequentlyobtained title to that property.
Our options, or agreements, to purchase land are generally entered into on anon-recourse basis, thereby limiting our financial exposure to the amountsinvested in property approval and pre-development costs. The use of optionsor purchase agreements may increase the price of land that we eventuallyacquire, but significantly reduces our risk by allowing us to obtain thenecessary development approvals before acquiring the land. As approvals areobtained, the values of the options, purchase agreements and land generallyincreases. We have the ability to extend many of these options for varyingperiods of time, in some cases by making an additional payment and, in othercases, without any additional payment. Our purchase agreements are typicallysubject to numerous conditions including, but not limited to, our ability toobtain necessary governmental approvals for the proposed community. Often,our down payment on an agreement will be returned to us if all approvals arenot obtained, although pre-development costs may not be recoverable. Wegenerally have the right to cancel any of our agreements to purchase land byforfeiture of our payment on the agreement. In such instances, we generallyare not able to recover any pre-development costs.

7
Our ability to continue development activities over the long-term will bedependent upon our continued ability to locate and enter into options oragreements to purchase land, obtain governmental approvals for suitableparcels of land, and consummate the acquisition and complete the developmentof such land.
While we believe that there is significant diversity in our existing marketsand that this diversity provides some protection from the vagaries ofindividual local economies, we believe that greater geographicdiversification will provide additional protection and more opportunities forgrowth. We continue to look to enter new markets.
The following is a summary, at October 31, 2002, of the parcels of land thatwe either owned or controlled through options or purchase agreements forproposed communities, as distinguished from those currently underdevelopment:
Number of Number ofRegion Communities Homes Planned
Northeast 49 5,605Mid-Atlantic 72 8,931Southeast 6 931Southwest 16 2,061Midwest 7 957West 7 518 Total 157 19,003
Of the 19,003 planned home sites, 5,114 of them were owned by us. At October31, 2002, the aggregate purchase price of land parcels under option andpurchase agreements was approximately $860 million, of which we had paid ordeposited approximately $64 million.
We evaluate all of the land under our control for proposed communities on anongoing basis with respect to economic and market feasibility. During theyear ended October 31, 2002, such feasibility analyses resulted inapproximately $2.5 million of capitalized costs related to proposedcommunities being charged to expense because they were no longer deemed to berecoverable.
There can be no assurance that we will be successful in securing thenecessary development approvals for the land currently under our control orfor land we may acquire control of in the future or that, upon obtaining suchdevelopment approvals, we will elect to complete the purchases of land underoption or complete the development of land that we own. We have generallybeen successful in the past in obtaining governmental approvals, havesubstantial land currently under control for which we have obtained or areseeking approvals (as set forth in the table above), and devote significantresources to locating suitable land for future development and to obtainingthe required approvals on land under our control. Failure to locatesufficient suitable land or to obtain necessary governmental approvals mayimpair our ability over the long-term to maintain current levels ofdevelopment activities.
We believe that we have an adequate supply of land in our existingcommunities or held for future development (assuming that all properties aredeveloped) to maintain our operations at current levels for several years.

8
Community Development
We expend considerable effort in developing a concept for each community,which includes determining the size, style and price range of the homes, thelayout of the streets and individual lots, and the overall community design.After obtaining the necessary governmental subdivision and other approvals,which may take several years, we improve the land by grading and clearing it;installing roads, recreational amenities and underground utility lines;erecting distinctive entrance structures; and staking out individual homesites.
Each community is managed by a project manager who is usually located at thesite. Working with sales staff, construction managers, marketing personneland, when required, other in-house and outside professionals such asaccountants, engineers, architects and legal counsel, the project manager isresponsible for supervising and coordinating the various developmental stepsfrom the approval stage through land acquisition, marketing, selling,construction and customer service, and for monitoring the progress of workand controlling expenditures. Major decisions regarding each community aremade in consultation with senior members of our management team.
We recognize revenue from home sales only when title and possession of a homeare transferred to the buyer, which generally occurs shortly after homeconstruction is substantially completed. The most significant variableaffecting the timing of our revenue stream, other than housing demand, isreceipt of final land regulatory approvals, which, in turn, permits us tobegin the process of obtaining executed sales contracts from home buyers.Receipt of such final approvals is not seasonal. Although our sales andconstruction activities vary somewhat by season, which affects the timing ofclosings, any such seasonal effect is relatively insignificant compared tothe effect of receipt of final governmental approvals.
Subcontractors perform all home construction and land development work,generally under fixed-price contracts. We act as a general contractor andpurchase some, but not all, of the building supplies we require. See"Manufacturing/Distribution Facilities" in Item 2. While we have experiencedsome shortages from time to time in the availability of subcontractors insome markets, we do not anticipate any material effect from these shortageson our home building operations.
Our construction managers and assistant construction managers coordinatesubcontracting activities and supervise all aspects of construction work andquality control. One of the ways we seek to achieve home buyer satisfactionis by providing our construction managers with incentive compensationarrangements based on each home buyer's satisfaction as expressed by theirresponses on pre-closing and post-closing questionnaires.
We maintain insurance, subject to deductibles and self-insured retentions, toprotect us against various risks associated with our activities including,among others, general liability, "all-risk" property, workers' compensation,automobile, and employee fidelity. We accrue for our expected costsassociated with the deductibles and self-insured retentions.
Marketing
We believe that our marketing strategy, which emphasizes our more expensive"Estate" and "Executive" lines of homes, has enhanced our reputation as abuilder-developer of high-quality upscale housing. We believe this reputationresults in greater demand for all of our lines of homes. To enhance thisimage, we generally include attractive decorative features such as chairrails, crown moldings, dentil moldings, vaulted and coffered ceilings and

9
other aesthetic elements, even in our less expensive homes, based on ourbelief that this additional construction expense improves our marketing andsales effort.
In determining the prices for our homes, we utilize, in addition tomanagement's extensive experience, an internally developed value analysisprogram that compares our homes with homes offered by other builders in eachlocal marketing area. In our application of this program, we assign apositive or negative dollar value to differences between our product featuresand those of our competitors, such as house and community amenities, locationand reputation.
We expend great effort in designing and decorating our model homes, whichplay an important role in our marketing. In our models, we create anattractive atmosphere, with bread baking in the oven, fires burning infireplaces, and music playing in the background. Interior decorating variesamong the models and is carefully selected to reflect the lifestyles ofprospective buyers. During the past several years, we have received numerousawards from various homebuilder associations for our interior merchandising.
We typically have a sales office in each community that is staffed by our ownsales personnel. Sales personnel are generally compensated with both salaryand commission. A significant portion of our sales is derived from theintroduction of customers to our communities by local cooperating realtors.
We advertise extensively in newspapers, other local and regionalpublications, and on billboards. We also use videotapes and attractive colorbrochures to market our communities. The Internet is also an importantresource we use in marketing and providing information to our customers. Avisitor to our award winning website, www.tollbrothers.com, can obtaindetailed information regarding our communities and homes across the countryand take panoramic or video tours of our homes.
All our homes are sold under our limited warranty as to workmanship andmechanical equipment. Many homes also come with a limited ten-year warrantyas to structural integrity.
Competition
The homebuilding business is highly competitive and fragmented. We competewith numerous homebuilders of varying sizes, ranging from local to nationalin scope, some of which have greater sales and financial resources than wehave. Sales of existing homes also provide competition. We compete primarilyon the basis of price, location, design, quality, service and reputation;however, we believe our financial stability, relative to others in ourindustry, has become an increasingly favorable competitive factor.
Regulation and Environmental Matters
We are subject to various local, state and federal statutes, ordinances,rules and regulations concerning zoning, building design, construction andsimilar matters, including local regulations which impose restrictive zoningand density requirements in order to limit the number of homes that caneventually be built within the boundaries of a particular property orlocality. In a number of our markets, there has been an increase in state andlocal legislation authorizing the acquisition of land as dedicated openspace, mainly by governmental, quasi-public and non-profit entities. Inaddition, we are subject to various licensing, registration and filingrequirements in connection with the construction, advertisement and sale ofhomes in our communities. Although these laws have increased our overallcosts, they have not had a material effect on us, except to the extent that
10
their application may have delayed the opening of communities or caused us toconclude that development of a proposed community would not be economicallyfeasible, even if any or all necessary governmental approvals were obtained.See "Land Policy" in this Item 1. We also may be subject to periodic delaysor may be precluded entirely from developing communities due to buildingmoratoriums in one or more of the areas in which we operate. Generally, suchmoratoriums relate to insufficient water or sewage facilities, or inadequateroad capacity.
In order to secure certain approvals, in some areas, we may have to provideaffordable housing at below market rental or sales prices. The impact on uswill depend on how the various state and local governments in the areas inwhich we engage, or intend to engage, in development, implement theirprograms for affordable housing. To date, these restrictions have not had amaterial impact on us.
We also are subject to a variety of local, state and federal statutes,ordinances, rules and regulations concerning protection of public health andthe environment ("environmental laws"). The particular environmental lawsthat apply to any given community vary greatly according to the location andenvironmental condition of the site, and the present and former uses of thesite. These environmental laws may result in delays, may cause us to incursubstantial compliance and other costs, and/or may prohibit or severelyrestrict development in certain environmentally sensitive regions or areas.
We maintain a policy of engaging independent environmental consultants toevaluate land for the potential of hazardous or toxic materials, wastes orsubstances before consummating an acquisition. Because we generally haveobtained such assessments for the land we have purchased, we have not beensignificantly affected to date by the presence of such materials.
Employees
At October 31, 2002, we employed 2,960 full-time persons; of these, 120 werein executive positions, 344 were engaged in sales activities, 309 were inproject management activities, 1,183 were in administrative and clericalactivities, 686 were in construction activities, 154 were in architecturaland engineering activities and 164 were in manufacturing and distribution. Weconsider our employee relations to be good.
Factors That May Affect Our Future Results(Cautionary Statements Under the Private Securities Litigation Reform Act of1995)
Certain information included in this report or in other materials we havefiled or will file with the Securities and Exchange Commission (as well asinformation included in oral statements or other written statements made orto be made by us) contains or may contain forward-looking statements withinthe meaning of Section 27A of the Securities Act of 1933, as amended. You canidentify these statements by the fact that they do not relate strictly tohistorical or current facts. They contain words like "anticipate,""estimate," "expect," "project," "intend," "plan," "believe," "may," "can,""could," "might" and other words or phrases of similar meaning in connectionwith any discussion of future operating or financial performance. Suchstatements include information relating to anticipated operating results,financial resources, changes in revenues, changes in profitability, interestexpense, growth and expansion, anticipated income to be realized from ourinvestments in joint ventures and the Toll Brothers Realty Trust Group, theability to acquire land, the ability to gain approvals and to open newcommunities, the ability to sell homes and properties, the ability to deliverhomes from backlog, the ability to secure materials and subcontractors, the
11
ability to produce the liquidity and capital necessary to expand and takeadvantage of opportunities in the future, and stock market valuations. Fromtime to time, forward-looking statements also are included in our otherperiodic reports on Forms 10-Q and 8-K, in press releases and in othermaterial released to the public.
Any or all of the forward-looking statements included in this report and inany other reports or public statements made by us may turn out to beinaccurate. This can occur as a result of incorrect assumptions or as aconsequence of known or unknown risks and uncertainties. Many factorsmentioned in this report or in other reports or public statements made by us,such as government regulation and the competitive environment, will beimportant in determining our future performance. Consequently, actual resultsmay differ materially from those that might be anticipated from our forward-looking statements.
We undertake no obligation to publicly update any forward-looking statements,whether as a result of new information, future events or otherwise. However,any further disclosures made on related subjects in our subsequent reports onForms 10-K, 10-Q and 8-K should be consulted. The following cautionarydiscussion of risks, uncertainties and possible inaccurate assumptionsrelevant to our business includes factors we believe could cause our actualresults to differ materially from expected and historical results. Otherfactors beyond those listed below, including factors unknown to us andfactors known to us which we have not determined to be material, could alsoadversely affect us. This discussion is provided as permitted by the PrivateSecurities Litigation Reform Act of 1995, and all of our forward-lookingstatements are expressly qualified in their entirety by the cautionarystatements contained or referenced in this section.
We operate in a very competitive environment, which is characterized bycompetition from a number of other homebuilders in each market in whichwe operate. Actions or changes in plans by competitors may negativelyaffect us.
Our business can be affected by changes in general economic and marketconditions, as well as local economic and market conditions where ouroperations are conducted and where prospective purchasers of our homeslive.
The impact and uncertainties created by the September 11, 2001 terroristattacks and the consequences of any future terrorist attacks, as well asother events affecting the national and world economies, may affect ourbusiness.
The plans for future development of our residential communities can beaffected by a number of factors including, for example, time delays inobtaining necessary governmental permits and approvals and legalchallenges to our proposed communities.
Our operations depend on our ability to continue to obtain land for thedevelopment of residential communities at reasonable prices. Changes incompetition, availability of financing, customer trends and marketconditions may impact our ability to obtain land for new residentialcommunities.
The development of our residential communities may be affected bycircumstances beyond our control, including weather conditions, workstoppages, labor disputes, unforeseen engineering, environmental orgeological problems and unanticipated shortages of or increases in the
12
cost of materials and labor. Any of these circumstances could give riseto delays in the completion of, or increase the cost of, developing oneor more of our residential communities.
The interest rate on our revolving credit facility is subject tofluctuation based on changes in short-term interest rates, the amount ofborrowings we have incurred and the ratings which national ratingagencies assign to our outstanding debt securities. Our interest expensecould increase as a result of these factors.
Our business and earnings are substantially dependent on our ability toobtain financing for our development activities. Increases in interestrates, concerns about the market or the economy, or consolidation ordissolution of financial institutions could increase our cost ofborrowing and/or reduce our ability to obtain the funds required for ourfuture operations.
Our business and earnings are also substantially dependent on theability of our customers to finance the purchase of their homes.Limitations on the availability of financing or increases in the cost ofsuch financing could adversely affect our operations.
We believe that our recorded tax balances are adequate. However, it isnot possible to predict the effects of possible changes in the tax lawsor changes in their interpretation. These changes or interpretations, ifmade, could have a material negative effect on our operating results.
Claims have been brought against us in various legal proceedings whichhave not had, and are not expected to have, a material adverse effect onthe business or on our financial condition; however, additional legaland tax claims may arise from time to time, and it is possible that ourcash flows and results of operations could be affected from time to timeby the resolution of one or more of such matters.
We are subject to construction defect and home warranty claims arisingin the ordinary course of business. These claims are common in thehomebuilding industry and can be costly. In addition, the costs ofinsuring against construction defects and product liability claims arehigh, the amount of coverage offered by insurance companies is currentlylimited, and the amounts of deductibles and self insured retentions arehigh. There can be no assurance that this coverage will not be furtherrestricted or become more costly. If we are not able to obtain adequateinsurance against these claims, we may experience losses that could hurtour business.
There is intense competition to attract and retain management and keyemployees in the markets where our operations are conducted. Ourbusiness could be adversely affected if we are unable to recruit orretain key personnel in one or more of the markets in which we conductour operations.
Available Information
We file annual, quarterly and current reports, proxy statements andother information with the Securities and Exchange Commission (the “SEC”).These filings are available to the public over the Internet at the SEC’s website at http://www.sec.gov. You may also read and copy any document we fileat the SEC’s public reference room located at 450 Fifth Street, NW,Washington, DC 20549. Please call the SEC at 1-800-SEC-0330 for furtherinformation on the public reference room.
13
Our principal Internet address is www.tollbrothers.com. We makeavailable free of charge on www.tollbrothers.com our annual, quarterly andcurrent reports, and amendments to those reports, as soon as reasonablypracticable after we electronically file such material with, or furnish itto, the SEC.
In addition, you may request a copy of these filings (excludingexhibits) at no cost by writing or telephoning us at the following address ortelephone number:
Toll Brothers, Inc.3103 Philmont Ave.Huntington Valley, PA 19006Attention: Director of Investor RelationsTelephone: (215) 938-8000
ITEM 2. PROPERTIES
Headquarters
Our corporate offices, which we own, contain approximately 70,000 squarefeet, and are located at 3103 Philmont Avenue, Huntingdon Valley, MontgomeryCounty, Pennsylvania.
Manufacturing/Distribution Facilities
We own a facility of approximately 200,000 square feet located inMorrisville, Pennsylvania. We also own a facility of approximately100,000 square feet located in Emporia, Virginia, which we acquired in 1999.In both facilities we manufacture open wall panels, roof and floor trusses,and certain interior and exterior millwork to supply a portion of ourconstruction needs. These operations also permit us to purchase wholesalelumber, plywood, windows, doors, certain other interior and exterior millworkand other building materials to supply to our communities. We believe thatincreased efficiency, cost savings and productivity result from the operationof these plants and from the wholesale purchase of material. The Pennsylvaniaplant generally does not sell or supply to any purchaser other than to us,while the Virginia plant sells wall panels and roof and floor trusses to usas well as to a small number of outside purchasers.
Regional and Other Facilities
We lease office and warehouse space in various locations, none of which ismaterial to our business.
ITEM 3. LEGAL PROCEEDINGS
We are involved in various claims and litigation arising principally in theordinary course of business. We believe that the disposition of these matterswill not have a material adverse effect on our business or our financialcondition. There are no proceedings required to be disclosed pursuant to Item103 of Regulation S-K.
14
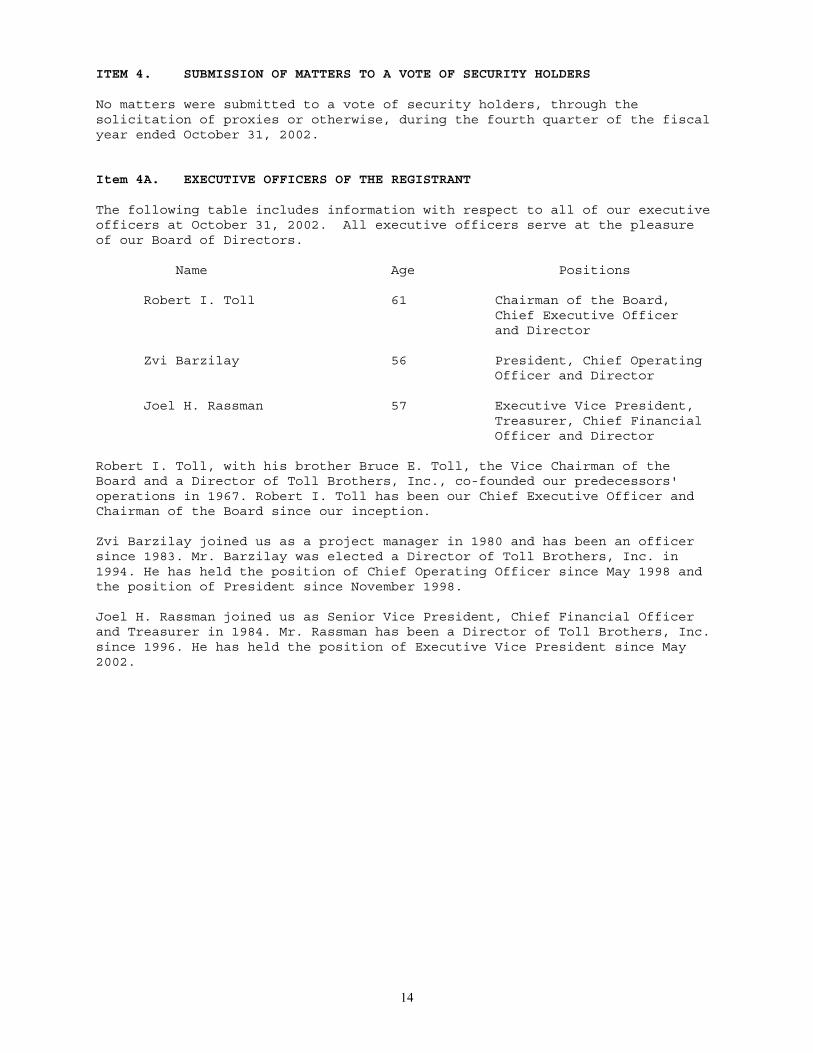
ITEM 4. SUBMISSION OF MATTERS TO A VOTE OF SECURITY HOLDERS
No matters were submitted to a vote of security holders, through thesolicitation of proxies or otherwise, during the fourth quarter of the fiscalyear ended October 31, 2002.
Item 4A. EXECUTIVE OFFICERS OF THE REGISTRANT
The following table includes information with respect to all of our executiveofficers at October 31, 2002. All executive officers serve at the pleasureof our Board of Directors.
Name Age Positions
Robert I. Toll 61 Chairman of the Board, Chief Executive Officer and Director
Zvi Barzilay 56 President, Chief Operating Officer and Director
Joel H. Rassman 57 Executive Vice President, Treasurer, Chief Financial Officer and Director
Robert I. Toll, with his brother Bruce E. Toll, the Vice Chairman of theBoard and a Director of Toll Brothers, Inc., co-founded our predecessors'operations in 1967. Robert I. Toll has been our Chief Executive Officer andChairman of the Board since our inception.
Zvi Barzilay joined us as a project manager in 1980 and has been an officersince 1983. Mr. Barzilay was elected a Director of Toll Brothers, Inc. in1994. He has held the position of Chief Operating Officer since May 1998 andthe position of President since November 1998.
Joel H. Rassman joined us as Senior Vice President, Chief Financial Officerand Treasurer in 1984. Mr. Rassman has been a Director of Toll Brothers, Inc.since 1996. He has held the position of Executive Vice President since May2002.
15
PART II
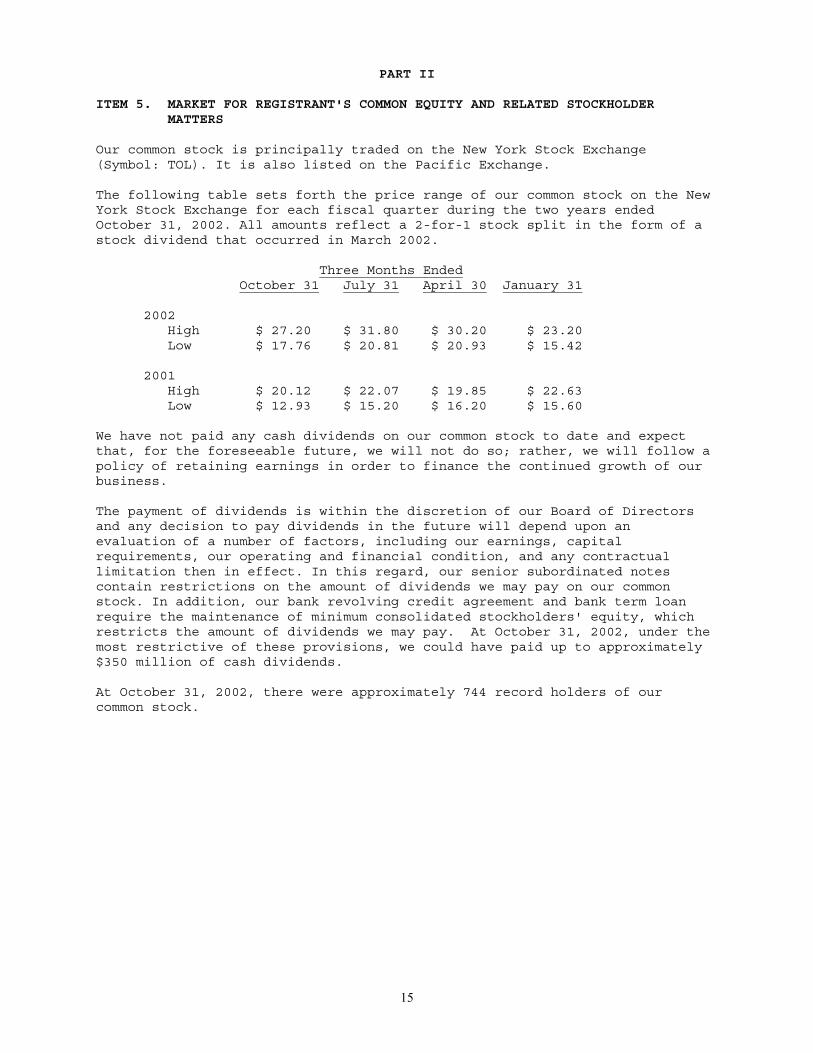
ITEM 5. MARKET FOR REGISTRANT'S COMMON EQUITY AND RELATED STOCKHOLDER MATTERS
Our common stock is principally traded on the New York Stock Exchange(Symbol: TOL). It is also listed on the Pacific Exchange.
The following table sets forth the price range of our common stock on the NewYork Stock Exchange for each fiscal quarter during the two years endedOctober 31, 2002. All amounts reflect a 2-for-1 stock split in the form of astock dividend that occurred in March 2002.
Three Months Ended October 31 July 31 April 30 January 31
2002 High $ 27.20 $ 31.80 $ 30.20 $ 23.20 Low $ 17.76 $ 20.81 $ 20.93 $ 15.42
2001 High $ 20.12 $ 22.07 $ 19.85 $ 22.63 Low $ 12.93 $ 15.20 $ 16.20 $ 15.60
We have not paid any cash dividends on our common stock to date and expectthat, for the foreseeable future, we will not do so; rather, we will follow apolicy of retaining earnings in order to finance the continued growth of ourbusiness.
The payment of dividends is within the discretion of our Board of Directorsand any decision to pay dividends in the future will depend upon anevaluation of a number of factors, including our earnings, capitalrequirements, our operating and financial condition, and any contractuallimitation then in effect. In this regard, our senior subordinated notescontain restrictions on the amount of dividends we may pay on our commonstock. In addition, our bank revolving credit agreement and bank term loanrequire the maintenance of minimum consolidated stockholders' equity, whichrestricts the amount of dividends we may pay. At October 31, 2002, under themost restrictive of these provisions, we could have paid up to approximately$350 million of cash dividends.
At October 31, 2002, there were approximately 744 record holders of ourcommon stock.
16
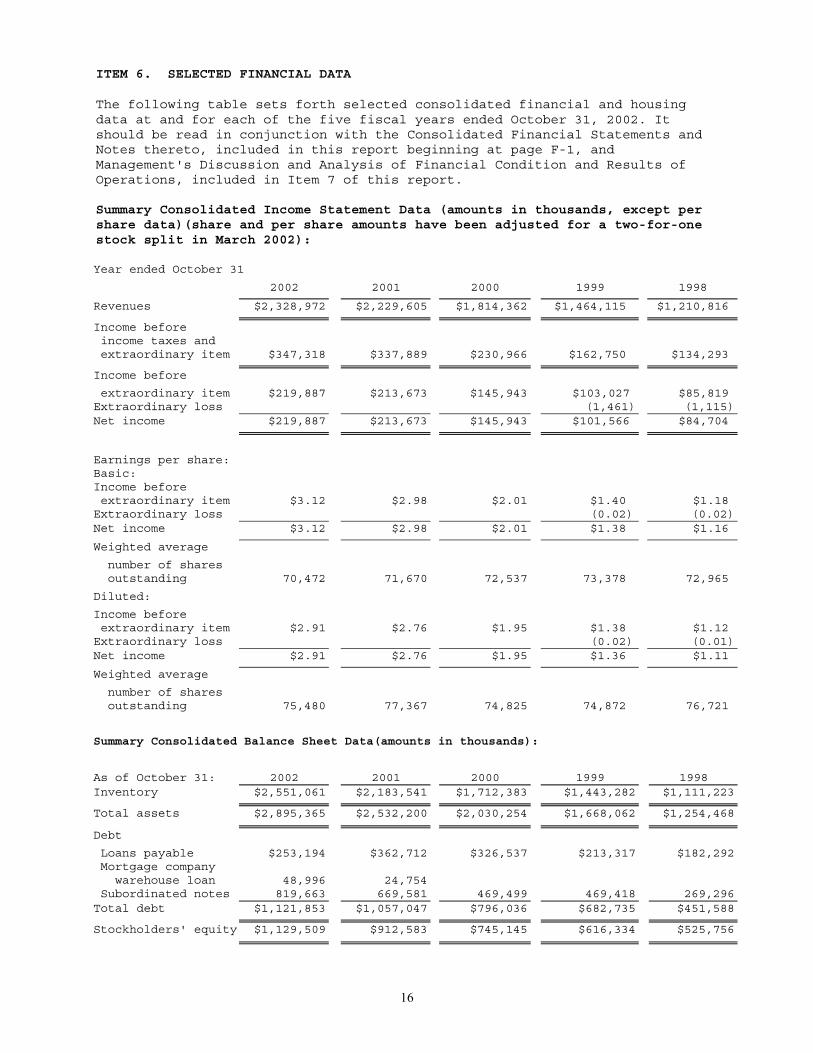
ITEM 6. SELECTED FINANCIAL DATA
The following table sets forth selected consolidated financial and housingdata at and for each of the five fiscal years ended October 31, 2002. Itshould be read in conjunction with the Consolidated Financial Statements andNotes thereto, included in this report beginning at page F-1, andManagement's Discussion and Analysis of Financial Condition and Results ofOperations, included in Item 7 of this report.
Summary Consolidated Income Statement Data (amounts in thousands, except pershare data)(share and per share amounts have been adjusted for a two-for-onestock split in March 2002):
Year ended October 31
2002 2001 2000 1999 1998
Revenues $2,328,972 $2,229,605 $1,814,362 $1,464,115 $1,210,816
Income before income taxes and extraordinary item $347,318 $337,889 $230,966 $162,750 $134,293
Income before
extraordinary item $219,887 $213,673 $145,943 $103,027 $85,819Extraordinary loss (1,461) (1,115)Net income $219,887 $213,673 $145,943 $101,566 $84,704
Earnings per share:Basic:Income before extraordinary item $3.12 $2.98 $2.01 $1.40 $1.18Extraordinary loss (0.02) (0.02)Net income $3.12 $2.98 $2.01 $1.38 $1.16
Weighted average
number of shares outstanding 70,472 71,670 72,537 73,378 72,965
Diluted:
Income before extraordinary item $2.91 $2.76 $1.95 $1.38 $1.12Extraordinary loss (0.02) (0.01)Net income $2.91 $2.76 $1.95 $1.36 $1.11
Weighted average
number of shares outstanding 75,480 77,367 74,825 74,872 76,721
Summary Consolidated Balance Sheet Data(amounts in thousands):
As of October 31: 2002 2001 2000 1999 1998Inventory $2,551,061 $2,183,541 $1,712,383 $1,443,282 $1,111,223
Total assets $2,895,365 $2,532,200 $2,030,254 $1,668,062 $1,254,468
Debt
Loans payable $253,194 $362,712 $326,537 $213,317 $182,292 Mortgage company warehouse loan 48,996 24,754 Subordinated notes 819,663 669,581 469,499 469,418 269,296Total debt $1,121,853 $1,057,047 $796,036 $682,735 $451,588
Stockholders' equity $1,129,509 $912,583 $745,145 $616,334 $525,756
17
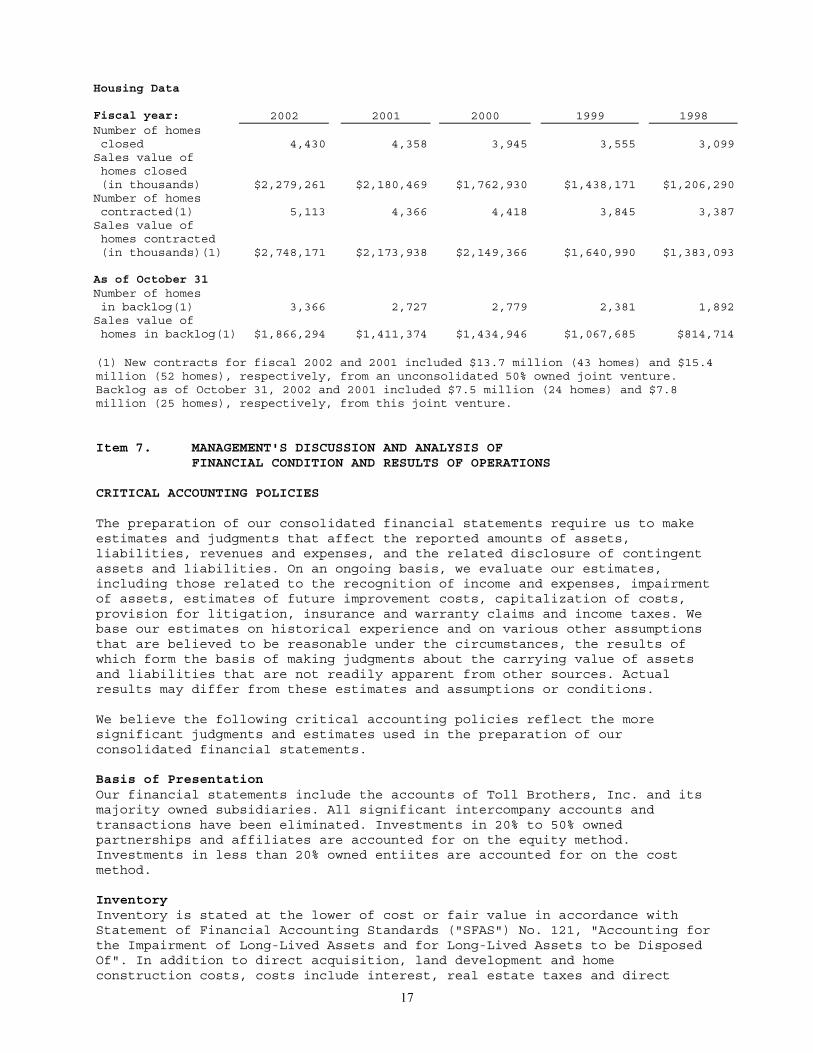
Housing Data
Fiscal year: 2002 2001 2000 1999 1998Number of homes closed 4,430 4,358 3,945 3,555 3,099Sales value of homes closed (in thousands) $2,279,261 $2,180,469 $1,762,930 $1,438,171 $1,206,290Number of homes contracted(1) 5,113 4,366 4,418 3,845 3,387Sales value of homes contracted (in thousands)(1) $2,748,171 $2,173,938 $2,149,366 $1,640,990 $1,383,093
As of October 31Number of homes in backlog(1) 3,366 2,727 2,779 2,381 1,892Sales value of homes in backlog(1) $1,866,294 $1,411,374 $1,434,946 $1,067,685 $814,714
(1) New contracts for fiscal 2002 and 2001 included $13.7 million (43 homes) and $15.4million (52 homes), respectively, from an unconsolidated 50% owned joint venture.Backlog as of October 31, 2002 and 2001 included $7.5 million (24 homes) and $7.8million (25 homes), respectively, from this joint venture.
Item 7. MANAGEMENT'S DISCUSSION AND ANALYSIS OF FINANCIAL CONDITION AND RESULTS OF OPERATIONS
CRITICAL ACCOUNTING POLICIES
The preparation of our consolidated financial statements require us to makeestimates and judgments that affect the reported amounts of assets,liabilities, revenues and expenses, and the related disclosure of contingentassets and liabilities. On an ongoing basis, we evaluate our estimates,including those related to the recognition of income and expenses, impairmentof assets, estimates of future improvement costs, capitalization of costs,provision for litigation, insurance and warranty claims and income taxes. Webase our estimates on historical experience and on various other assumptionsthat are believed to be reasonable under the circumstances, the results ofwhich form the basis of making judgments about the carrying value of assetsand liabilities that are not readily apparent from other sources. Actualresults may differ from these estimates and assumptions or conditions.
We believe the following critical accounting policies reflect the moresignificant judgments and estimates used in the preparation of ourconsolidated financial statements.
Basis of PresentationOur financial statements include the accounts of Toll Brothers, Inc. and itsmajority owned subsidiaries. All significant intercompany accounts andtransactions have been eliminated. Investments in 20% to 50% ownedpartnerships and affiliates are accounted for on the equity method.Investments in less than 20% owned entiites are accounted for on the costmethod.
InventoryInventory is stated at the lower of cost or fair value in accordance withStatement of Financial Accounting Standards ("SFAS") No. 121, "Accounting forthe Impairment of Long-Lived Assets and for Long-Lived Assets to be DisposedOf". In addition to direct acquisition, land development and homeconstruction costs, costs include interest, real estate taxes and direct
18
overhead costs related to development and construction, which are capitalizedto inventories during the period beginning with the commencement ofdevelopment and ending with the completion of construction.
It takes approximately four to five years to fully develop, sell and deliverall the homes in one of our typical communities. Longer or shorter timeperiods are possible depending on the number of home sites in a community.Our master planned communities, consisting of several smaller communities,may take up to 10 years to complete. Since our inventory is considered along-lived asset under accounting principles generally accepted in the UnitedStates, we are required to review the carrying value of each of ourcommunities and writedown the value of those communities for which we believethe values are not recoverable. When the profitability of a current communitydeteriorates or the sales pace declines significantly or some other factorindicates a possible impairment in the recoverability of the asset, weevaluate the property in accordance with the guidelines of SFAS No. 121. Ifthis evaluation indicates an impairment loss should be recognized, we chargecost of sales for the estimated impairment loss in the period determined.
In addition, we review all the land held for future communities or futuresections of current communities, whether owned or under contract, todetermine whether or not we expect to proceed with the development of theland. Based upon this review, we decide: (a) as to land that is under apurchase contract but not owned, whether the contract will be terminated orrenegotiated; and (b) as to land we own, whether the land can be developed ascontemplated or in an alternative manner, or should be sold. We then furtherdetermine which costs that have been capitalized to the property arerecoverable and which costs should be written off.
Income RecognitionRevenue and cost of sales are recorded at the time each home, or lot, isclosed and title and possession are transferred to the buyer.
Land, land development and related costs (both incurred and estimated to beincurred in the future) are amortized to the cost of homes closed based uponthe total number of homes to be constructed in each community. Any changes tothe estimated costs subsequent to the commencement of delivery of homes areallocated to the remaining undelivered homes in the community. Homeconstruction and related costs are charged to the cost of homes closed underthe specific identification method.
The estimated land, common area development and related costs of masterplanned communities (including the cost of golf courses, net of theirestimated residual value) are allocated to individual communities within amaster planned community on a relative sales value basis. Any change in theestimated costs are allocated to the remaining lots in each of thecommunities of the master planned community.
Joint Venture AccountingWe have investments in three joint ventures with independent third parties todevelop and sell land that was owned or currently is owned by our venturepartners. We recognize our share of earnings from the sale of lots to otherbuilders. We do not recognize earnings from lots we purchase, but insteadreduce our cost basis in these lots by our share of the earnings on those lotsales. We have agreed to purchase 180 lots from one of the ventures and havethe right to purchase up to 385 lots from the second. The third venture hassold all the land that it owned and is currently in the process of completingthe final land improvements which could take 12 months or more to finish. Thejoint ventures also participate in the profits earned on home sales from thelots sold to other builders above certain agreed upon levels. At October 31,2002, we had approximately $12.7 million invested in these joint ventures and

19
were committed to contribute additional capital of approximately $30 millionif the joint ventures require it.
In addition, we effectively own one-third of Toll Brothers Realty Trust Group(the "Trust"), which was formed with a number of our senior executives anddirectors and with the Pennsylvania State Employees Retirement System to takeadvantage of commercial real estate opportunities that may present themselvesfrom time to time. We provide development, finance and management services tothe Trust and receive fees under various agreements. At October 31, 2002, ourinvestment in the Trust was $7.5 million. We also entered into a subscriptionagreement whereby each group of investors agreed to invest an additional $9.3million if required by the Trust. The original subscription agreement, whichwas to expire in June 2002, was extended to August 2003. The Trust currentlyowns and operates several office buildings and an apartment complex, aportion of which is rented and a portion of which remains under construction.
We also own 50% of a joint venture with an unrelated third party that iscurrently selling and building an active-adult, age-qualified community. AtOctober 31, 2002, our investment was $1.2 million in this joint venture. Wedo not have any further commitment to contribute additional capital to thisjoint venture.
We do not currently guarantee any indebtedness of the joint ventures or theTrust. Our total commitment to these entities is not material to ourfinancial condition. These investments are accounted for on the equitymethod.
RESULTS OF OPERATIONS
The following table provides a comparison of certain income statement itemsrelated to our operations (amounts in millions):
Year ended October 31, 2002 2001 2000
$ % $ % $ %
Home sales
Revenues 2,279.3 2,180.5 1,762.9
Costs 1,655.3 72.6 1,602.3 73.5 1,337.1 75.8
Land sales
Revenues 36.2 27.5 38.7
Costs 25.7 70.9 21.5 78.0 29.8 77.0
Equity earnings in
unconsolidated joint
ventures 1.9 6.8 3.3
Interest and other 11.7 14.9 9.5
Total revenues 2,329.0 2,229.6 1,814.4
Selling, general and
administrative expenses 236.1 10.1 209.7 9.4 170.4 9.4
Interest expense 64.5 2.8 58.2 2.6 46.2 2.5
Total costs and expenses 1,981.7 85.1 1,891.7 84.8 1,583.4 87.3
Operating income 347.3 14.9 337.9 15.2 231.0 12.7
Note: Percentages for selling, general and administrative expenses, interestexpense, total costs and expenses, and operating income are based ontotal revenues. Amounts may not add due to rounding.
20
FISCAL 2002 COMPARED TO FISCAL 2001
Home SalesHome sales revenues for fiscal 2002 were higher than those for fiscal 2001 byapproximately $99 million, or 5%. The revenue increase was attributable to a2% increase in the number of homes delivered and a 3% increase in the averageprice of the homes delivered. The increase in the average price of the homesdelivered in fiscal 2002 was principally the result of increased base sellingprices and an increase in the average value of options and lot premiums thatour buyers paid. In fiscal 2002, our buyers paid approximately 21% above thebase selling price for options and lot premiums.
The slight increase in the number of homes delivered in fiscal 2002 was dueprimarily to the small increase in the number of delivering communities and aslight decline in the number of homes delivered per community.
We have encountered and continue to encounter delays in the opening of newcommunities and new sections of existing communities due to increasedgovernmental regulation in many of the markets in which we operate. Thesedelays resulted in a decline in the number of selling communities we had inthe later part of fiscal 2000, which did not reverse until the middle offiscal 2001. In addition, it often takes more than nine months from thesigning of an agreement of sale to the delivery of a home to a buyer. Becauseof the delays in the opening of new communities in fiscal 2000 and 2001 andthe long period of time before a new community can start delivering homesonce it opens for sale, the increase in the average number of communitiesdelivering homes in fiscal 2002 compared to fiscal 2001 was slight.
The number of homes delivered per community in fiscal 2002 declined slightlycompared to fiscal 2001. This decline was primarily due to the decline inbacklog at October 31, 2001 as compared to October 31, 2000 and a softness innew contract signings that we encountered in the first portion of the firstquarter of fiscal 2002. The decline in backlog at October 31, 2001 and thesoftness in the first part of the first quarter of fiscal 2002 were dueprimarily to the slowing economy exacerbated by the tragic events ofSeptember 11, 2001.
The value of new sales contracts signed was $2.75 billion (5,113 homes) infiscal 2002, a 26% increase over the $2.17 billion (4,366 homes) signed infiscal 2001. This increase is attributable to a 17% increase in the number ofhomes sold and an 8% increase in the average selling price of the homes (dueprimarily to the location and size of homes sold and increases in baseselling prices). The increase in the number of homes sold is attributable toan increase in the number of communities from which we were selling and thecontinued demand for our homes. At October 31, 2002, we were selling from 170communities compared to 155 communities at October 31, 2001.
We believe that the demand for our homes is attributable to an increase inthe number of affluent households, the maturation of the baby boomgeneration, a constricted supply of available new home sites, attractivemortgage rates and the belief on the part of potential customers that thepurchase of a home is a stable investment in the current period of economicuncertainty. At October 31, 2002, we had over 40,800 home sites under ourcontrol nationwide in markets we consider to be affluent.
At October 31, 2002, our backlog of homes under contract was $1.87 billion(3,366 homes), 32% higher than the $1.41 billion (2,727 homes) backlog atOctober 31, 2001. The increase in backlog is primarily attributable to theincrease in the number of new contracts signed and the increased prices ofthe homes sold during fiscal 2002 as previously discussed. Based on the sizeof our current backlog, the continued demand for our homes, the increased
21
number of selling communities from which we are operating and the additionalcommunities we expect to open in the early part of fiscal 2003, we believethat we will deliver approximately 5,000 homes in fiscal 2003 and the averagedelivered price of those homes will be between $530,000 and $540,000.
Home costs as a percentage of home sales revenues decreased to 72.6% infiscal 2002 compared to 73.5% in fiscal 2001. The decrease was largely theresult of selling prices increasing at a greater rate than costs, lower landand improvement costs, improved operating efficiencies and lower inventorywritedowns, offset in part by the cost of increased sales incentives providedto customers in the later part of the fourth quarter of fiscal 2001 and thebeginning of the first quarter of fiscal 2002. These incentives were used tohelp increase new contract signings which were adversely affected by theeconomic slowdown in the later part of fiscal 2001 and the effect the tragicevents of September 11, 2001 had on new orders. We incurred $6.1 million inwrite-offs in fiscal 2002 as compared to $13.0 million in fiscal 2001. Infiscal 2003, we expect that home costs will increase slightly as a percentageof home sales revenues due primarily to geographic and product mix changes.
Land SalesWe are developing several master planned communities in which we sell land toother builders. The amount of land sales will vary from year to yeardepending upon the scheduled timing of the delivery of the land parcels. Landsales amounted to $36.2 million for fiscal 2002, as compared to $27.5 millionfor fiscal 2001. In fiscal 2003, land sales are expected to amount toapproximately $20 million.
Equity Earnings in Unconsolidated Joint VenturesWe are a party to several joint ventures and in Toll Brothers Realty TrustGroup (the "Trust"). We recognize income for our proportionate share of theearnings from these entities. (See "Critical Accounting Policies - JointVenture Accounting" for a narrative of our investment in and commitments tothese entities.) In fiscal 2002 and 2001, only two of the joint ventureswere operating. We recognized $1.9 million of earnings from these entities infiscal 2002 compared to $6.8 million in fiscal 2001. The decline in earningswas caused by the reduction in the number of lots delivered by one of thejoint ventures in fiscal 2002 compared to fiscal 2001. The reduction infiscal 2002 was the result of fewer lots being available for sale by thejoint venture due to the delivery of the last lots owned by it. Earnings fromjoint ventures will vary significantly from year to year depending on thelevel of activity of the entities. For fiscal 2003, we expect to realizeapproximately $4 million of income from our investments in the joint venturesand the Trust.
Interest and Other IncomeInterest and other income decreased $3.2 million in fiscal 2002 compared tofiscal 2001. The decrease was principally due to a decrease in interestincome, a decrease in earnings from our ancillary businesses and a non-recurring gain in the fiscal 2001 from the sale of an office buildingconstructed by us, offset, in part, by increased income from retainedcustomer deposits.
Selling, General and Administrative Expenses ("SG&A")SG&A spending increased by $26.4 million or 12.6% in fiscal 2002 as comparedto fiscal 2001 and increased as a percentage of revenues from 9.4% in fiscal2001 to 10.1% in fiscal 2002. The increased spending was principally due tothe costs incurred by the greater number of selling communities that we hadduring fiscal 2002 as compared to fiscal 2001, costs associated with thecontinued expansion of the number of new communities and increased insurancecosts, offset, in part, by the discontinuance of amortization of goodwillpursuant to our adoption of Statement of Financial Accounting Standards Board
22
No. 142 in November 2001. We expect to open approximately 70 communities infiscal 2003 as compared to 57 in fiscal 2002. In fiscal 2003, we expect SG&Awill increase slightly as a percentage of total revenues compared to fiscal2002.
FISCAL 2001 COMPARED TO FISCAL 2000
Home SalesHome sales revenues for fiscal 2001 were higher than those for fiscal 2000 byapproximately $418 million, or 24%. The revenue increase was primarilyattributable to a 12% increase in the average price of the homes deliveredand a 10% increase in the number of homes delivered. The increase in theaverage price of the homes delivered was the result of increases in sellingprices, a shift in the location of homes delivered to more expensive areasand an increase in the dollar amount of options that our home buyersselected. During fiscal 2001, our homebuyers paid approximately 21% above thebase selling price of a home for options and lot premiums, compared to 19% infiscal 2000. The increase in the number of homes delivered was primarily dueto the larger backlog of homes to be delivered at the beginning of fiscal2001 as compared to fiscal 2000.
The value of new sales contracts signed was $2.17 billion (4,366 homes) and$2.15 billion (4,418 homes) for fiscal 2001 and fiscal 2000, respectively.The increase in the value of new contracts signed in fiscal 2001 wasprimarily attributable to an increase in the average selling price of thehomes (due primarily to an increase in base selling prices, a shift in thelocation of homes sold to more expensive areas and an increase in the dollaramount of options selected by our home buyers), offset, in part, by adecrease in the average number of communities in which we were offering homesfor sale and the resulting decrease in the number of homes for which wesigned sales contracts. The decrease in the number of communities was theresult of increased regulatory requirements that delayed the opening of somenew communities and new sections of some existing communities.
At October 31, 2001, the backlog of homes under contract was $1.41 billion(2,727 homes), as compared to the $1.43 billion (2,779 homes) backlog atOctober 31, 2000.
The terrorist attacks of September 11, 2001 impacted us most severely in thefirst few weeks immediately after the events as consumer confidence dropped,the stock market declined and our business slowed. In the six-week periodfollowing October 31, 2001, the total number of deposits was approximately12% higher than the same period of fiscal 2000. On a per-community basis,deposits were down approximately 2% over the same period. Compared to theprevious five-year average for the six-week period, deposits wereapproximately 6% higher on a per-community basis.
Home costs as a percentage of home sales revenues decreased in fiscal 2001 ascompared to fiscal 2000. The decrease was largely the result of sellingprices increasing at a greater rate than costs, lower land and improvementcosts, and improved operating efficiencies, offset, in part, by higherinventory writedowns. We incurred $13.0 million in write-offs in fiscal 2001,as compared to $7.4 million in fiscal 2000.
Land SalesIn fiscal 2001, we operated a land development and sales operation in ourSouth Riding master planned community located in Loudoun County, Virginia.Land sales amounted to $27.5 million for fiscal 2001 compared to $38.7million in fiscal 2000. The decrease in land sales in fiscal 2001 as comparedto fiscal 2000 was due to fewer lots being available for sale in South Riding
23
in fiscal 2001 than in 2000, offset, in part, by increased sales of lots fromseveral of our other master planned communities.
Equity Earnings in Unconsolidated Joint VenturesIn fiscal 1998, we entered into a joint venture to develop and sell landowned by our venture partner. Under the terms of the agreement, we have theright to purchase up to a specified number of lots with the majority of thelots to be sold to other builders. In fiscal 2000, the joint venture soldits first group of home sites to other builders and to us. We recognize ourshare of earnings from the sale of lots to other builders. We do notrecognize earnings from lots we purchase; instead, we reduce our cost basisin these lots by our share of the earnings of the joint venture from the saleof these lots.
Interest and Other IncomeInterest and other income increased approximately $5.4 million in fiscal 2001as compared to fiscal 2000. The increase was principally due to an increasein interest income, the gain from the sale of an office building constructedby us in fiscal 2001, and an increase in earnings from our ancillarybusinesses, offset in part by reduced management fee income and gains fromthe sale of miscellaneous assets recognized in fiscal 2000.
Selling, General and Administrative Expenses ("SG&A")SG&A spending increased by $39.4 million, or 23%, in fiscal 2001 as comparedto fiscal 2000. This increased spending was primarily due to the increase inhome revenues in fiscal 2001 over fiscal 2000, and costs related to thedevelopment of our master planned communities. SG&A as a percentage of totalrevenues was the same in fiscal 2001 and fiscal 2000.
INTEREST EXPENSE
We determine interest expense on a specific lot-by-lot basis for ourhomebuilding operations and on a parcel-by-parcel basis for land sales.
As a percentage of total revenues, interest expense varies depending on manyfactors including the period of time that we owned the land, the length oftime that the homes delivered during the period were under construction, andthe interest rates and the amount of debt carried by us in proportion to theamount of our inventory during those periods. Interest expense as apercentage of revenues was slightly higher in fiscal 2002 as compared tofiscal 2001 and was slightly higher in fiscal 2001 than fiscal 2000.
INCOME BEFORE INCOME TAXES
Income before income taxes increased 2.8% in fiscal 2002 compared to fiscal2001 and increased 46.3% in fiscal 2001 compared to fiscal 2000.
INCOME TAXES
Income taxes for fiscal 2002, 2001 and 2000 were provided at effective ratesof 36.7%, 36.8% and 36.8%, respectively.
CAPITAL RESOURCES AND LIQUIDITY
Funding for our operations has been provided principally by cash flow fromoperations, unsecured bank borrowings and the public debt markets.
Cash flow from operations, before inventory additions, has improved asoperating results have improved. One of the main factors that determines cashflow from operations, before inventory additions, is the level of revenuesfrom the delivery of homes and land sales. We anticipate that cash flow from
24
operations, before inventory additions, will continue to be strong. We haveused our cash flow from operations, before inventory additions, bankborrowings and public debt to: acquire additional land for new communities;fund additional expenditures for land development; fund construction costsneeded to meet the requirements of our increased backlog and the increasingnumber of communities in which we are offering homes for sale; repurchase ourstock; and repay debt. We expect that our inventory will continue to increaseand we are currently negotiating and searching for additional opportunitiesto obtain control of land for future communities. At October 31, 2002, we hadcommitments to acquire land of approximately $860 million, of whichapproximately $65 million had been paid or deposited.
At October 31, 2002, we had a $615 million unsecured revolving creditfacility with 19 banks, of which $90 million extends to February 2003 and$525 million extends to March 2006. At October 31, 2002, we had no borrowingsagainst the facility and approximately $77.5 million of letters of creditoutstanding under the facility.
In November 2002, we issued $300 million of 6.875% Senior Notes. We intend touse the proceeds to repay all of the $100 million outstanding of our 8 3/4%Senior Subordinated Notes due 2006, repay bank debt and for general corporatepurposes. We called for redemption all of the $100 million outstanding 8 3/4%Senior Subordinated Notes effective December 27, 2002 at a price of 102.917%of the principal amount. We will recognize a pretax charge of approximately$4 million in the first quarter of fiscal 2003 representing the premium paidon redemption and the write-off of unamortized bond issuance costs.
We believe that we will be able to continue to fund our activities through acombination of existing cash resources, cash flow from operations andexisting sources of credit, including the public debt markets.
INFLATION
The long-term impact of inflation on us is manifested in increased costs forland, land development, construction and overhead, as well as in increasedsales prices. We generally contract for land significantly before developmentand sales efforts begin. Accordingly, to the extent land acquisition costsare fixed, increases or decreases in the sales prices of homes may affect ourprofits. Since the sales prices of homes are fixed at the time a buyer entersinto a contract to acquire a home and we generally contract to sell a homebefore commencement of construction, any inflation of costs in excess ofthose anticipated may result in lower gross margins. We generally attempt tominimize that effect by entering into fixed-price contracts with oursubcontractors and material suppliers for specified periods of time, whichgenerally do not exceed one year.
In general, housing demand is adversely affected by increases in interestcosts, as well as in housing costs. Interest rates, the length of time thatland remains in inventory and the proportion of inventory that is financedaffect our interest costs. If we are unable to raise sales prices enough tocompensate for higher costs, or if mortgage interest rates increasesignificantly, affecting prospective buyers' ability to adequately financehome purchases, our revenues, gross margins and net income would be adverselyaffected. Increases in sales prices, whether the result of inflation ordemand, may affect the ability of prospective buyers to afford new homes.
25
ITEM 7A. QUANTITATIVE AND QUALITATIVE DISCLOSURES ABOUT MARKET RISK
We are exposed to market risk primarily due to fluctuations in interestrates. We utilize both fixed rate and variable rate debt. For fixed ratedebt, changes in interest rates generally affect the fair market value of thedebt instrument, but not our earnings or cash flow. Conversely, for variablerate debt, changes in interest rates generally do not impact the fair marketvalue of the debt instrument. We do not have the obligation to prepay fixedrate debt prior to maturity, and, as a result, interest rate risk and changesin fair market value should not have a significant impact on such debt untilwe are required to refinance such debt.
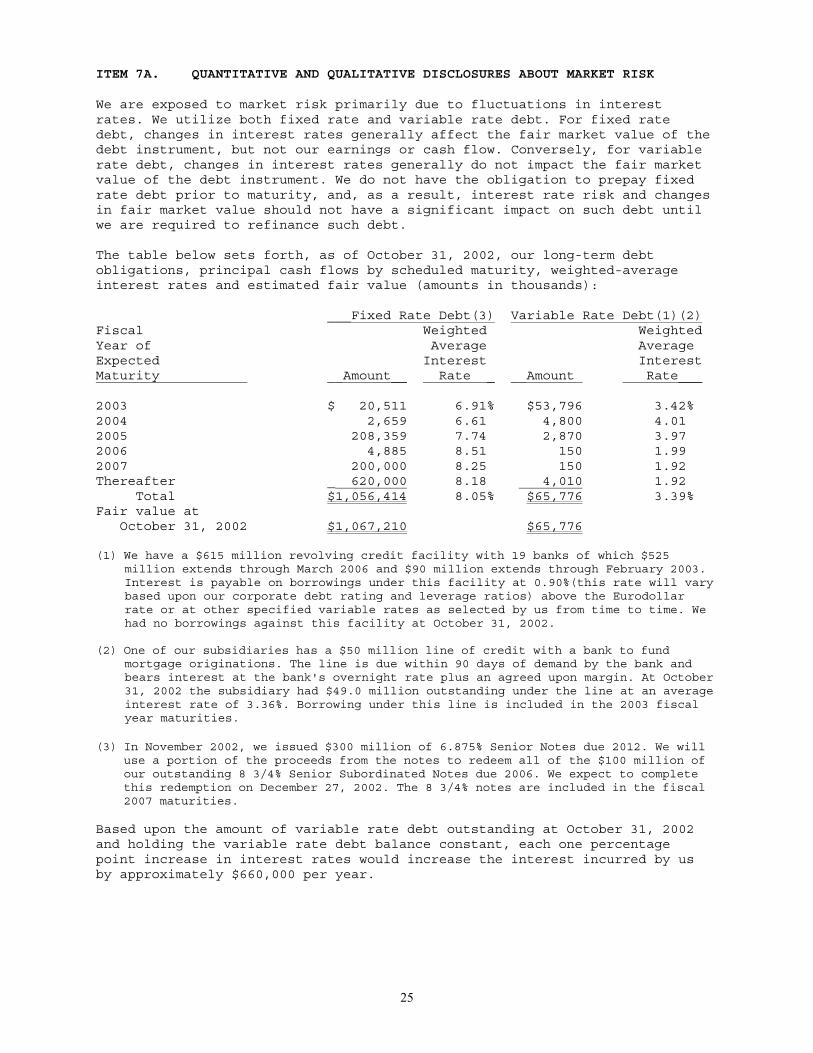
The table below sets forth, as of October 31, 2002, our long-term debtobligations, principal cash flows by scheduled maturity, weighted-averageinterest rates and estimated fair value (amounts in thousands):
___Fixed Rate Debt(3) Variable Rate Debt(1)(2)Fiscal Weighted WeightedYear of Average AverageExpected Interest InterestMaturity __Amount__ Rate _ __Amount Rate___
2003 $ 20,511 6.91% $53,796 3.42%2004 2,659 6.61 4,800 4.012005 208,359 7.74 2,870 3.972006 4,885 8.51 150 1.992007 200,000 8.25 150 1.92Thereafter _ 620,000 8.18 4,010 1.92 Total $1,056,414 8.05% $65,776 3.39%Fair value at October 31, 2002 $1,067,210 $65,776
(1) We have a $615 million revolving credit facility with 19 banks of which $525 million extends through March 2006 and $90 million extends through February 2003. Interest is payable on borrowings under this facility at 0.90%(this rate will vary based upon our corporate debt rating and leverage ratios) above the Eurodollar rate or at other specified variable rates as selected by us from time to time. We had no borrowings against this facility at October 31, 2002.
(2) One of our subsidiaries has a $50 million line of credit with a bank to fund mortgage originations. The line is due within 90 days of demand by the bank and bears interest at the bank's overnight rate plus an agreed upon margin. At October 31, 2002 the subsidiary had $49.0 million outstanding under the line at an average interest rate of 3.36%. Borrowing under this line is included in the 2003 fiscal year maturities.
(3) In November 2002, we issued $300 million of 6.875% Senior Notes due 2012. We willuse a portion of the proceeds from the notes to redeem all of the $100 million ofour outstanding 8 3/4% Senior Subordinated Notes due 2006. We expect to completethis redemption on December 27, 2002. The 8 3/4% notes are included in the fiscal2007 maturities.
Based upon the amount of variable rate debt outstanding at October 31, 2002and holding the variable rate debt balance constant, each one percentagepoint increase in interest rates would increase the interest incurred by usby approximately $660,000 per year.
26
ITEM 8. FINANCIAL STATEMENTS AND SUPPLEMENTARY DATA
Reference is made to the financial statements, listed in Item 15(a)(1) and(2), which appear at pages 38 through 65 of this report and which areincorporated herein by reference.
ITEM 9. CHANGES IN AND DISAGREEMENTS WITH ACCOUNTANTS ON ACCOUNTING AND FINANCIAL DISCLOSURE
Not applicable
PART III
ITEM 10. DIRECTORS AND EXECUTIVE OFFICERS OF THE REGISTRANT
The following information is incorporated herein by reference:
(a) the information in Part I, Item 4A of this report;
(b) the information in the Company's Proxy Statement for the 2003Annual Meeting of Stockholders (the "2003 Proxy Statement")beginning immediately following the caption "Proposal One -Election of Directors for Terms Ending 2006;" and
(c) the information in the 2003 Proxy Statement beginning immediatelyfollowing the caption "Section 16(a) Beneficial Ownership ReportingCompliance" to, but not including, the caption "CertainTransactions."
ITEM 11. EXECUTIVE COMPENSATION
The information in the 2003 Proxy Statement in the section captioned"Proposal One - Election of Directors for Terms Ending 2006," beginningimmediately following the sub-caption "Compensation of Directors" to, but notincluding, the caption "Report of the Audit Committee" is incorporated hereinby reference.
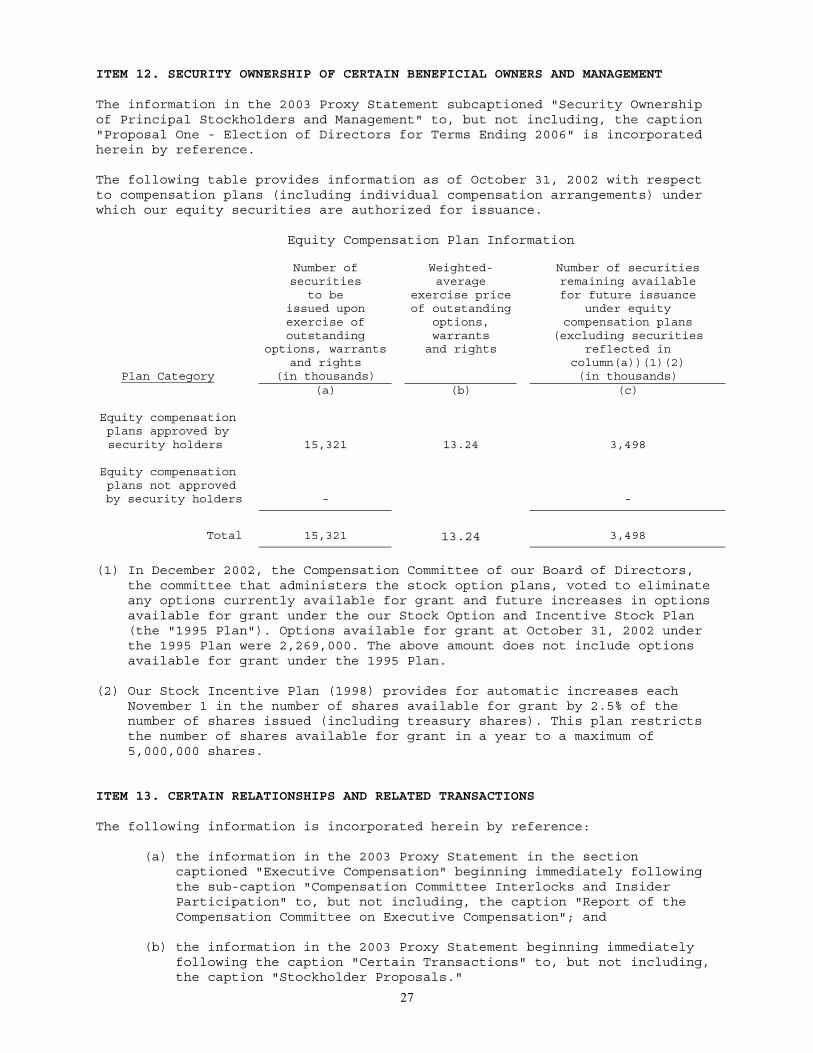
27
ITEM 12. SECURITY OWNERSHIP OF CERTAIN BENEFICIAL OWNERS AND MANAGEMENT
The information in the 2003 Proxy Statement subcaptioned "Security Ownershipof Principal Stockholders and Management" to, but not including, the caption"Proposal One - Election of Directors for Terms Ending 2006" is incorporatedherein by reference.
The following table provides information as of October 31, 2002 with respectto compensation plans (including individual compensation arrangements) underwhich our equity securities are authorized for issuance.
Equity Compensation Plan Information
Number of Weighted- Number of securitiessecurities average remaining available
to be exercise price for future issuanceissued upon of outstanding under equityexercise of options, compensation plansoutstanding warrants (excluding securities
options, warrantsand rights
and rights reflected incolumn(a))(1)(2)
Plan Category (in thousands) (in thousands)(a) (b) (c)
Equity compensationplans approved by
security holders 15,321 13.24 3,498
Equity compensation plans not approved by security holders - -
Total 15,321 13.24 3,498
(1) In December 2002, the Compensation Committee of our Board of Directors,the committee that administers the stock option plans, voted to eliminateany options currently available for grant and future increases in optionsavailable for grant under the our Stock Option and Incentive Stock Plan(the "1995 Plan"). Options available for grant at October 31, 2002 underthe 1995 Plan were 2,269,000. The above amount does not include optionsavailable for grant under the 1995 Plan.
(2) Our Stock Incentive Plan (1998) provides for automatic increases eachNovember 1 in the number of shares available for grant by 2.5% of thenumber of shares issued (including treasury shares). This plan restrictsthe number of shares available for grant in a year to a maximum of5,000,000 shares.
ITEM 13. CERTAIN RELATIONSHIPS AND RELATED TRANSACTIONS
The following information is incorporated herein by reference:
(a) the information in the 2003 Proxy Statement in the section captioned "Executive Compensation" beginning immediately following the sub-caption "Compensation Committee Interlocks and Insider Participation" to, but not including, the caption "Report of the Compensation Committee on Executive Compensation"; and
(b) the information in the 2003 Proxy Statement beginning immediately following the caption "Certain Transactions" to, but not including, the caption "Stockholder Proposals."
28
ITEM 14. CONTROLS AND PROCEDURES
Our chief executive officer and chief financial officer evaluated theeffectiveness of our disclosure controls and procedures (as defined in Rule13a-14(c) under the Securities Exchange Act of 1934, as amended) within 90days of the filing date of this report (the "Evaluation Date") and, based onthat evaluation, concluded that, as of the Evaluation Date, we had sufficientcontrols and procedures for recording, processing, summarizing and reportinginformation that is required to be disclosed in our reports under theSecurities Exchange Act of 1934, as amended, within the time periodsspecified in the SEC's rules and forms.
Since the Evaluation Date, there have not been any significant changes to ourinternal controls, including any corrective actions with regard tosignificant deficiencies and material weaknesses.
PART IV
ITEM 15. EXHIBITS, FINANCIAL STATEMENT SCHEDULES AND REPORTS ON FORM 8-K
(a) Financial Statements and Financial Statement Schedule
1. Financial Statements Page
Report of Independent Auditors 38 Consolidated Statements of Income for the Years Ended October 31, 2002, 2001 and 2000 39 Consolidated Balance Sheets as of October 31, 2002 and 2001 40 Consolidated Statements of Cash Flows for the Years Ended October 31, 2002, 2001 and 2000 41 Notes to Consolidated Financial Statements 42-63 Summary Consolidated Quarterly Financial Data (unaudited) 64
2. Financial Statement Schedule
Schedule II - Valuation and Qualifying Accounts for the Years Ended October 31, 2002, 2001 and 2000 65
Schedules not listed above have been omitted because they are eithernot applicable or the required information is included in the financialstatements or notes thereto.
29
3. Exhibits
The following exhibits are included with this report or incorporated herein by reference:
Exhibit Number Description
3.1 Restated Certificate of Incorporation dated July 1, 1986 ishereby incorporated by reference to Exhibit 3.1 of theRegistrant's Form 10-Q for the quarter ended January 31, 2002.
3.2 Amendment to the Restated Certificate of Incorporation datedMarch 7, 1989, is hereby incorporated by reference to Exhibit 3.2of Registrant's Form 10-Q for the quarter ended January 31, 2002.
3.3 Amendment to the Restated Certificate of Incorporation datedMarch 11, 1993, is hereby incorporated by reference to Exhibit3.3 of Registrant's Form 10-Q for the quarter ended January 31,2002.
3.4 Amendment to the Restated Certificate of Incorporation dated June12, 1997, is hereby incorporated by reference to Exhibit 3.4 ofRegistrant's Form 10-Q for the quarter ended January 31, 2002.
3.5 Amendment to the Restated Certificate of Incorporation datedJanuary 8, 1998, is hereby incorporated by reference to Exhibit3.5 of Registrant's Form 10-Q for the quarter ended January 31,2002.
3.6 Amendment to the Restated Certificate of Incorporation datedMarch 7, 2002, is hereby incorporated by reference to Exhibit 3.6of Registrant's Form 10-Q for the quarter ended January 31, 2002.
3.7 By-laws, as amended, are hereby incorporated by reference toExhibit 3.2 of the Registrant's Form 10-K for the fiscal yearended October 31, 1989.
3.8 Amendment to the by-laws dated July 11, 2000 is hereby incorporated by reference to Exhibit 3.1 of the registrant's Form 10-Q for the quarter ended July 31, 2000.
4.1 Specimen Stock Certificate is hereby incorporated by reference to Exhibit 4.1 of the Registrant's Form 10-K for the fiscal year ended October 31, 1991.
4.2 Indenture dated as of March 15, 1993, among Toll Corp., asissuer, the Registrant, as guarantor, and NBD Bank, NationalAssociation, as Trustee, including form of guarantee, is herebyincorporated by reference to Exhibit 4.1 of Toll Corp.'sRegistration Statement on Form S-3 filed with the Securities andExchange Commission, March 10, 1993, File No. 33-58350.
4.3 Indenture dated as of November 12, 1996, among Toll Corp., as issuer, the Registrant, as guarantor, NBD Bank, a Michigan banking corporation, as Trustee, including form of guarantee, is hereby incorporated by reference to Exhibit 4.1 of the Registrant's Form 8-K dated November 6, 1996 filed with the Securities and Exchange Commission.
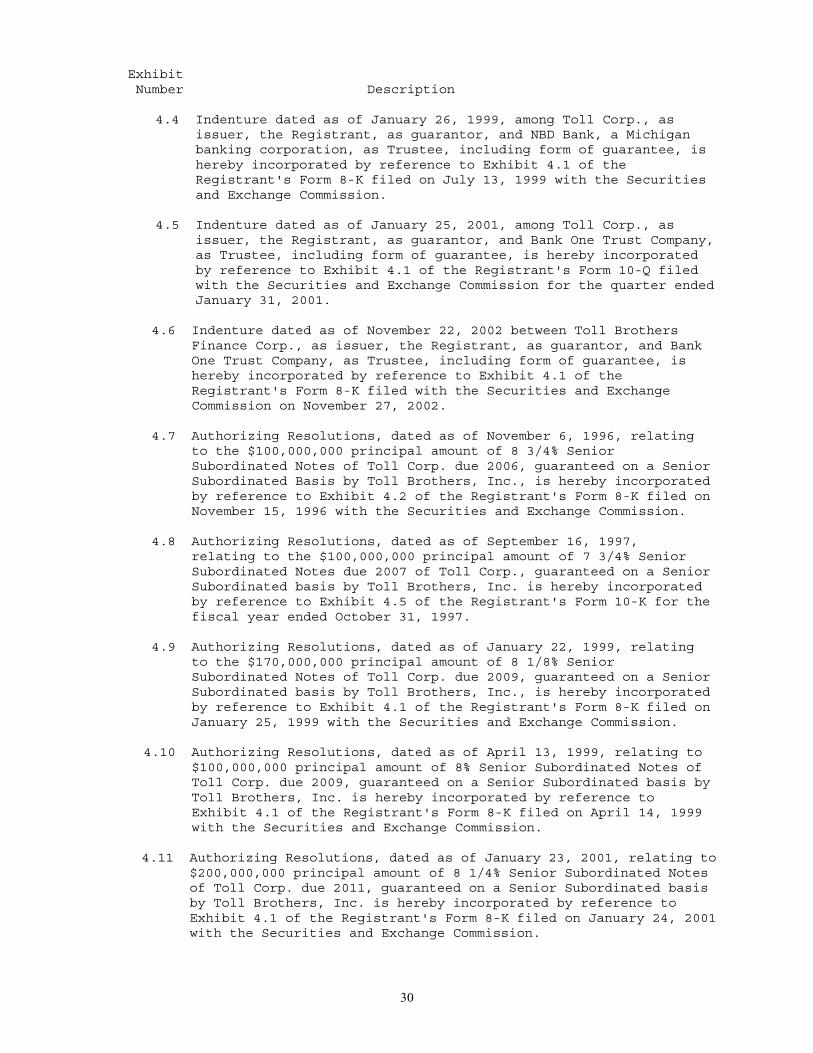
30
Exhibit Number Description
4.4 Indenture dated as of January 26, 1999, among Toll Corp., as issuer, the Registrant, as guarantor, and NBD Bank, a Michigan banking corporation, as Trustee, including form of guarantee, is hereby incorporated by reference to Exhibit 4.1 of the Registrant's Form 8-K filed on July 13, 1999 with the Securities and Exchange Commission.
4.5 Indenture dated as of January 25, 2001, among Toll Corp., as issuer, the Registrant, as guarantor, and Bank One Trust Company, as Trustee, including form of guarantee, is hereby incorporated by reference to Exhibit 4.1 of the Registrant's Form 10-Q filed with the Securities and Exchange Commission for the quarter ended January 31, 2001.
4.6 Indenture dated as of November 22, 2002 between Toll Brothers Finance Corp., as issuer, the Registrant, as guarantor, and Bank One Trust Company, as Trustee, including form of guarantee, is hereby incorporated by reference to Exhibit 4.1 of the Registrant's Form 8-K filed with the Securities and Exchange Commission on November 27, 2002.
4.7 Authorizing Resolutions, dated as of November 6, 1996, relatingto the $100,000,000 principal amount of 8 3/4% SeniorSubordinated Notes of Toll Corp. due 2006, guaranteed on a SeniorSubordinated Basis by Toll Brothers, Inc., is hereby incorporatedby reference to Exhibit 4.2 of the Registrant's Form 8-K filed onNovember 15, 1996 with the Securities and Exchange Commission.
4.8 Authorizing Resolutions, dated as of September 16, 1997, relating to the $100,000,000 principal amount of 7 3/4% Senior Subordinated Notes due 2007 of Toll Corp., guaranteed on a Senior Subordinated basis by Toll Brothers, Inc. is hereby incorporated by reference to Exhibit 4.5 of the Registrant's Form 10-K for the fiscal year ended October 31, 1997.
4.9 Authorizing Resolutions, dated as of January 22, 1999, relating to the $170,000,000 principal amount of 8 1/8% Senior
Subordinated Notes of Toll Corp. due 2009, guaranteed on a SeniorSubordinated basis by Toll Brothers, Inc., is hereby incorporatedby reference to Exhibit 4.1 of the Registrant's Form 8-K filed onJanuary 25, 1999 with the Securities and Exchange Commission.
4.10 Authorizing Resolutions, dated as of April 13, 1999, relating to$100,000,000 principal amount of 8% Senior Subordinated Notes ofToll Corp. due 2009, guaranteed on a Senior Subordinated basis byToll Brothers, Inc. is hereby incorporated by reference toExhibit 4.1 of the Registrant's Form 8-K filed on April 14, 1999with the Securities and Exchange Commission.
4.11 Authorizing Resolutions, dated as of January 23, 2001, relating to $200,000,000 principal amount of 8 1/4% Senior Subordinated Notes of Toll Corp. due 2011, guaranteed on a Senior Subordinated basis by Toll Brothers, Inc. is hereby incorporated by reference to Exhibit 4.1 of the Registrant's Form 8-K filed on January 24, 2001 with the Securities and Exchange Commission.
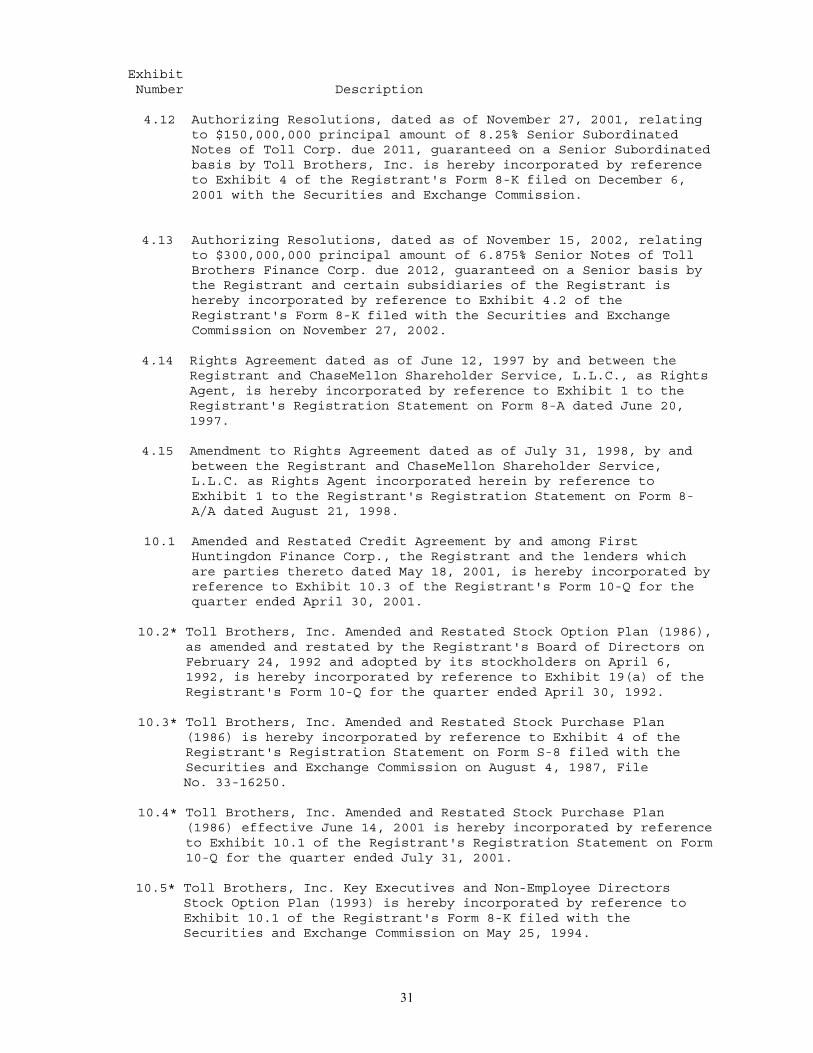
31
Exhibit Number Description
4.12 Authorizing Resolutions, dated as of November 27, 2001, relating to $150,000,000 principal amount of 8.25% Senior Subordinated Notes of Toll Corp. due 2011, guaranteed on a Senior Subordinated basis by Toll Brothers, Inc. is hereby incorporated by reference to Exhibit 4 of the Registrant's Form 8-K filed on December 6, 2001 with the Securities and Exchange Commission.
4.13 Authorizing Resolutions, dated as of November 15, 2002, relating to $300,000,000 principal amount of 6.875% Senior Notes of Toll Brothers Finance Corp. due 2012, guaranteed on a Senior basis by the Registrant and certain subsidiaries of the Registrant is hereby incorporated by reference to Exhibit 4.2 of the Registrant's Form 8-K filed with the Securities and Exchange Commission on November 27, 2002.
4.14 Rights Agreement dated as of June 12, 1997 by and between the Registrant and ChaseMellon Shareholder Service, L.L.C., as Rights Agent, is hereby incorporated by reference to Exhibit 1 to the Registrant's Registration Statement on Form 8-A dated June 20, 1997.
4.15 Amendment to Rights Agreement dated as of July 31, 1998, by and between the Registrant and ChaseMellon Shareholder Service, L.L.C. as Rights Agent incorporated herein by reference to Exhibit 1 to the Registrant's Registration Statement on Form 8- A/A dated August 21, 1998.
10.1 Amended and Restated Credit Agreement by and among First Huntingdon Finance Corp., the Registrant and the lenders which are parties thereto dated May 18, 2001, is hereby incorporated by reference to Exhibit 10.3 of the Registrant's Form 10-Q for the quarter ended April 30, 2001.
10.2* Toll Brothers, Inc. Amended and Restated Stock Option Plan (1986), as amended and restated by the Registrant's Board of Directors on February 24, 1992 and adopted by its stockholders on April 6, 1992, is hereby incorporated by reference to Exhibit 19(a) of the Registrant's Form 10-Q for the quarter ended April 30, 1992.
10.3* Toll Brothers, Inc. Amended and Restated Stock Purchase Plan (1986) is hereby incorporated by reference to Exhibit 4 of the Registrant's Registration Statement on Form S-8 filed with the Securities and Exchange Commission on August 4, 1987, File
No. 33-16250.
10.4* Toll Brothers, Inc. Amended and Restated Stock Purchase Plan (1986) effective June 14, 2001 is hereby incorporated by reference to Exhibit 10.1 of the Registrant's Registration Statement on Form 10-Q for the quarter ended July 31, 2001.
10.5* Toll Brothers, Inc. Key Executives and Non-Employee Directors Stock Option Plan (1993) is hereby incorporated by reference to Exhibit 10.1 of the Registrant's Form 8-K filed with the Securities and Exchange Commission on May 25, 1994.
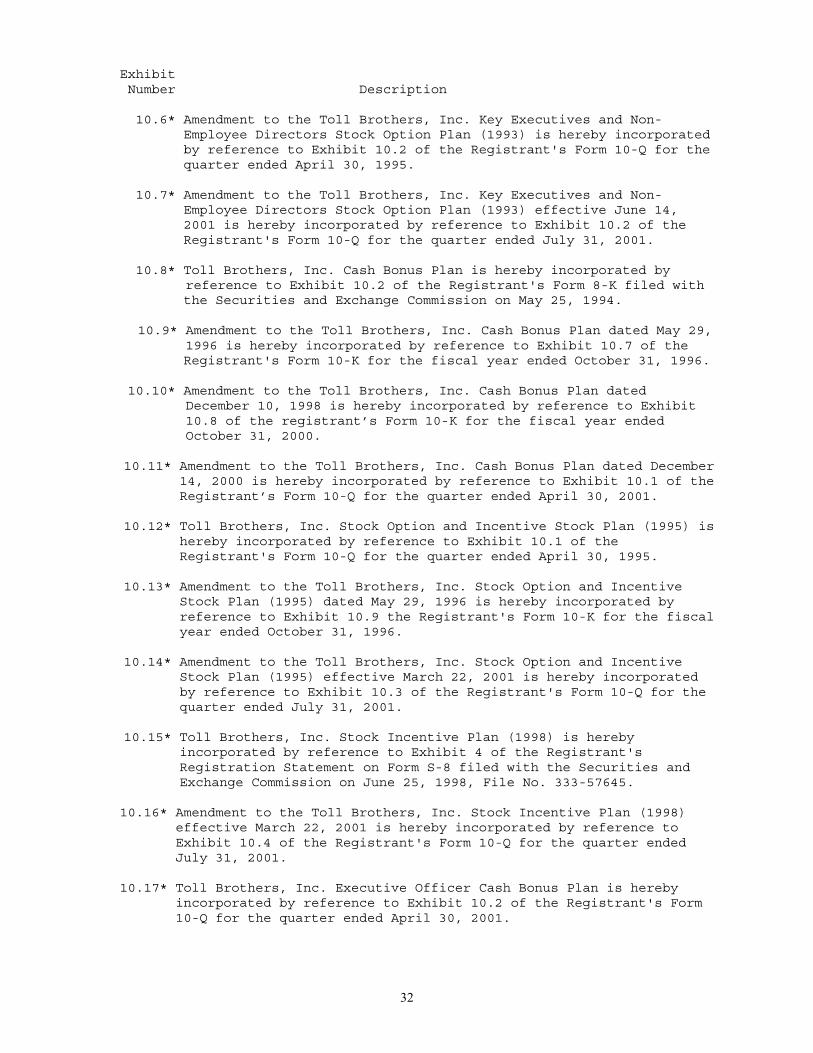
32
Exhibit Number Description
10.6* Amendment to the Toll Brothers, Inc. Key Executives and Non- Employee Directors Stock Option Plan (1993) is hereby incorporated by reference to Exhibit 10.2 of the Registrant's Form 10-Q for the quarter ended April 30, 1995.
10.7* Amendment to the Toll Brothers, Inc. Key Executives and Non- Employee Directors Stock Option Plan (1993) effective June 14, 2001 is hereby incorporated by reference to Exhibit 10.2 of the Registrant's Form 10-Q for the quarter ended July 31, 2001.
10.8* Toll Brothers, Inc. Cash Bonus Plan is hereby incorporated by reference to Exhibit 10.2 of the Registrant's Form 8-K filed with
the Securities and Exchange Commission on May 25, 1994.
10.9* Amendment to the Toll Brothers, Inc. Cash Bonus Plan dated May 29, 1996 is hereby incorporated by reference to Exhibit 10.7 of the
Registrant's Form 10-K for the fiscal year ended October 31, 1996.
10.10* Amendment to the Toll Brothers, Inc. Cash Bonus Plan dated December 10, 1998 is hereby incorporated by reference to Exhibit 10.8 of the registrant’s Form 10-K for the fiscal year ended October 31, 2000.
10.11* Amendment to the Toll Brothers, Inc. Cash Bonus Plan dated December 14, 2000 is hereby incorporated by reference to Exhibit 10.1 of the Registrant’s Form 10-Q for the quarter ended April 30, 2001.
10.12* Toll Brothers, Inc. Stock Option and Incentive Stock Plan (1995) is hereby incorporated by reference to Exhibit 10.1 of the Registrant's Form 10-Q for the quarter ended April 30, 1995.
10.13* Amendment to the Toll Brothers, Inc. Stock Option and Incentive Stock Plan (1995) dated May 29, 1996 is hereby incorporated by reference to Exhibit 10.9 the Registrant's Form 10-K for the fiscal year ended October 31, 1996.
10.14* Amendment to the Toll Brothers, Inc. Stock Option and Incentive Stock Plan (1995) effective March 22, 2001 is hereby incorporated by reference to Exhibit 10.3 of the Registrant's Form 10-Q for the quarter ended July 31, 2001.
10.15* Toll Brothers, Inc. Stock Incentive Plan (1998) is hereby incorporated by reference to Exhibit 4 of the Registrant's Registration Statement on Form S-8 filed with the Securities and Exchange Commission on June 25, 1998, File No. 333-57645.
10.16* Amendment to the Toll Brothers, Inc. Stock Incentive Plan (1998) effective March 22, 2001 is hereby incorporated by reference to Exhibit 10.4 of the Registrant's Form 10-Q for the quarter ended July 31, 2001.
10.17* Toll Brothers, Inc. Executive Officer Cash Bonus Plan is hereby incorporated by reference to Exhibit 10.2 of the Registrant's Form 10-Q for the quarter ended April 30, 2001.
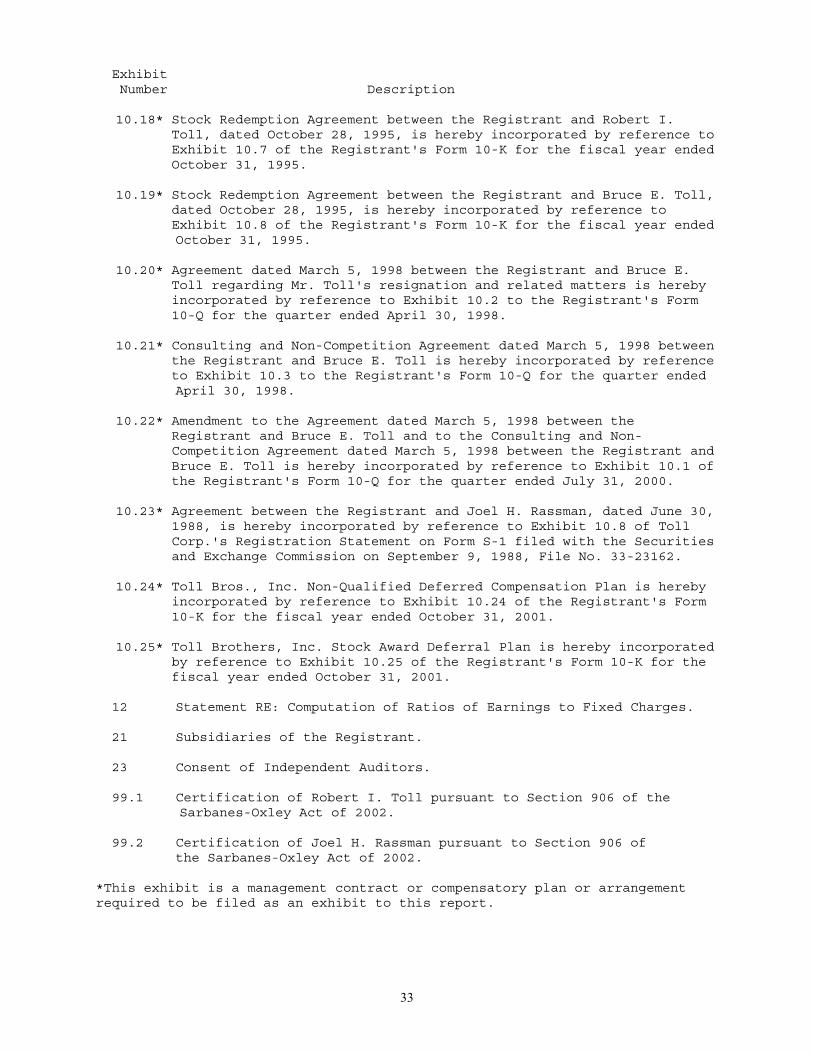
33
Exhibit Number Description
10.18* Stock Redemption Agreement between the Registrant and Robert I. Toll, dated October 28, 1995, is hereby incorporated by reference to Exhibit 10.7 of the Registrant's Form 10-K for the fiscal year ended October 31, 1995.
10.19* Stock Redemption Agreement between the Registrant and Bruce E. Toll, dated October 28, 1995, is hereby incorporated by reference to Exhibit 10.8 of the Registrant's Form 10-K for the fiscal year ended
October 31, 1995.
10.20* Agreement dated March 5, 1998 between the Registrant and Bruce E. Toll regarding Mr. Toll's resignation and related matters is hereby incorporated by reference to Exhibit 10.2 to the Registrant's Form 10-Q for the quarter ended April 30, 1998.
10.21* Consulting and Non-Competition Agreement dated March 5, 1998 between the Registrant and Bruce E. Toll is hereby incorporated by reference to Exhibit 10.3 to the Registrant's Form 10-Q for the quarter ended
April 30, 1998.
10.22* Amendment to the Agreement dated March 5, 1998 between the Registrant and Bruce E. Toll and to the Consulting and Non- Competition Agreement dated March 5, 1998 between the Registrant and Bruce E. Toll is hereby incorporated by reference to Exhibit 10.1 of the Registrant's Form 10-Q for the quarter ended July 31, 2000.
10.23* Agreement between the Registrant and Joel H. Rassman, dated June 30, 1988, is hereby incorporated by reference to Exhibit 10.8 of Toll Corp.'s Registration Statement on Form S-1 filed with the Securities and Exchange Commission on September 9, 1988, File No. 33-23162.
10.24* Toll Bros., Inc. Non-Qualified Deferred Compensation Plan is hereby incorporated by reference to Exhibit 10.24 of the Registrant's Form 10-K for the fiscal year ended October 31, 2001.
10.25* Toll Brothers, Inc. Stock Award Deferral Plan is hereby incorporated by reference to Exhibit 10.25 of the Registrant's Form 10-K for the fiscal year ended October 31, 2001.
12 Statement RE: Computation of Ratios of Earnings to Fixed Charges.
21 Subsidiaries of the Registrant.
23 Consent of Independent Auditors.
99.1 Certification of Robert I. Toll pursuant to Section 906 of the Sarbanes-Oxley Act of 2002.
99.2 Certification of Joel H. Rassman pursuant to Section 906 of the Sarbanes-Oxley Act of 2002.
*This exhibit is a management contract or compensatory plan or arrangementrequired to be filed as an exhibit to this report.
34
(b) Reports on Form 8-K
During the quarter ended October 31, 2002, we filed a currentreport on Form 8-K on September 6, 2002 for the purpose of filing the chiefexecutive officer's and chief financial officer's sworn statements pursuantto Section 21(a) of the Securities Exchange Act of 1934 certifying certainfacts and circumstances relating to the covered reports described in suchstatements.
SIGNATURES
Pursuant to the requirements of Section 13 or 15(d) of the SecuritiesExchange Act of 1934, the Registrant has duly caused this report to be signedon its behalf by the undersigned, thereunto duly authorized, in the Townshipof Lower Moreland, Commonwealth of Pennsylvania on December 17, 2002.
TOLL BROTHERS, INC.
By: /s/ Robert I. Toll Robert I. Toll Chairman of the Board and Chief Executive Officer
Pursuant to the requirements of the Securities Exchange Act of 1934, thisreport has been signed below by the following persons on behalf of theRegistrant and in the capacities and on the dates indicated.
Signature Title Date
/s/ Robert I. Toll Chairman of the Board December 17, 2002 Robert I. Toll of Directors and Chief Executive Officer (Principal Executive Officer)
/s/ Bruce E. Toll Vice Chairman of the Board December 17, 2002 Bruce E. Toll and Director
/s/ Zvi Barzilay President, Chief Operating December 17, 2002 Zvi Barzilay Officer and Director
/s/ Joel H. Rassman Executive Vice President, December 17, 2002 Joel H. Rassman Treasurer, Chief Financial Officer and Director (Principal Financial Officer)
/s/ Joseph R. Sicree Vice President and December 17, 2002 Joseph R. Sicree Chief Accounting Officer (Principal Accounting Officer)
/s/ Robert S. Blank Director December 17, 2002 Robert S. Blank
/s/ Edward G. Boehne Director December 17, 2002 Edward G. Boehne
35
Signature Title Date
/s/ Richard J. Braemer Director December 17, 2002 Richard J. Braemer
/s/ Roger S. Hillas Director December 17, 2002 Roger S. Hillas
/s/ Carl B. Marbach Director December 17, 2002 Carl B. Marbach
/s/ Paul E. Shapiro Director December 17, 2002 Paul E. Shapiro
36
CERTIFICATION
I, Robert I. Toll, Chief Executive Officer of Toll Brothers, Inc., certify that:
1. I have reviewed this annual report on Form 10-K of Toll Brothers, Inc.;
2. Based on my knowledge, this annual report does not contain any untrue statement ofa material fact or omit to state a material fact necessary to make the statementsmade, in light of the circumstances under which such statements were made, notmisleading with respect to the period covered by this annual report;
3. Based on my knowledge, the financial statements, and other financial informationincluded in this annual report, fairly present in all material respects thefinancial condition, results of operations and cash flows of the registrant as of,and for, the periods presented in this annual report;
4. The registrant's other certifying officers and I are responsible for establishingand maintaining disclosure controls and procedures (as defined in Exchange ActRules 13a-14 and 15d-14) for the registrant and have:
a) Designed such disclosure controls and procedures to ensure thatmaterial information relating to the registrant, including its consolidatedsubsidiaries, is made known to us by others within those entities, particularlyduring the period in which this annual report is being prepared;
b) Evaluated the effectiveness of the registrant's disclosure controls andprocedures as of a date within 90 days prior to the filing date of this annualreport (the "Evaluation Date"); and
c) Presented in this annual report our conclusions about the effectiveness of thedisclosure controls and procedures based on our evaluation as of the EvaluationDate;
5. The registrant's other certifying officers and I have disclosed, based on our mostrecent evaluation, to the registrant's auditors and the audit committee ofregistrant's board of directors (or persons performing the equivalent functions):
a) All significant deficiencies in the design or operation of internal controlswhich could adversely affect the registrant's ability to record, process,summarize and report financial data and have identified for the registrant'sauditors any material weaknesses in internal controls; and
b) Any fraud, whether or not material, that involves management or other employeeswho have a significant role in the registrant's internal controls; and
6. The registrant's other certifying officers and I have indicated in this annualreport whether there were significant changes in internal controls or in otherfactors that could significantly affect internal controls subsequent to the date ofour most recent evaluation, including any corrective actions with regard tosignificant deficiencies and material weaknesses.
Date: December 17, 2002 /s/ Robert I. Toll Robert I. Toll Chief Executive Officer
37
CERTIFICATION
I, Joel H. Rassman, Chief Financial Officer of Toll Brothers, Inc., certify that:
1. I have reviewed this annual report on Form 10-K of Toll Brothers, Inc.;
2. Based on my knowledge, this annual report does not contain any untrue statement ofa material fact or omit to state a material fact necessary to make the statementsmade, in light of the circumstances under which such statements were made, notmisleading with respect to the period covered by this annual report;
3. Based on my knowledge, the financial statements, and other financial informationincluded in this annual report, fairly present in all material respects thefinancial condition, results of operations and cash flows of the registrant as of,and for, the periods presented in this annual report;
4. The registrant's other certifying officers and I are responsible for establishingand maintaining disclosure controls and procedures (as defined in Exchange ActRules 13a-14 and 15d-14) for the registrant and have:
a) Designed such disclosure controls and procedures to ensure thatmaterial information relating to the registrant, including its consolidatedsubsidiaries, is made known to us by others within those entities, particularlyduring the period in which this annual report is being prepared;
b) Evaluated the effectiveness of the registrant's disclosure controls andprocedures as of a date within 90 days prior to the filing date of this annualreport (the "Evaluation Date"); and
c) Presented in this annual report our conclusions about the effectiveness of thedisclosure controls and procedures based on our evaluation as of the EvaluationDate;
5. The registrant's other certifying officers and I have disclosed, based on our mostrecent evaluation, to the registrant's auditors and the audit committee ofregistrant's board of directors (or persons performing the equivalent functions):
a) All significant deficiencies in the design or operation of internal controlswhich could adversely affect the registrant's ability to record, process,summarize and report financial data and have identified for the registrant'sauditors any material weaknesses in internal controls; and
b) Any fraud, whether or not material, that involves management or other employeeswho have a significant role in the registrant's internal controls; and
6. The registrant's other certifying officers and I have indicated in this annualreport whether not there were significant changes in internal controls or in otherfactors that could significantly affect internal controls subsequent to the date ofour most recent evaluation, including any corrective actions with regard tosignificant deficiencies and material weaknesses.
Date: December 17, 2002 /s/ Joel H. Rassman Joel H. Rassman Chief Financial Officer
38
Item 8. Financial Statements and Supplementary Data
REPORT OF INDEPENDENT AUDITORSThe Board of Directors and StockholdersToll Brothers, Inc.
We have audited the accompanying consolidated balance sheets of TollBrothers, Inc. and subsidiaries as of October 31, 2002 and 2001, and therelated consolidated statements of income and cash flows for each of thethree years in the period ended October 31, 2002. Our audits also includedthe financial statement schedule listed in the Index at item 15(a). Thesefinancial statements and schedule are the responsibility of the Company'smanagement. Our responsibility is to express an opinion on these financialstatements and schedule based on our audits.
We conducted our audits in accordance with auditing standards generallyaccepted in the United States. Those standards require that we plan andperform the audit to obtain reasonable assurance about whether the financialstatements are free of material misstatement. An audit includes examining, ona test basis, evidence supporting the amounts and disclosures in thefinancial statements. An audit also includes assessing the accountingprinciples used and significant estimates made by management, as well asevaluating the overall financial statement presentation. We believe that ouraudits provide a reasonable basis for our opinion.
In our opinion, the financial statements referred to above present fairly, inall material respects, the consolidated financial position of Toll Brothers,Inc. and subsidiaries at October 31, 2002 and 2001, and the consolidatedresults of their operations and their cash flows for each of the three yearsin the period ended October 31, 2002, in conformity with accountingprinciples generally accepted in the United States. Also, in our opinion, therelated financial statement schedule, when considered in relation to thebasic financial statements taken as a whole, presents fairly in all materialrespects the information set forth therein.
/s/ Ernst & Young LLP
Philadelphia, PennsylvaniaDecember 12, 2002
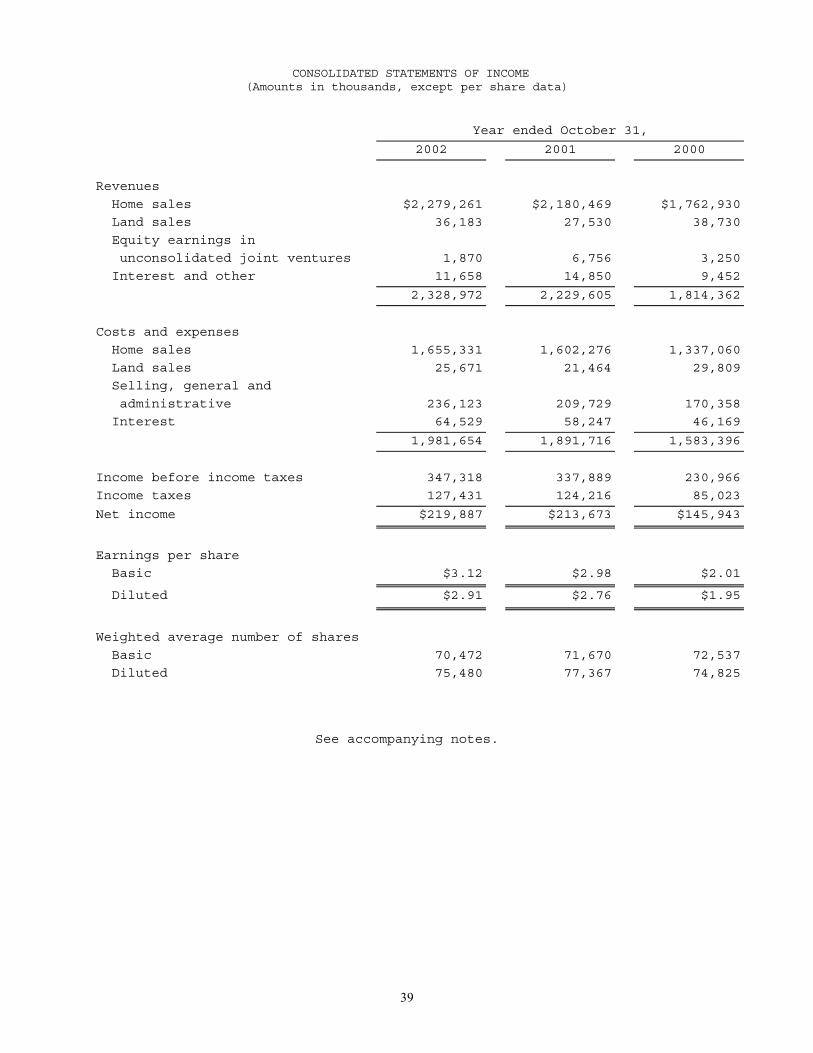
39
CONSOLIDATED STATEMENTS OF INCOME(Amounts in thousands, except per share data)
Year ended October 31,
2002 2001 2000
Revenues
Home sales $2,279,261 $2,180,469 $1,762,930
Land sales 36,183 27,530 38,730
Equity earnings in
unconsolidated joint ventures 1,870 6,756 3,250
Interest and other 11,658 14,850 9,452
2,328,972 2,229,605 1,814,362
Costs and expenses
Home sales 1,655,331 1,602,276 1,337,060
Land sales 25,671 21,464 29,809
Selling, general and
administrative 236,123 209,729 170,358
Interest 64,529 58,247 46,169
1,981,654 1,891,716 1,583,396
Income before income taxes 347,318 337,889 230,966
Income taxes 127,431 124,216 85,023
Net income $219,887 $213,673 $145,943
Earnings per share
Basic $3.12 $2.98 $2.01
Diluted $2.91 $2.76 $1.95
Weighted average number of shares
Basic 70,472 71,670 72,537
Diluted 75,480 77,367 74,825
See accompanying notes.
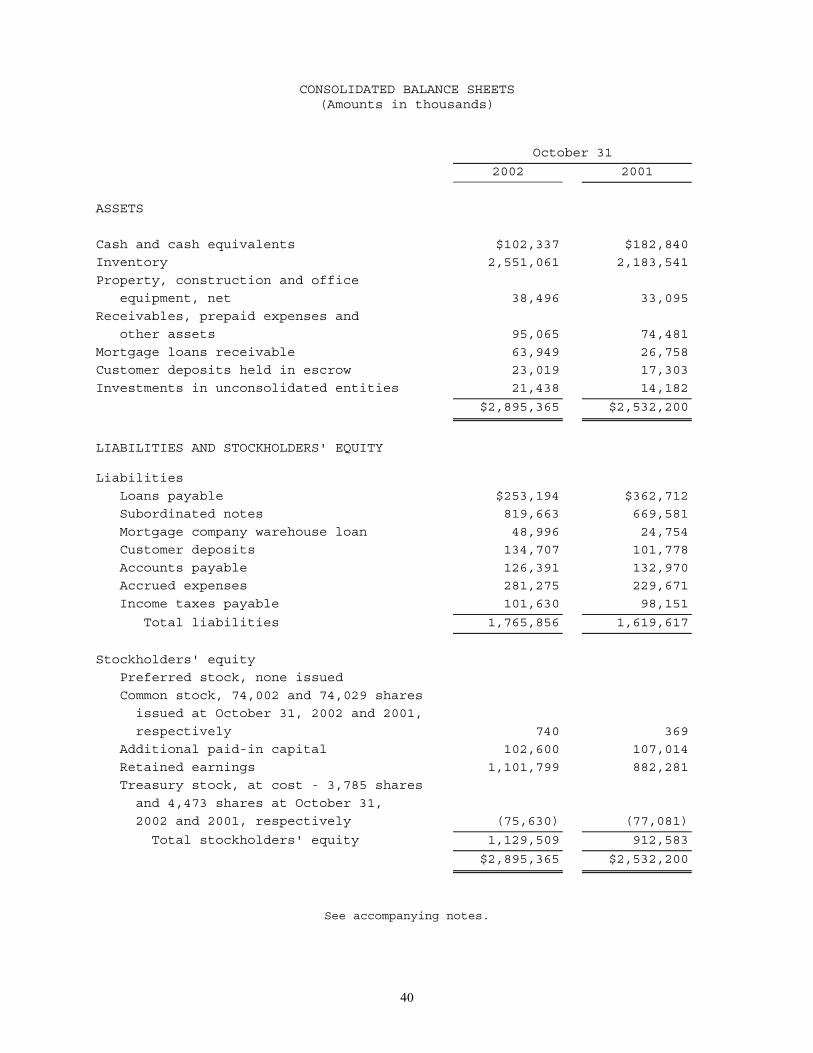
40
CONSOLIDATED BALANCE SHEETS(Amounts in thousands)
October 31
2002 2001
ASSETS
Cash and cash equivalents $102,337 $182,840
Inventory 2,551,061 2,183,541
Property, construction and office
equipment, net 38,496 33,095
Receivables, prepaid expenses and
other assets 95,065 74,481
Mortgage loans receivable 63,949 26,758
Customer deposits held in escrow 23,019 17,303
Investments in unconsolidated entities 21,438 14,182
$2,895,365 $2,532,200
LIABILITIES AND STOCKHOLDERS' EQUITY
Liabilities
Loans payable $253,194 $362,712
Subordinated notes 819,663 669,581
Mortgage company warehouse loan 48,996 24,754
Customer deposits 134,707 101,778
Accounts payable 126,391 132,970
Accrued expenses 281,275 229,671
Income taxes payable 101,630 98,151
Total liabilities 1,765,856 1,619,617
Stockholders' equity
Preferred stock, none issued
Common stock, 74,002 and 74,029 shares
issued at October 31, 2002 and 2001,
respectively 740 369
Additional paid-in capital 102,600 107,014
Retained earnings 1,101,799 882,281
Treasury stock, at cost - 3,785 shares
and 4,473 shares at October 31,
2002 and 2001, respectively (75,630) (77,081)
Total stockholders' equity 1,129,509 912,583
$2,895,365 $2,532,200
See accompanying notes.
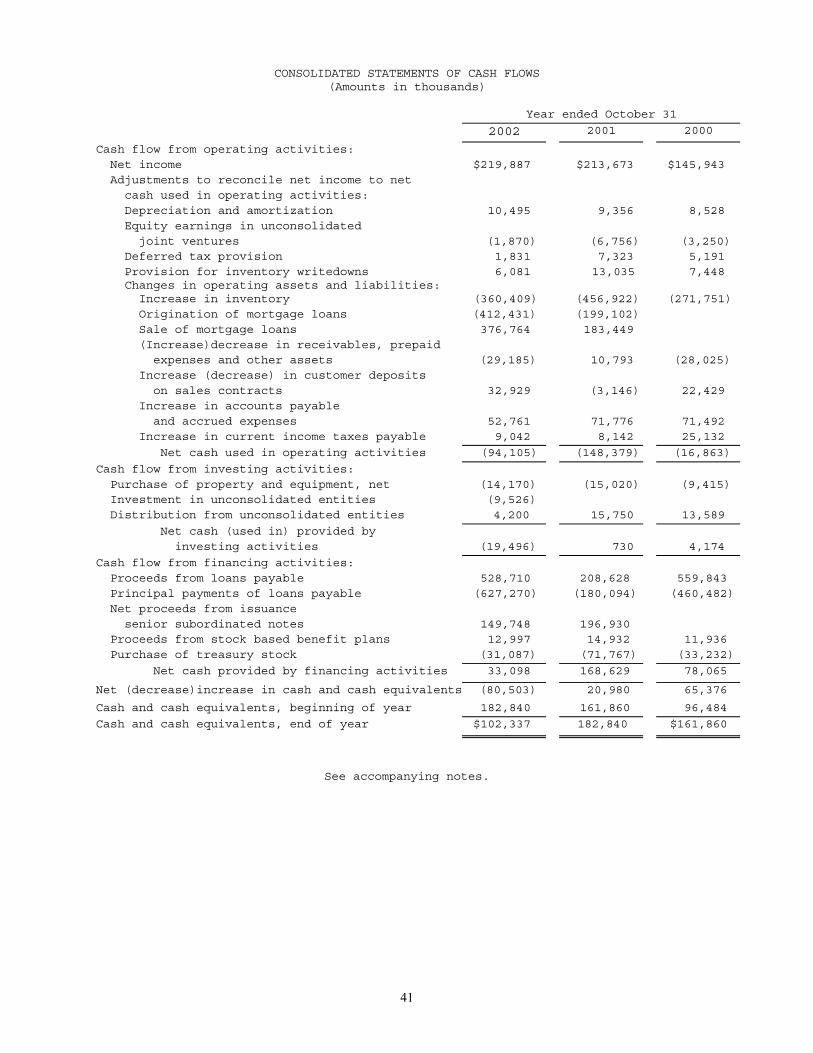
41
CONSOLIDATED STATEMENTS OF CASH FLOWS(Amounts in thousands)
Year ended October 31
2002 2001 2000
Cash flow from operating activities: Net income $219,887 $213,673 $145,943 Adjustments to reconcile net income to net cash used in operating activities: Depreciation and amortization 10,495 9,356 8,528 Equity earnings in unconsolidated joint ventures (1,870) (6,756) (3,250) Deferred tax provision 1,831 7,323 5,191 Provision for inventory writedowns Changes in operating assets and liabilities:
6,081 13,035 7,448
Increase in inventory (360,409) (456,922) (271,751) Origination of mortgage loans (412,431) (199,102) Sale of mortgage loans 376,764 183,449 (Increase)decrease in receivables, prepaid expenses and other assets (29,185) 10,793 (28,025) Increase (decrease) in customer deposits on sales contracts 32,929 (3,146) 22,429 Increase in accounts payable and accrued expenses 52,761 71,776 71,492 Increase in current income taxes payable 9,042 8,142 25,132
Net cash used in operating activities (94,105) (148,379) (16,863)
Cash flow from investing activities: Purchase of property and equipment, net (14,170) (15,020) (9,415) Investment in unconsolidated entities (9,526) Distribution from unconsolidated entities 4,200 15,750 13,589
Net cash (used in) provided by investing activities (19,496) 730 4,174
Cash flow from financing activities: Proceeds from loans payable 528,710 208,628 559,843 Principal payments of loans payable (627,270) (180,094) (460,482) Net proceeds from issuance senior subordinated notes 149,748 196,930 Proceeds from stock based benefit plans 12,997 14,932 11,936 Purchase of treasury stock (31,087) (71,767) (33,232)
Net cash provided by financing activities 33,098 168,629 78,065
Net (decrease)increase in cash and cash equivalents (80,503) 20,980 65,376
Cash and cash equivalents, beginning of year 182,840 161,860 96,484
Cash and cash equivalents, end of year $102,337 182,840 $161,860
See accompanying notes.
42
Notes to Consolidated Financial Statements
1. Significant Accounting Policies
Basis of Presentation
The accompanying consolidated financial statements include the accounts ofToll Brothers, Inc. (the "Company"), a Delaware corporation, and itsmajority-owned subsidiaries. All significant intercompany accounts andtransactions have been eliminated. Investments in 20% to 50% ownedpartnerships and affiliates are accounted for on the equity method.Investments in less than 20% owned entities are accounted for on the costmethod.
Use of Estimates
The preparation of financial statements in conformity with accountingprinciples generally accepted in the United States requires management tomake estimates and assumptions that affect the amounts reported in thefinancial statements and accompanying notes. Actual results could differ fromthose estimates.
Income Recognition
The Company is primarily engaged in the development, construction and sale ofresidential homes. Revenues and cost of sales are recorded at the time eachhome sale is closed and title and possession have been transferred to thebuyer. Closing normally occurs shortly after construction is substantiallycompleted.
Land, land development and related costs (both incurred and estimated to beincurred in the future) are amortized to the cost of homes closed based uponthe total number of homes the Company expects to construct in each community.Any changes resulting from a change in the estimated number of homes to beconstructed or a change in estimated costs subsequent to the commencement ofdelivery of homes are allocated to the remaining undelivered homes in thecommunity. Home construction and related costs are charged to the cost ofhomes closed under the specific identification method.
The estimated land, common area development and related costs of masterplanned communities (including the cost of golf courses, net of theirestimated residual value) are allocated to individual communities within amaster planned community on a relative sales value basis. Any changesresulting from a change in the estimated number of homes to be constructed ora change in estimated costs are allocated to the remaining lots in each ofthe communities of the master planned community.
Land sales revenue and cost of sales are recorded at the time that title andpossession of the property have been transferred to the buyer.
Cash and Cash Equivalents
Liquid investments or investments with original maturities of three months orless are classified as cash equivalents. The carrying value of theseinvestments approximates their fair value.

43
Property, Construction and Office Equipment
Property, construction and office equipment are recorded at cost and arestated net of accumulated depreciation of $44.5 million and $35.8 million atOctober 31, 2002 and 2001, respectively. Depreciation is recorded by usingthe straight-line method over the estimated useful lives of the assets.
Inventory
Inventory is stated at the lower of cost or fair value in accordance withStatement of Financial Accounting Standards No. 121, "Accounting for theImpairment of Long-Lived Assets and for Long-Lived Assets to be Disposed Of."In addition to direct land acquisition, land development and homeconstruction costs, costs include interest, real estate taxes and directoverhead costs related to development and construction, which are capitalizedto inventories during the period beginning with the commencement ofdevelopment and ending with the completion of construction.
It takes approximately four to five years to fully develop, sell and deliverall the homes in one of the Company's typical communities. Longer or shortertime periods are possible depending on the number of home sites in acommunity. The Company's master planned communities, consisting of severalsmaller communities, may take up to 10 years to complete. Since theCompany's inventory is considered a long-lived asset under accountingprinciples generally accepted in the United States, the Company is requiredto review the carrying value of each of its communities and writedown thevalue of those communities for which it believes the values are notrecoverable. When the profitability of a current community deteriorates orthe sales pace declines significantly or some other factor indicates apossible impairment in the recoverability of the asset, the Company evaluatesthe property in accordance with the guidelines of SFAS No. 121. If thisevaluation indicates an impairment loss should be recognized, the Companycharges cost of sales for the estimated impairment loss in the perioddetermined.
In addition, the Company reviews all the land held for future communities orfuture sections of current communities, whether owned or under contract, todetermine whether or not it expects to proceed with the development of theland, and, if so, whether it will be developed in the manner originallycontemplated. Based upon this review, the Company decides: (a) as to landthat is under a purchase contract but not owned, whether the contract will beterminated or renegotiated; and (b) as to land the Company owns, whether theland can be developed as contemplated or in an alternative manner, or shouldbe sold. The Company then further determines which costs that have beencapitalized to the property are recoverable and which costs should be writtenoff.
The Company capitalizes certain project marketing costs and charges themagainst income as homes are closed.
Joint Venture Accounting
The Company is a party to three joint ventures with independent third partiesto develop and sell land that was owned or is currently owned by its venturepartners. The Company recognizes its share of the earnings from the sale oflots to other builders. The Company does not recognize earnings from the lotsit purchases from these ventures, but reduces its cost basis in the lots byits share of the earnings from those lots.

44
The Company effectively owns one-third of Toll Brothers Realty Trust Groupand 50% of a joint venture that is selling and building an active-adult, age-qualified community. The Company recognizes its share of the earnings fromthese entities.
Treasury Stock
Treasury stock is recorded at cost. Issuance of treasury shares is accountedfor on a first-in, first-out basis. Differences between the cost of treasuryshares and the re-issuance proceeds are charged to additional paid-incapital.
Advertising Costs
The Company expenses advertising costs as incurred.
Warranty Costs
The Company accrues for expected warranty costs at the time each home isclosed and title and possession have been transferred to the buyer. Costs areaccrued based upon historical experience.
Insurance Costs
The Company accrues for the expected costs associated with the deductiblesand self-insured retentions on its various insurance policies.
Segment Reporting
Statement of Financial Accounting Standards ("SFAS") No. 131, "Disclosuresabout Segments of an Enterprise and Related Information," establishesstandards for the manner in which public enterprises report information aboutoperating segments. The Company has determined that its operations primarilyinvolve one reportable segment, home building.
Goodwill and Other Intangible Assets
SFAS No. 142, “Goodwill and Other Intangible Assets,” provides guidance onaccounting for intangible assets and eliminates the amortization of goodwilland certain other intangible assets. Intangible assets, including goodwill,that are not subject to amortization are required to be tested for impairmentand possible writedown on an annual basis. The Company adopted SFAS No. 142as of November 1, 2001, the first day of its 2002 fiscal year. The adoptionof SFAS No. 142 did not have a material impact on the Company's fiscal 2002financial statements. The Company had $9.4 million of unamortized goodwill asof November 1, 2001. The Company amortized $1.1 million (net of $674,000 ofincome taxes) and $1.1 million (net of $665,000 of income taxes) in fiscal2001 and 2000, respectively. Had the Company not amortized goodwill duringfiscal 2001, net income, diluted earnings per share and basic earnings pershare would have been $214.8 million, $2.78 and $3.00, respectively. Had theCompany not amortized goodwill during fiscal 2000, net income, dilutedearnings per share and basic earnings per share would have been $147.1million, $1.97 and $2.03, respectively.
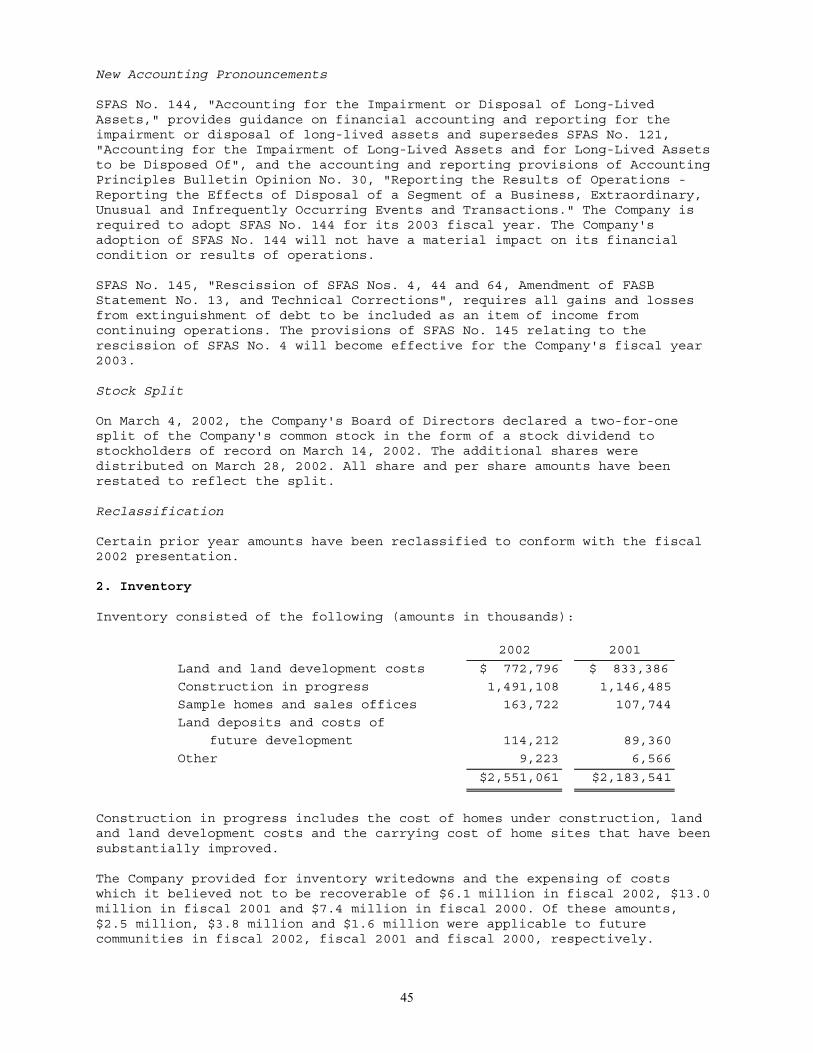
45
New Accounting Pronouncements
SFAS No. 144, "Accounting for the Impairment or Disposal of Long-LivedAssets," provides guidance on financial accounting and reporting for theimpairment or disposal of long-lived assets and supersedes SFAS No. 121,"Accounting for the Impairment of Long-Lived Assets and for Long-Lived Assetsto be Disposed Of", and the accounting and reporting provisions of AccountingPrinciples Bulletin Opinion No. 30, "Reporting the Results of Operations -Reporting the Effects of Disposal of a Segment of a Business, Extraordinary,Unusual and Infrequently Occurring Events and Transactions." The Company isrequired to adopt SFAS No. 144 for its 2003 fiscal year. The Company'sadoption of SFAS No. 144 will not have a material impact on its financialcondition or results of operations.
SFAS No. 145, "Rescission of SFAS Nos. 4, 44 and 64, Amendment of FASBStatement No. 13, and Technical Corrections", requires all gains and lossesfrom extinguishment of debt to be included as an item of income fromcontinuing operations. The provisions of SFAS No. 145 relating to therescission of SFAS No. 4 will become effective for the Company's fiscal year2003.
Stock Split
On March 4, 2002, the Company's Board of Directors declared a two-for-onesplit of the Company's common stock in the form of a stock dividend tostockholders of record on March 14, 2002. The additional shares weredistributed on March 28, 2002. All share and per share amounts have beenrestated to reflect the split.
Reclassification
Certain prior year amounts have been reclassified to conform with the fiscal2002 presentation.
2. Inventory
Inventory consisted of the following (amounts in thousands):
2002 2001
Land and land development costs $ 772,796 $ 833,386
Construction in progress 1,491,108 1,146,485
Sample homes and sales offices 163,722 107,744
Land deposits and costs of
future development 114,212 89,360
Other 9,223 6,566
$2,551,061 $2,183,541
Construction in progress includes the cost of homes under construction, landand land development costs and the carrying cost of home sites that have beensubstantially improved.
The Company provided for inventory writedowns and the expensing of costswhich it believed not to be recoverable of $6.1 million in fiscal 2002, $13.0million in fiscal 2001 and $7.4 million in fiscal 2000. Of these amounts,$2.5 million, $3.8 million and $1.6 million were applicable to futurecommunities in fiscal 2002, fiscal 2001 and fiscal 2000, respectively.
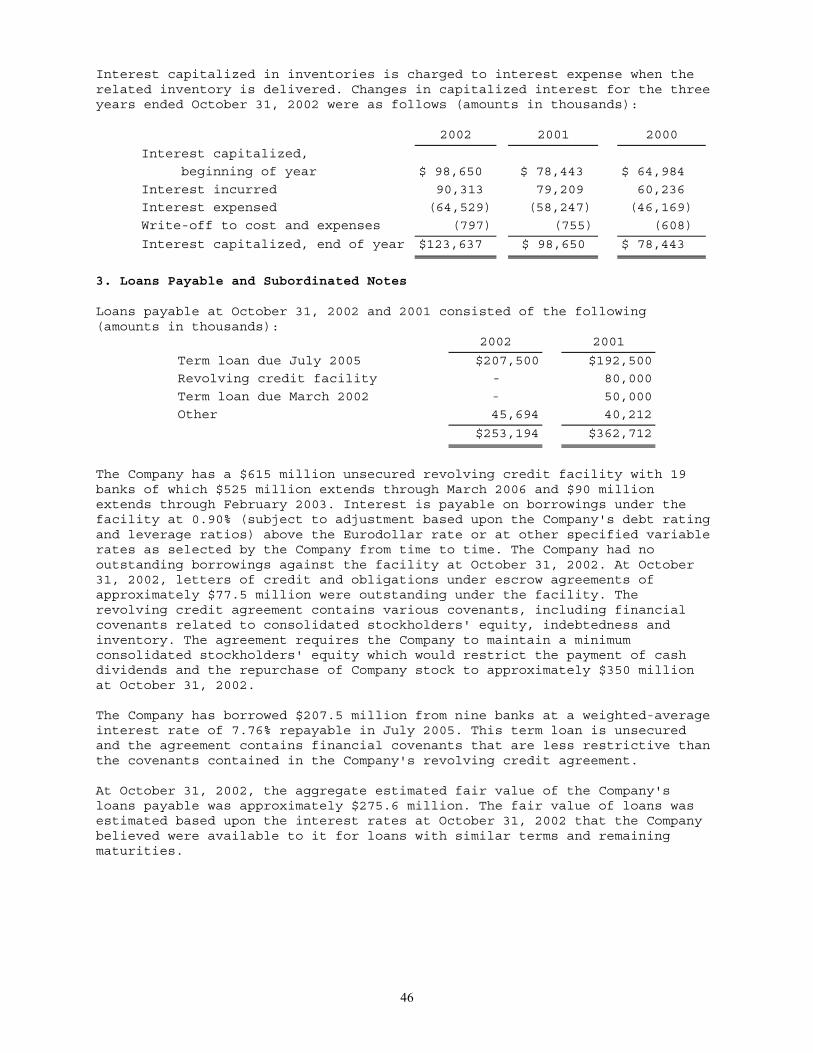
46
Interest capitalized in inventories is charged to interest expense when therelated inventory is delivered. Changes in capitalized interest for the threeyears ended October 31, 2002 were as follows (amounts in thousands):
2002 2001 2000
Interest capitalized,
beginning of year $ 98,650 $ 78,443 $ 64,984
Interest incurred 90,313 79,209 60,236
Interest expensed (64,529) (58,247) (46,169)
Write-off to cost and expenses (797) (755) (608)
Interest capitalized, end of year $123,637 $ 98,650 $ 78,443
3. Loans Payable and Subordinated Notes
Loans payable at October 31, 2002 and 2001 consisted of the following(amounts in thousands):
2002 2001
Term loan due July 2005 $207,500 $192,500
Revolving credit facility - 80,000
Term loan due March 2002 - 50,000
Other 45,694 40,212
$253,194 $362,712
The Company has a $615 million unsecured revolving credit facility with 19banks of which $525 million extends through March 2006 and $90 millionextends through February 2003. Interest is payable on borrowings under thefacility at 0.90% (subject to adjustment based upon the Company's debt ratingand leverage ratios) above the Eurodollar rate or at other specified variablerates as selected by the Company from time to time. The Company had nooutstanding borrowings against the facility at October 31, 2002. At October31, 2002, letters of credit and obligations under escrow agreements ofapproximately $77.5 million were outstanding under the facility. Therevolving credit agreement contains various covenants, including financialcovenants related to consolidated stockholders' equity, indebtedness andinventory. The agreement requires the Company to maintain a minimumconsolidated stockholders' equity which would restrict the payment of cashdividends and the repurchase of Company stock to approximately $350 millionat October 31, 2002.
The Company has borrowed $207.5 million from nine banks at a weighted-averageinterest rate of 7.76% repayable in July 2005. This term loan is unsecuredand the agreement contains financial covenants that are less restrictive thanthe covenants contained in the Company's revolving credit agreement.
At October 31, 2002, the aggregate estimated fair value of the Company'sloans payable was approximately $275.6 million. The fair value of loans wasestimated based upon the interest rates at October 31, 2002 that the Companybelieved were available to it for loans with similar terms and remainingmaturities.
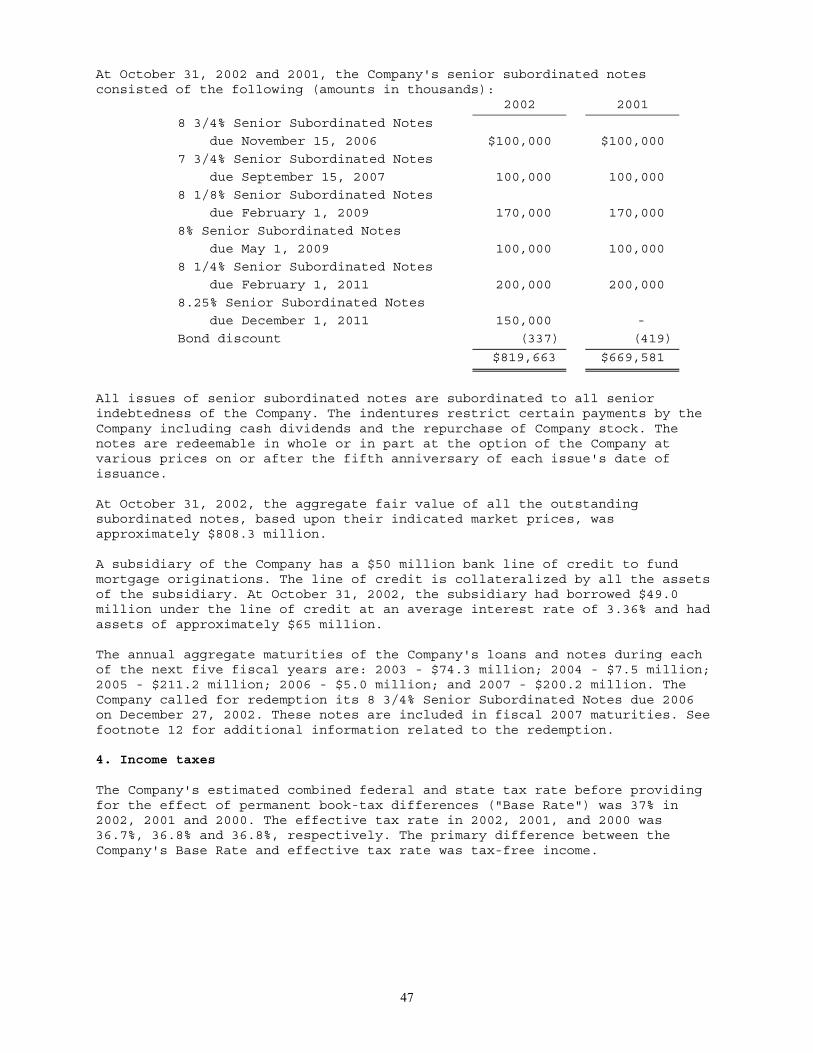
47
At October 31, 2002 and 2001, the Company's senior subordinated notesconsisted of the following (amounts in thousands):
2002 2001
8 3/4% Senior Subordinated Notes
due November 15, 2006 $100,000 $100,000
7 3/4% Senior Subordinated Notes
due September 15, 2007 100,000 100,000
8 1/8% Senior Subordinated Notes
due February 1, 2009 170,000 170,000
8% Senior Subordinated Notes
due May 1, 2009 100,000 100,000
8 1/4% Senior Subordinated Notes
due February 1, 2011 200,000 200,000
8.25% Senior Subordinated Notes
due December 1, 2011 150,000 -
Bond discount (337) (419)
$819,663 $669,581
All issues of senior subordinated notes are subordinated to all seniorindebtedness of the Company. The indentures restrict certain payments by theCompany including cash dividends and the repurchase of Company stock. Thenotes are redeemable in whole or in part at the option of the Company atvarious prices on or after the fifth anniversary of each issue's date ofissuance.
At October 31, 2002, the aggregate fair value of all the outstandingsubordinated notes, based upon their indicated market prices, wasapproximately $808.3 million.
A subsidiary of the Company has a $50 million bank line of credit to fundmortgage originations. The line of credit is collateralized by all the assetsof the subsidiary. At October 31, 2002, the subsidiary had borrowed $49.0million under the line of credit at an average interest rate of 3.36% and hadassets of approximately $65 million.
The annual aggregate maturities of the Company's loans and notes during eachof the next five fiscal years are: 2003 - $74.3 million; 2004 - $7.5 million;2005 - $211.2 million; 2006 - $5.0 million; and 2007 - $200.2 million. TheCompany called for redemption its 8 3/4% Senior Subordinated Notes due 2006on December 27, 2002. These notes are included in fiscal 2007 maturities. Seefootnote 12 for additional information related to the redemption.
4. Income taxes
The Company's estimated combined federal and state tax rate before providingfor the effect of permanent book-tax differences ("Base Rate") was 37% in2002, 2001 and 2000. The effective tax rate in 2002, 2001, and 2000 was36.7%, 36.8% and 36.8%, respectively. The primary difference between theCompany's Base Rate and effective tax rate was tax-free income.
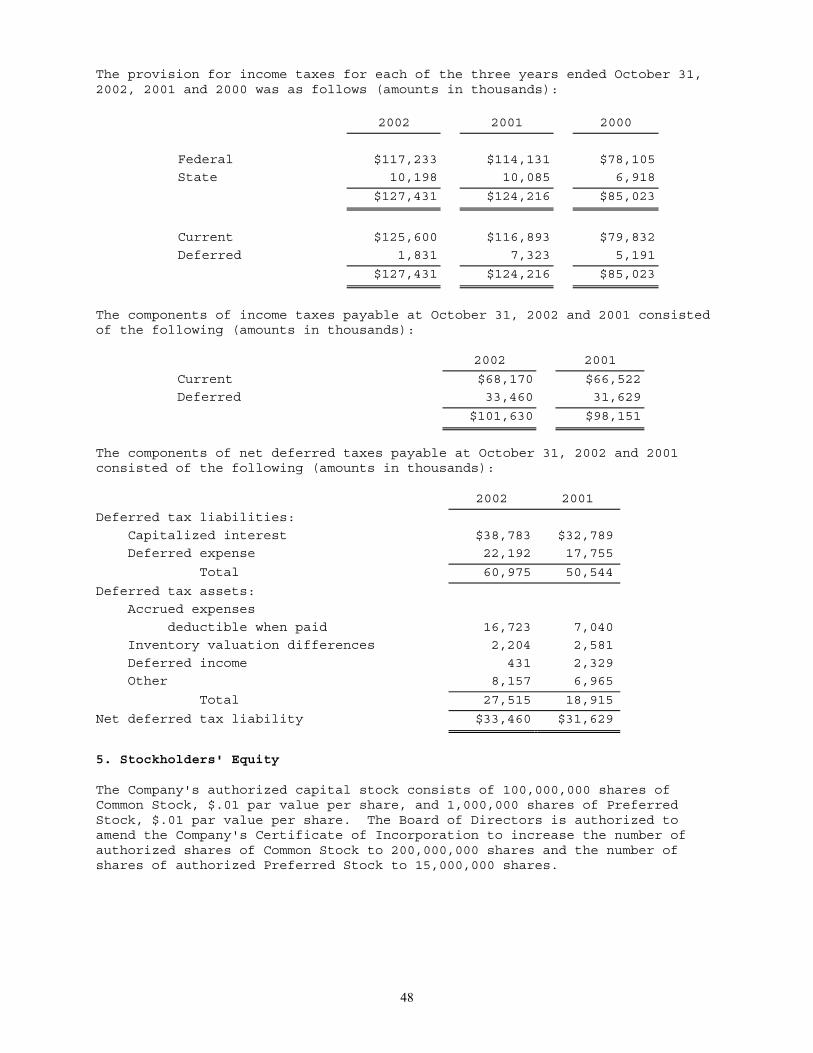
48
The provision for income taxes for each of the three years ended October 31,2002, 2001 and 2000 was as follows (amounts in thousands):
2002 2001 2000
Federal $117,233 $114,131 $78,105
State 10,198 10,085 6,918
$127,431 $124,216 $85,023
Current $125,600 $116,893 $79,832
Deferred 1,831 7,323 5,191
$127,431 $124,216 $85,023
The components of income taxes payable at October 31, 2002 and 2001 consistedof the following (amounts in thousands):
2002 2001
Current $68,170 $66,522
Deferred 33,460 31,629
$101,630 $98,151
The components of net deferred taxes payable at October 31, 2002 and 2001consisted of the following (amounts in thousands):
2002 2001
Deferred tax liabilities:
Capitalized interest $38,783 $32,789
Deferred expense 22,192 17,755
Total 60,975 50,544
Deferred tax assets:
Accrued expenses
deductible when paid 16,723 7,040
Inventory valuation differences 2,204 2,581
Deferred income 431 2,329
Other 8,157 6,965
Total 27,515 18,915
Net deferred tax liability $33,460 $31,629
5. Stockholders' Equity
The Company's authorized capital stock consists of 100,000,000 shares ofCommon Stock, $.01 par value per share, and 1,000,000 shares of PreferredStock, $.01 par value per share. The Board of Directors is authorized toamend the Company's Certificate of Incorporation to increase the number ofauthorized shares of Common Stock to 200,000,000 shares and the number ofshares of authorized Preferred Stock to 15,000,000 shares.
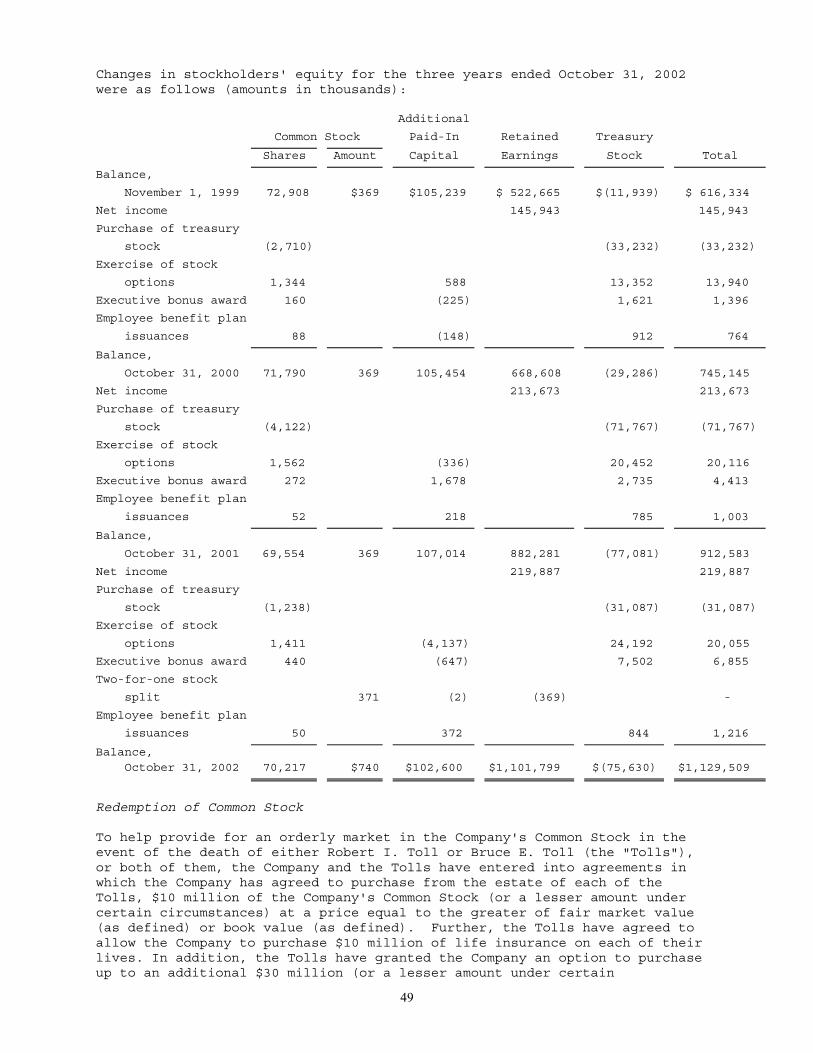
49
Changes in stockholders' equity for the three years ended October 31, 2002were as follows (amounts in thousands):
Additional
Common Stock Paid-In Retained Treasury
Shares Amount Capital Earnings Stock Total
Balance,
November 1, 1999 72,908 $369 $105,239 $ 522,665 $(11,939) $ 616,334
Net income 145,943 145,943
Purchase of treasury
stock (2,710) (33,232) (33,232)
Exercise of stock
options 1,344 588 13,352 13,940
Executive bonus award 160 (225) 1,621 1,396
Employee benefit plan
issuances 88 (148) 912 764
Balance,
October 31, 2000 71,790 369 105,454 668,608 (29,286) 745,145
Net income 213,673 213,673
Purchase of treasury
stock (4,122) (71,767) (71,767)
Exercise of stock
options 1,562 (336) 20,452 20,116
Executive bonus award 272 1,678 2,735 4,413
Employee benefit plan
issuances 52 218 785 1,003
Balance,
October 31, 2001 69,554 369 107,014 882,281 (77,081) 912,583
Net income 219,887 219,887
Purchase of treasury
stock (1,238) (31,087) (31,087)
Exercise of stock
options 1,411 (4,137) 24,192 20,055
Executive bonus award 440 (647) 7,502 6,855
Two-for-one stock
split 371 (2) (369) -
Employee benefit plan
issuances 50 372 844 1,216
Balance, October 31, 2002 70,217 $740 $102,600 $1,101,799 $(75,630) $1,129,509
Redemption of Common Stock
To help provide for an orderly market in the Company's Common Stock in theevent of the death of either Robert I. Toll or Bruce E. Toll (the "Tolls"),or both of them, the Company and the Tolls have entered into agreements inwhich the Company has agreed to purchase from the estate of each of theTolls, $10 million of the Company's Common Stock (or a lesser amount undercertain circumstances) at a price equal to the greater of fair market value(as defined) or book value (as defined). Further, the Tolls have agreed toallow the Company to purchase $10 million of life insurance on each of theirlives. In addition, the Tolls have granted the Company an option to purchaseup to an additional $30 million (or a lesser amount under certain
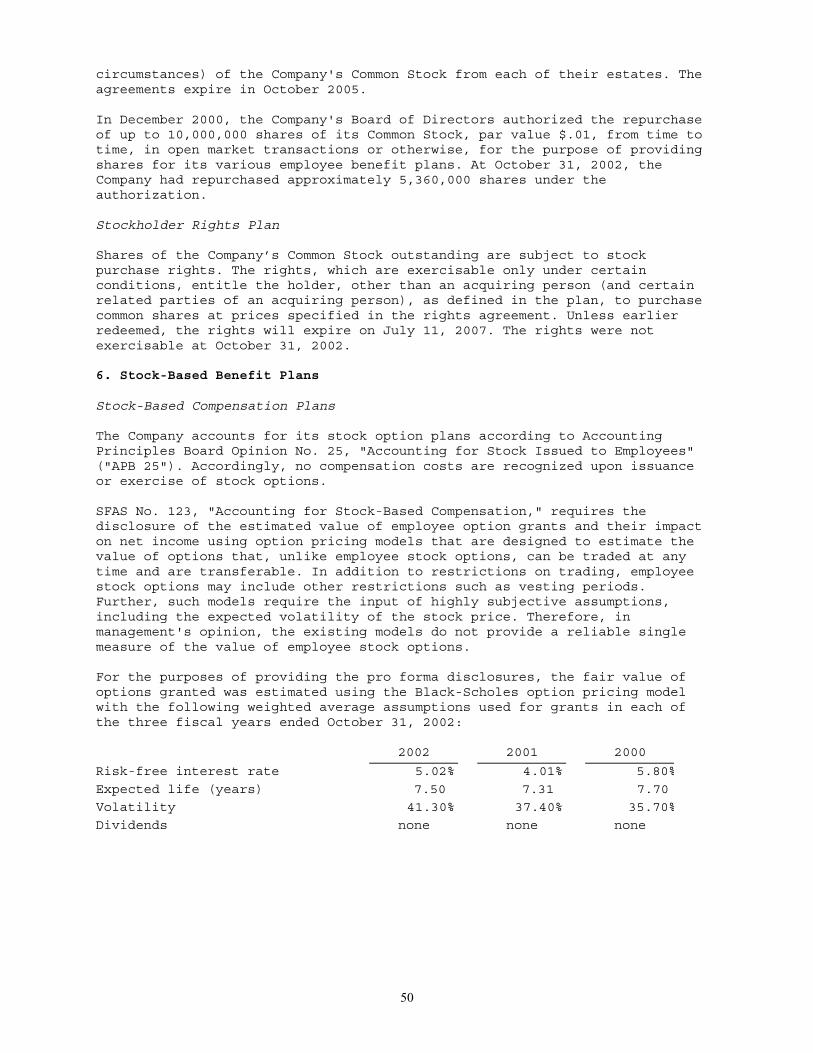
50
circumstances) of the Company's Common Stock from each of their estates. Theagreements expire in October 2005.
In December 2000, the Company's Board of Directors authorized the repurchaseof up to 10,000,000 shares of its Common Stock, par value $.01, from time totime, in open market transactions or otherwise, for the purpose of providingshares for its various employee benefit plans. At October 31, 2002, theCompany had repurchased approximately 5,360,000 shares under theauthorization.
Stockholder Rights Plan
Shares of the Company’s Common Stock outstanding are subject to stockpurchase rights. The rights, which are exercisable only under certainconditions, entitle the holder, other than an acquiring person (and certainrelated parties of an acquiring person), as defined in the plan, to purchasecommon shares at prices specified in the rights agreement. Unless earlierredeemed, the rights will expire on July 11, 2007. The rights were notexercisable at October 31, 2002.
6. Stock-Based Benefit Plans
Stock-Based Compensation Plans
The Company accounts for its stock option plans according to AccountingPrinciples Board Opinion No. 25, "Accounting for Stock Issued to Employees"("APB 25"). Accordingly, no compensation costs are recognized upon issuanceor exercise of stock options.
SFAS No. 123, "Accounting for Stock-Based Compensation," requires thedisclosure of the estimated value of employee option grants and their impacton net income using option pricing models that are designed to estimate thevalue of options that, unlike employee stock options, can be traded at anytime and are transferable. In addition to restrictions on trading, employeestock options may include other restrictions such as vesting periods.Further, such models require the input of highly subjective assumptions,including the expected volatility of the stock price. Therefore, inmanagement's opinion, the existing models do not provide a reliable singlemeasure of the value of employee stock options.
For the purposes of providing the pro forma disclosures, the fair value ofoptions granted was estimated using the Black-Scholes option pricing modelwith the following weighted average assumptions used for grants in each ofthe three fiscal years ended October 31, 2002:
2002 2001 2000
Risk-free interest rate 5.02% 4.01% 5.80%
Expected life (years) 7.50 7.31 7.70
Volatility 41.30% 37.40% 35.70%
Dividends none none none
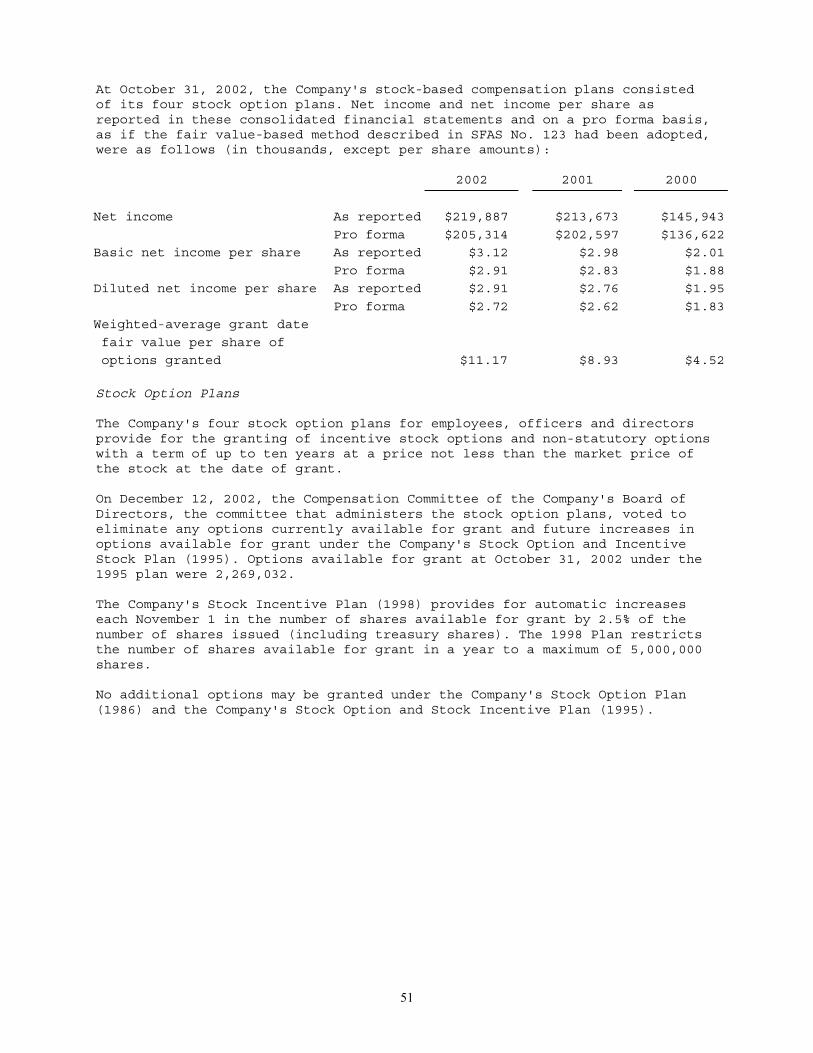
51
At October 31, 2002, the Company's stock-based compensation plans consistedof its four stock option plans. Net income and net income per share asreported in these consolidated financial statements and on a pro forma basis,as if the fair value-based method described in SFAS No. 123 had been adopted,were as follows (in thousands, except per share amounts):
2002 2001 2000
Net income As reported $219,887 $213,673 $145,943
Pro forma $205,314 $202,597 $136,622
Basic net income per share As reported $3.12 $2.98 $2.01
Pro forma $2.91 $2.83 $1.88
Diluted net income per share As reported $2.91 $2.76 $1.95
Pro forma $2.72 $2.62 $1.83
Weighted-average grant date
fair value per share of
options granted $11.17 $8.93 $4.52
Stock Option Plans
The Company's four stock option plans for employees, officers and directorsprovide for the granting of incentive stock options and non-statutory optionswith a term of up to ten years at a price not less than the market price ofthe stock at the date of grant.
On December 12, 2002, the Compensation Committee of the Company's Board ofDirectors, the committee that administers the stock option plans, voted toeliminate any options currently available for grant and future increases inoptions available for grant under the Company's Stock Option and IncentiveStock Plan (1995). Options available for grant at October 31, 2002 under the1995 plan were 2,269,032.
The Company's Stock Incentive Plan (1998) provides for automatic increaseseach November 1 in the number of shares available for grant by 2.5% of thenumber of shares issued (including treasury shares). The 1998 Plan restrictsthe number of shares available for grant in a year to a maximum of 5,000,000shares.
No additional options may be granted under the Company's Stock Option Plan(1986) and the Company's Stock Option and Stock Incentive Plan (1995).
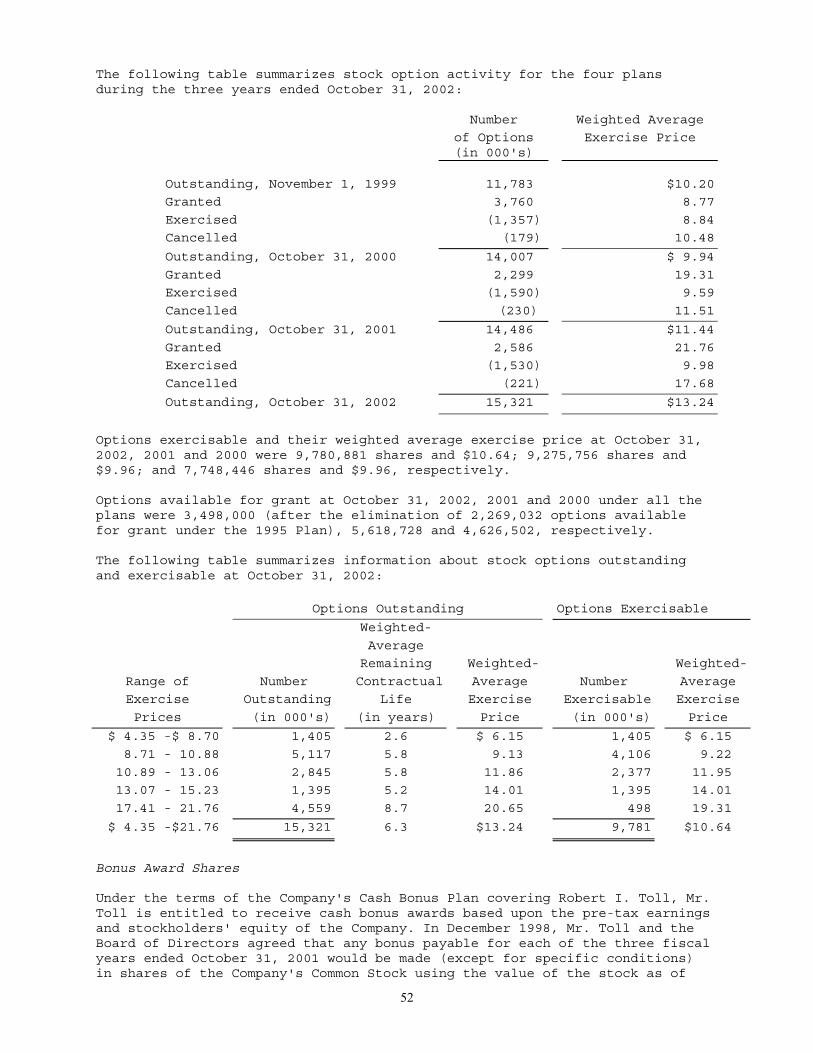
52
The following table summarizes stock option activity for the four plansduring the three years ended October 31, 2002:
Number Weighted Average
of Options(in 000's)
Exercise Price
Outstanding, November 1, 1999 11,783 $10.20
Granted 3,760 8.77
Exercised (1,357) 8.84
Cancelled (179) 10.48
Outstanding, October 31, 2000 14,007 $ 9.94
Granted 2,299 19.31
Exercised (1,590) 9.59
Cancelled (230) 11.51
Outstanding, October 31, 2001 14,486 $11.44
Granted 2,586 21.76
Exercised (1,530) 9.98
Cancelled (221) 17.68
Outstanding, October 31, 2002 15,321 $13.24
Options exercisable and their weighted average exercise price at October 31,2002, 2001 and 2000 were 9,780,881 shares and $10.64; 9,275,756 shares and$9.96; and 7,748,446 shares and $9.96, respectively.
Options available for grant at October 31, 2002, 2001 and 2000 under all theplans were 3,498,000 (after the elimination of 2,269,032 options availablefor grant under the 1995 Plan), 5,618,728 and 4,626,502, respectively.
The following table summarizes information about stock options outstandingand exercisable at October 31, 2002:
Options Outstanding Options Exercisable
Weighted-
Average
Remaining Weighted- Weighted-
Range of Number Contractual Average Number Average
Exercise Outstanding Life Exercise Exercisable Exercise
Prices (in 000's) (in years) Price (in 000's) Price
$ 4.35 -$ 8.70 1,405 2.6 $ 6.15 1,405 $ 6.15
8.71 - 10.88 5,117 5.8 9.13 4,106 9.22
10.89 - 13.06 2,845 5.8 11.86 2,377 11.95
13.07 - 15.23 1,395 5.2 14.01 1,395 14.01
17.41 - 21.76 4,559 8.7 20.65 498 19.31
$ 4.35 -$21.76 15,321 6.3 $13.24 9,781 $10.64
Bonus Award Shares
Under the terms of the Company's Cash Bonus Plan covering Robert I. Toll, Mr.Toll is entitled to receive cash bonus awards based upon the pre-tax earningsand stockholders' equity of the Company. In December 1998, Mr. Toll and theBoard of Directors agreed that any bonus payable for each of the three fiscalyears ended October 31, 2001 would be made (except for specific conditions)in shares of the Company's Common Stock using the value of the stock as of
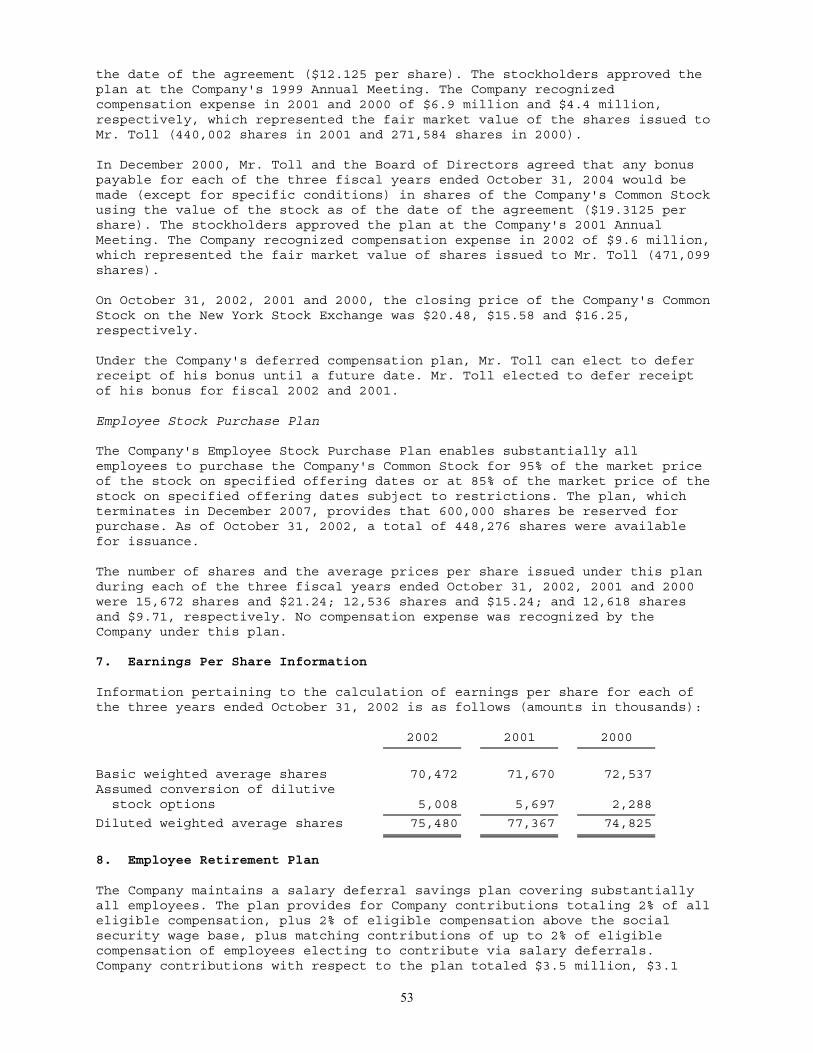
53
the date of the agreement ($12.125 per share). The stockholders approved theplan at the Company's 1999 Annual Meeting. The Company recognizedcompensation expense in 2001 and 2000 of $6.9 million and $4.4 million,respectively, which represented the fair market value of the shares issued toMr. Toll (440,002 shares in 2001 and 271,584 shares in 2000).
In December 2000, Mr. Toll and the Board of Directors agreed that any bonuspayable for each of the three fiscal years ended October 31, 2004 would bemade (except for specific conditions) in shares of the Company's Common Stockusing the value of the stock as of the date of the agreement ($19.3125 pershare). The stockholders approved the plan at the Company's 2001 AnnualMeeting. The Company recognized compensation expense in 2002 of $9.6 million,which represented the fair market value of shares issued to Mr. Toll (471,099shares).
On October 31, 2002, 2001 and 2000, the closing price of the Company's CommonStock on the New York Stock Exchange was $20.48, $15.58 and $16.25,respectively.
Under the Company's deferred compensation plan, Mr. Toll can elect to deferreceipt of his bonus until a future date. Mr. Toll elected to defer receiptof his bonus for fiscal 2002 and 2001.
Employee Stock Purchase Plan
The Company's Employee Stock Purchase Plan enables substantially allemployees to purchase the Company's Common Stock for 95% of the market priceof the stock on specified offering dates or at 85% of the market price of thestock on specified offering dates subject to restrictions. The plan, whichterminates in December 2007, provides that 600,000 shares be reserved forpurchase. As of October 31, 2002, a total of 448,276 shares were availablefor issuance.
The number of shares and the average prices per share issued under this planduring each of the three fiscal years ended October 31, 2002, 2001 and 2000were 15,672 shares and $21.24; 12,536 shares and $15.24; and 12,618 sharesand $9.71, respectively. No compensation expense was recognized by theCompany under this plan.
7. Earnings Per Share Information
Information pertaining to the calculation of earnings per share for each ofthe three years ended October 31, 2002 is as follows (amounts in thousands):
2002 2001 2000
Basic weighted average sharesAssumed conversion of dilutive
70,472 71,670 72,537
stock options 5,008 5,697 2,288
Diluted weighted average shares 75,480 77,367 74,825
8. Employee Retirement Plan
The Company maintains a salary deferral savings plan covering substantiallyall employees. The plan provides for Company contributions totaling 2% of alleligible compensation, plus 2% of eligible compensation above the socialsecurity wage base, plus matching contributions of up to 2% of eligiblecompensation of employees electing to contribute via salary deferrals.Company contributions with respect to the plan totaled $3.5 million, $3.1
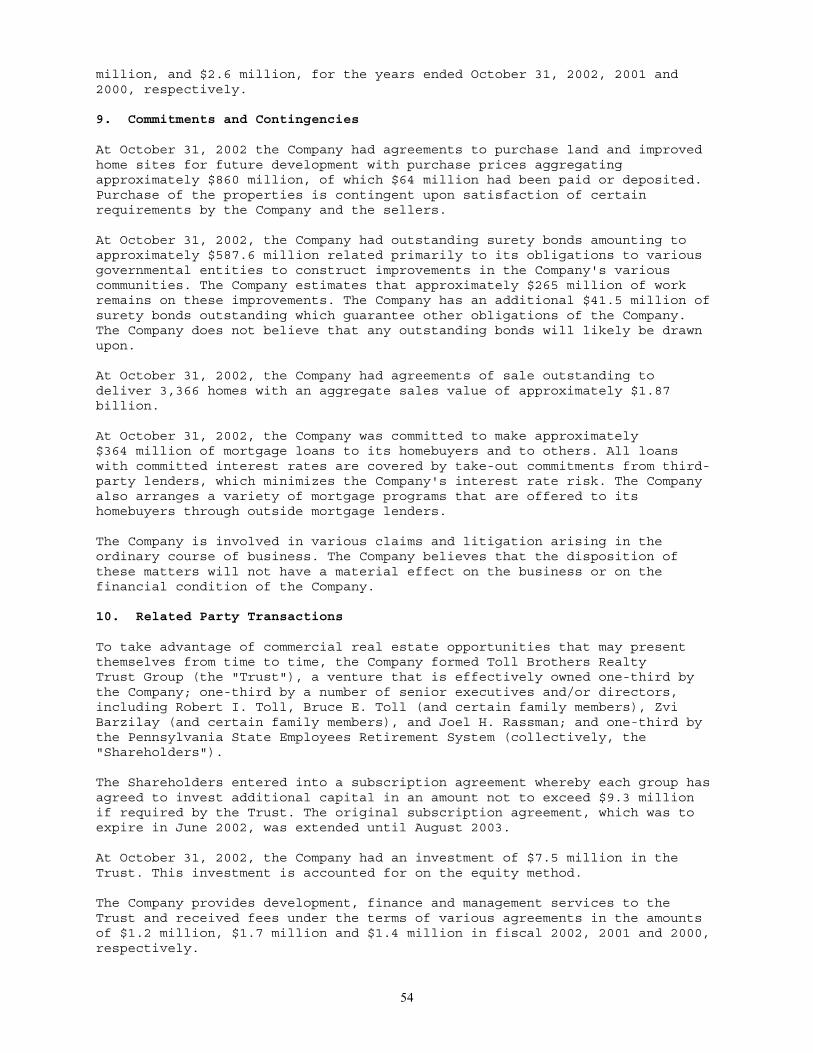
54
million, and $2.6 million, for the years ended October 31, 2002, 2001 and2000, respectively.
9. Commitments and Contingencies
At October 31, 2002 the Company had agreements to purchase land and improvedhome sites for future development with purchase prices aggregatingapproximately $860 million, of which $64 million had been paid or deposited.Purchase of the properties is contingent upon satisfaction of certainrequirements by the Company and the sellers.
At October 31, 2002, the Company had outstanding surety bonds amounting toapproximately $587.6 million related primarily to its obligations to variousgovernmental entities to construct improvements in the Company's variouscommunities. The Company estimates that approximately $265 million of workremains on these improvements. The Company has an additional $41.5 million ofsurety bonds outstanding which guarantee other obligations of the Company.The Company does not believe that any outstanding bonds will likely be drawnupon.
At October 31, 2002, the Company had agreements of sale outstanding todeliver 3,366 homes with an aggregate sales value of approximately $1.87billion.
At October 31, 2002, the Company was committed to make approximately$364 million of mortgage loans to its homebuyers and to others. All loanswith committed interest rates are covered by take-out commitments from third-party lenders, which minimizes the Company's interest rate risk. The Companyalso arranges a variety of mortgage programs that are offered to itshomebuyers through outside mortgage lenders.
The Company is involved in various claims and litigation arising in theordinary course of business. The Company believes that the disposition ofthese matters will not have a material effect on the business or on thefinancial condition of the Company.
10. Related Party Transactions
To take advantage of commercial real estate opportunities that may presentthemselves from time to time, the Company formed Toll Brothers RealtyTrust Group (the "Trust"), a venture that is effectively owned one-third bythe Company; one-third by a number of senior executives and/or directors,including Robert I. Toll, Bruce E. Toll (and certain family members), ZviBarzilay (and certain family members), and Joel H. Rassman; and one-third bythe Pennsylvania State Employees Retirement System (collectively, the"Shareholders").
The Shareholders entered into a subscription agreement whereby each group hasagreed to invest additional capital in an amount not to exceed $9.3 millionif required by the Trust. The original subscription agreement, which was toexpire in June 2002, was extended until August 2003.
At October 31, 2002, the Company had an investment of $7.5 million in theTrust. This investment is accounted for on the equity method.
The Company provides development, finance and management services to theTrust and received fees under the terms of various agreements in the amountsof $1.2 million, $1.7 million and $1.4 million in fiscal 2002, 2001 and 2000,respectively.
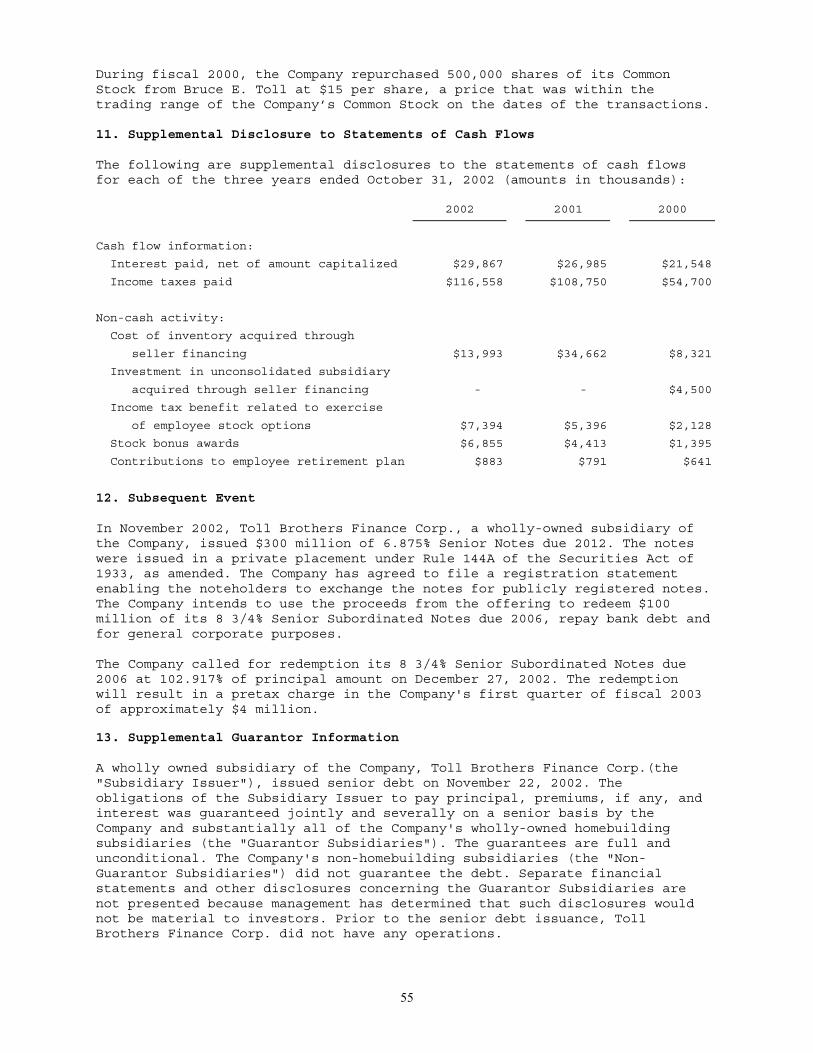
55
During fiscal 2000, the Company repurchased 500,000 shares of its CommonStock from Bruce E. Toll at $15 per share, a price that was within thetrading range of the Company’s Common Stock on the dates of the transactions.
11. Supplemental Disclosure to Statements of Cash Flows
The following are supplemental disclosures to the statements of cash flowsfor each of the three years ended October 31, 2002 (amounts in thousands):
2002 2001 2000
Cash flow information:
Interest paid, net of amount capitalized $29,867 $26,985 $21,548
Income taxes paid $116,558 $108,750 $54,700
Non-cash activity:
Cost of inventory acquired through
seller financing $13,993 $34,662 $8,321
Investment in unconsolidated subsidiary
acquired through seller financing - - $4,500
Income tax benefit related to exercise
of employee stock options $7,394 $5,396 $2,128
Stock bonus awards $6,855 $4,413 $1,395
Contributions to employee retirement plan $883 $791 $641
12. Subsequent Event
In November 2002, Toll Brothers Finance Corp., a wholly-owned subsidiary ofthe Company, issued $300 million of 6.875% Senior Notes due 2012. The noteswere issued in a private placement under Rule 144A of the Securities Act of1933, as amended. The Company has agreed to file a registration statementenabling the noteholders to exchange the notes for publicly registered notes.The Company intends to use the proceeds from the offering to redeem $100million of its 8 3/4% Senior Subordinated Notes due 2006, repay bank debt andfor general corporate purposes.
The Company called for redemption its 8 3/4% Senior Subordinated Notes due2006 at 102.917% of principal amount on December 27, 2002. The redemptionwill result in a pretax charge in the Company's first quarter of fiscal 2003of approximately $4 million.
13. Supplemental Guarantor Information
A wholly owned subsidiary of the Company, Toll Brothers Finance Corp.(the"Subsidiary Issuer"), issued senior debt on November 22, 2002. Theobligations of the Subsidiary Issuer to pay principal, premiums, if any, andinterest was guaranteed jointly and severally on a senior basis by theCompany and substantially all of the Company's wholly-owned homebuildingsubsidiaries (the "Guarantor Subsidiaries"). The guarantees are full andunconditional. The Company's non-homebuilding subsidiaries (the "Non-Guarantor Subsidiaries") did not guarantee the debt. Separate financialstatements and other disclosures concerning the Guarantor Subsidiaries arenot presented because management has determined that such disclosures wouldnot be material to investors. Prior to the senior debt issuance, TollBrothers Finance Corp. did not have any operations.
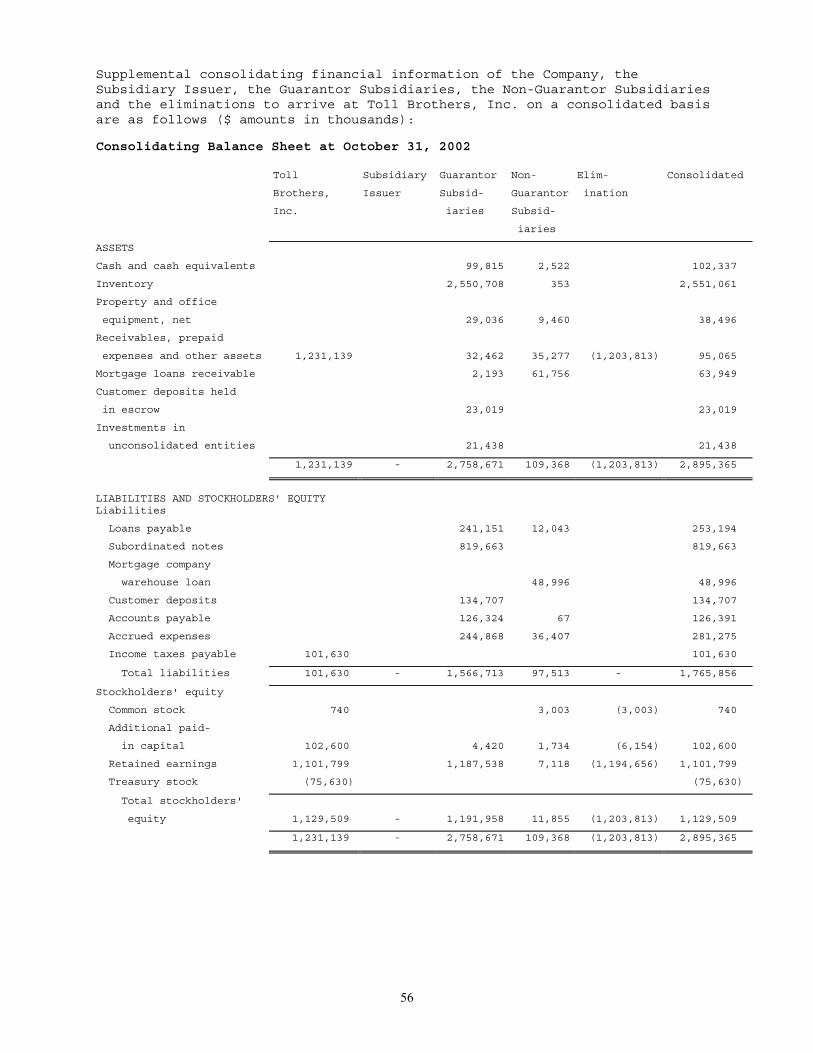
56
Supplemental consolidating financial information of the Company, theSubsidiary Issuer, the Guarantor Subsidiaries, the Non-Guarantor Subsidiariesand the eliminations to arrive at Toll Brothers, Inc. on a consolidated basisare as follows ($ amounts in thousands):
Consolidating Balance Sheet at October 31, 2002
Toll Subsidiary Guarantor Non- Elim- Consolidated
Brothers, Issuer Subsid- Guarantor ination
Inc. iaries Subsid-
iaries
ASSETS
Cash and cash equivalents 99,815 2,522 102,337
Inventory 2,550,708 353 2,551,061
Property and office
equipment, net 29,036 9,460 38,496
Receivables, prepaid
expenses and other assets 1,231,139 32,462 35,277 (1,203,813) 95,065
Mortgage loans receivable 2,193 61,756 63,949
Customer deposits held
in escrow 23,019 23,019
Investments in
unconsolidated entities 21,438 21,438
1,231,139 - 2,758,671 109,368 (1,203,813) 2,895,365
LIABILITIES AND STOCKHOLDERS' EQUITYLiabilities
Loans payable 241,151 12,043 253,194
Subordinated notes 819,663 819,663
Mortgage company
warehouse loan 48,996 48,996
Customer deposits 134,707 134,707
Accounts payable 126,324 67 126,391
Accrued expenses 244,868 36,407 281,275
Income taxes payable 101,630 101,630
Total liabilities 101,630 - 1,566,713 97,513 - 1,765,856
Stockholders' equity
Common stock 740 3,003 (3,003) 740
Additional paid-
in capital 102,600 4,420 1,734 (6,154) 102,600
Retained earnings 1,101,799 1,187,538 7,118 (1,194,656) 1,101,799
Treasury stock (75,630) (75,630)
Total stockholders'
equity 1,129,509 - 1,191,958 11,855 (1,203,813) 1,129,509
1,231,139 - 2,758,671 109,368 (1,203,813) 2,895,365
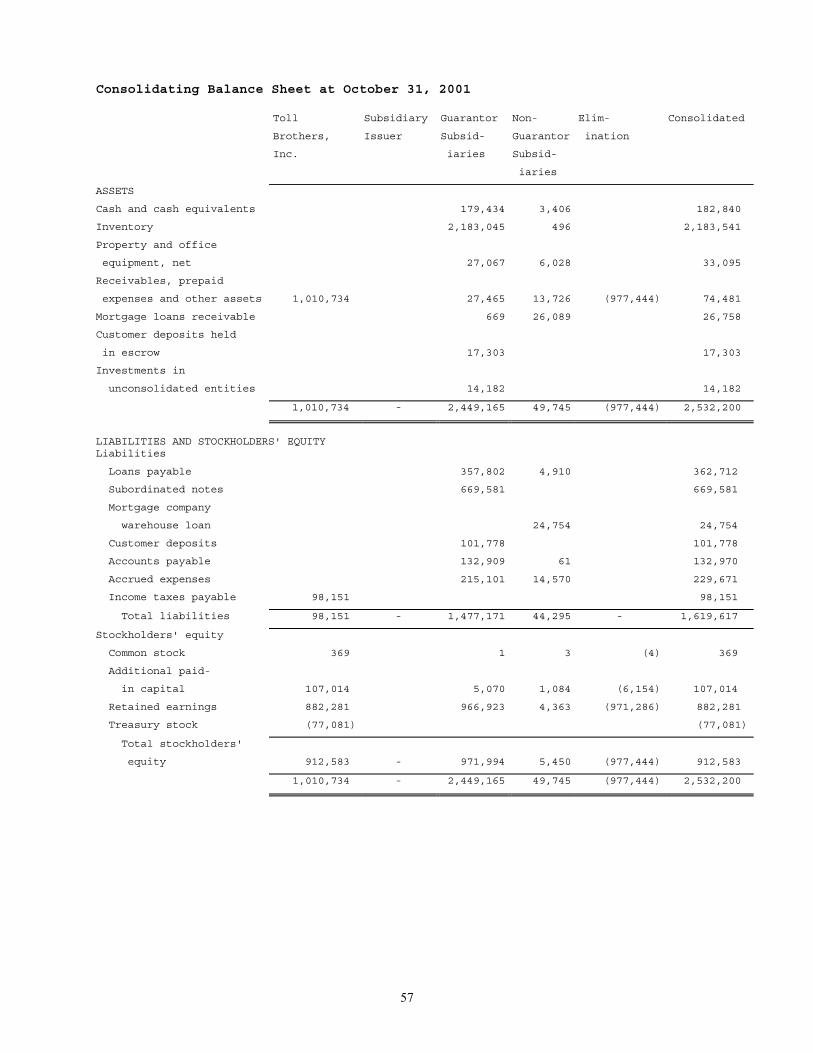
57
Consolidating Balance Sheet at October 31, 2001
Toll Subsidiary Guarantor Non- Elim- Consolidated
Brothers, Issuer Subsid- Guarantor ination
Inc. iaries Subsid-
iaries
ASSETS
Cash and cash equivalents 179,434 3,406 182,840
Inventory 2,183,045 496 2,183,541
Property and office
equipment, net 27,067 6,028 33,095
Receivables, prepaid
expenses and other assets 1,010,734 27,465 13,726 (977,444) 74,481
Mortgage loans receivable 669 26,089 26,758
Customer deposits held
in escrow 17,303 17,303
Investments in
unconsolidated entities 14,182 14,182
1,010,734 - 2,449,165 49,745 (977,444) 2,532,200
LIABILITIES AND STOCKHOLDERS' EQUITYLiabilities
Loans payable 357,802 4,910 362,712
Subordinated notes 669,581 669,581
Mortgage company
warehouse loan 24,754 24,754
Customer deposits 101,778 101,778
Accounts payable 132,909 61 132,970
Accrued expenses 215,101 14,570 229,671
Income taxes payable 98,151 98,151
Total liabilities 98,151 - 1,477,171 44,295 - 1,619,617
Stockholders' equity
Common stock 369 1 3 (4) 369
Additional paid-
in capital 107,014 5,070 1,084 (6,154) 107,014
Retained earnings 882,281 966,923 4,363 (971,286) 882,281
Treasury stock (77,081) (77,081)
Total stockholders'
equity 912,583 - 971,994 5,450 (977,444) 912,583
1,010,734 - 2,449,165 49,745 (977,444) 2,532,200
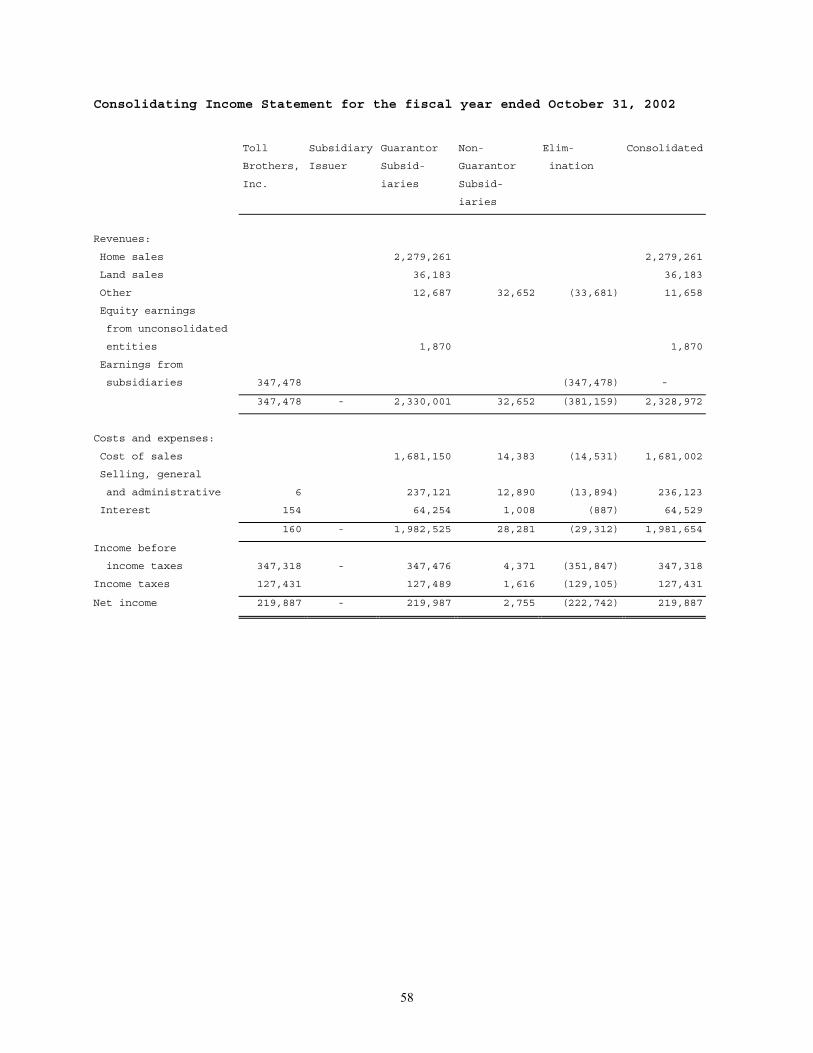
58
Consolidating Income Statement for the fiscal year ended October 31, 2002
Toll Subsidiary Guarantor Non- Elim- Consolidated
Brothers, Issuer Subsid- Guarantor ination
Inc. iaries Subsid-
iaries
Revenues:
Home sales 2,279,261 2,279,261
Land sales 36,183 36,183
Other 12,687 32,652 (33,681) 11,658
Equity earnings
from unconsolidated
entities 1,870 1,870
Earnings from
subsidiaries 347,478 (347,478) -
347,478 - 2,330,001 32,652 (381,159) 2,328,972
Costs and expenses:
Cost of sales 1,681,150 14,383 (14,531) 1,681,002
Selling, general
and administrative 6 237,121 12,890 (13,894) 236,123
Interest 154 64,254 1,008 (887) 64,529
160 - 1,982,525 28,281 (29,312) 1,981,654
Income before
income taxes 347,318 - 347,476 4,371 (351,847) 347,318
Income taxes 127,431 127,489 1,616 (129,105) 127,431
Net income 219,887 - 219,987 2,755 (222,742) 219,887
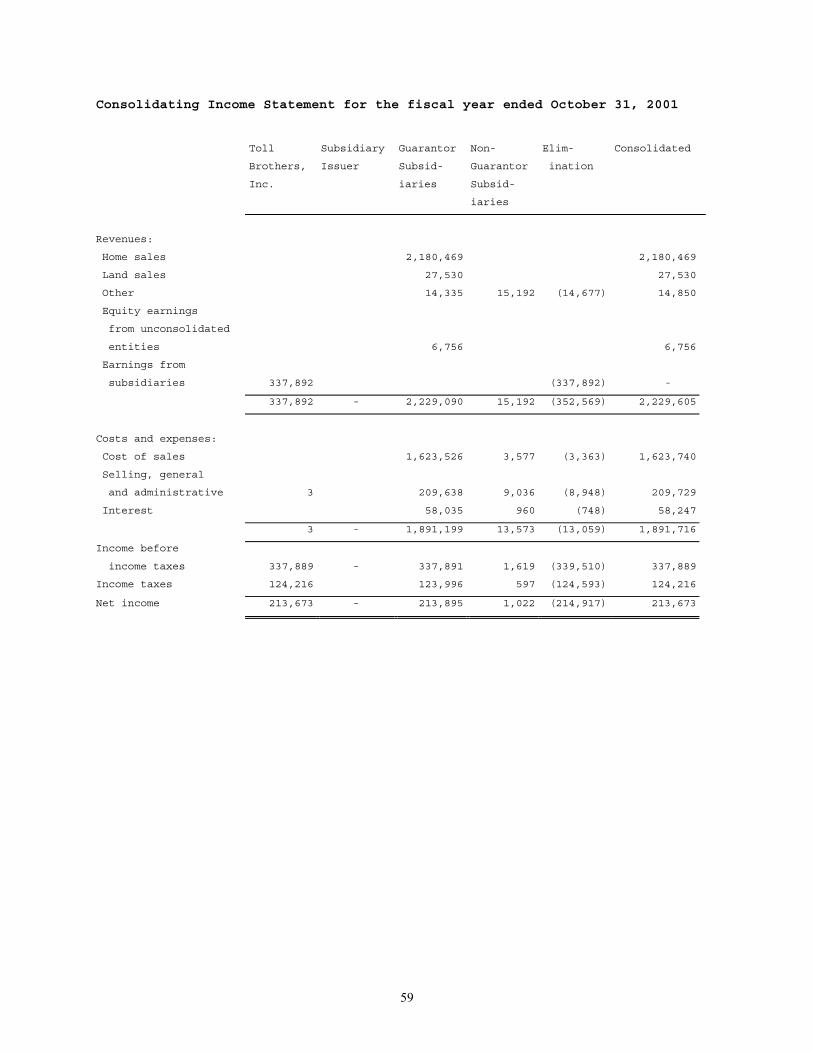
59
Consolidating Income Statement for the fiscal year ended October 31, 2001
Toll Subsidiary Guarantor Non- Elim- Consolidated
Brothers, Issuer Subsid- Guarantor ination
Inc. iaries Subsid-
iaries
Revenues:
Home sales 2,180,469 2,180,469
Land sales 27,530 27,530
Other 14,335 15,192 (14,677) 14,850
Equity earnings
from unconsolidated
entities 6,756 6,756
Earnings from
subsidiaries 337,892 (337,892) -
337,892 - 2,229,090 15,192 (352,569) 2,229,605
Costs and expenses:
Cost of sales 1,623,526 3,577 (3,363) 1,623,740
Selling, general
and administrative 3 209,638 9,036 (8,948) 209,729
Interest 58,035 960 (748) 58,247
3 - 1,891,199 13,573 (13,059) 1,891,716
Income before
income taxes 337,889 - 337,891 1,619 (339,510) 337,889
Income taxes 124,216 123,996 597 (124,593) 124,216
Net income 213,673 - 213,895 1,022 (214,917) 213,673
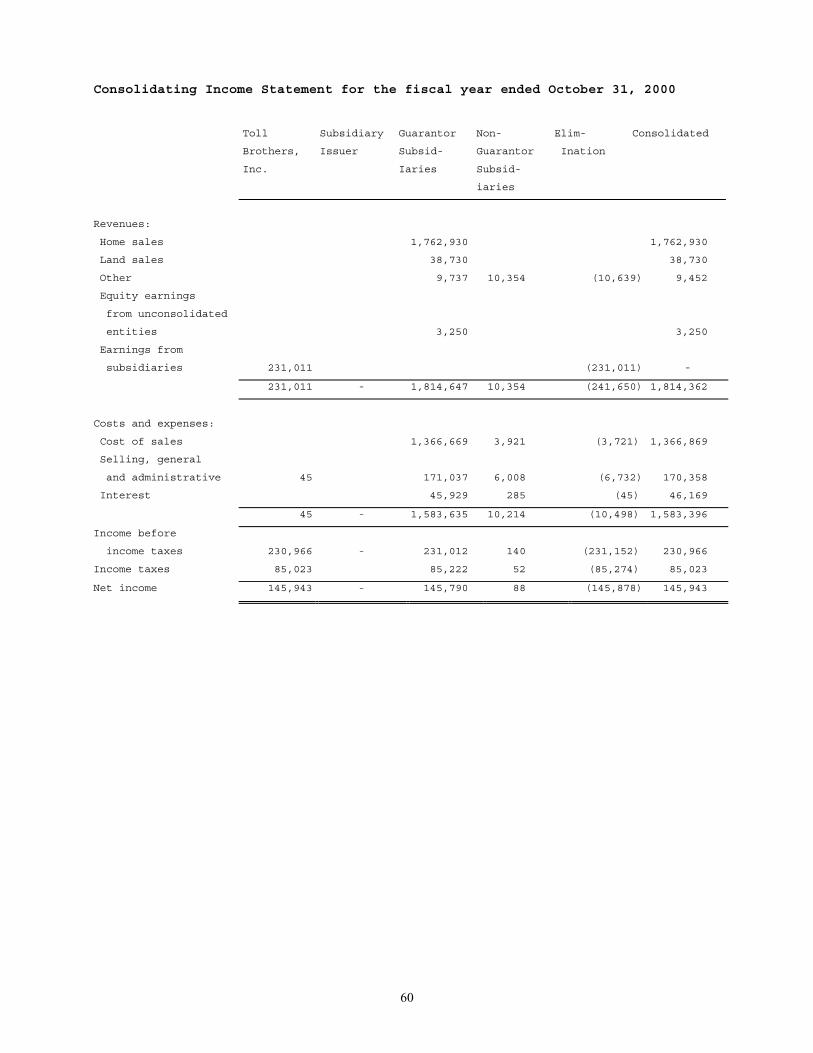
60
Consolidating Income Statement for the fiscal year ended October 31, 2000
Toll Subsidiary Guarantor Non- Elim- Consolidated
Brothers, Issuer Subsid- Guarantor Ination
Inc. Iaries Subsid-
iaries
Revenues:
Home sales 1,762,930 1,762,930
Land sales 38,730 38,730
Other 9,737 10,354 (10,639) 9,452
Equity earnings
from unconsolidated
entities 3,250 3,250
Earnings from
subsidiaries 231,011 (231,011) -
231,011 - 1,814,647 10,354 (241,650) 1,814,362
Costs and expenses:
Cost of sales 1,366,669 3,921 (3,721) 1,366,869
Selling, general
and administrative 45 171,037 6,008 (6,732) 170,358
Interest 45,929 285 (45) 46,169
45 - 1,583,635 10,214 (10,498) 1,583,396
Income before
income taxes 230,966 - 231,012 140 (231,152) 230,966
Income taxes 85,023 85,222 52 (85,274) 85,023
Net income 145,943 - 145,790 88 (145,878) 145,943
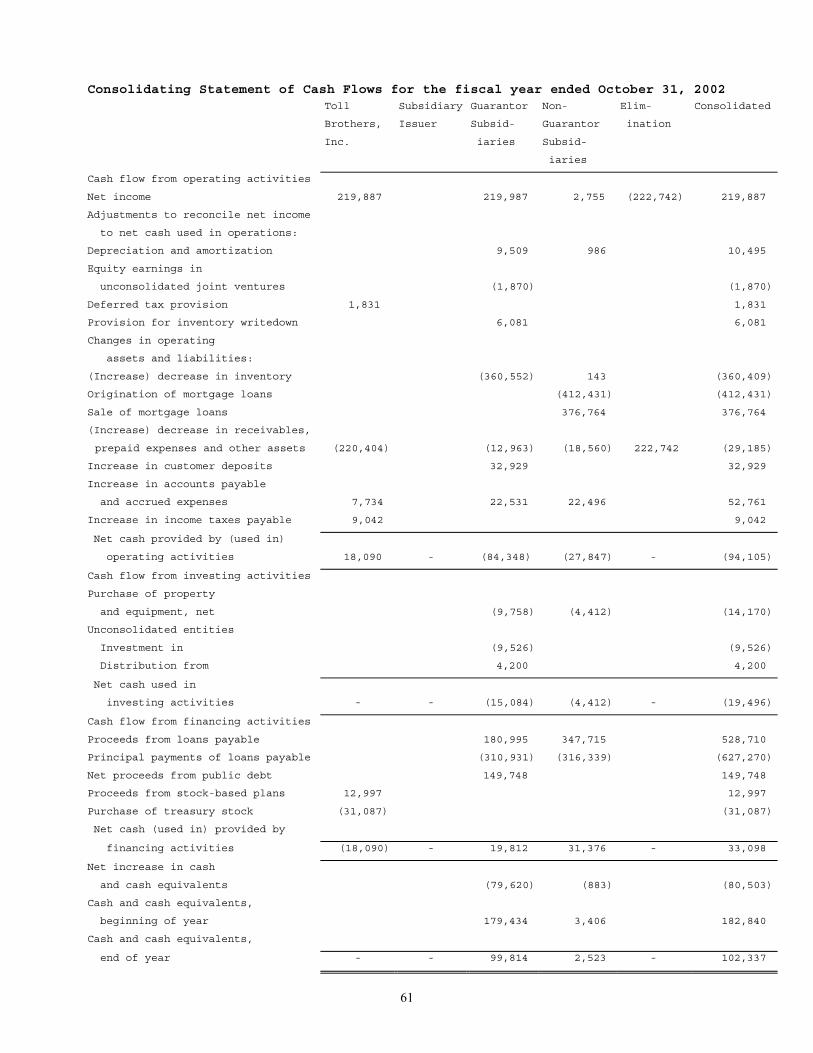
61
Consolidating Statement of Cash Flows for the fiscal year ended October 31, 2002Toll Subsidiary Guarantor Non- Elim- Consolidated
Brothers, Issuer Subsid- Guarantor ination
Inc. iaries Subsid-
iaries
Cash flow from operating activities
Net income 219,887 219,987 2,755 (222,742) 219,887
Adjustments to reconcile net income
to net cash used in operations:
Depreciation and amortization 9,509 986 10,495
Equity earnings in
unconsolidated joint ventures (1,870) (1,870)
Deferred tax provision 1,831 1,831
Provision for inventory writedown 6,081 6,081
Changes in operating
assets and liabilities:
(Increase) decrease in inventory (360,552) 143 (360,409)
Origination of mortgage loans (412,431) (412,431)
Sale of mortgage loans 376,764 376,764
(Increase) decrease in receivables,
prepaid expenses and other assets (220,404) (12,963) (18,560) 222,742 (29,185)
Increase in customer deposits 32,929 32,929
Increase in accounts payable
and accrued expenses 7,734 22,531 22,496 52,761
Increase in income taxes payable 9,042 9,042
Net cash provided by (used in)
operating activities 18,090 - (84,348) (27,847) - (94,105)
Cash flow from investing activities
Purchase of property
and equipment, net (9,758) (4,412) (14,170)
Unconsolidated entities
Investment in (9,526) (9,526)
Distribution from 4,200 4,200
Net cash used in
investing activities - - (15,084) (4,412) - (19,496)
Cash flow from financing activities
Proceeds from loans payable 180,995 347,715 528,710
Principal payments of loans payable (310,931) (316,339) (627,270)
Net proceeds from public debt 149,748 149,748
Proceeds from stock-based plans 12,997 12,997
Purchase of treasury stock (31,087) (31,087)
Net cash (used in) provided by
financing activities (18,090) - 19,812 31,376 - 33,098
Net increase in cash
and cash equivalents (79,620) (883) (80,503)
Cash and cash equivalents,
beginning of year 179,434 3,406 182,840
Cash and cash equivalents,
end of year - - 99,814 2,523 - 102,337
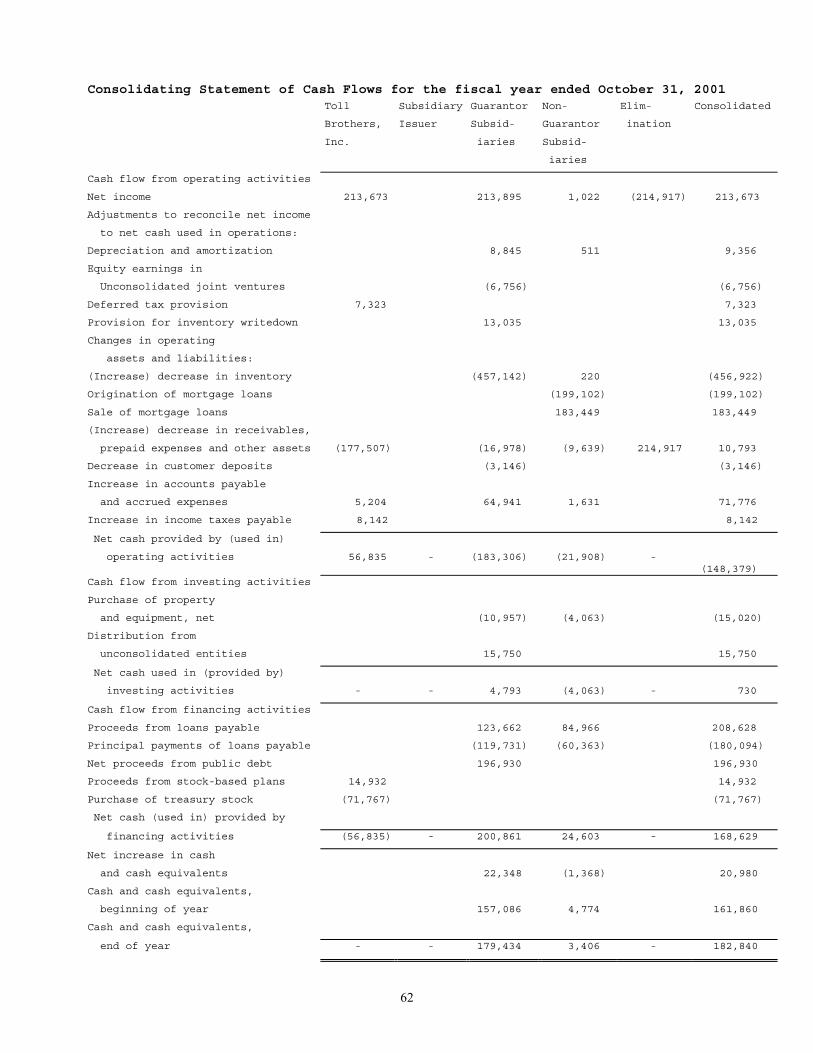
62
Consolidating Statement of Cash Flows for the fiscal year ended October 31, 2001Toll Subsidiary Guarantor Non- Elim- Consolidated
Brothers, Issuer Subsid- Guarantor ination
Inc. iaries Subsid-
iaries
Cash flow from operating activities
Net income 213,673 213,895 1,022 (214,917) 213,673
Adjustments to reconcile net income
to net cash used in operations:
Depreciation and amortization 8,845 511 9,356
Equity earnings in
Unconsolidated joint ventures (6,756) (6,756)
Deferred tax provision 7,323 7,323
Provision for inventory writedown 13,035 13,035
Changes in operating
assets and liabilities:
(Increase) decrease in inventory (457,142) 220 (456,922)
Origination of mortgage loans (199,102) (199,102)
Sale of mortgage loans 183,449 183,449
(Increase) decrease in receivables,
prepaid expenses and other assets (177,507) (16,978) (9,639) 214,917 10,793
Decrease in customer deposits (3,146) (3,146)
Increase in accounts payable
and accrued expenses 5,204 64,941 1,631 71,776
Increase in income taxes payable 8,142 8,142
Net cash provided by (used in)
operating activities 56,835 - (183,306) (21,908) -(148,379)
Cash flow from investing activities
Purchase of property
and equipment, net (10,957) (4,063) (15,020)
Distribution from
unconsolidated entities 15,750 15,750
Net cash used in (provided by)
investing activities - - 4,793 (4,063) - 730
Cash flow from financing activities
Proceeds from loans payable 123,662 84,966 208,628
Principal payments of loans payable (119,731) (60,363) (180,094)
Net proceeds from public debt 196,930 196,930
Proceeds from stock-based plans 14,932 14,932
Purchase of treasury stock (71,767) (71,767)
Net cash (used in) provided by
financing activities (56,835) - 200,861 24,603 - 168,629
Net increase in cash
and cash equivalents 22,348 (1,368) 20,980
Cash and cash equivalents,
beginning of year 157,086 4,774 161,860
Cash and cash equivalents,
end of year - - 179,434 3,406 - 182,840
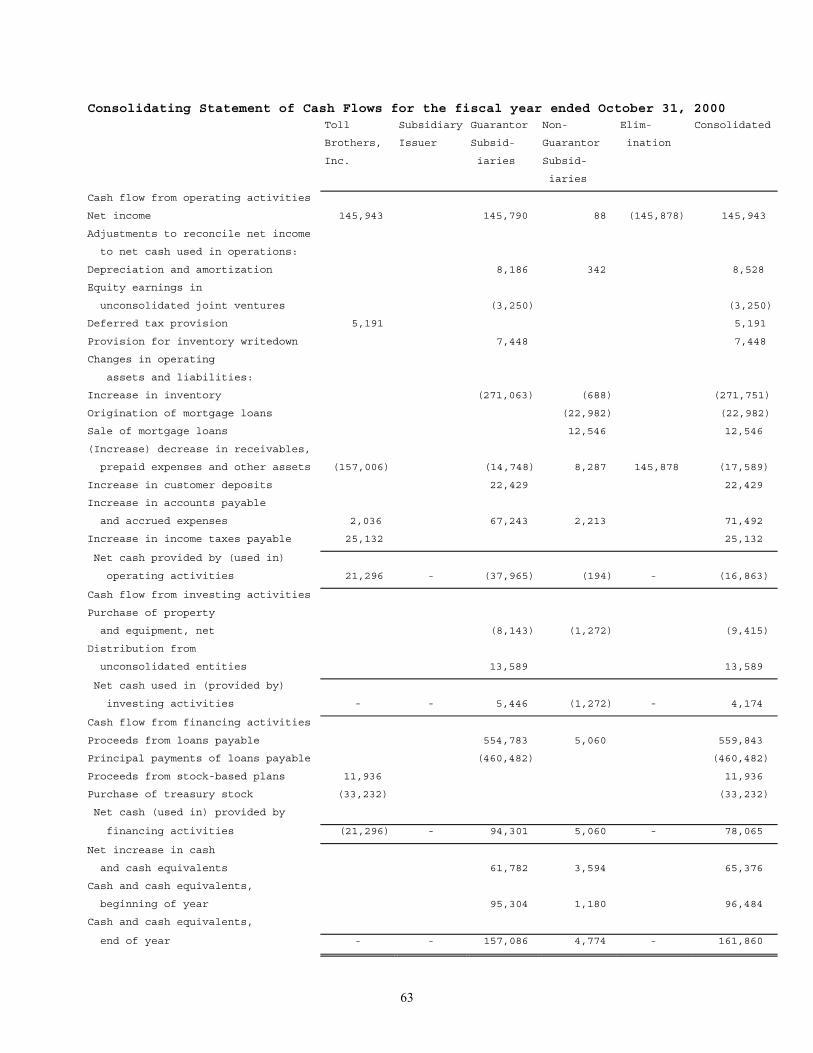
63
Consolidating Statement of Cash Flows for the fiscal year ended October 31, 2000Toll Subsidiary Guarantor Non- Elim- Consolidated
Brothers, Issuer Subsid- Guarantor ination
Inc. iaries Subsid-
iaries
Cash flow from operating activities
Net income 145,943 145,790 88 (145,878) 145,943
Adjustments to reconcile net income
to net cash used in operations:
Depreciation and amortization 8,186 342 8,528
Equity earnings in
unconsolidated joint ventures (3,250) (3,250)
Deferred tax provision 5,191 5,191
Provision for inventory writedown 7,448 7,448
Changes in operating
assets and liabilities:
Increase in inventory (271,063) (688) (271,751)
Origination of mortgage loans (22,982) (22,982)
Sale of mortgage loans 12,546 12,546
(Increase) decrease in receivables,
prepaid expenses and other assets (157,006) (14,748) 8,287 145,878 (17,589)
Increase in customer deposits 22,429 22,429
Increase in accounts payable
and accrued expenses 2,036 67,243 2,213 71,492
Increase in income taxes payable 25,132 25,132
Net cash provided by (used in)
operating activities 21,296 - (37,965) (194) - (16,863)
Cash flow from investing activities
Purchase of property
and equipment, net (8,143) (1,272) (9,415)
Distribution from
unconsolidated entities 13,589 13,589
Net cash used in (provided by)
investing activities - - 5,446 (1,272) - 4,174
Cash flow from financing activities
Proceeds from loans payable 554,783 5,060 559,843
Principal payments of loans payable (460,482) (460,482)
Proceeds from stock-based plans 11,936 11,936
Purchase of treasury stock (33,232) (33,232)
Net cash (used in) provided by
financing activities (21,296) - 94,301 5,060 - 78,065
Net increase in cash
and cash equivalents 61,782 3,594 65,376
Cash and cash equivalents,
beginning of year 95,304 1,180 96,484
Cash and cash equivalents,
end of year - - 157,086 4,774 - 161,860

64
Summary Consolidated Quarterly Financial Data (Unaudited)(Amounts in thousands, except per share data)
Three months ended
Oct. 31 July 31 April 30 Jan. 31
Fiscal 2002:
Revenue $705,590 $580,707 $550,496 $492,179
Gross profit $192,433 $162,103 $156,897 $136,537
Income before income taxes $109,905 $84,603 $82,826 $69,984
Net Income $69,383 $53,500 $52,510 $44,494
Earnings per share*
Basic $0.99 $0.76 $0.74 $0.63
Diluted $0.93 $0.70 $0.69 $0.60
Weighted average number*
of shares
Basic 70,204 70,835 70,849 70,001
Diluted 74,752 76,685 76,237 74,244
Fiscal 2001:
Revenue $655,752 $584,068 $514,524 $475,261
Gross profit $182,759 $164,239 $136,959 $121,908
Income before income taxes $108,183 $94,160 $72,351 $63,195
Net Income $68,526 $59,444 $45,778 $39,925
Earnings per share*
Basic $0.98 $0.83 $0.63 $0.55
Diluted $0.92 $0.77 $0.58 $0.51
Weighted average number*
of shares
Basic 69,820 71,677 72,857 72,326
Diluted 74,661 77,413 78,564 78,830
* Due to rounding, the sum of the quarterly earnings per share amounts maynot equal the reported earnings per share for the year. Share and per shareamounts have been adjusted for a two-for-one stock split in March 2002.
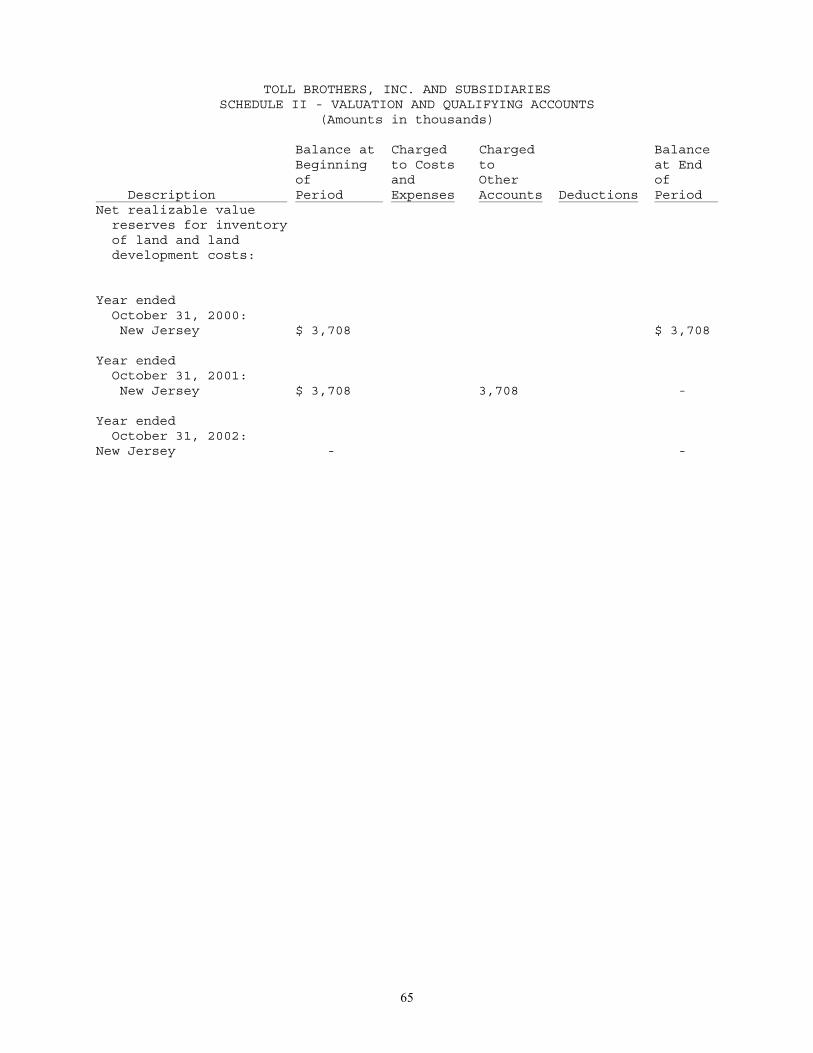
65
TOLL BROTHERS, INC. AND SUBSIDIARIESSCHEDULE II - VALUATION AND QUALIFYING ACCOUNTS
(Amounts in thousands)
Balance at Charged Charged Balance Beginning to Costs to at End of and Other of Description Period Expenses Accounts Deductions Period Net realizable value reserves for inventory of land and land development costs:
Year ended October 31, 2000: New Jersey $ 3,708 $ 3,708
Year ended October 31, 2001: New Jersey $ 3,708 3,708 -
Year ended October 31, 2002:New Jersey - -