Embed Size (px)
Citation preview
TENNANT COMPANYEarnings Release Conference Call
Second Quarter 2015
Thursday, July 23, 2015
1

Chris KillingstadPresident and CEO
Tom PaulsonSenior VP, CFO
2
TENNANT COMPANY
ON THE CALL TODAY
Our remarks this morning and our answers to questions may contain forward-looking statements regarding the company’s expectations of future performance. Such statements are subject to risks and uncertainties, and our actual results may differ materially from those contained in the statements. These risks and uncertainties are described in today’s news release and the documents we file with the Securities and Exchange Commission. We encourage you to review those documents, particularly our Safe Harbor statement, for a description of the risks and uncertainties that may affect our results.
3
TENNANT COMPANY
FORWARD LOOKING STATEMENTS

• Consolidated net sales of $215.4M– Nearly 4% organic growth over prior year quarter– Gross margins slightly above 44%– Earnings of 79 cents per diluted share
• Growth led by – Robust strategic account sales in North America– Continued demand for new products such as rider-
scrubbers for the industrial market– Bright spots in Brazil, Western Europe and China
4
TENNANT COMPANY
SECOND QUARTER 2015 SALES

On track to reach organic growth goal of $1 Billion and remain committed to 12% or above OP margin
5
TENNANT COMPANY
STRATEGIC OVERVIEW

• People
– 270 new positions primarily in sales, service & manufacturing during 2013-2014
• Technology-based initiatives
– Customer Relationship Management (CRM)
– “My Tennant” portal supports e-commerce
– IRIS® telemetry asset management system
6
TENNANT COMPANY
NEW MARKETS & CUSTOMERS
7
TENNANT COMPANY
NEW PRODUCTS
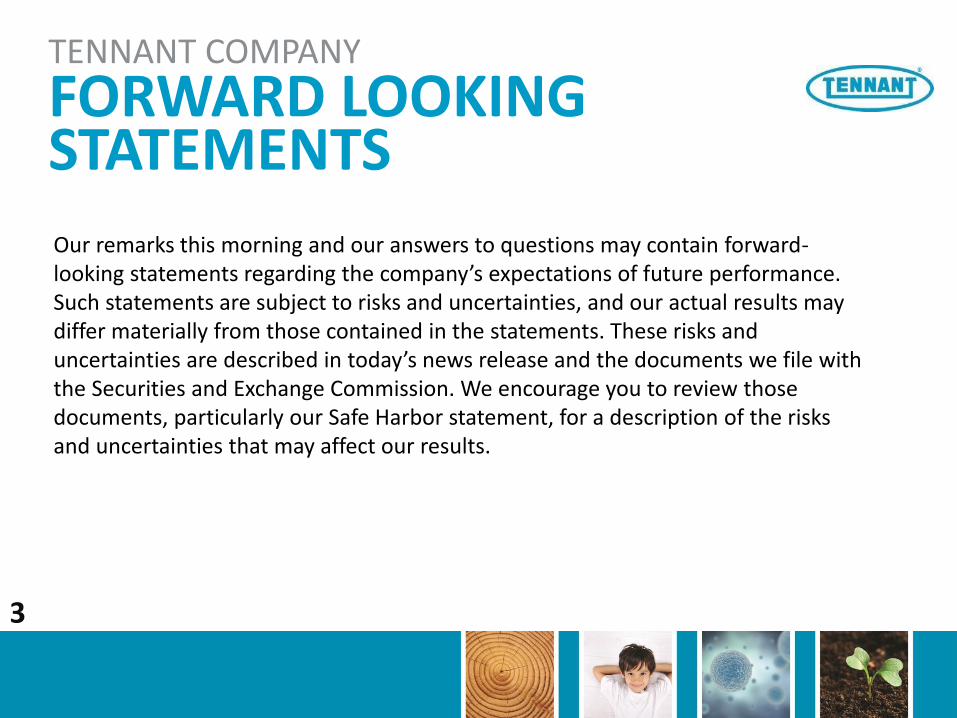
• 33 New Products and Product Variants in 2015 first half
• T300 Walk-Behind Scrubber with ec-H2O NanoClean® technology
T300
How it works:

8

Small, simple, affordable On-Site
Generation (OSG) technology • Generates both cleaning and
antimicrobial solutions
• Fits into most janitorial closets
• Flexibility to dispense in remote locations
9
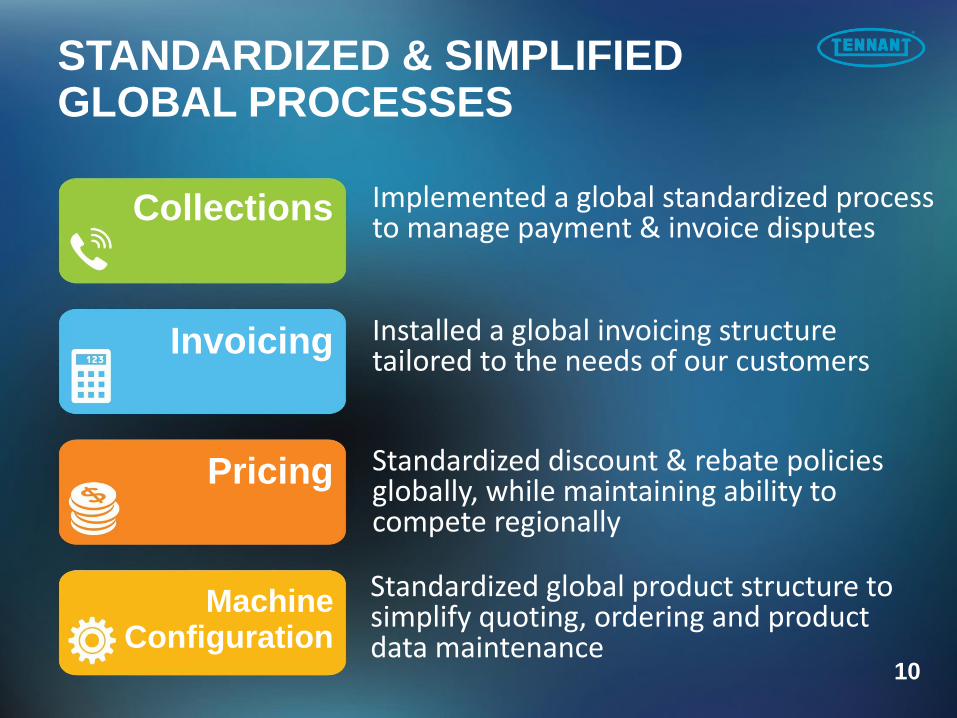
Collections
Invoicing
Pricing
MachineConfiguration
Installed a global invoicing structure tailored to the needs of our customers
Implemented a global standardized process to manage payment & invoice disputes
Standardized discount & rebate policies globally, while maintaining ability to compete regionally
Standardized global product structure to simplify quoting, ordering and product data maintenance
STANDARDIZED & SIMPLIFIEDGLOBAL PROCESSES
10
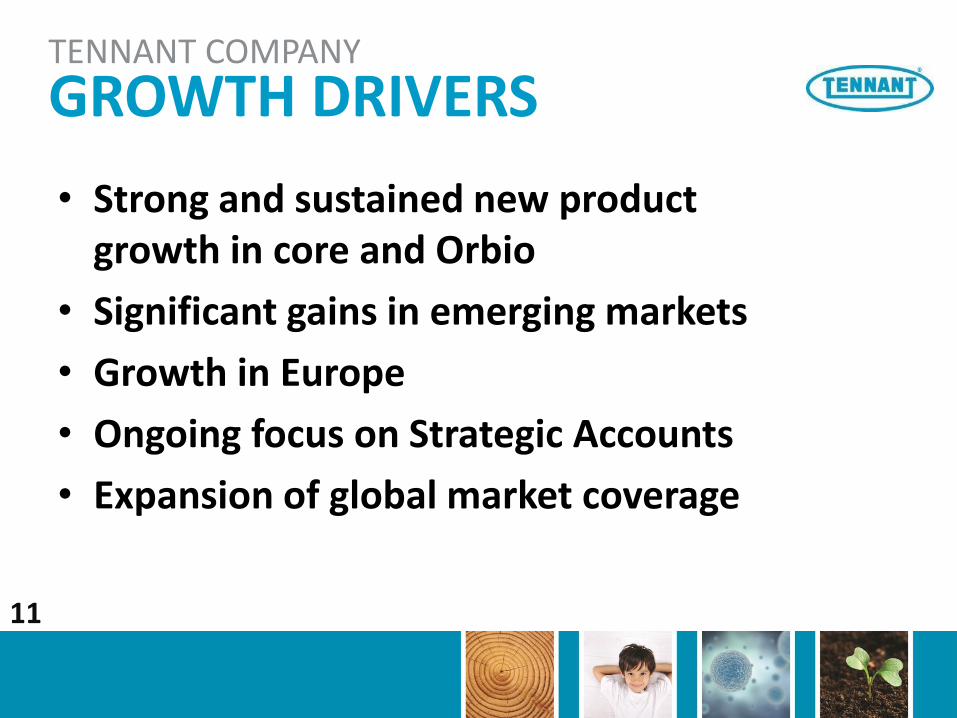
• Strong and sustained new product growth in core and Orbio
• Significant gains in emerging markets
• Growth in Europe
• Ongoing focus on Strategic Accounts
• Expansion of global market coverage
11
TENNANT COMPANY
GROWTH DRIVERS

12
13
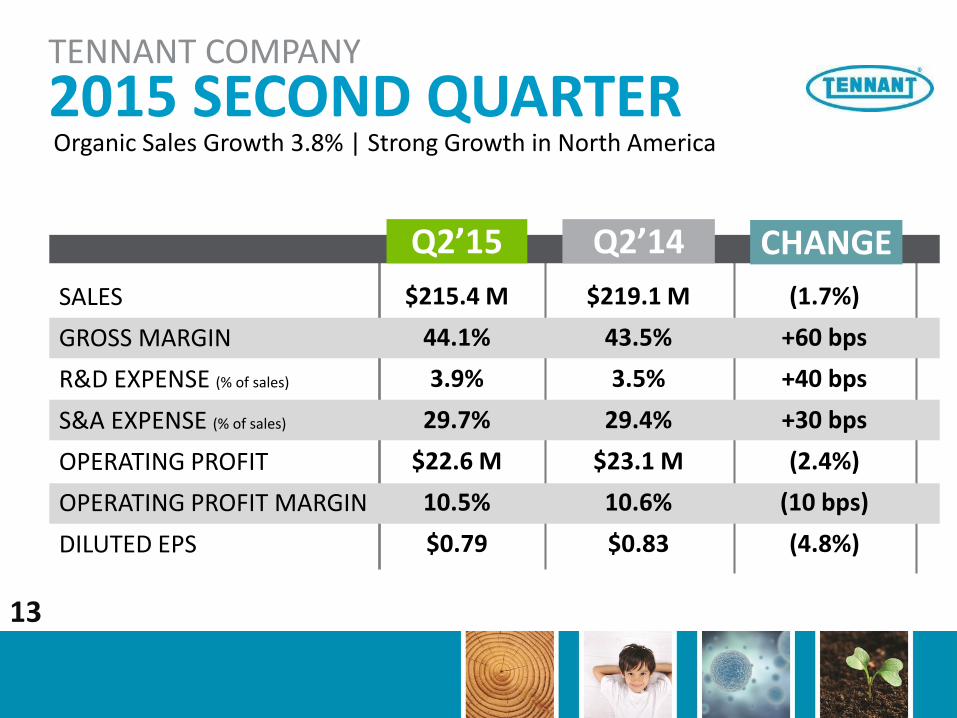
SALES
GROSS MARGIN
R&D EXPENSE (% of sales)
S&A EXPENSE (% of sales)
OPERATING PROFIT
OPERATING PROFIT MARGIN
DILUTED EPS
Q2’15 Q2’14 CHANGE
$215.4 M
44.1%
3.9%
29.7%
$22.6 M
10.5%
$0.79
$219.1 M
43.5%
3.5%
29.4%
$23.1 M
10.6%
$0.83
(1.7%)
+60 bps
+40 bps
+30 bps
(2.4%)
(10 bps)
(4.8%)
TENNANT COMPANY
2015 SECOND QUARTEROrganic Sales Growth 3.8% | Strong Growth in North America
14
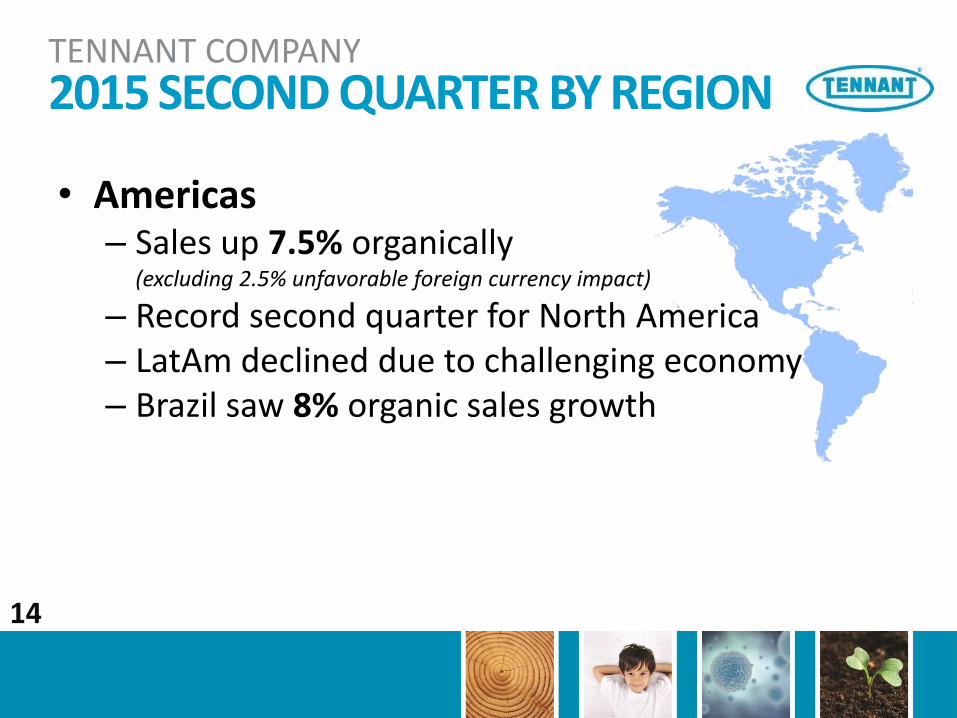
TENNANT COMPANY2015 SECOND QUARTER BY REGION
• Americas– Sales up 7.5% organically
(excluding 2.5% unfavorable foreign currency impact)
– Record second quarter for North America– LatAm declined due to challenging economy– Brazil saw 8% organic sales growth
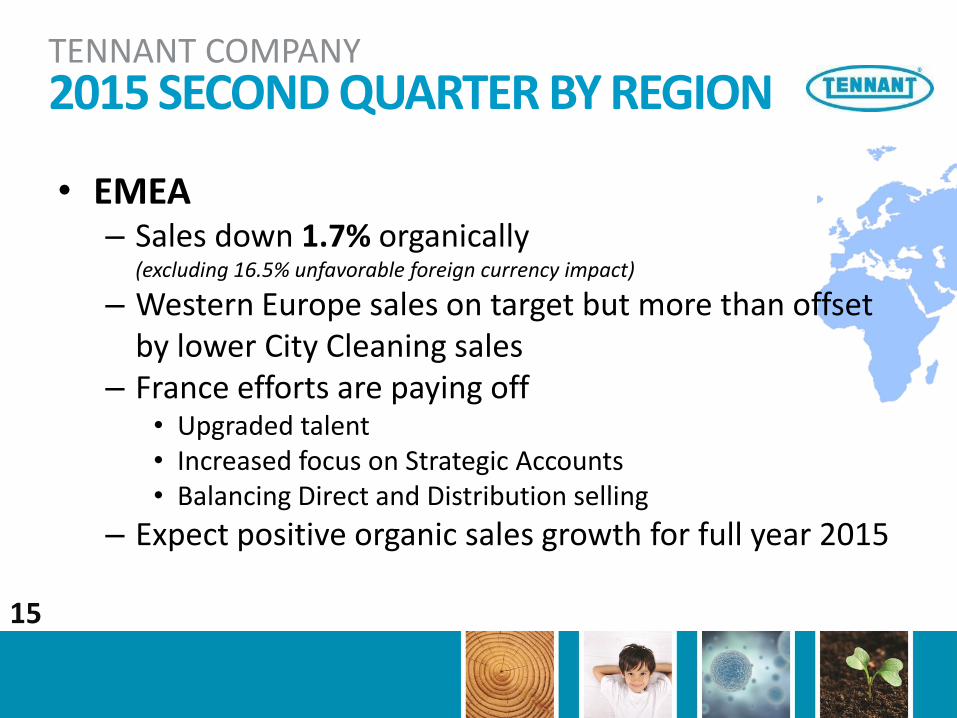
• EMEA– Sales down 1.7% organically
(excluding 16.5% unfavorable foreign currency impact)
– Western Europe sales on target but more than offset by lower City Cleaning sales
– France efforts are paying off• Upgraded talent• Increased focus on Strategic Accounts• Balancing Direct and Distribution selling
– Expect positive organic sales growth for full year 2015
15
TENNANT COMPANY2015 SECOND QUARTER BY REGION

• APAC– Sales down 8.1% organically
(excluding 8% unfavorable foreign currency impact)
– China organic sales up 15%– Slower economies in other APAC regions, primarily
Australia– Expect positive organic sales growth for full year
2015
16
TENNANT COMPANY2015 SECOND QUARTER BY REGION

17
SALES
GROSS MARGIN
R&D EXPENSE (% of sales)
S&A EXPENSE (% of sales)
OPERATING PROFIT
OPERATING PROFIT MARGIN
DILUTED EPS
Q2’15 Q2’14 CHANGE
$215.4 M
44.1%
3.9%
29.7%
$22.6 M
10.5%
$0.79
$219.1 M
43.5%
3.5%
29.4%
$23.1 M
10.6%
$0.83
(1.7%)
+60 bps
+40 bps
+30 bps
(2.4%)
(10 bps)
(4.8%)
TENNANT COMPANY
2015 SECOND QUARTEROrganic Sales Growth 3.8% | Strong Growth in North America

18
SALES
GROSS MARGIN
OPERATING PROFIT
OPERATING PROFIT MARGIN
DILUTED EPS
Q2’15 Q2’14 CHANGE
$227.4 M
44.9%
$26.0 M
11.4%
$0.92
$219.1 M
43.5%
$23.1 M
10.6%
$0.83
+3.8%
+140 bps
+12.2%
+80 bps
+10.8%
TENNANT COMPANY
2015 SECOND QUARTER“CONSTANT CURRENCY” VIEW (excludes estimated foreign exchange impact)
CONSTANT(1)
CURRENCY
Q2’15
AS REPORTED
$215.4 M
44.1%
$22.6 M
10.5%
$0.79
(1)“Constant Currency”: estimated income statement which assumes no change in exchange rates from prior year.

• Remain committed to at least 12% OP margin – Drive organic revenue growth in mid- to high-single digits– Hold fixed costs essentially flat in manufacturing as
volume rises– Strive for zero net inflation at gross profit line– Standardize and simplify processes to improve scalability
of business model
19
TENNANT COMPANY
OPERATING PROFIT MARGIN GOAL

• Overall effective tax rate for 2015 first half of 32.1%
• Base tax rate of 31.9%(excluding routine discrete items)
• No benefit in first half for Federal R&D tax credit – not yet re-enacted for 2015
20
TENNANT COMPANYSUCCESSFUL TAX STRATEGIES

21
TENNANT COMPANYSTRONG BALANCE SHEET
COMMITMENT TO SHAREHOLDER RETURN
1H’15
22
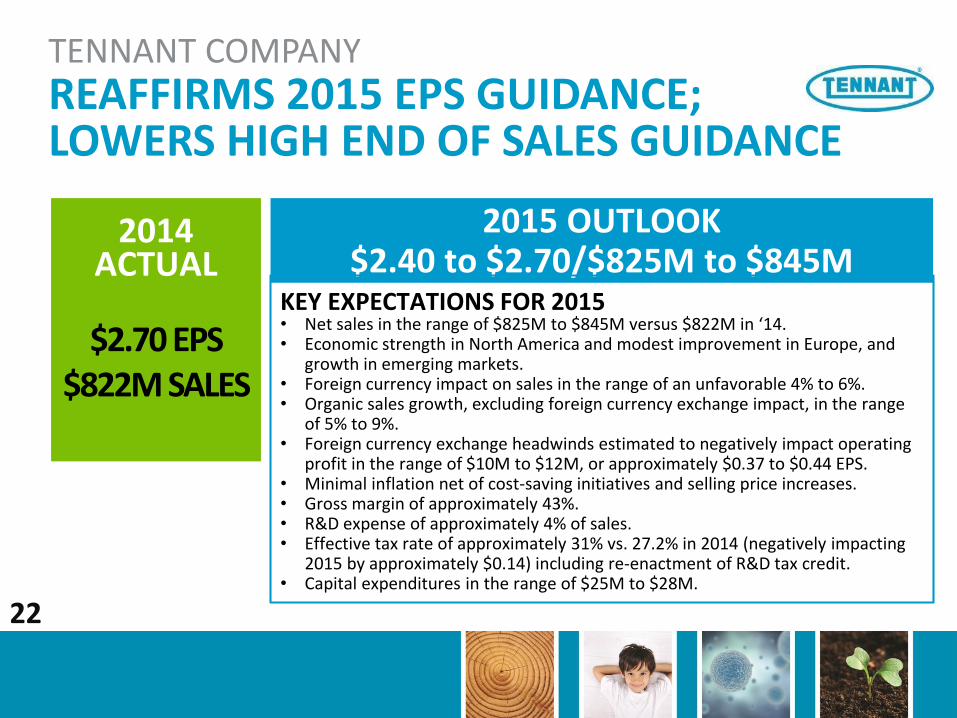
TENNANT COMPANYREAFFIRMS 2015 EPS GUIDANCE;LOWERS HIGH END OF SALES GUIDANCE
2014ACTUAL
$2.70 EPS $822M SALES
2015 OUTLOOK$2.40 to $2.70/$825M to $845M
KEY EXPECTATIONS FOR 2015• Net sales in the range of $825M to $845M versus $822M in ‘14.• Economic strength in North America and modest improvement in Europe, and
growth in emerging markets.• Foreign currency impact on sales in the range of an unfavorable 4% to 6%.• Organic sales growth, excluding foreign currency exchange impact, in the range
of 5% to 9%.• Foreign currency exchange headwinds estimated to negatively impact operating
profit in the range of $10M to $12M, or approximately $0.37 to $0.44 EPS.• Minimal inflation net of cost-saving initiatives and selling price increases.• Gross margin of approximately 43%. • R&D expense of approximately 4% of sales.• Effective tax rate of approximately 31% vs. 27.2% in 2014 (negatively impacting
2015 by approximately $0.14) including re-enactment of R&D tax credit.• Capital expenditures in the range of $25M to $28M.

QUESTIONS?
23

• Growth strategies are working
• Organic sales grew 5% in 2015 first half
• We remain on track to reach our organic growth goal of $1 billion in sales by 2017
• We remain committed to the goal of a 12% or above operating profit margin
• Will update you in October with third quarter results
24
TENNANT COMPANY
SUMMARY
THANK YOU