Embed Size (px)
Citation preview

ANALYSIS OF TWITTER MESSAGES FOR
SENTIMENT AND INSIGHT FOR USE IN STOCK
MARKET DECISION MAKING
ERIC D. BROWN
DOCTORAL DISSERTATION FINAL DEFENSE

AGENDA
• Introduction
• Previous Research
• Research Summary
• Research Model
• Research Methodology
• Data Analysis
• Research Findings
• Conclusions & Future Research
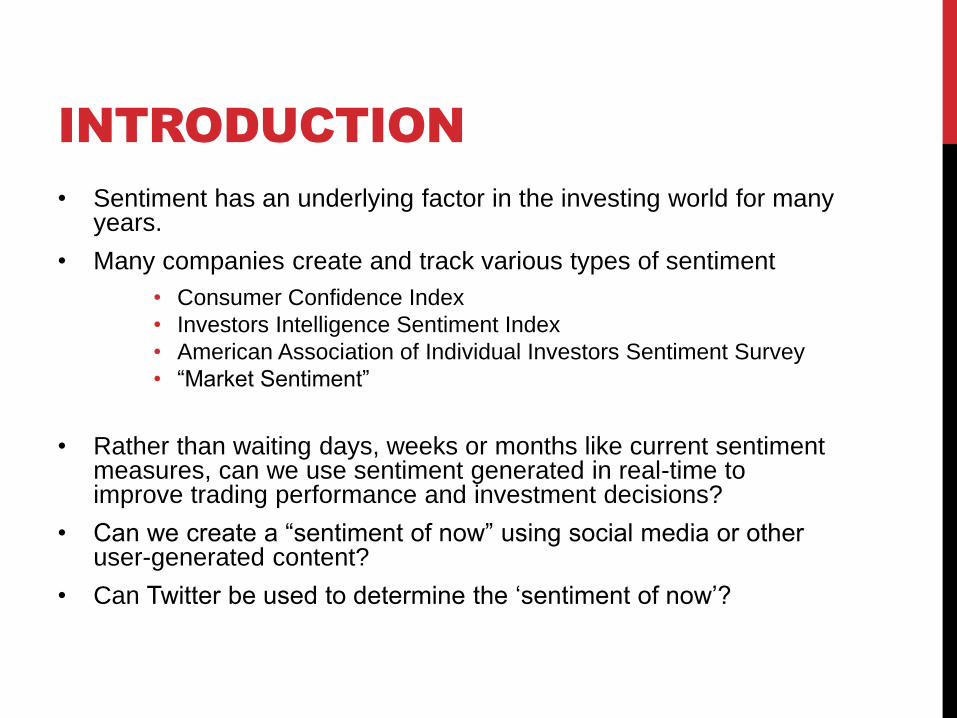
INTRODUCTION
• Sentiment has an underlying factor in the investing world for many years.
• Many companies create and track various types of sentiment
• Consumer Confidence Index
• Investors Intelligence Sentiment Index
• American Association of Individual Investors Sentiment Survey
• “Market Sentiment”
• Rather than waiting days, weeks or months like current sentiment measures, can we use sentiment generated in real-time to improve trading performance and investment decisions?
• Can we create a “sentiment of now” using social media or other user-generated content?
• Can Twitter be used to determine the ‘sentiment of now’?

INTRODUCTION
• The goal of this study was to gain a more thorough
understanding of Twitter content and the users that create it.
• Can a Tweet convey sentiment with only 140 characters
available?
• If Tweets do convey some form of sentiment can this sentiment
be used in a predictive manner?
• Can this Twitter content and users be ‘tapped’ to build
methodology that identifies and evaluates likely investment
opportunities?

PREVIOUS RESEARCH
• Wysoki (1998) – Found a strong positive correlation between volume of messages posted on message boards overnight and next day’s trading volume and stock returns.
• Tumarkin and Whitelaw (2001) – Concluded that there are no predictive capabilities found within message board activity.
• Antweiler and Frank (2004) – Used sentiment analysis to show strong positive correlation between message board posts and next day trading volume and volatility. Showed minor correlation between message board posts and next day price activity.

PREVIOUS RESEARCH
• Gu, et al (2006) – Found that aggregation of individual recommendations on stock message boards have no predictive power on future stock returns.
• Das and Chen (2007) – Using sentiment analysis of messages on message boards, found no correlation between sentiment and individual stock price movement but did find positive correlation of the aggregate sentiment of a set of aggregate stocks and movement in the stock market.
• Zhang (2009) – Studied the reputation of a message board poster and showed that a ‘better’ reputation was shared more widely and had a larger effect on sentiment.
PREVIOUS RESEARCH
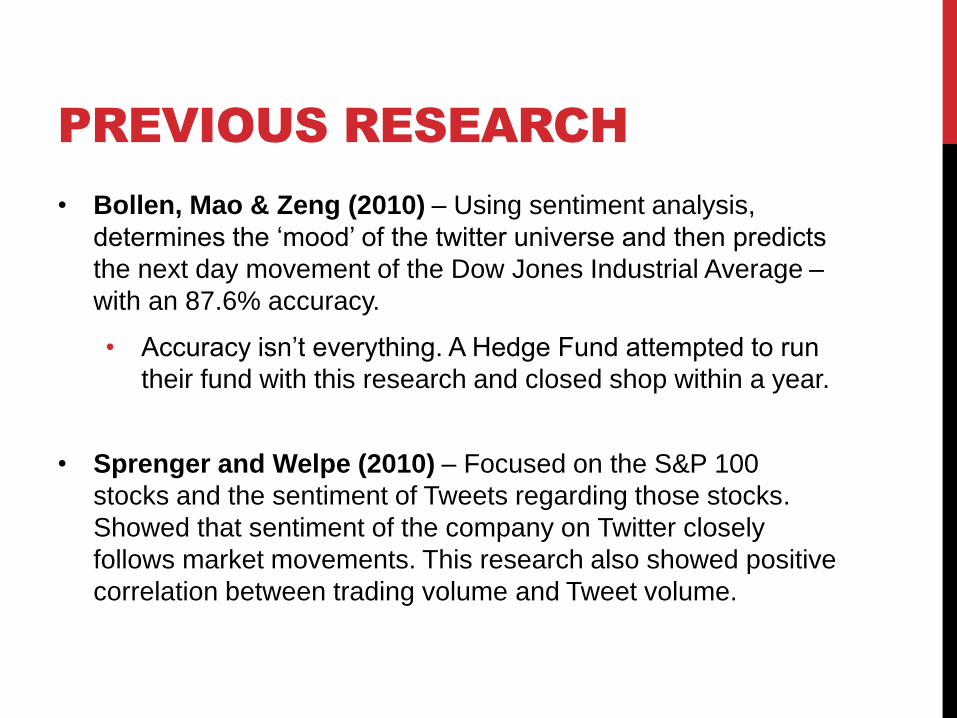
• Bollen, Mao & Zeng (2010) – Using sentiment analysis,
determines the ‘mood’ of the twitter universe and then predicts
the next day movement of the Dow Jones Industrial Average –
with an 87.6% accuracy.
• Accuracy isn’t everything. A Hedge Fund attempted to run
their fund with this research and closed shop within a year.
• Sprenger and Welpe (2010) – Focused on the S&P 100
stocks and the sentiment of Tweets regarding those stocks.
Showed that sentiment of the company on Twitter closely
follows market movements. This research also showed positive
correlation between trading volume and Tweet volume.

PREVIOUS RESEARCH
Additional research in Sentiment Analysis of Twitter:
• Bifet & Frank, 2010 – Sentiment Knowledge Discovery in
Twitter Streaming Data.
• Pak & Paroubek, 2010 - Twitter as a Corpus for Sentiment
Analysis and Opinion Mining.
• Romero, Meeder, & Klienberg, 2010 - Differences in the
Mechanics of Information Diffusion Across Topics: Idioms,
Political Hashtags, and Complex Contagion on Twitter
• Castillo, Mendoza & Poblete, 2010 – Information Credibility
on Twitter.
• Diakopoulos & Shamma, 2010 – Characterizing Debate
Performance via Aggregated Twitter Sentiment.

RESEARCH SUMMARY
The main questions driving this study were:
• Can analysis of publicly available Tweets provide insight for investing decisions?
• Do Tweets (and their subsequent sentiment) have any effect on movement in the stock market?
• Can Tweets be mined and analyzed to predict daily movements in the stock market?
• Does a Twitter user’s reputation have an effect on how people perceive and use their shared investing ideas?

RESEARCH SUMMARY
To address those main drivers, the following research questions were developed:
• RQ-1: Using a given sector of the stock market, does the sentiment for that sector match the aggregated sentiment for the stocks that make up that sector? How well does the sentiment predict price / volume movement?
• RQ-2: Are there specific stocks within a given sector that supply the majority of the sentiment for that sector? If so, do these stocks supply sentiment in correlation to the weighting given to them by ratings agencies (e.g., Standard & Poor’s)?
• RQ-3: Are there times of the day or days of the week that provide a more accurate and informative sentiment for a stock or sector?
• RQ-4: Are there specific users that provide more ‘weight’ to a sentiment of a stock or sector based on the users’ reputation?
RESEARCH SUMMARY
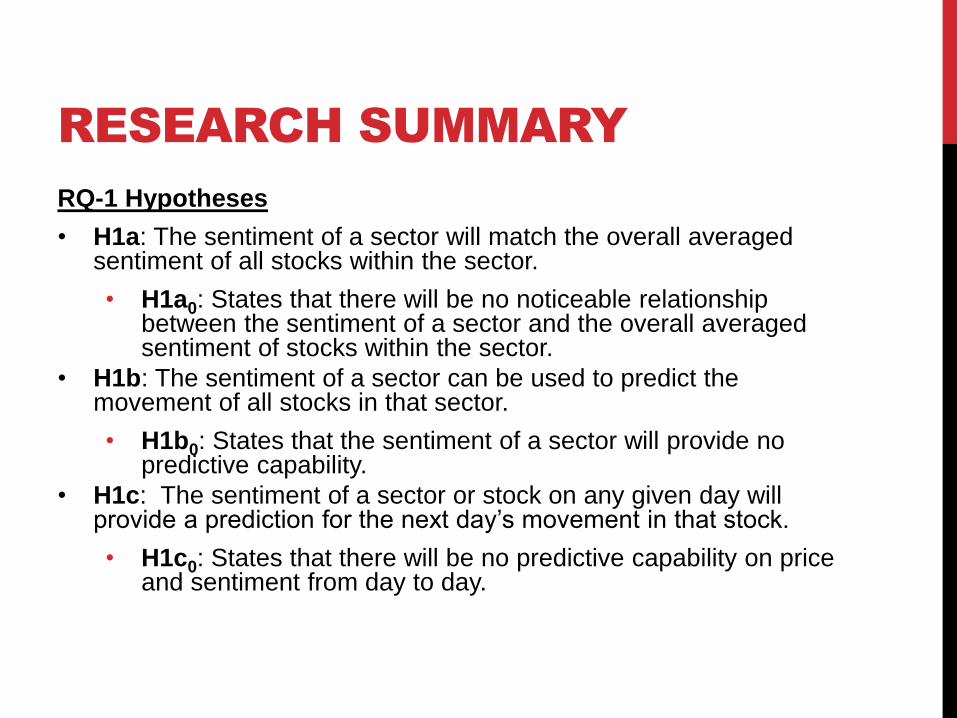
RQ-1 Hypotheses
• H1a: The sentiment of a sector will match the overall averaged sentiment of all stocks within the sector.
• H1a0: States that there will be no noticeable relationship between the sentiment of a sector and the overall averaged sentiment of stocks within the sector.
• H1b: The sentiment of a sector can be used to predict the movement of all stocks in that sector.
• H1b0: States that the sentiment of a sector will provide no predictive capability.
• H1c: The sentiment of a sector or stock on any given day will provide a prediction for the next day’s movement in that stock.
• H1c0: States that there will be no predictive capability on price and sentiment from day to day.

RESEARCH SUMMARY
RQ-2 Hypotheses
• H2a: The sentiment of a stock within a given sector will affect
the sentiment of the overall sector based on the relative market
cap weighting of that stock.
• H2a0: States that the sentiment of a stock is not correlated
with the market cap weighting of the stock in that sector.
• H2b: The stocks that provide the most weight toward the
sentiment of a sector are also the stocks with the highest
number of mentions on Twitter.
• H2b0: States that there is no relationship between the
number of mentions on Twitter and the affect that these
stocks have on the sector sentiment.

RESEARCH SUMMARY
RQ-3 Hypothesis
• H3: There is a difference in the effect that Tweets sent during
non-market hours (i.e., evenings and weekends) and Tweets
sent during market hours have on sentiment and price.
• H30: States that there is no difference in the effect of
Tweets during market hours and non-market hours.
RESEARCH SUMMARY
RQ-4 Hypothesis
• H4: The number of followers of a Twitter user determines the
effect that users’ Tweets will have on sentiment for a stock or
sector.
• H40: States that there is no relationship between the
number of followers and sentiment on a stock or sector.

RESEARCH SUMMARY
Mapping Hypothesis and Research Questions
Research Question Hypothesis
RQ-1: Using a given sector of the stock market, does the sentiment for that
sector match the aggregated sentiment for the stocks that make up that sector?
How well does the sentiment predict price / volume movement?
H1a, H1b, H1c
RQ-2: Are there specific stocks within a given sector that supply the majority of
the sentiment for that sector? If so, do these stocks supply sentiment in
correlation to the weighting give to them by ratings agencies (e.g., Standard &
Poor’s)?
H2a, H2b
RQ-3: Are there times of the day or days of the week that provide a more
accurate and informative sentiment for a stock or sector?
H3
RQ-4: Are there specific users that provide more ‘weight’ to a sentiment of a
stock or sector based on the users’ reputation?
H4
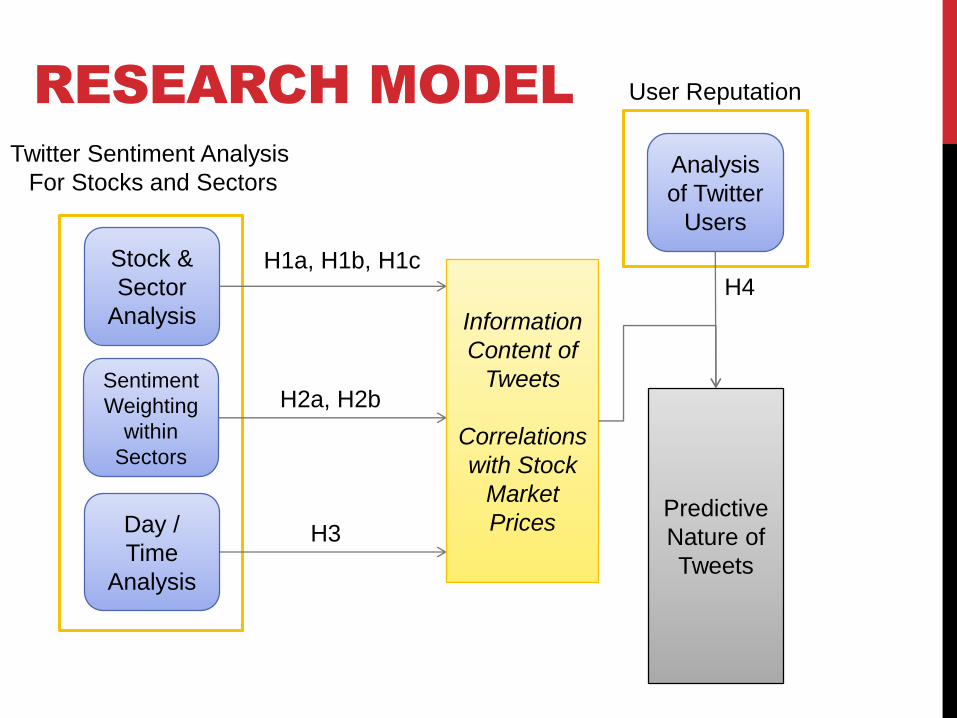
RESEARCH MODEL
Twitter Sentiment Analysis
For Stocks and Sectors
Stock &
Sector
Analysis
Sentiment
Weighting
within
Sectors
H1a, H1b, H1c
H2a, H2b
Day /
Time
Analysis
H3
Information
Content of
Tweets
Correlations
with Stock
Market
Prices
User Reputation
Analysis
of Twitter
Users
H4
Predictive
Nature of
Tweets

RESEARCH METHOD
Data
Collection
Sentiment
AnalysisUser
Analysis
Stock
Market
Data
Price
Analysis
Correlation of Twitter Sentiment
with Price
Reputation of
Twitter user
Understanding of predictive capabilities of Twitter Sentiment and the affect
of user reputation for investing decisions

RESEARCH
METHODOLOGY
Data Collection
• Twitter API to collect tweets (tweet, sender, date, time)
• Tweets referencing companies and sectors are collected and
stored in a MySQL database for future study
• Using the nomenclature made popular by StockTwits
(www.stocktwits.com). Example: The stock symbol for Apple
is AAPL. Users following the StockTwits nomenclature add a
“$” to the symbol – “$AAPL”.
• EODData.com market feed to gather Stock Market data (price
and volume)

RESEARCH
METHODOLOGY
Market Data
• This study reviewed the Energy (XLE) and Consumer Staples Sectors (XLP).
• Chosen to get different types of companies.
• Both have the same number of symbols in the sector.
• Used XLE and XLP Exchange Traded Funds (ETF’s)
• ETF’s are a ‘proxy’ for owning each company covered by the ETF.
• ETF’s are, generally, a weighted index made up of each company within the sector. The company’s stock price is weighted based on the market cap of the company.
• ETF’s provide a method to diversify and/or invest in a sector or industry without owning a large portfolio of companies.
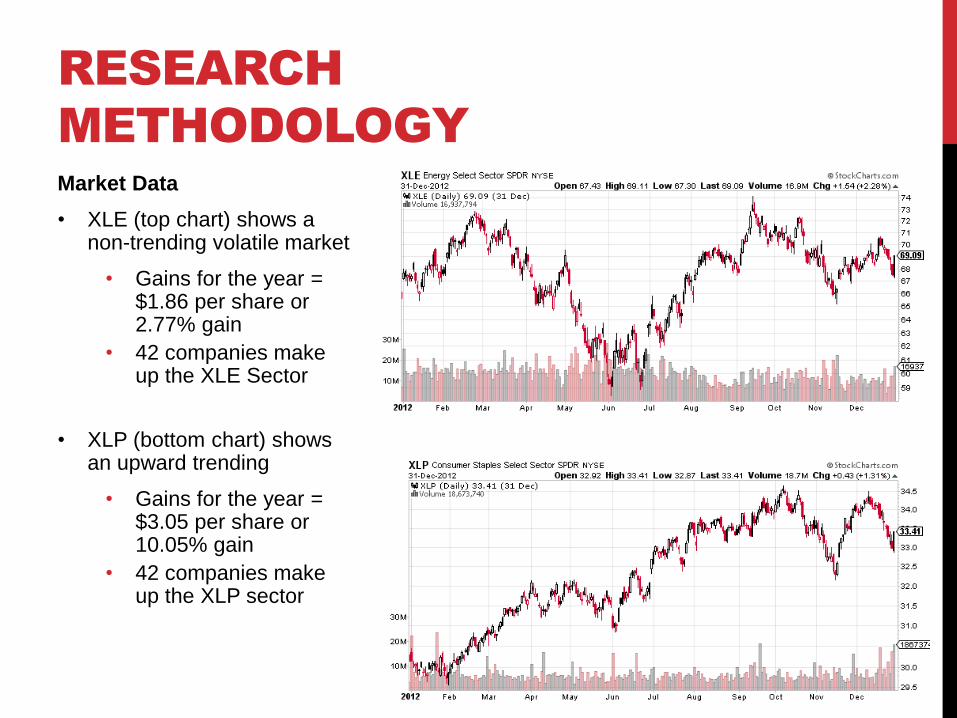
Market Data
• XLE (top chart) shows a non-trending volatile market
• Gains for the year = $1.86 per share or 2.77% gain
• 42 companies make up the XLE Sector
• XLP (bottom chart) shows an upward trending
• Gains for the year = $3.05 per share or 10.05% gain
• 42 companies make up the XLP sector
RESEARCH
METHODOLOGY
RESEARCH
METHODOLOGY
Sentiment Analysis
• Using the Python programming language and the Natural Language Toolkit’s implementation of the Bayesian text classification system, algorithms were implemented to determine sentiment found within Tweets
• For Bayesian classification, a data set was needed to ‘train’ the classifier to categorize data appropriately.
• To create the training data set, 10,000 Tweets were randomly selected from the collection of Tweets.
• Each Tweet was ‘cleansed’ to remove identifying Twitter user information, Twitter hash-tags and stock symbols.
• Each Tweet was then manually reviewed and assigned a category
RESEARCH
METHODOLOGY
Sentiment Analysis (cont)
• Tweets were categorized as
• Bullish: denotes a positive sentiment.
• Bearish: denotes a negative sentiment.
• Neutral for those Tweets that do not convey any discernible
sentiment.
• Spam for those Tweets that aren’t delivering market
information.
RESEARCH
METHODOLOGY
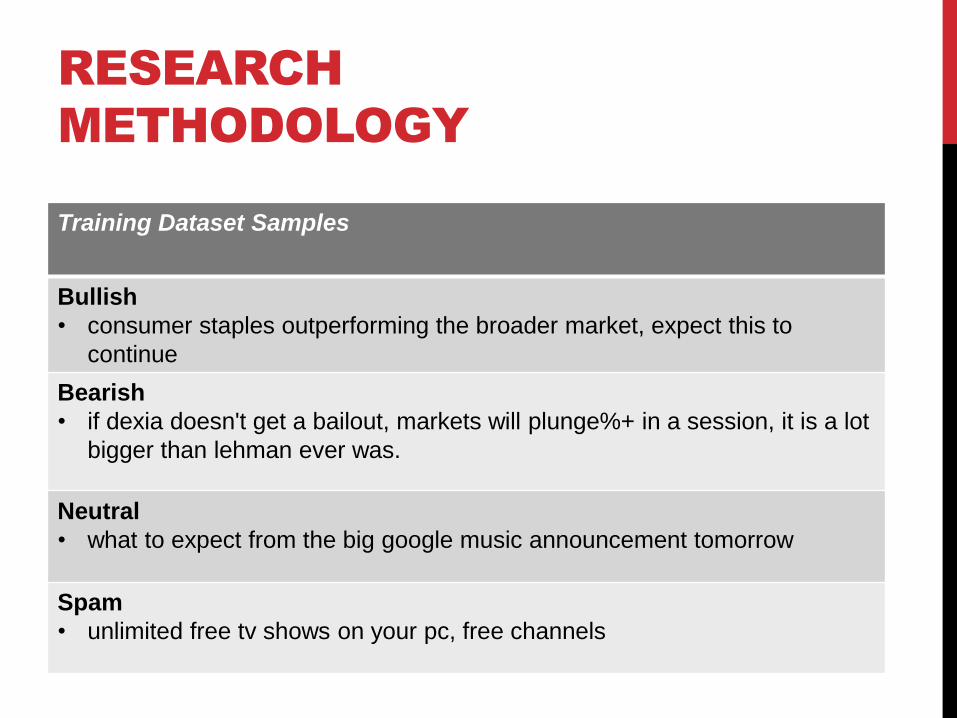
Training Dataset Samples
Bullish
• consumer staples outperforming the broader market, expect this to
continue
Bearish
• if dexia doesn't get a bailout, markets will plunge%+ in a session, it is a lot
bigger than lehman ever was.
Neutral
• what to expect from the big google music announcement tomorrow
Spam
• unlimited free tv shows on your pc, free channels

RESEARCH
METHODOLOGY
Sentiment Analysis (cont)
• 1,000 Tweets of each classification were used in the training dataset
• Using a built-in accuracy check algorithm, the training dataset provided a 89.35% classification accuracy
• With the training data set created, each Tweet was analyzed and assigned one of the four categories.
• Only Tweets assigned Bullish or Bearish were considered during this study.
• Only Tweets mentioning the Energy Sector (XLE) and Consumer Staples Sector (XLP) ETF’s and the symbols that make up the sectors were analyzed

RESEARCH
METHODOLOGY
Twitter Twitter API
Mysql
Database
Bayes
Classification
Training
Dataset
Classified Tweet

RESEARCH
METHODOLOGY
Converting Qualitative to Quantitative
• To utilize the sentiment found within Tweets as a market ‘signal’, a quantitative measure was needed.
• The Bear/Bull ratio was created by counting the total number of Tweets with Bearish sentiment during a period and dividing that number by the total number of Tweets with Bullish sentiment during a period.
• The Bear/Bull ratio follows the Put/Call ratio that is widely known and followed to measure sentiment using the buying and selling of Options in the stock market.
• The Put/Call ratio is calculated by dividing the number of Puts (bearish activity) by the number of Calls (bullish activity).
RESEARCH
METHODOLOGY
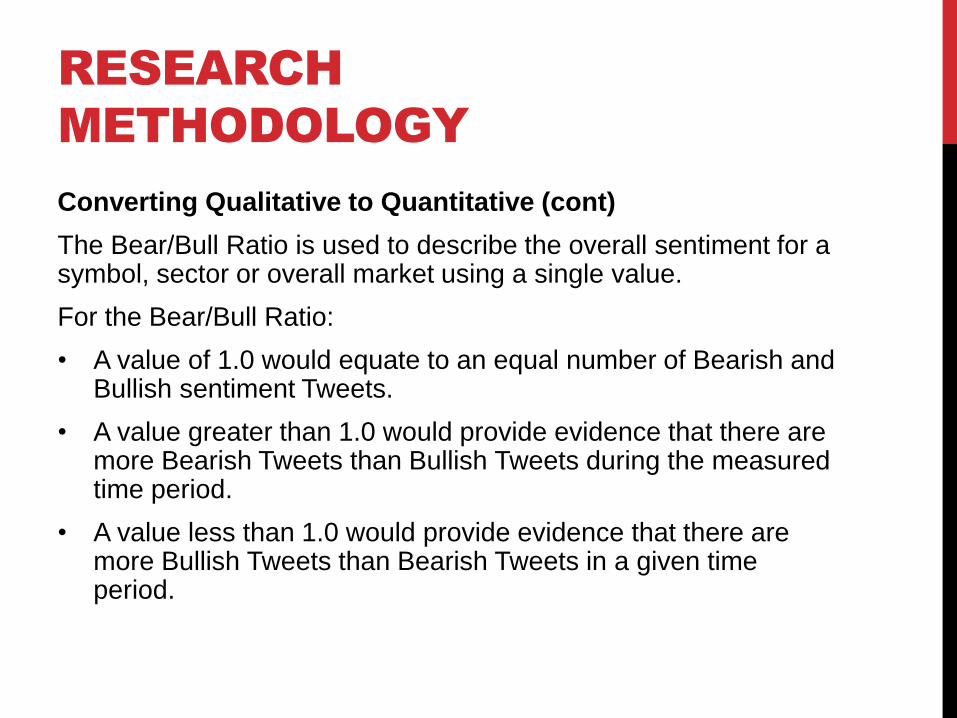
Converting Qualitative to Quantitative (cont)
The Bear/Bull Ratio is used to describe the overall sentiment for a symbol, sector or overall market using a single value.
For the Bear/Bull Ratio:
• A value of 1.0 would equate to an equal number of Bearish and Bullish sentiment Tweets.
• A value greater than 1.0 would provide evidence that there are more Bearish Tweets than Bullish Tweets during the measured time period.
• A value less than 1.0 would provide evidence that there are more Bullish Tweets than Bearish Tweets in a given time period.

RESEARCH
METHODOLOGY
Example of Daily Bear/Bull Ratio and Closing Price for XLE ETF
Date Number of
Bearish
Tweets
Number of
Bullish
Tweets
Bear/Bull
Ratio
XLE Close
5/1/2012 13 7 1.86 69.07
5/2/2012 5 5 1.00 67.95
5/3/2012 7 13 0.54 66.82
5/4/2012 9 13 0.69 65.29
RESEARCH
METHODOLOGY
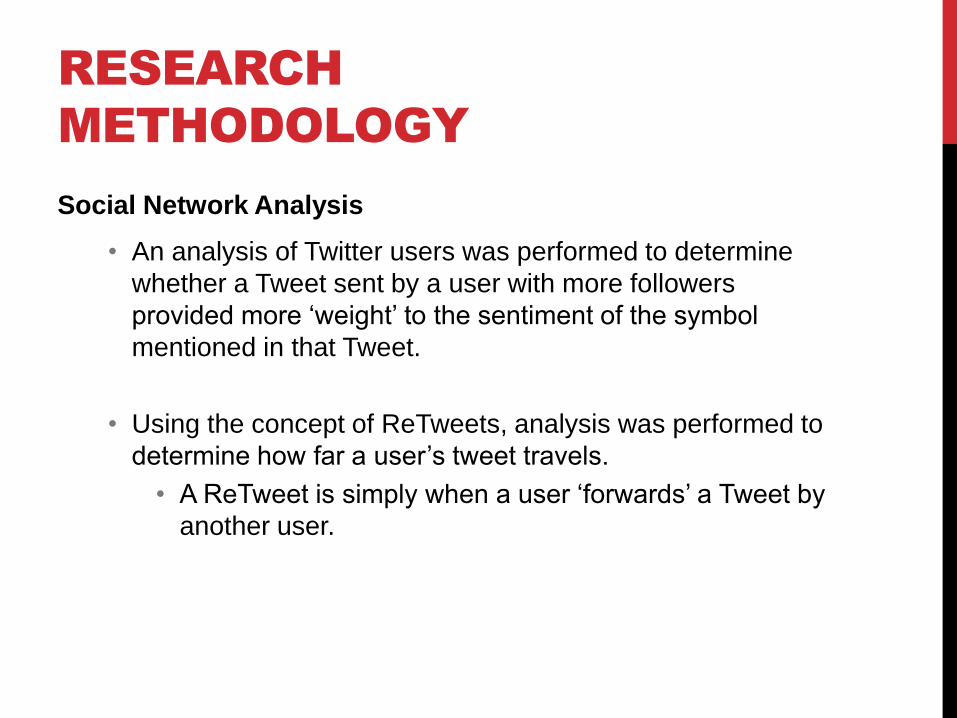
Social Network Analysis
• An analysis of Twitter users was performed to determine
whether a Tweet sent by a user with more followers
provided more ‘weight’ to the sentiment of the symbol
mentioned in that Tweet.
• Using the concept of ReTweets, analysis was performed to
determine how far a user’s tweet travels.
• A ReTweet is simply when a user ‘forwards’ a Tweet by
another user.
DATA ANALYSIS
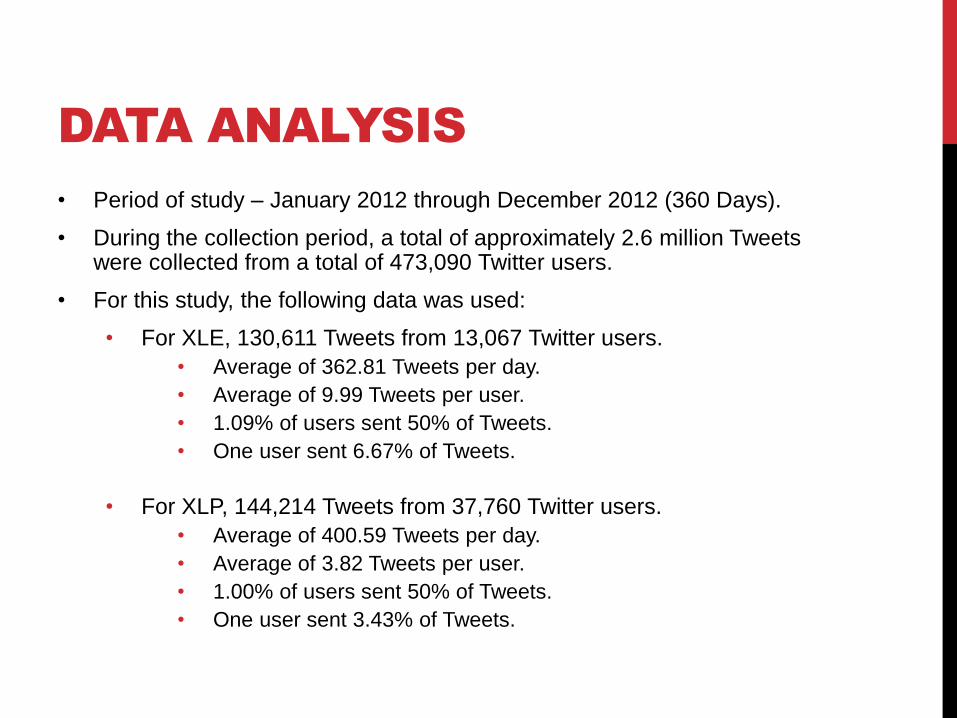
• Period of study – January 2012 through December 2012 (360 Days).
• During the collection period, a total of approximately 2.6 million Tweets were collected from a total of 473,090 Twitter users.
• For this study, the following data was used:
• For XLE, 130,611 Tweets from 13,067 Twitter users.
• Average of 362.81 Tweets per day.
• Average of 9.99 Tweets per user.
• 1.09% of users sent 50% of Tweets.
• One user sent 6.67% of Tweets.
• For XLP, 144,214 Tweets from 37,760 Twitter users.
• Average of 400.59 Tweets per day.
• Average of 3.82 Tweets per user.
• 1.00% of users sent 50% of Tweets.
• One user sent 3.43% of Tweets.

DATA ANALYSIS
Description of Tweets for all symbols in XLE
Number of Total Tweets 130,611 Percentage
Number of Bullish Tweets 45,883 35.12%
Number of Bearish Tweets 30,680 23.49%
Number of Neutral Tweets 50,886 38.95%
Number of Spam Tweets 3,482 2.67%
Number of Tweets with no
classification
0 0

DATA ANALYSIS
Description of Tweets for all symbols in XLP
Number of Total Tweets 144,214 Percentage
Number of Bullish Tweets 32,315 22.41%
Number of Bearish Tweets 22,568 15.65%
Number of Neutral Tweets 60,572 42.00%
Number of Spam Tweets 28,757 19.94%
Number of Tweets with no
classification
2 0.001%

RESEARCH FINDINGS
H1a: The sentiment of a sector will match the overall averaged
sentiment of all stocks within the sector.
• H1a0 states that there will be no noticeable relationship
between the sentiment of a sector and the overall averaged
sentiment of stocks within the sector.
• For the analysis, the XLE and XLP ETF Bear/Bull ratios were
compared with the respective aggregated Bear/Bull ratios from
all symbols making up each sector.
RESEARCH FINDINGS
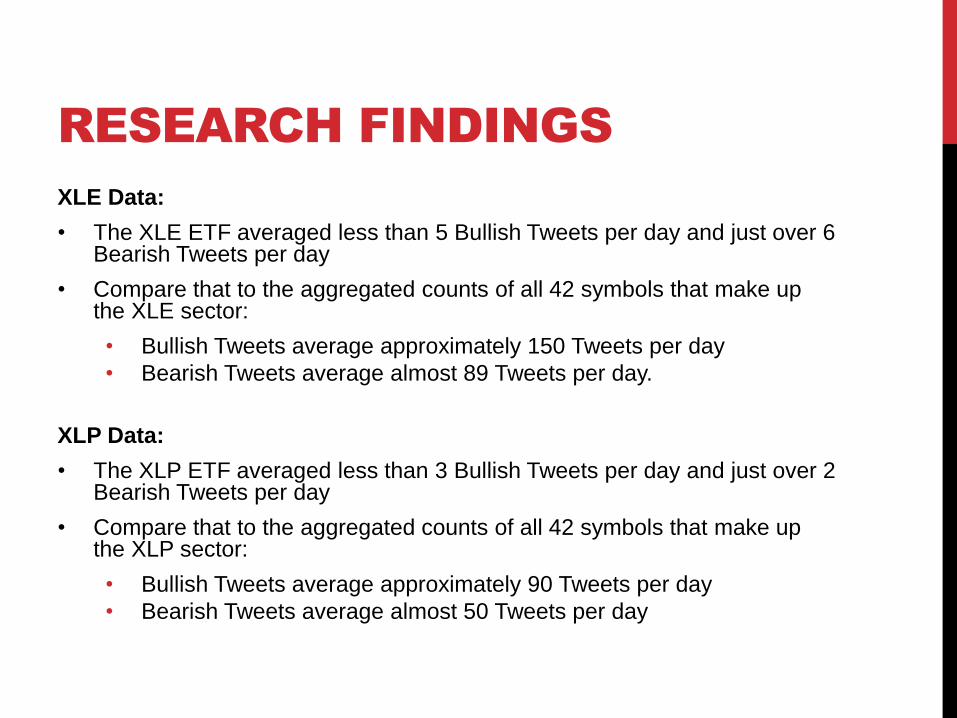
XLE Data:
• The XLE ETF averaged less than 5 Bullish Tweets per day and just over 6 Bearish Tweets per day
• Compare that to the aggregated counts of all 42 symbols that make up the XLE sector:
• Bullish Tweets average approximately 150 Tweets per day
• Bearish Tweets average almost 89 Tweets per day.
XLP Data:
• The XLP ETF averaged less than 3 Bullish Tweets per day and just over 2 Bearish Tweets per day
• Compare that to the aggregated counts of all 42 symbols that make up the XLP sector:
• Bullish Tweets average approximately 90 Tweets per day
• Bearish Tweets average almost 50 Tweets per day

XLE Distribution
• With such a low average count of Tweets per day, some concern exists that the
Central Limit Theorem isn't satisfied
• Reviewing the distributions, it is clear that the XLE Bear/Bull ratio (bottom left) is
not normally distributed while the Aggregated Symbol Bear/Bull ratio (bottom right)
is.
RESEARCH FINDINGS
9.07.56.04.53.01.50.0
80
70
60
50
40
30
20
10
0
Bear_Bull
Fre
qu
en
cy
XLE Histogram of Bear_Bull
1.21.00.80.60.40.20.0
40
30
20
10
0
Bear_Bull
Fre
qu
en
cy
Mean 0.6156
StDev 0.2066
N 366
Normal
Histogram of Aggregated XLE Bear_Bull

XLP Distribution
• With such a low average count of Tweets per day, some concern exists that the
Central Limit Theorem isn't satisfied
• Reviewing the distributions, it is clear that the XLP Bear/Bull ratio (bottom left) is
not normally distributed while the Aggregated Symbol Bear/Bull ratio (bottom right)
is.
RESEARCH FINDINGS
9.07.56.04.53.01.50.0
80
70
60
50
40
30
20
10
0
Bear_Bull
Fre
qu
en
cy
XLP Histogram of Bear_Bull
1.21.00.80.60.40.20.0
40
30
20
10
0
Bear_Bull
Fre
qu
en
cy
Mean 0.5609
StDev 0.2581
N 366
Normal
Histogram of XLP Sector Bear_Bull
RESEARCH FINDINGS
Based on the significant differences in distributions and
insufficient number of daily observations for either XLE or
XLP ETF's:
• There is not enough evidence available on a daily basis to
reject the null (H1a0)

RESEARCH FINDINGS
H1b: The sentiment of a sector can be used to predict the
movement of all stocks in that sector.
• H1b0 states that there will be no noticeable relationship
between the sentiment of a sector and the overall
averaged sentiment of stocks within the sector.
H1c: The sentiment of a sector or stock on any given day will
provide a prediction for the next day’s movement in that stock.
• H1c0 states that the sentiment of a sector will provide no
predictive capability.

RESEARCH FINDINGS
Similar to the research for H1a, the different distributions and
insufficient number of daily observations for either XLE or XLP
ETF's found previously:
• There is not enough evidence available on a daily basis for
individual symbols to reject the null for both H1b and H1c.
Although there is insufficient evidence to reject H1b0 and H1c0:
• A new definition of sector sentiment was defined and used to
continue the analysis.
• By using the aggregated sentiment of a sector as the Bear/Bull
ratio, additional analysis was performed.
RESEARCH FINDINGS
• Using the aggregated Bear/Bull ratio for the sectors covered by
XLE and XLP, a regression analysis was performed to analyze
whether the aggregated Bear/Bull ratio could predict daily price
movement for the XLE and XLP ETF’s and the symbols within
each sector.
• To perform regression analysis on stock market data, the time-
series data was transformed from a non-stationary series into a
stationary series.
• This transformation was accomplished by taking daily
closing price and creating a percentage change value from
one day to the next
RESEARCH FINDINGS
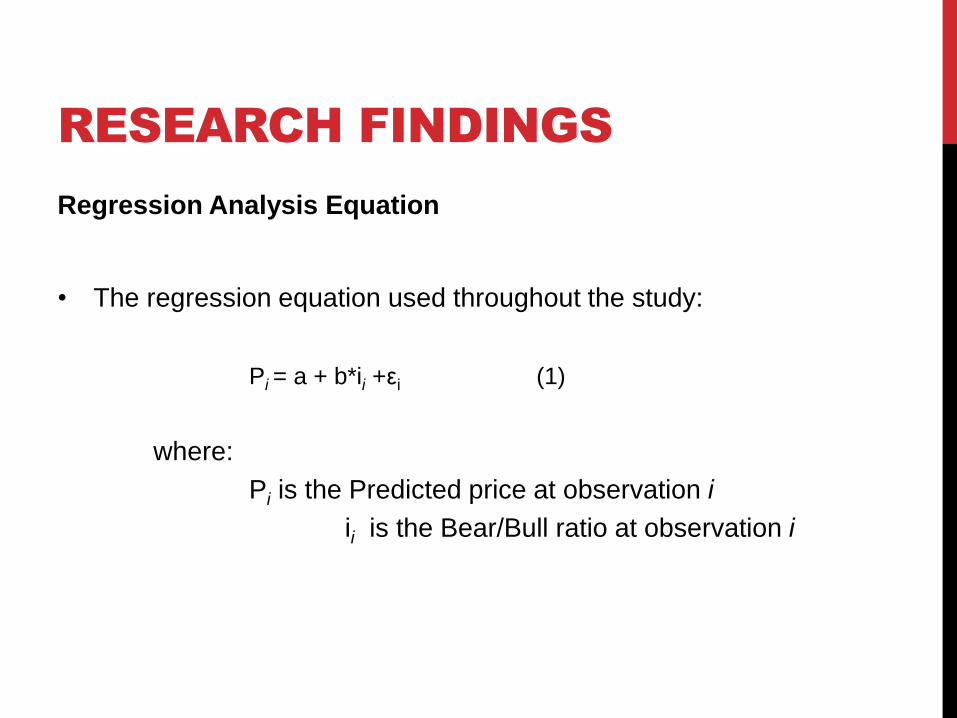
Regression Analysis Equation
• The regression equation used throughout the study:
Pi = a + b*ii +εi (1)
where:
Pi is the Predicted price at observation i
ii is the Bear/Bull ratio at observation i
RESEARCH FINDINGS
Regression analysis (Cont)
• The majority of correlations are low
• Durbin-Watson values are between 1.7 and 2.3, which points
to little to no autocorrelation in the residuals. This isn’t a
surprise since we transformed the data into a stationary series.
• The sign of the correlation coefficient's are negative, which
aligns with the idea behind the Bear/Bull ratio.
• Most symbols have very good F-statistics and correlations that
are statistically significant.

RESEARCH FINDINGS
Regression analysis (Cont)
• For XLE:
• 36 out of 43 symbols have a statistically significant
correlations with 95% significance between the
transformed daily close and aggregated Bear/Bull.
• For XLP:
• 5 out of 43 symbols have a statistically significant
correlation with 95% significance between the transformed
daily close and aggregated Bear/Bull.
RESEARCH FINDINGS
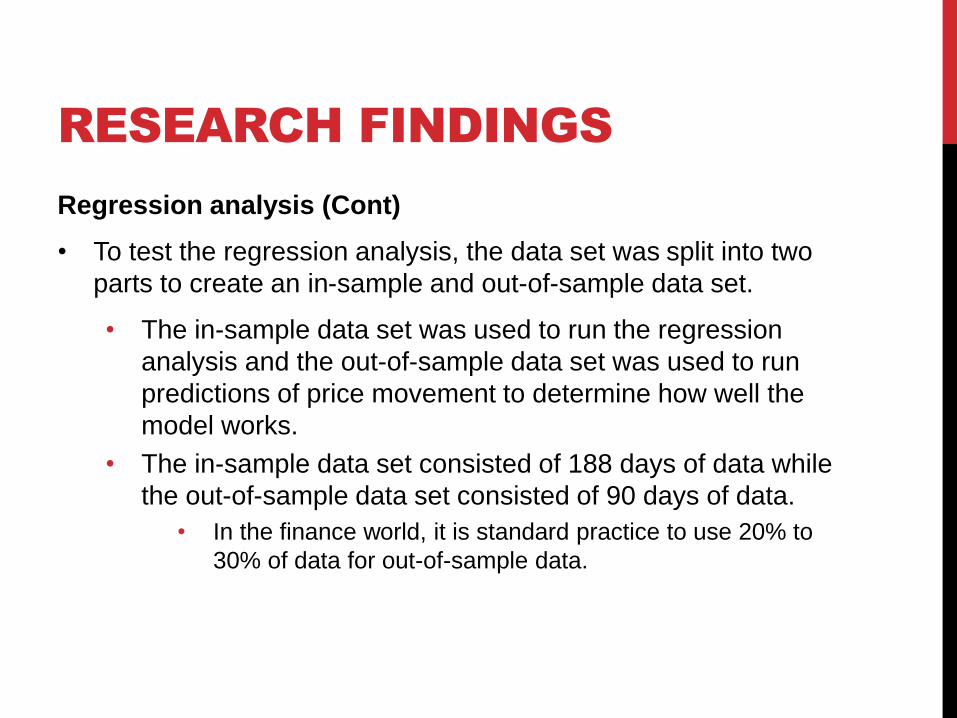
Regression analysis (Cont)
• To test the regression analysis, the data set was split into two
parts to create an in-sample and out-of-sample data set.
• The in-sample data set was used to run the regression
analysis and the out-of-sample data set was used to run
predictions of price movement to determine how well the
model works.
• The in-sample data set consisted of 188 days of data while
the out-of-sample data set consisted of 90 days of data.
• In the finance world, it is standard practice to use 20% to
30% of data for out-of-sample data.
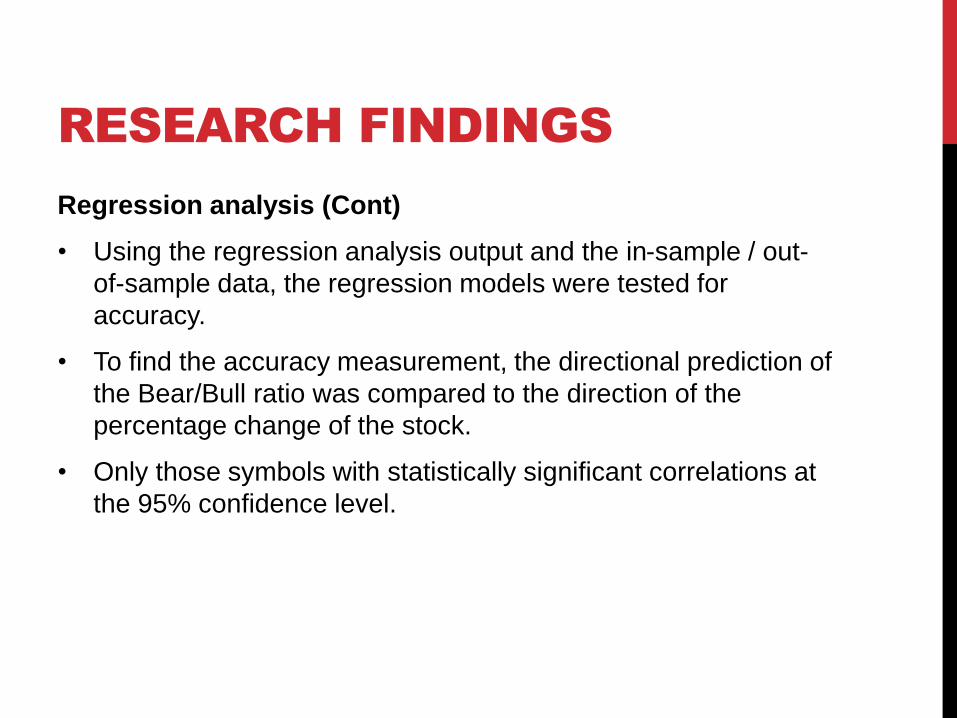
RESEARCH FINDINGS
Regression analysis (Cont)
• Using the regression analysis output and the in-sample / out-
of-sample data, the regression models were tested for
accuracy.
• To find the accuracy measurement, the directional prediction of
the Bear/Bull ratio was compared to the direction of the
percentage change of the stock.
• Only those symbols with statistically significant correlations at
the 95% confidence level.
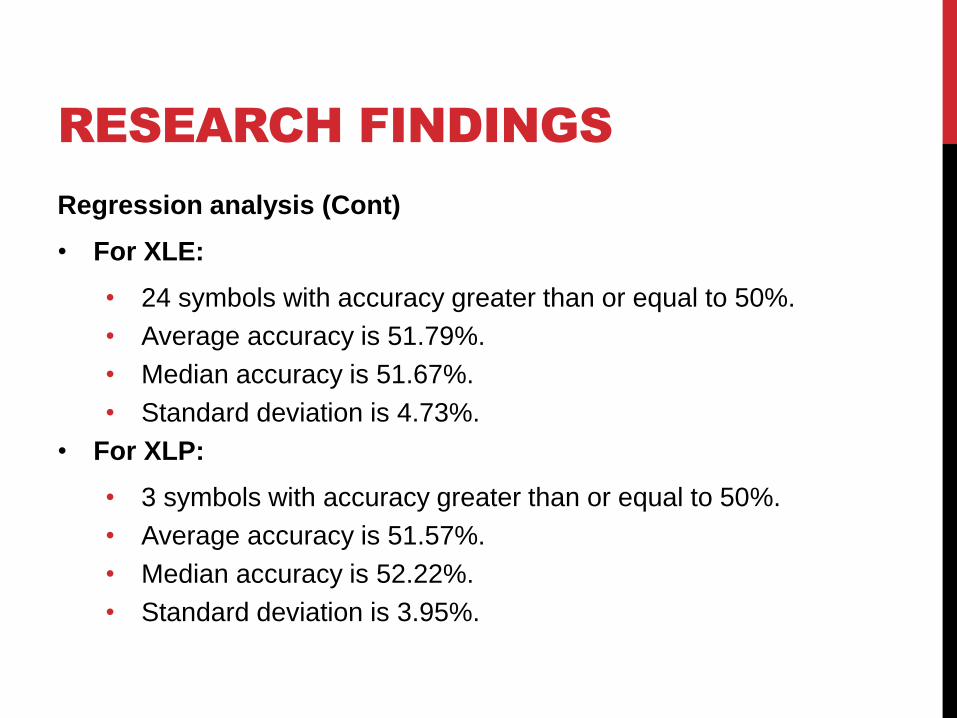
RESEARCH FINDINGS
Regression analysis (Cont)
• For XLE:
• 24 symbols with accuracy greater than or equal to 50%.
• Average accuracy is 51.79%.
• Median accuracy is 51.67%.
• Standard deviation is 4.73%.
• For XLP:
• 3 symbols with accuracy greater than or equal to 50%.
• Average accuracy is 51.57%.
• Median accuracy is 52.22%.
• Standard deviation is 3.95%.

RESEARCH FINDINGS
Outcome of H1a, H1b and H1c
• As stated previously:
• There is insufficient evidence available on a daily basis to
reject the null for H1a.
• By the original definition of sentiment, there is insufficient
evidence available on a daily basis to reject the null for
both H1b and H1c.
• Using the modified definition of sentiment to use
aggregated sentiment:
• There is limited evidence to reject the null for H1b and
H1c.

RESEARCH FINDINGS
H2a: The sentiment of a stock within a given sector will affect the
sentiment of the overall sector based on the relative market cap
weighting of that stock assigned to that stock within the sector.
• H2a0 states that the sentiment of a stock is not correlated with
the market cap weighting of the stock in that sector.
H2b: The stocks that provide the most weight toward the
sentiment of a sector are also the stocks with the highest number
of mentions on Twitter.
• H2b0 states that there is no relationship between the number
of mentions on Twitter and the affect that these stocks have
on the sector sentiment.

RESEARCH FINDINGS
Analysis for H2a
• The daily sentiment reading for each symbol was calculated
then multiplied by the index weighting and then regression
analysis was performed.
• For example, ExxonMobil (XOM) comprised ~18% of the
XLE ETF during the study
• XOM’s tweet volume was multiplied by this index weighting
to build a weighted sentiment Bear/Bull ratio

RESEARCH FINDINGS
Regression analysis for H2a
• For XLE:
• 4 out of 43 symbols had a statistically significant correlation with 95% significance between daily close and aggregated Bear/Bull.
• 3 symbols with accuracy greater than or equal to 50%
• Average accuracy is 53.33%
• Median accuracy is 55.00%
• Standard deviation is 3.93%
• For XLP:
• 2 out of 43 symbols had a statistically significant correlation with 95% significance between daily close and aggregated Bear/Bull.
• 1 symbol with accuracy greater than or equal to 50%
• Average accuracy is 49.44%
• Median accuracy is 49.44%
• Standard deviation is 0.56%

RESEARCH FINDINGS
Analysis for H2b
• Similarly to H2a, a regression analysis was performed using
regression analysis.
• A weighting mechanism was developed to assign a weight to
each symbol dependent on its contribution to the number of
Tweets per day.
• This weighted contribution was then used to build the
aggregated sentiment signal, which was then used for
regression analysis as described previously.
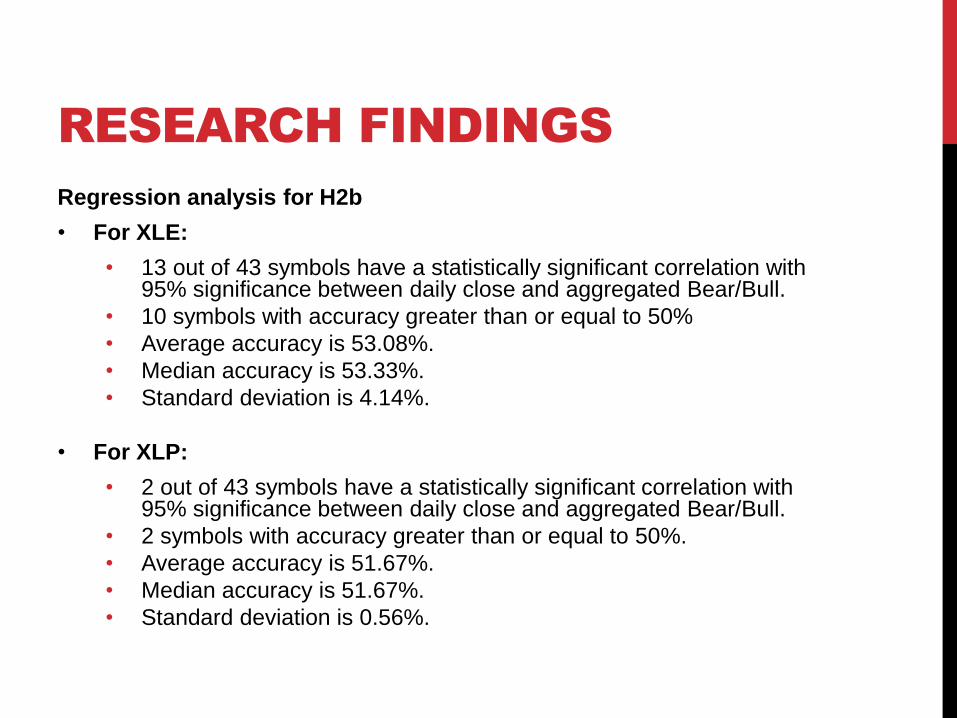
RESEARCH FINDINGS
Regression analysis for H2b
• For XLE:
• 13 out of 43 symbols have a statistically significant correlation with 95% significance between daily close and aggregated Bear/Bull.
• 10 symbols with accuracy greater than or equal to 50%
• Average accuracy is 53.08%.
• Median accuracy is 53.33%.
• Standard deviation is 4.14%.
• For XLP:
• 2 out of 43 symbols have a statistically significant correlation with 95% significance between daily close and aggregated Bear/Bull.
• 2 symbols with accuracy greater than or equal to 50%.
• Average accuracy is 51.67%.
• Median accuracy is 51.67%.
• Standard deviation is 0.56%.

RESEARCH FINDINGS
Outcome of H2a and H2b
• There is insufficient evidence available on a daily basis to
reject the null for H2a.
• There is limited evidence to support rejecting the null for H2b.

RESEARCH FINDINGS
H3: There is a difference in the effect that Tweets sent during non-market hours (i.e., evenings and weekends) and Tweets sent during market hours have on sentiment and price.
• H30 states that there is no difference in the effect of Tweets sent during market hours and non-market hours.
Analysis for H3
• Tweets were split into two categories to describe whether the Tweets were sent during trading hours or non-trading hours.
• Trading hours: For equity and index markets in the U.S., trading hours are defined as 8:30 AM to 3:00 PM Central Time, Monday through Friday.
• Non-trading hours: For equity and index markets in the US, non-trading hours are defined as any time outside of the 8:30 AM to 3:00 PM Central time including evenings and weekends.

RESEARCH FINDINGS
Regression analysis for H3:
• XLE Trading Hours
• 39 out of 43 symbols have a statistically significant correlation with 95% significance between daily close and aggregated Bear/Bull.
• 24 symbols with accuracy greater than or equal to 50%.
• Average accuracy is 51.06%.
• Median accuracy is 51.11%.
• Standard deviation is 3.09%.
• XLE Non-Trading Hours
• 36 out of 43 symbols have a statistically significant correlation with 95% significance between daily close and aggregated Bear/Bull.
• 20 symbols with accuracy greater than or equal to 50%.
• Average accuracy is 49.85%.
• Median accuracy is 50.00%.
• Standard deviation is 4.16%.

RESEARCH FINDINGS
Regression analysis for H3:
• XLP Trading Hours
• 5 out of 43 symbols have a statistically significant correlation with 95% significance between daily close and aggregated Bear/Bull.
• 3 symbols with accuracy greater than or equal to 50%.
• Average accuracy is 49.33%.
• Median accuracy is 51.11%.
• Standard deviation is 5.56%.
• XLP Non-Trading Hours
• 4 out of 43 symbols have a statistically significant correlation with 95% significance between daily close and aggregated Bear/Bull.
• 2 symbols with accuracy greater than or equal to 50%.
• Average accuracy is 50.23%.
• Median accuracy is 49.44%.
• Standard deviation is 4.80%.
RESEARCH FINDINGS
Outcome of H3
• There is evidence available on a daily basis to reject the null
for H3 for the XLE sector but not for the XLP sector.
• For XLE, Tweets sent during trading hours provided a
slight improvement in accuracy over those sent during
non-trading hours.

RESEARCH FINDINGS
H4: The number of followers of a Twitter user determines the effect that users’ Tweets will have on sentiment for a stock or sector.
• H40 states that there is no relationship between the number of followers and sentiment on a stock or sector.
Analysis for H4
• Recall that:
• XLE had 130,611 Tweets and 13,067 unique users.
• XLP had 144,214 Tweets and 37,760 unique users.
• No single user had more than 30 Tweets per day.
• XLE's most prolific sender of Tweets, on average, sent 24.19 Tweets per day.
• XLPs most prolific sender of Tweets, on average, sent 13.85 Tweets per day.
RESEARCH FINDINGS
Analysis for H4
• To satisfy the Central Limit Theorem, the Top 50 users sorted
by number of followers for each sector were selected in order
to get an average of 30 Tweets per day.
• The top 50 users by number of followers comprised just
8.41% of total Tweets for XLE and 9.06% of total Tweets
for XLP
• The Tweets by the Top 50 users by number of followers for
both XLE and XLP were combined to create a Bear/Bull ratio
for each sector.
• This Top 50 Bear/Bull ratio was used in regression analysis
using the regression equation.
RESEARCH FINDINGS
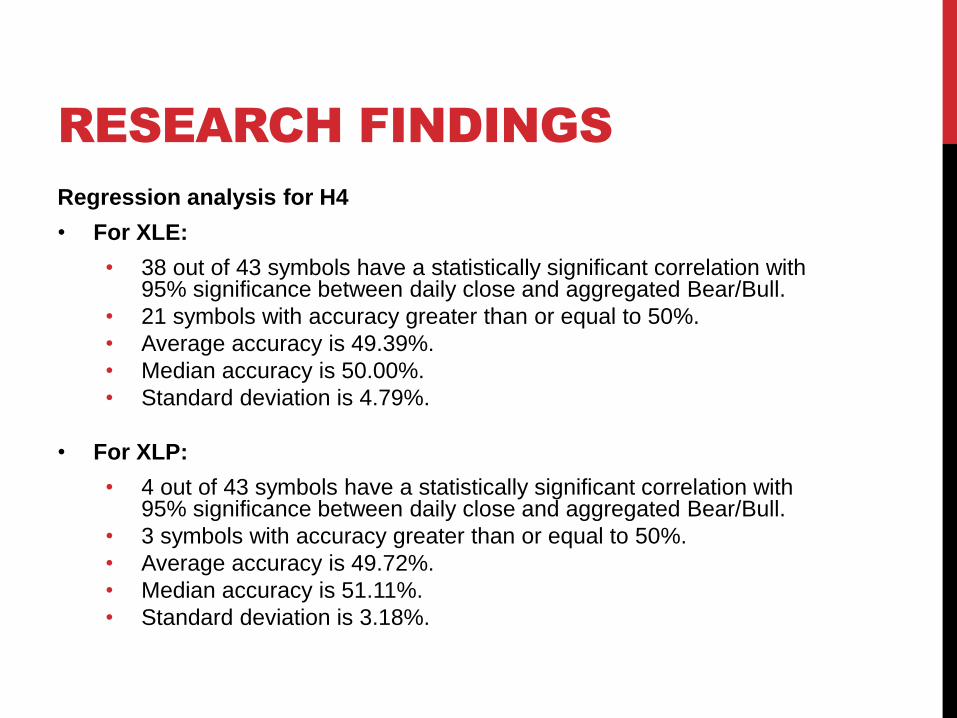
Regression analysis for H4
• For XLE:
• 38 out of 43 symbols have a statistically significant correlation with 95% significance between daily close and aggregated Bear/Bull.
• 21 symbols with accuracy greater than or equal to 50%.
• Average accuracy is 49.39%.
• Median accuracy is 50.00%.
• Standard deviation is 4.79%.
• For XLP:
• 4 out of 43 symbols have a statistically significant correlation with 95% significance between daily close and aggregated Bear/Bull.
• 3 symbols with accuracy greater than or equal to 50%.
• Average accuracy is 49.72%.
• Median accuracy is 51.11%.
• Standard deviation is 3.18%.

RESEARCH FINDINGS
Outcome of H4
There is insufficient evidence available on a daily basis to reject
the null for H4 for both individual users and the Top 50 users.

RESEARCH FINDINGS
Hypothesis Summary Table
Hypothesis Outcome
H1a: Sector ETF sentiment will match the aggregated sentiment. Insufficient evidence to reject
the null hypothesis
H1b: Sector ETF sentiment can be used to predict market movement for all sector
stocks. Insufficient evidence to reject
the null hypothesis
H1c: Sentiment can be used to predict next day price movement. Insufficient evidence to reject
the null hypothesis.
H2a: Stocks will affect sentiment based on their index weighting. Insufficient evidence to reject
the null hypothesis
H2b: Stocks will affect sentiment based on how often they are mentioned. There is limited evidence to
support rejecting the null
H3: Stocks sent during trading and non-trading hours will affect sentiment differently. There is limited evidence to
support rejecting the null
H4: The number of followers of a Twitter user will affect sentiment Insufficient evidence to reject
the null hypothesis

RESEARCH FINDINGS
Using the Bear/Bull Ratio in an Investment Strategy
• Rather than try to predict daily movements, can the Bear/Bull
ratio be used in other ways?
• During this study, the idea of "extremes" in the Bear/Bull
ratio was investigated to determine whether they would
identify proper entry and exit signals
• Based on the contrarian approach to investing where
extreme sentiment is used as a signal to enter in the
opposite direction
• Can Bear/Bull extremes be used to enter the market and
provide adequate returns?

RESEARCH FINDINGS
Using the Bear/Bull Ratio in an Investment Strategy
To find extremes, a simple approach was used
• Identify the top 90% of values as Bearish Extremes and the bottom 10% of values as Bullish Extremes.
• A trading signal was generated if the Bear/Bull ratio closes above the Bearish Extreme value or below the Bullish Extreme value. The extreme values for XLE, XLP are:
• XLE:
• Bearish Extreme: >= 0.90
• Bullish Extreme: <= 0.43
• XLP:
• Bearish Extreme: >= 0.90
• Bullish Extreme: <= 0.33
RESEARCH FINDINGS
Using the Bear/Bull Ratio in an Investment Strategy
• Using Tradestation, a highly regarded professional investing platform, an investing strategy was developed using Bear/Bull ratio extremes values.
• Using the Aggregated Bear/Bull ratio, the strategy was tested against the XLE and XLP ETF's as well as each of the symbols within the sectors.
• This strategy was compared to a simple Buy and Hold strategy and a Random Entry strategy.
• Buy and Hold means to buy a stock on Day 1 of the test period and sell it on the last day.
• Random Entry means to enter at random times in the market.

RESEARCH FINDINGS
Using the Bear/Bull Ratio in an Investment Strategy
• Highlights of the Investing strategy:
• August 21 2012 to December 31 2012
• Entry criteria (If not already in a trade):
• Bearish Extreme = Buy
• Bullish Extreme = Short
• Direction: Long & Short
• Number of Shares: 500
• Holding period: 2 days
• Commission: $5 per trade
• Slippage: $0.10 per trade
• Slippage was used to simulate non-perfect entries

RESEARCH FINDINGS
Using the Bear/Bull Ratio in an Investment Strategy
Investing strategy outcomes for XLE
XLE All Symbols in XLE (Average)
Bear/Bull Sentiment Return 4.85% Bear/Bull Sentiment Return 3.86%
Bear/Bull Extreme Accuracy 54.55% Bear/Bull Extreme Accuracy 54.16%
Buy and Hold Return -1.07% Buy and Hold Return 1.09%
Random Entry Return -3.62% Random Entry Return -2.61%
RESEARCH FINDINGS
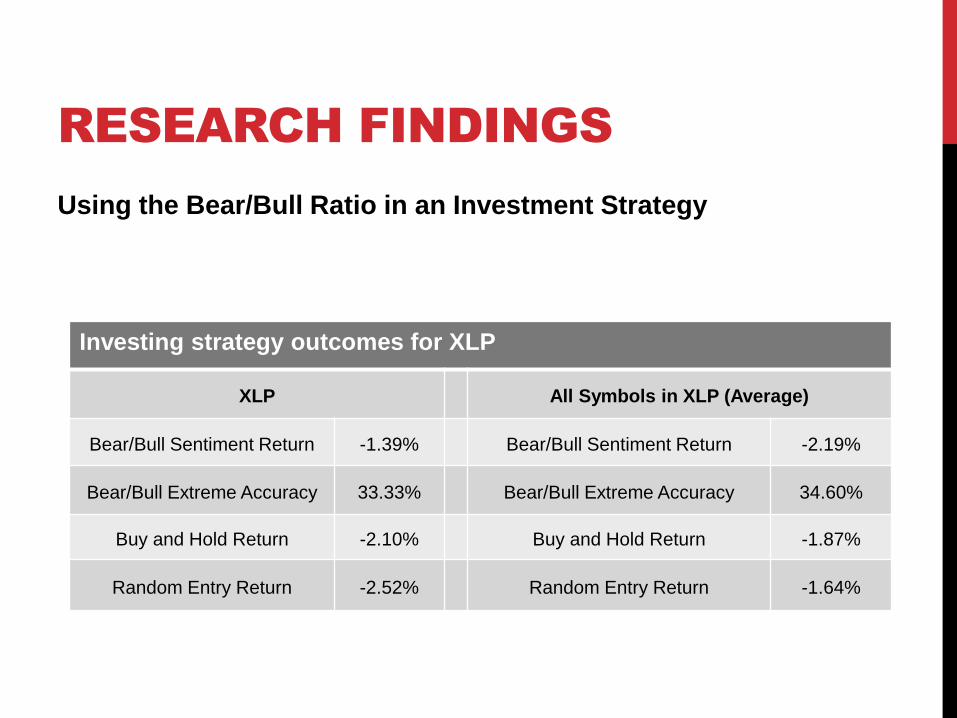
Using the Bear/Bull Ratio in an Investment Strategy
Investing strategy outcomes for XLP
XLP All Symbols in XLP (Average)
Bear/Bull Sentiment Return -1.39% Bear/Bull Sentiment Return -2.19%
Bear/Bull Extreme Accuracy 33.33% Bear/Bull Extreme Accuracy 34.60%
Buy and Hold Return -2.10% Buy and Hold Return -1.87%
Random Entry Return -2.52% Random Entry Return -1.64%
RESEARCH FINDINGS
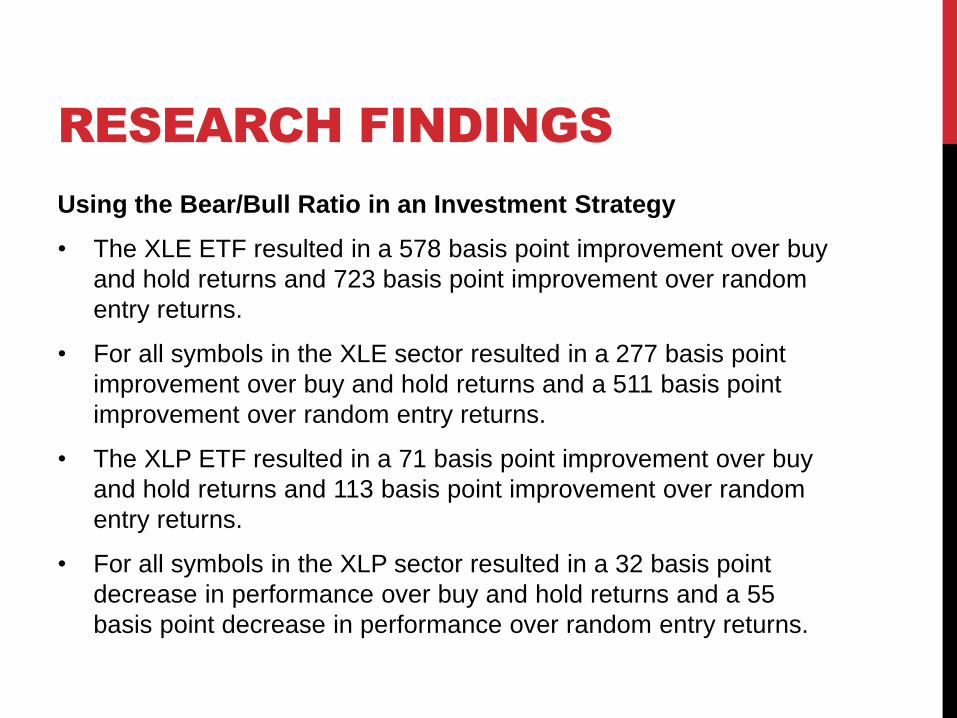
Using the Bear/Bull Ratio in an Investment Strategy
• The XLE ETF resulted in a 578 basis point improvement over buy
and hold returns and 723 basis point improvement over random
entry returns.
• For all symbols in the XLE sector resulted in a 277 basis point
improvement over buy and hold returns and a 511 basis point
improvement over random entry returns.
• The XLP ETF resulted in a 71 basis point improvement over buy
and hold returns and 113 basis point improvement over random
entry returns.
• For all symbols in the XLP sector resulted in a 32 basis point
decrease in performance over buy and hold returns and a 55
basis point decrease in performance over random entry returns.
CONCLUSIONS AND
FUTURE RESEARCH
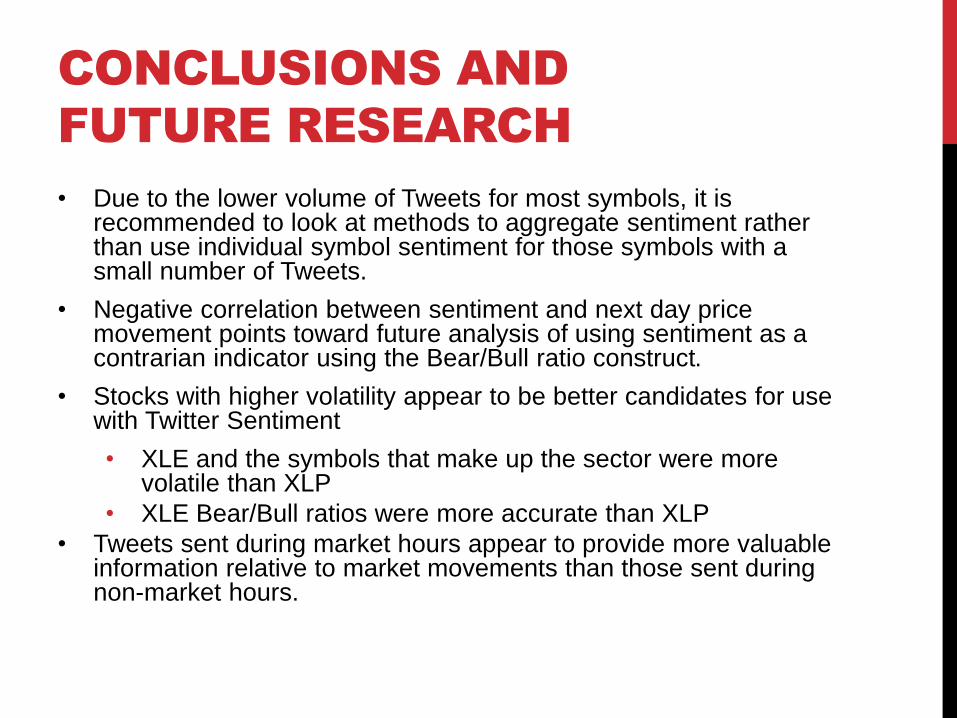
• Due to the lower volume of Tweets for most symbols, it is recommended to look at methods to aggregate sentiment rather than use individual symbol sentiment for those symbols with a small number of Tweets.
• Negative correlation between sentiment and next day price movement points toward future analysis of using sentiment as a contrarian indicator using the Bear/Bull ratio construct.
• Stocks with higher volatility appear to be better candidates for use with Twitter Sentiment
• XLE and the symbols that make up the sector were more volatile than XLP
• XLE Bear/Bull ratios were more accurate than XLP
• Tweets sent during market hours appear to provide more valuable information relative to market movements than those sent during non-market hours.

CONCLUSIONS AND
FUTURE RESEARCH
• The idea of a sentiment ‘extreme’ was shown to be a
potentially useful approach to using sentiment as a predictor
for price movement.
• The number of followers a user has on Twitter does not appear
to have any correlation with how that user’s tweets affect price
on the symbols studied.
• Stocks that exhibit high trading volume on a regular basis also
exhibit high Tweet volume on a regular basis.
• A small number of users send the majority of Tweets
discussing stocks and ETF’s.
• Approximately 1% of users sent 50% of Tweets during the
study.
CONCLUSIONS AND
FUTURE RESEARCH
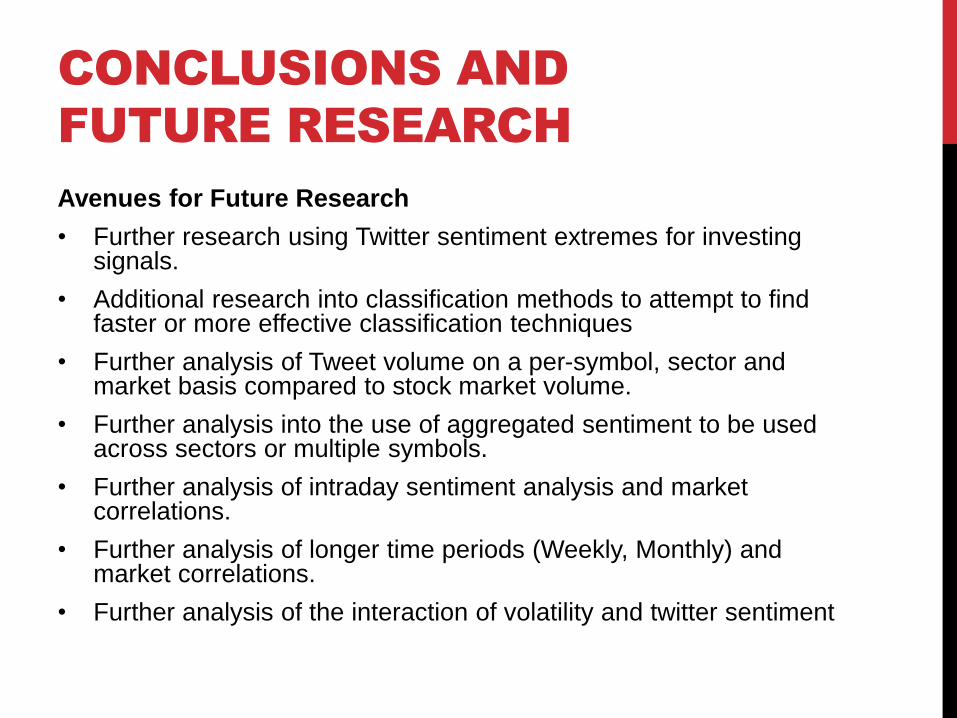
Avenues for Future Research
• Further research using Twitter sentiment extremes for investing signals.
• Additional research into classification methods to attempt to find faster or more effective classification techniques
• Further analysis of Tweet volume on a per-symbol, sector and market basis compared to stock market volume.
• Further analysis into the use of aggregated sentiment to be used across sectors or multiple symbols.
• Further analysis of intraday sentiment analysis and market correlations.
• Further analysis of longer time periods (Weekly, Monthly) and market correlations.
• Further analysis of the interaction of volatility and twitter sentiment

QUESTIONS?
Any Questions?
Feel free to reach out to me afterwards with comments or
questions:
(918) 928-2887