Embed Size (px)
Citation preview

Knowledge. Experience. Integrity.
CALLAN INVESTMENTS INSTITUTE
Research
March 2016
The Renaissance of Stable Value
Capital Preservation in Defined Contribution
Stable value funds are low-risk investment options in participant-directed plans that mix capital pres-
ervation with return generation. They invest in high-quality, short- and intermediate-duration fixed
income securities, and utilize wrap contracts to insulate individual plan participants from market value
fluctuations.
Stable value funds serve as an alternative to more volatile or risky asset classes and are a direct sub-
stitute for a money market fund. They typically offer a more attractive yield than money market funds,
except during periods when short-term rates are rising rapidly.
This paper describes how the underlying mix of securities and issuer characteristics have evolved
since the financial crisis, and why Callan sees stable value as a healthy and important part of the U.S.
retirement plan marketplace.
IntroductionIn this paper, we seek to answer questions defined contribution (DC) plan sponsors and their par-
ticipants may have about stable value funds, including mechanics, instruments, liquidity, and imple-
mentation considerations. We also look at risk and performance, address benchmarking issues,
cover recent trends, and provide key takeaways for DC plan sponsors. Stable value funds are
popular with DC plans and 529 college saving investors. According to Callan’s DC Index™, 65% of
DC plans offer a stable value fund, and typically 14% of total plan assets are in such funds when of-
fered. We believe stable value can be an effective investment option for DC plan participants
seeking capital preservation.

2
Mechanics: How Does Stable Value Work?Stable value portfolio managers invest in high-quality, short- and intermediate-duration fixed income se-
curities. Their portfolios include Treasuries, U.S. agencies, agency mortgage-backed securities, corpo-
rate bonds, asset-backed securities, and commercial mortgage-backed securities. Wrap contracts issued
by financial institutions (generally insurance companies and banks) insulate individual plan participants
from market value fluctuations arising from interest rate changes
while providing steady income. In turn, the wrap providers negotiate
investment guidelines for the stable value portfolio, including the
investable universe of securities based upon quality and sector con-
straints. Wrap providers typically require overall portfolio duration
(interest rate sensitivity) to remain between two and four years in
order to control price volatility, which is the risk they seek to control.
Capital preservation is achieved through a stable fund net asset
value (NAV) set to $1. Income from the fund is provided via a credit-
ing rate that resets periodically as market value gains or losses are
amortized over time. The crediting rate is calculated based upon
the market value, book value, yield-to-maturity, and duration of the
underlying assets. This crediting rate will fluctuate based upon the
performance of the underlying portfolio. Assets not covered by a
wrap contract are usually held in short-term money market instru-
ments, and are used to meet participants’ cash flow needs. Most
importantly, these contracts allow for daily participant cash flows
to “non-competing” options at book value, regardless of the market
value of the underlying portfolio. While unlikely, it is possible for a
stable value fund to lose value. However, the financial institutions issuing wrap coverage to stable value
funds require conservative management practices, and thus the likelihood of such a loss is slim.
Wrap ContractsFour types of wrap contracts are used by stable value funds. Most stable value funds utilize a mix of
two or more in an effort to diversify coverage and costs. All four categories meet the needs of stable
value funds, but market dynamics at the issuer level often dictate the types of contracts being offered
at any given time.
1. Traditional Guaranteed Investment Contract (GIC): A group annuity contract that guarantees a
fixed rate of return over a specified period of time.
2. Insurance Company Separate Account GIC: A customized group annuity contract that pays a
periodically adjusted rate of return, or “crediting rate.” The crediting rate reflects the performance
of the underlying assets outside of the issuer’s general account. The insurance company’s general
account backs any unpaid obligations of the separate account, if necessary, but generally all li-
abilities are met by the separate account assets. Separate account assets may not be used by the
issuer to satisfy general account liabilities. These contracts tend to be “evergreen” in nature, with
no finite maturity.
Competing vs. Non-Competing Options
Participant-driven cash flows
out of stable value funds are
unlimited, with the exception
of transfers to “competing op-
tions.” Such options typically
include money market funds
or short-duration bond funds,
but may include TIPS funds
or a brokerage window. Par-
ticipant flows may be limited
by an “equity wash provision”
which requires transferring
assets to reside in a “non-
competing option” for a pe-
riod of up to 90 days.
Wrap ContractsHelp minimize the impact
of interest rate fluctuations
and smooth payments
over time.
3Knowledge. Experience. Integrity.
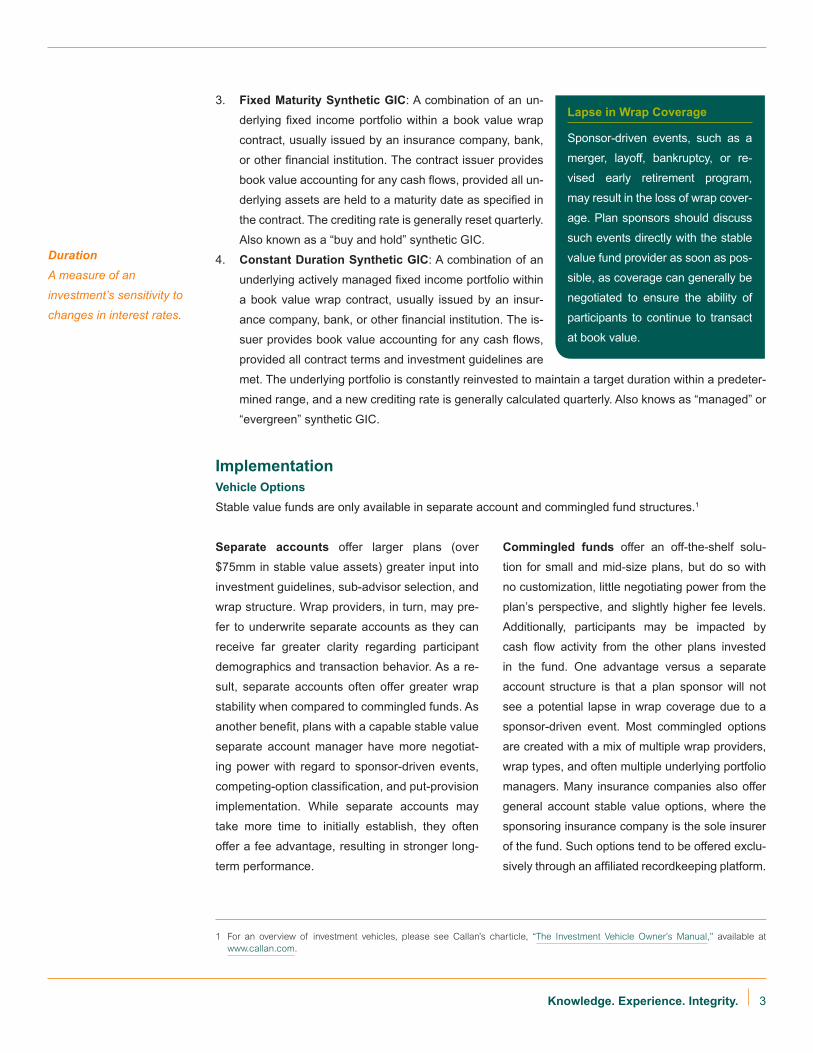
3. Fixed Maturity Synthetic GIC: A combination of an un-
derlying fixed income portfolio within a book value wrap
contract, usually issued by an insurance company, bank,
or other financial institution. The contract issuer provides
book value accounting for any cash flows, provided all un-
derlying assets are held to a maturity date as specified in
the contract. The crediting rate is generally reset quarterly.
Also known as a “buy and hold” synthetic GIC.
4. Constant Duration Synthetic GIC: A combination of an
underlying actively managed fixed income portfolio within
a book value wrap contract, usually issued by an insur-
ance company, bank, or other financial institution. The is-
suer provides book value accounting for any cash flows,
provided all contract terms and investment guidelines are
met. The underlying portfolio is constantly reinvested to maintain a target duration within a predeter-
mined range, and a new crediting rate is generally calculated quarterly. Also knows as “managed” or
“evergreen” synthetic GIC.
ImplementationVehicle OptionsStable value funds are only available in separate account and commingled fund structures.1
Separate accounts offer larger plans (over
$75mm in stable value assets) greater input into
investment guidelines, sub-advisor selection, and
wrap structure. Wrap providers, in turn, may pre-
fer to underwrite separate accounts as they can
receive far greater clarity regarding participant
demographics and transaction behavior. As a re-
sult, separate accounts often offer greater wrap
stability when compared to commingled funds. As
another benefit, plans with a capable stable value
separate account manager have more negotiat-
ing power with regard to sponsor-driven events,
competing-option classification, and put-provision
implementation. While separate accounts may
take more time to initially establish, they often
offer a fee advantage, resulting in stronger long-
term performance.
Commingled funds offer an off-the-shelf solu-
tion for small and mid-size plans, but do so with
no customization, little negotiating power from the
plan’s perspective, and slightly higher fee levels.
Additionally, participants may be impacted by
cash flow activity from the other plans invested
in the fund. One advantage versus a separate
account structure is that a plan sponsor will not
see a potential lapse in wrap coverage due to a
sponsor-driven event. Most commingled options
are created with a mix of multiple wrap providers,
wrap types, and often multiple underlying portfolio
managers. Many insurance companies also offer
general account stable value options, where the
sponsoring insurance company is the sole insurer
of the fund. Such options tend to be offered exclu-
sively through an affiliated recordkeeping platform.
Lapse in Wrap Coverage
Sponsor-driven events, such as a
merger, layoff, bankruptcy, or re-
vised early retirement program,
may result in the loss of wrap cover-
age. Plan sponsors should discuss
such events directly with the stable
value fund provider as soon as pos-
sible, as coverage can generally be
negotiated to ensure the ability of
participants to continue to transact
at book value.
1 For an overview of investment vehicles, please see Callan’s charticle, “The Investment Vehicle Owner’s Manual,” available at www.callan.com.
DurationA measure of an
investment’s sensitivity to
changes in interest rates.

4
Return, Risk, and CostThe funds in Callan’s Stable Value Database group have exhibited similar returns to limited duration strate-
gies, such as the Barclays 1–3 Year Government/Credit Index, with risk similar to cash investments, over a
recent 10-year period (Exhibit 1).
The use of wrap contracts by stable value funds results in markedly greater return consistency than
money market funds, as can be seen against the 3-Month T-Bill Index in Exhibit 2. Stable value funds
Exhibit 1
Risk vs. Return: Stable Value Managers vs. Benchmarks
10 years ended December 31, 2015
Exhibit 2
Return Consistency: Stable Value Managers and Indices
Rolling 1-Year Returns 15 years ended December 31, 2015
3-Month Treasury
Barclays Government/Credit 1–3 Year
Barclays Treasury 1–3 Year
Barclays Government/Credit Intermediate
Barclays Aggregate
0% 1% 2% 3% 4% 5%0%
1%
2%
3%
4%
5%
Risk
Ret
urn
Individual managers in Callan’s Stable Value database
Callan Stable ValueDatabase (median)
-2%
0%
2%
4%
6%
8%
10%
12%
Callan Stable Value Database 3-Month Treasury Barclays Government/Credit 1-5 Year
Year
Tota
l Ret
urn
02 0301 04 05 06 07 08 09 10 11 12 13 14 15
Source: Callan
Source: Callan

5Knowledge. Experience. Integrity.
have underperformed money market funds in the past, but historically only for a very short period of
time. Similarly, the stable value group exhibits far less return volatility when compared to a benchmark
with a similar duration, such as the Barclays 1–5 Year Government/Credit Index.
Stable value funds issue investors a periodic return known as a “crediting rate.” This rate, which is pub-
lished as an effective annual yield figure, is usually credited to the stable value fund on an ongoing basis.
The crediting rate is similar to the interest earned on a money market fund and is based upon the market
value, book value, yield-to-maturity, and duration of the underlying assets. The calculation is designed to
amortize the difference between the book value (purchase price) and the market value (current price) of
the underlying portfolio over time. Crediting rates are directly related to the interest rate environment, and
thus it is not surprising to see a downward trend over the last seven years (Exhibit 3). However, stable
value funds continue to offer a substantial yield advantage versus money market funds.
Exhibit 3
Median Crediting Rates
Seven years ended December 31, 2015
0%
1%
2%
3%
4%
5%
Median crediting rate
2009 2010 2011 2012 2013 2014 2015
10th to 90th percentile crediting rate
Crediting RateA periodically adjusted
rate similar to an effective
annual yield.
Market-to-Book Ratio
Market-to-book ratio is simply the ratio of the market value of the underlying assets to the book value of
the stable value portfolio. It is commonly used to measure the overall health of a stable value portfolio,
and the degree to which the portfolio has a market value shortfall (or insufficient funds to meet par-
ticipant investments). It is not uncommon for a stable value fund to have a market-to-book ratio below
100% for a short period of time due to market value fluctuations. Stable value funds experiencing such
valuations should be closely monitored, as the portfolio manager must explain and defend any market
value fluctuations that result in a deficiency. Stable value funds that do not experience positive ratio
improvement over time require further investigation.
Source: Callan

6
The stable value
industry has widely
accepted the 3-Month
Treasury bill as a
benchmark.
Comparing Stable Value BenchmarksMeasuring stable value performance can prove challenging, as there is not a perfect benchmark solution
that represents a “stable” investment option. Available options include cash or money market bench-
marks, broad market benchmarks, and peer group comparisons. These options each have pros and cons,
and Callan recommends a combination of benchmarks to address the individual options’ shortcomings.
1. Cash or money market benchmarks have a similar risk profile but different return profile than
stable value funds as their underlying investments are very different. The stable value industry
has widely accepted the 3-Month Treasury bill as a benchmark. DOL rule 404(a)(5)2 mandated the
use of “… an appropriate, broad-based securities market index …” for investment strategies, and
the 3-Month Treasury Bill Index meets this standard. As such, the majority of commingled stable
value fund fact sheets have selected this index. Cash/money market benchmarks are defensible as
they represent the return a participant is forgoing by investing in stable value rather than a money
market fund. In addition to the 3-Month Treasury Index, Lipper and iMoneyNet offer money market
index options.
Pros
• Risk level is expected to be very similar
• The 3-Month Treasury benchmark is trans-
parent, investable, and known in advance
• Cash-based indices are popular when it
comes to participant reporting
Cons
• Underlying investments are different
• Return mismatch can be extreme (particu-
larly in a low interest rate environment)
• Constant maturity Treasury and iMoneyNet/
Lipper benchmarks are not investable
2. Broad market benchmarks are defensible, but they are difficult to utilize because finding a perfect
match for stable value is difficult. Broad market, fixed income benchmarks experience market value
fluctuation, and thus these benchmarks do not reflect the impact of wrap contracts. Additionally, most
have quality and sector characteristics vastly divergent from stable value funds. Investors have con-
sidered the Barclays Intermediate Aggregate or Barclays Intermediate Government/Credit Indices
as potential options. However, the Barclays Intermediate Aggregate includes too much MBS/CMBS
exposure (35%), and the Barclays Intermediate Government/Credit includes too much credit (35%).3
Barclays developed the Stable Income Market Index (SIMI) in 2010 as a potential benchmark for the
stable value market. It was designed to mimic the shorter-maturity, higher-quality profile of stable value
portfolios. However, it too lacks book value/amortized cost basis and often differs from existing funds
on a sector allocation basis. Market acceptance of this index has been minimal, in our observation.
2 United States. Department of Labor. Employee Benefits Security Administration. (2012). Fiduciary Requirements for Disclosure in Participant-Directed Individual Account Plans (Section 2550.404a-5).
3 For a comprehensive look at fixed income indices, please see Callan’s annual “Fixed Income Benchmark Review,” available at www.callan.com.

7Knowledge. Experience. Integrity.
Stable value managers may create custom blends of off-the-shelf Barclays benchmarks, such as a
blend of 50% Barclays 1–3 Year Government/Credit, 35% Barclays Intermediate Government/Credit,
and 15% Barclays 3-Month Treasury. However, such blends suffer from inconsistency versus the
underlying security makeup of a stable value fund for benchmarking purposes, and again have no
correction for the impact of wrap contracts.
Pros
• Broad market benchmarks are widely avail-
able, investable, defensible, and transparent
Cons
• Lack of book-value wrap coverage/amor-
tized-cost adjustments
• Volatility may be much higher, leading to a
risk mismatch and participant confusion
• Most off-the-shelf indices offer a quality or
sector mismatch
3. Peer group comparisons offer another solution. However, they are not truly investable in that one
cannot “buy” the median performance. Callan recommends comparing performance versus the Callan
Stable Value Database group, as it includes the majority of institutionally viable stable value strategies.
Pros
• Compares fund performance against other
publicly available stable value funds
Cons
• Peer groups lack true “investability,” as
one cannot directly invest in the median
• Can be difficult to implement for participant
reporting purposes
Because no single benchmark provides an ideal solution, Callan recommends a combination of a cash/
money market benchmark (e.g., 3-Month Treasury bill) and a peer group comparison (e.g., the Callan
Stable Value Database group) to evaluate performance. A cash/money market benchmark should be used
for participant reporting purposes. This will allow the plan sponsor to evaluate its stable value option ver-
sus peers while participants will be able to gauge performance versus a typical money market alternative.
Recent Stable Value TrendsThe 2008 market crisis shook the capital markets, creating unforeseen consequences across asset
classes. Stable value was no exception, with most funds facing an increase in wrap fees, wrap providers
exiting the market, duration limits, and credit rating constraints that were previously rare. In 2013, the
marketplace witnessed yet another year of metamorphosis, as several new wrap providers entered the
marketplace improving overall capacity. Most of the commingled vehicles that had been closed to new as-
sets for several years were reopened. Increased competition from new entrants to the wrap marketplace
has stabilized fees in the range of 22–26 basis points, and also improved investment guideline flexibility.
The persistent low interest rate environment has resulted in a widespread decline in crediting rates.
However, stable value continues to offer a positive yield premium over money market funds. Callan
continues to believe stable value is an attractive alternative for eligible investors seeking a capital pres-
ervation option.
Most of the commingled
vehicles that had been
closed to new assets
for several years have
been reopened.

8
Nonetheless, investors should be aware of issues that influence stable value prices and availability.
1. Current rate environment: Interest rates remain historically low, directly impacting crediting rates.
Stable value funds continue to offer a substantial yield premium over money market funds, which
are subject to regulations specifying investment in very short-dated securities. If interest rates were
to rise sharply over a short period of time, investors could experience a period during which money
market funds out-yield their stable value alternatives. Such periods have historically been very short.
2. Uncertain regulatory environment: As part of the Dodd-Frank Wall Street Reform and Consumer Pro-
tection Act, the Securities and Exchange Commission (SEC) and the Commodity Futures Trading Com-
mission (CFTC) were tasked with determining if stable value wrap contracts should be considered
“swap agreements” and thus fall under CFTC regulation. To date, no decision has been made. All signs
have pointed to the CFTC and SEC ultimately deciding against the regulation of wrap contracts, but this
is still to be determined. Current contracts will not be impacted, regardless of the final decision.
3. Commingled funds are open for business: After the 2008 credit crisis, numerous banks and other
financial institutions exited the wrap marketplace. This forced many stable value commingled funds
to close to new investors, due to their inability to obtain additional wrap coverage. New entrants to
the wrap marketplace, in particular insurance companies, have vastly improved this dynamic. At this
point, all of the pooled funds tracked by Callan are again accepting new deposits.
Wrap Market and Fees With the exit of numerous wrap providers post-2008, wrap fees rose substantially (Exhibit 4). In our ob-
servation, new wrap issuance falls in the 25–30 basis point range, much higher than the 8–10 basis point
range seen in 2008. The recent increase in competition in the form of new entrants into the wrap space
has resulted in overall wrap fees paid by most funds stabilizing in the 22–25 basis point range. In particu-
lar, insurance companies have become very competitive with their wrap coverage pricing.
The addition of new entrants into the space appears to have slowed the increase in fees, and anecdotal
evidence points to a general willingness to negotiate both guideline restrictions and various expenses.
Separate accounts continue to have far greater success in obtaining attractive wrap coverage.
5
10
15
20
25
30
Median wrap fee (bps)
2009 2010 2011 2012 2013 2014 2015
23.0 bps 22.0 bps
19.0 bps
10th to 90th percentile wrap fee (bps)Exhibit 4
Median Wrap Fees
Seven years ended December 31, 2015
Source: Callan

9Knowledge. Experience. Integrity.
Highlights of Recent Trends• Commingled funds reopen: With the recent influx of insurance companies offering wrap coverage, nu-
merous commingled funds that were previously closed have reopened to new investors. Some provid-
ers extended put provisions from one to two years, but the majority of the market retained a one-year,
put-provision time frame.
• Duration has dipped slightly: After stable value funds experienced volatility in 2008, wrap providers
pushed for tighter guidelines. Duration has typically been capped at a maximum of three years, often
as low as two-and-a-half years. Wrap providers currently have a keen eye set on minimizing interest-
rate risk, and thus duration caps are common.
• Market-to-book ratios have improved: Market-to-book ratio, which measures the overall health of a stable
value fund, plummeted during the financial crisis. As the fixed income market recovered, so did market-to-
book ratios. For the last three years, Callan has only observed one single stable value commingled fund
within our database with a market-to-book deficit. The median market-to-book ratio was 100.56% as of
December 31, 2015 (Exhibit 5).
• Crediting rates dipped to historic lows: The current interest rate environment pushed the median credit-
ing rate to just over 1.50% in mid-2014, but it climbed slightly to 1.78% as of December 31, 2015. Tight-
er investment guidelines, as negotiated by wrap providers, have also had an impact on crediting rates.
Callan anticipates these rates will remain range-bound in the 1.50%–2.00% space in the near term.
• Fee disclosure has improved, but issues remain: Stable value funds have vastly improved fee disclo-
sure in recent years, and wrap fees are now fully disclosed by most funds. However, the lack of fee
transparency in traditional GICs artificially lowers the published wrap fees of those stable value funds
that utilize them extensively. Additionally, insurance companies that offer stable value products backed
by their general accounts tend to publish fees that are not fully transparent.
90%
95%
100%
105%
110%
Median market-to-book ratio 10th to 90th percentile market-to-book ratio
2009 2010 2011 2012 2013 2014 2015
Exhibit 5
Median Market-to-Book Ratio
Seven years ended December 31, 2015
Source: Callan

10
ConclusionWhen DC plan sponsors are selecting a capital preservation vehicle, stable value funds remain an
attractive alternative to money market funds. Their historical yield advantage, coupled with consistent
book-value accounting, results in an investment that is well suited for the risk-averse investor. While
we are in a period of interest rate uncertainty, investors should expect market-value-to-book-value
ratios to decline in a rising interest rate environment. It would not be surprising to see a period where
the market-to-book ratios across stable value strategies remained below 100% for a period of time.
Nevertheless, investors should not be concerned about a broad-based decline in market-to-book ratios
resulting from a rising interest rate environment. Insulation from declining market values due to interest
rate volatility is exactly why stable value funds are so popular. Additionally, a rising rate environment
will ultimately allow stable value managers to reinvest in securities with higher coupon payments, and
thus should benefit investors through higher crediting rates over time. Callan continues to believe that
stable value is a strong investment option for a well-rounded DC plan.
Insulation from market
value volatility due to
interest rate movements
is exactly why stable
value funds are so
popular as a capital
preservation option.
Key Facts about Stable Value Funds: A Summary• Stable value funds are a capital preservation investment option within qualified DC and tuition
savings plans. They are expected to function as a low-risk investment vehicle that offers a
better return relative to traditional money market funds while exhibiting less volatility than most
bond funds.
• By mixing traditional fixed income securities and insurance contracts along with book value wrap
contracts, stable value funds can offer principal protection.
• Issued by insurance companies and other financial institutions, book value wrap contracts are
used to minimize the effects of market value fluctuation due to changes in interest rates.
• A crediting-rate formula based upon amortization of market gains and losses on underlying
bonds determines quarterly returns for many funds.
• Traditionally, stable value has offered a return premium over money market funds, as stable
value managers have the ability to invest in securities with maturities longer than 90 days.
11Knowledge. Experience. Integrity.
About the AuthorSteven J. Center, CFA, Steven J. Center, CFA, is a Senior Vice President in Callan’s
San Francisco Fund Sponsor Consulting office. His responsibilities include client service,
investment manager reviews, performance evaluation, research and continuing educa-
tion, business development, and coordinating special client proposals and requests.
Steve joined Callan in 2010 as a Vice President and fixed income investment consultant
in Callan’s Global Manager Research group. Steve is a member of Callan’s Manager Search Committee
and a shareholder of the firm.
Prior to joining Callan in 2010, Steve held positions at Wurts & Associates, Alan Biller & Associates, and
Wilshire Associates.
Steve earned an MBA with Honors from the Michael G. Foster School of Business at the University of
Washington and a BA in Economics from the University of California, Irvine. Steve has earned the right
to use the Chartered Financial Analyst designation and is a member of CFA Institute and the CFA Society
of Seattle.
Certain information herein has been compiled by Callan and is based on information provided by a variety of sources believed to be reliable for which Callan has not necessarily verified the accuracy or completeness of or updated. This report is for informational purposes only and should not be construed as legal or tax advice on any matter. Any investment decision you make on the basis of this report is your sole responsibility. You should consult with legal and tax advisers before applying any of this information to your particular situation. Reference in this report to any product, service or entity should not be construed as a recommendation, approval, affiliation or endorsement of such product, service or entity by Callan. Past performance is no guarantee of future results. This report may consist of statements of opinion, which are made as of the date they are expressed and are not statements of fact. The Callan Investments Institute (the “Institute”) is, and will be, the sole owner and copyright holder of all material prepared or developed by the Institute. No party has the right to reproduce, revise, resell, disseminate externally, disseminate to subsidiaries or parents, or post on internal web sites any part of any material prepared or developed by the Institute, without the Institute’s permission. Institute clients only have the right to utilize such material internally in their business.
If you have any questions or comments, please email [email protected].
About CallanCallan was founded as an employee-owned investment consulting firm in 1973. Ever since, we have
empowered institutional clients with creative, customized investment solutions that are uniquely backed
by proprietary research, exclusive data, ongoing education and decision support. Today, Callan advises
on more than $1.8 trillion in total assets, which makes us among the largest independently owned invest-
ment consulting firms in the U.S. We use a client-focused consulting model to serve public and private
pension plan sponsors, endowments, foundations, operating funds, smaller investment consulting firms,
investment managers, and financial intermediaries. For more information, please visit www.callan.com.
About the Callan Investments InstituteThe Callan Investments Institute, established in 1980, is a source of continuing education for those in
the institutional investment community. The Institute conducts conferences and workshops and provides
published research, surveys, and newsletters. The Institute strives to present the most timely and relevant
research and education available so our clients and our associates stay abreast of important trends in the
investments industry.
© 2016 Callan Associates Inc.

Corporate Headquarters
Callan Associates600 Montgomery Street Suite 800San Francisco, CA 94111800.227.3288415.974.5060
www.callan.com
Regional Offices
Atlanta800.522.9782
Chicago800.999.3536
Denver855.864.3377
New Jersey800.274.5878