Embed Size (px)
Citation preview

1
The National Development Agenda: Priorities, Challenges and Status
Online Course on “Localizing Poverty Reduction Targets”
09 June 2015Silliman University
6/9/2015

2
The Philippine Development Plan 2011-2016 Midterm Update
A roadmap to inclusive growth
6/9/2015

What is inclusive growth?• It is growth that is rapid
enough to matter, given the country’s large population, geographic differences, and social complexity
• It is sustained growth that creates jobs, draws the majority into the economic and social mainstream, and reduces poverty.
PDP 2011-2016: A roadmap to inclusive growth

What makes inclusive growth elusive?
o Inadequate infrastructureo Major gaps and lapses in governanceo Inadequate levels of human developmento A poor and degraded state of environment and natural
resources

How shall we achieve inclusive growth?
Massive investment in physical infrastructure
Transparent and responsive governance
Investment in the country’s human resources
Creating more and better employment opportunities

What have we accomplished so far? Economic performance remains strong despite disasters and global
uncertainties. Reforms in tax collection, revenue administration, and expenditure
management have provided considerable resources to fund new initiatives and expand existing ones.
The country enjoys a high level of confidence among local and international business community.
Increased investments in fixed assets, along with the revival of manufacturing subsector, suggest that quality employment will continue to increase in the future.
Present government’s solid political legitimacy and relatively stable peace situation allows it to institute wide-ranging economic and social reforms.

What have we learned?• Good governance is an effective platform upon
which strategies should be implemented.• Macroeconomic and political stability fuels
positive expectations that lead to growth.• Development strategies need to consider spatial
and sectoral dimensions to ensure inclusivity.• Economic growth is necessary but not sufficient
for poverty reduction.• Disasters can reverse the gains and even push
back development.

PDP Midterm Update Chapters1. A roadmap to inclusive growth
2. Macroeconomic policy
3. Competitive and innovative industry & services sectors
4. Competitive and sustainable agriculture & fisheries sector
5. Resilient and inclusive financial system
6. Social development
7. Good governance and the rule of law
8. Peace and security
9. Sustainable and climate-resilient environment and natural resources
10. Accelerating infrastructure development

NATIONAL SECURITY GOOD GOVERNANCE
Macroeconomic stability
Access to financingScience, tech
and innovation
Education, skills and health of
workforce
InfrastructureInvestments
Jobs
Rapid and sustained economic growth
Equal development opportunities,sustainable and climate-resilient environment
(Spatially, sectorally focused strategies)
Poverty reduction in multiple dimensions,massive quality employment creation
ECOLOGICAL INTEGRITY
INCLUSIVE GROWTH
Market demandCompetitiveness of productive
sectors
8 7
6
2
3, 4
9
105
3, 4
3, 4,2,
3,
5
9
6, 9
4, 6,
3, 4,2, 5

Spatial considerations
• Geography is an important determinant of the quality of human life because it facilitates or obstructs access to opportunities for improving one’s conditions. – Physical distance– Quality of natural environment that causes one to be healthy or
sickly; less or more vulnerable to disasters– Quality of institutions that may encourage of stifle private
initiative• It is important to understand local conditions and identify
constraints to development.
10

Addressing the specific constraints faced by the poor
I – provinces with highest
number of the poor
II – provinces with highest
proportion of the poor
III – provinces prone to multiple
hazards
• Rapid growth opportunities exist but not for the poor
• In-migrants are attracted but they cannot participate in the growth process as well
• Very remote, sparsely populated
• Limited growth opportunities
• Confronted by conflict and/or frequent disasters
• Prone to multiple hazards
PDP 2011-2016: A roadmap to inclusive growth

Addressing the specific constraints requires different strategiesI – provinces with highest
number of the poor
II – provinces with highest
proportion of the poor
III – provinces prone to multiple
hazards
• Create more growth opportunities
• Undertake skills training, employment facilitation
• Encourage flexible work arrangements
• Promote economic mobility of labor through human capital and infrastructure development
• Link residents to the value chain
• Strengthen peace-building efforts
• Capacitate officials and residents on disaster risk-reduction strategies
• Promote income diversification
• Expand social protection and insurance
PDP 2011-2016: A roadmap to inclusive growth

Province Region Number of poor households
Zamboanga del Sur
Region IX: Western Mindanao 170,181
Cebu Region VII: Central Visayas 151,425
Pangasinan Region I: Ilocos Region 148,601Negros Occidental
Region VI: Western Visayas 138,664
Camarines Sur Region V: Bicol 136,208
Leyte Region VIII: Eastern Visayas 132,377
Iloilo Region VI: Western Visayas 122,770
Sulu ARMM 122,218
Quezon Region IV-A: CALABARZON 122,139
Davao del Sur Region XI: Davao Region 111,655
Source: National Household Targeting System for Poverty Reduction (DSWD, 2010)
Provinces with high magnitude of poor households (Category 1)

Provinces with the highest poverty incidence (Category 2)
Province Region Poverty Incidence (%)
Lanao del Sur Autonomous Region in Muslim Mindanao
73.8
Maguindanao Autonomous Region in Muslim Mindanao
63.7
Eastern Samar Region VIII: Eastern Visayas
63.7
Apayao Cordillera Administrative Region
61.4
Zamboanga del Norte
Region IX: Western Mindanao
54.4
Camiguin Region X: Northern Mindanao
53.6
Saranggani Region XII: SOCCSKSARGEN
53.2
North Cotabato Region XII: SOCCSKSARGEN
52.4
Masbate Region V: Bicol 51.3Northern Samar
Region VIII: Eastern Visayas
50.2
Source: National Statistical Coordination Board (2012)Note: National average of poverty incidence is at 25.2 percent.

Region ProvinceRegion V: Bicol AlbayRegion V: Bicol CatanduanesRegion VI: Western Visayas AntiqueRegion VI: Western Visayas IloiloRegion VII: Central Visayas BoholRegion VIII: Eastern Visayas Eastern SamarRegion VIII: Eastern Visayas LeyteRegion VIII: Eastern Visayas Northern SamarRegion VIII: Eastern Visayas Southern LeyteRegion IX: Western Mindanao Zamboanga del SurRegion IX: Western Mindanao Zamboanga SibugayRegion XIII: Caraga Dinagat IslandsRegion XIII: Caraga Agusan del SurRegion XIII: Caraga Surigao del NorteRegion XIII: Caraga Surigao del Sur
Provinces exposed to multiple hazards (Category 3)Region Province
Region I: Ilocos Ilocos NorteRegion I: Ilocos Ilocos SurCordillera Administrative Region AbraCordillera BenguetRegion II: Cagayan Valley CagayanRegion II: Cagayan Valley QuirinoRegion II: Cagayan Valley IsabelaRegion II: Cagayan Valley Nueva VizcayaRegion III: Central Luzon ZambalesRegion III: Central Luzon PampangaRegion III: Central Luzon AuroraRegion IV-A: CALABARZON CaviteRegion IV-A: CALABARZON LagunaRegion IV-A: CALABARZON RizalRegion IV-A: CALABARZON Quezon
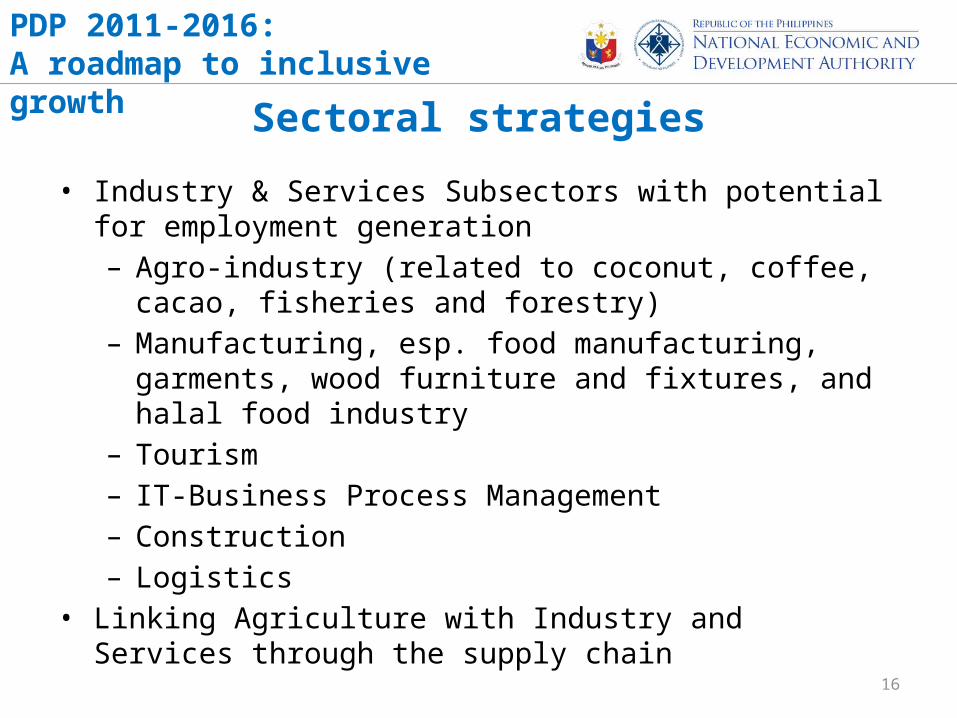
Sectoral strategies
• Industry & Services Subsectors with potential for employment generation– Agro-industry (related to coconut, coffee, cacao, fisheries and
forestry)– Manufacturing, esp. food manufacturing, garments, wood
furniture and fixtures, and halal food industry– Tourism– IT-Business Process Management– Construction – Logistics
• Linking Agriculture with Industry and Services through the supply chain
16
PDP 2011-2016: A roadmap to inclusive growth

Plan implementation and monitoring
• The overall development of the country is ultimately a product of the dynamism of the private sector. The role of government is to set the necessary policy and regulatory framework and provide public goods and services to catalyze private initiative and encourage efficiency improvements.
• PDP implementation calls for convergence of agency programs and coordination among agencies at different levels, as well as the private sector and development partners.
• The Planning Committees constituted to update the Plan will monitor welfare outcomes and implementation progress as indicated in the Results Matrices.
• The NEDA Secretariat will prepare Socioeconomic Report.
17
PDP 2011-2016: A roadmap to inclusive growth

Social DevelopmentSector Accomplishments and Strategies
18

Challenges
The country is at risk of not meeting some of the targets specified in the MDG and PDP• Reducing poverty• Maternal deaths• Prevalence of underweight children below 5 yrs of age• Undernourishment of families• Improving educational achievement rates
19

Strategic Framework
20

Major Strategies
• Health and nutrition status improved– Provide health care to all: Kalusugan Pangkalahatan (Universal
Health Care)• Achieve health-related MDGs by scaling-up promising preventive
and promotive health programs and improving health-seeking behavior among the most vulnerable population;
• Improve financial risk protection by expanding national health insurance coverage and benefits; and
• Ensure quality of service by investing in facility infrastructure and equipment, as well as improving clinical and management processes, and regulating the quality of care provided.
21

Major Strategies
• Knowledge and skills enhanced– Provide complete and quality basic education– Develop workforce competencies and life skills through TVET– Make higher education competitive and responsive to national
development goals
22

Major Strategies
• Social protection expanded– Enhance the targeting system by identifying the “near
poor”/vulnerable and knowing their used– Enhance social protection and insurance for vulnerable groups– Set up convergence mechanisms at all levels
• Access to secure shelter expanded– Provide a menu of housing options/assistance– Build strong partnerships with stakeholders– Pursue the policy agenda for socialized housing
23

RESULTS MATRIXIndicators Baseline (2010) End-of-Plan
target (2016) Assumptions and risks
Sector outcome: Improved Human Capabilities Assumptions: Cooperation of
families/households in the implementation of health programs is ensured
Commitments and capacities of the LGUs to deliver basic services and provide the supply requirements are strengthened
The Responsible Parenthood and Reproductive Health Act of 2012 (RA 10354) is fully implemented
Full realization of the incremental revenues from the Sin Tax Reform Law (RA 10351) to increase funding for Universal Health Care (UHC)
Continued improvement in the country's economic performance
Risks: Changes in political leadership,
particularly at the Local Government Units (LGUs)
Competing priorities of the LGUs Occurrence of natural disasters
and armed conflicts Emergence of new diseases/new
strain facilitated by globalization Rapid urbanization putting strain
to public health services in the urban areas
Subsector outcome A: Improved Health and Nutrition Status
Maternal Mortality Ratio per 100,000 live births decreased 221(2011)
50
Infant mortality rate per 1,000 live births decreased (%) 22(2011)
17
Under-five mortality rate per 1,000 live births decreased (%)
30(2008)
25.5
Prevalence of underweight children under-five decreased (per 1,000 live births)
20.2(2011)
12.7
Contraceptive prevalence rate increased (all methods) 48.9(2011)
65
Proportion of births attended by professional increased 72.2(2011)
90
Proportion of births delivered in facility increased 52.2(2011)
85
Malaria mortality rate per 100,000 population decreased (%)
0.01(2011)
<0.03
Malaria morbidity rate per 100,000 population decreased (%)
9.5(2011)
6.6
TB case detection (all forms )increased 82(2012)
85
HIV prevalence decreased Less than 1% of population (2012)
Less than 1% of population
Proportion of population with access to safe water (HH in %) increased
83(2011)
88
Proportion of population with access to sanitary toilet (HH in %) increased
91.6(2011)
>92
National Health Insurance Program (NHIP) coverage rate increased (in %)
72(2012)
95
Proportion of households with per capita intake below 100% dietary energy requirement decreased (in%)
66.9(2008)
32.8
24

RESULTS MATRIXIndicators Baseline (2010) End-of-Plan target
(2016) Assumptions and risks
Sector outcome: Improved Human Capabilities Assumptions: Appropriate budget allocation
provided to the concerned agencies
Improved participation of stakeholders such as LGUs, private sector and the community in meeting the targets
Risk: Inability of households to
send pupils/students to school due to poverty, peace and order concerns, natural calamity and other factors
Subsector outcome B: Knowledge and Skills EnhancedNet enrolment rate increased
Kindergarten 57.2 100Elementary 95.9 99Secondary 64.7 71
Adjusted net enrolment rate increasedElementary 98.5 99Secondary 92.5 99
Completion rate increasedElementary 72.1 83Secondary 75.1 80
Cohort survival rate increasedElementary 74.2 83Secondary 79.4 85
Achievement rate increasedElementary 68.2 77Secondary 47.9 65
Certification rate in TVET increased 82.9 87.5TVET graduates increased 1,344,371 1,383,026Higher education graduates increased 498,418 601,505Higher education faculty with MA (%) increased 38.87 65Higher education faculty with PhD(%) increased 11.09 30Higher education institutions with accredited program increased 19.89 35
National passing percentage (across disciplines) in licensure exams (%) 33.91 52.53 25

RESULTS MATRIX
Indicators Baseline (2010)End-of-Plan target
(2016) Assumptions and risks
Sector outcome: Vulnerabilities Reduced
Assumption: Coordination between
local governments, DSWD and PhilHealth in providing coverage
Risks: Lack of local funding of
competing LGU priorities Low utilization of coverage
Subsector outcome C: Social protection expanded
Percentage of poor families covered by PhilHealth as identified under the NHTS-PR and LGU Sponsored Program
88.7 100
Subsector outcome D: Access to secure shelter expanded
Assumption: Passage of the
Department of Housing and Urban Development (DHUD) Bill
Percentage of housing needs met 22.5 25.84
Share of socialized housing to housing target improved
56.78 77.77
26

Plan Implementation
• Monitored through the NEDA-Social Development Committee (SDC) and the Human Development and Poverty Reduction Cabinet Cluster (HDPRC)
• Lead agencies:– Department of Health (DOH)– Department of Education (DepEd)– Department of Social Welfare and Development
(DSWD)– Housing and Urban Development Coordinating
Council (HUDCC)
27

28
The National Development Agenda: Priorities, Challenges and Status
Online Course on “Localizing Poverty Reduction Targets”
09 June 2015Silliman University
6/9/2015