Embed Size (px)
Citation preview
THE MAGIC DOJI
INTRODUCTION
Doji is considered a very significant reversal indicator in candlesticks technical analysis. A Doji occurs when the open and close for that session are the same or very close to being same. The length of shadows can vary. The perfect doji has the same opening and closing price, yet there is flexibility to this rule. If the opening and closing price are within a few ticks of each other, the line could still be considered a doji. But how to decide whether it’s a near doji day or not is very subjective and there are no rigid rules for it.
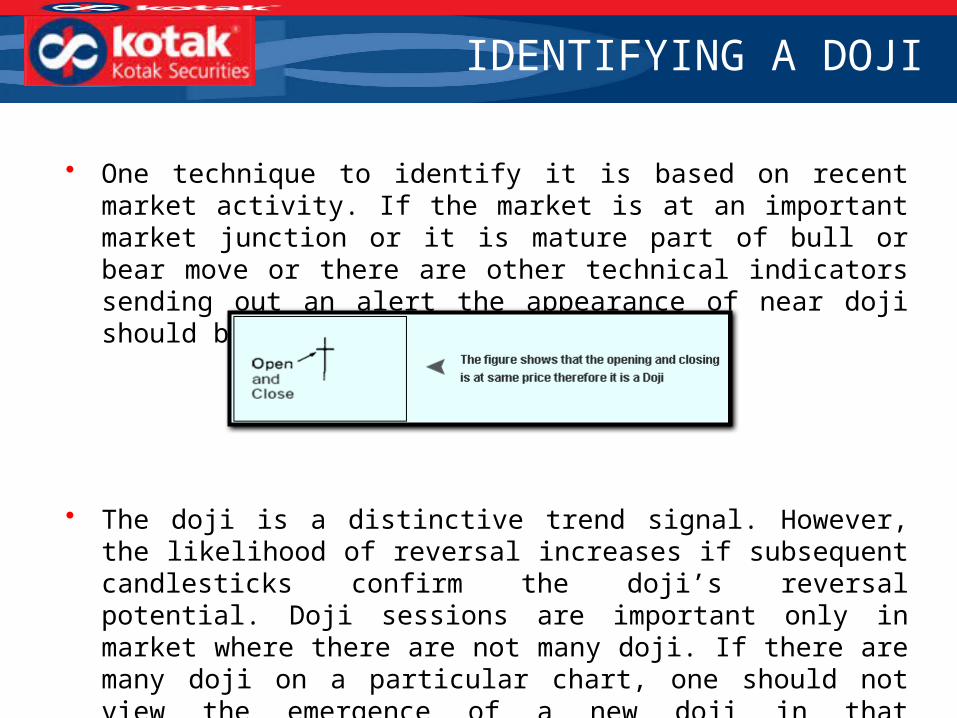
• One technique to identify it is based on recent market activity. If the market is at an important market junction or it is mature part of bull or bear move or there are other technical indicators sending out an alert the appearance of near doji should be treated as a doji.
• The doji is a distinctive trend signal. However, the likelihood of reversal increases if subsequent candlesticks confirm the doji’s reversal potential. Doji sessions are important only in market where there are not many doji. If there are many doji on a particular chart, one should not view the emergence of a new doji in that particular market as a meaningful development .
IDENTIFYING A DOJI
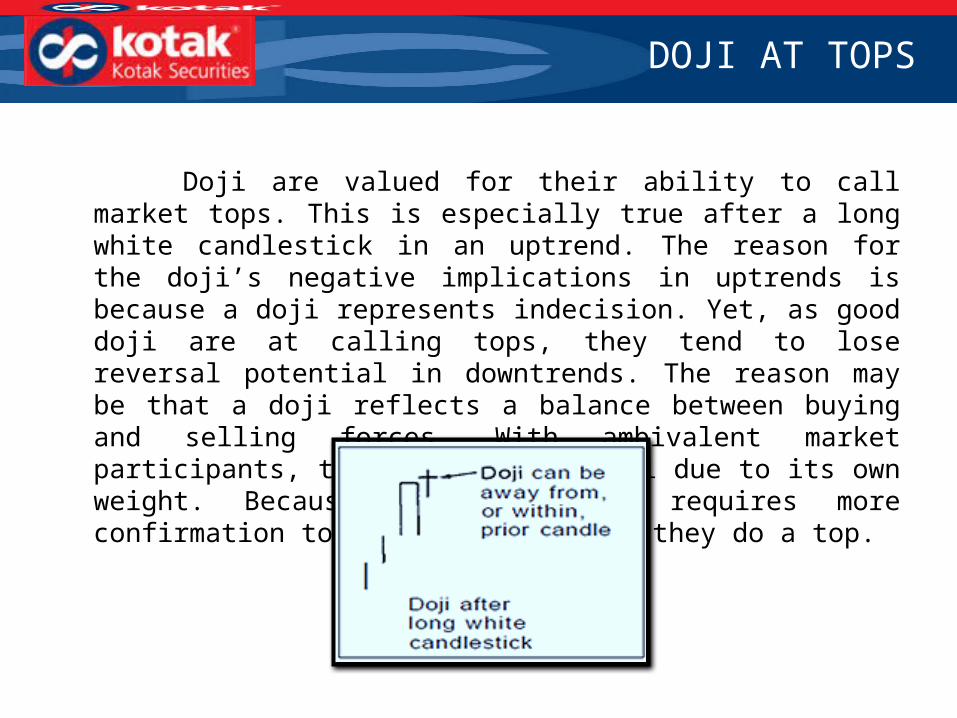
Doji are valued for their ability to call market tops. This is especially true after a long white candlestick in an uptrend. The reason for the doji’s negative implications in uptrends is because a doji represents indecision. Yet, as good doji are at calling tops, they tend to lose reversal potential in downtrends. The reason may be that a doji reflects a balance between buying and selling forces. With ambivalent market participants, the market could fall due to its own weight. Because of this doji requires more confirmation to signal bottom than they do a top.
DOJI AT TOPS
TYPES OF DOJI
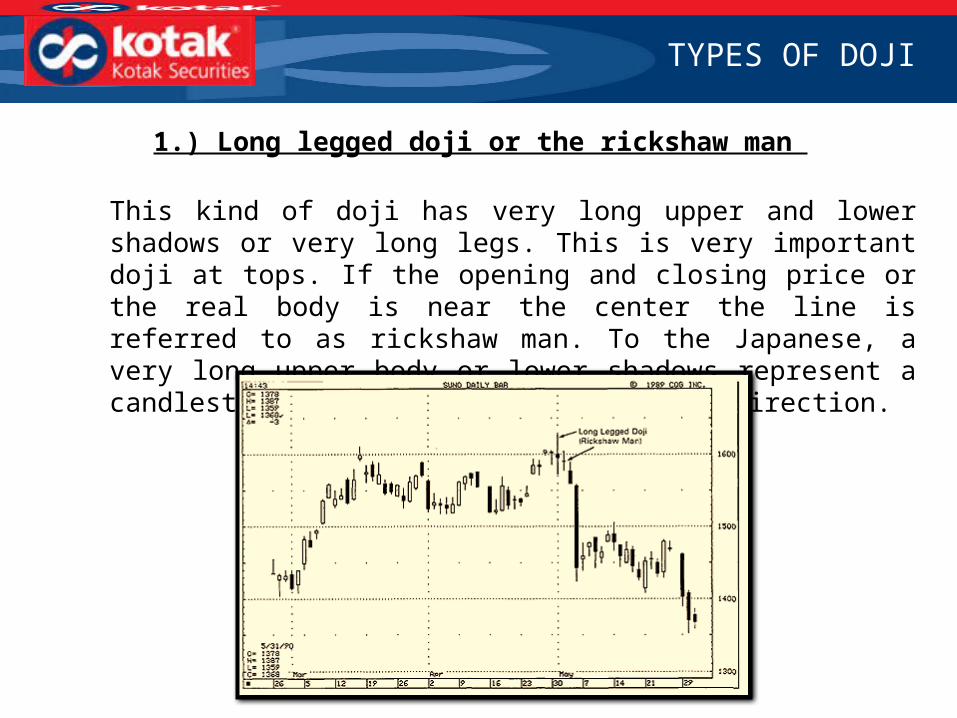
1.) Long legged doji or the rickshaw man
This kind of doji has very long upper and lower shadows or very long legs. This is very important doji at tops. If the opening and closing price or the real body is near the center the line is referred to as rickshaw man. To the Japanese, a very long upper body or lower shadows represent a candlestick that has lost its sense of direction.
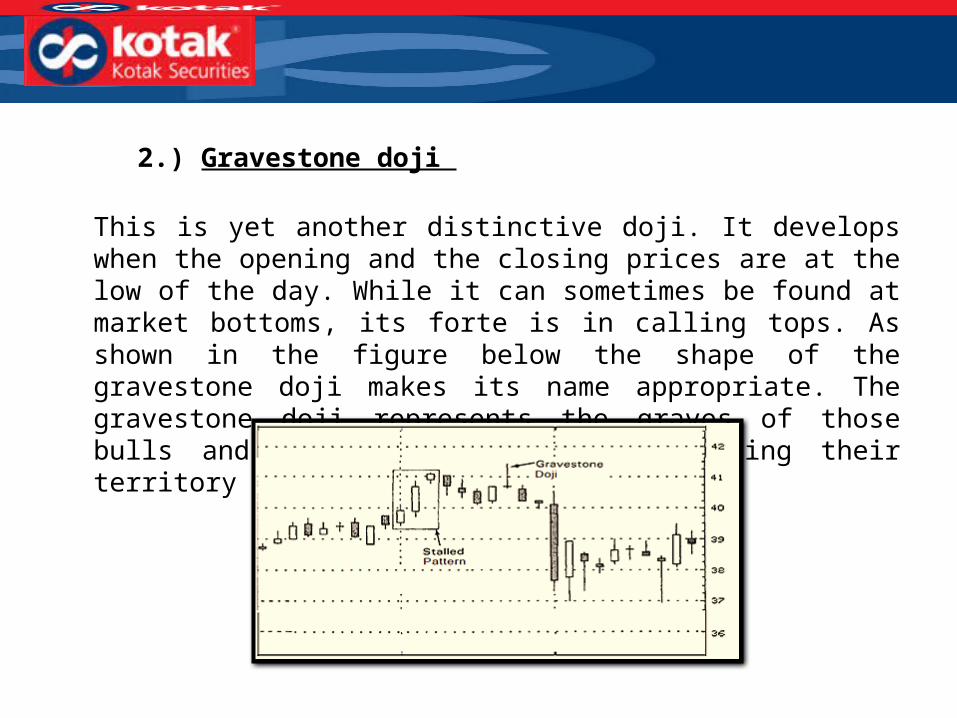
2.) Gravestone doji
This is yet another distinctive doji. It develops when the opening and the closing prices are at the low of the day. While it can sometimes be found at market bottoms, its forte is in calling tops. As shown in the figure below the shape of the gravestone doji makes its name appropriate. The gravestone doji represents the graves of those bulls and bears who have died defending their territory
3.) Simple doji or near day doji
It is the most simplest of doji which has very close opening and closing prices or very near opening or closing prices.
DOJI AS SUPPORT AND RESISTANCE
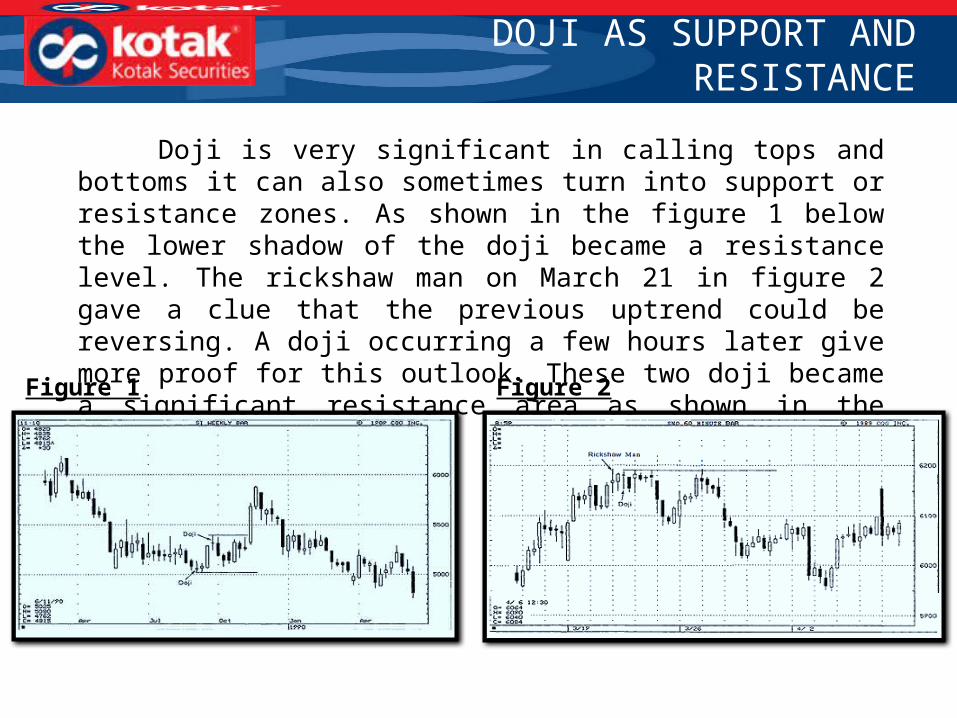
Doji is very significant in calling tops and bottoms it can also sometimes turn into support or resistance zones. As shown in the figure 1 below the lower shadow of the doji became a resistance level. The rickshaw man on March 21 in figure 2 gave a clue that the previous uptrend could be reversing. A doji occurring a few hours later give more proof for this outlook. These two doji became a significant resistance area as shown in the figure.
Figure 1 Figure 2
CONCLUSION
Doji is of utmost importance in candlesticks studies and are significant in reversal patterns. They are very useful in calling market tops thus they should be treated with utmost care in identifying trend reversal.

Thank You!
And give us your Feedback
OR
If you have any questions click on any of these -
FacebookWebsite
Open an account
We hope you liked, what you read. Our research team can help you trade better
with us and get access to our great research
Read More
• Registered office: Kotak Securities Limited, 1st Floor, Bakhtawar, 229, Nariman Point, Mumbai - 400021. SEBI Registration No: NSE INB/INF/INE 230808130, BSE INB 010808153/INF 011133230/INE 011207251, OTC INB 200808136, MCXSX INE 260808130.
• Disclaimer: Investments in securities are subject to market risks, please read the SEBI prescribed Combined RDD prior to investing.
• * Awarded Best Brokerage Firm in India by AsiaMoney in 2006, 2007, 2008 and 2009