Embed Size (px)
Citation preview

page 1 the sustainable competitiveness index 2016
the global
sustainable
competitiveness Index
the global
2016
GROWTH.
Integrated. Inclusive.

SolAbility page: 2
About this Report
The Sustainable Competitiveness Report, 5th edition
September 2016
Methodology, calculation, compilation, report design by SolAbility.
© SolAbility.
All artwork by Yake – www.yakepics.com
Reproduction welcome & encouraged with citation of source.
Acknowledgements
The compilation and calculation of this Index would not have been possible
without the data and time series made available by the World Bank Indicator
database, various UN agencies (UNDP, UNEP, UNICEF, FAO, WHO, WMO,
www.data.un.org), the International Monetary Fund (IMF), and other non-
governmental organisations (including Transparency International, Reporters
without Borders, The New Economics Foundation, The Institute for Economics and
Peace, and The Fund For Peace).
About SolAbility
SolAbility is an independent sustainability think-tank and advisory, with presence
in Korea and Switzerland.
SolAbility is the maker of 3 DJSI Super-Sector Leaders. We have designed and
implemented the sustainable management for GS Engineering & Construction
(DJSI Global Industry leader 2012), Korea Telecom (DJSI Global Industry Leader
2011-2013, 2015), and Lotte Shopping (DJSI Global Industry Leader 2011-2015).
SolAbility Sustainable Intelligence
Zurich, Seoul
www.solability.com

page 3 the sustainable competitiveness index 2016
SolAbility page: 4
Welcome to The Global Sustainable Competitiveness Index
5th Edition, 2016
Foreword:
Sweden. Norway. Finland. Denmark, Iceland… the top of the 5th edition of the
Global Sustainable Competitiveness is a private party of the Scandinavian Nations.
What does this mean?
The Global Sustainable Competitiveness Index (GSCI) aims to evaluate the ability to
sustain wealth creation. It is based on a competitiveness model that incorporates all
pillars of sustained growth and wealth creation: natural capital availability; national
governance (the framework in which all players operation - the outcomes of policy
directions and investments, e.g. the availability of infrastructure); intellectual capital
(innovation and business capabilities); resource efficiency, and social cohesion. The
Sustainable Competitiveness Index also integrates data trends over time to allow for
a better expression of future development potential. Apart from a few survey-based
indicators (such as TI corruption index), all indicators are quantitative, derived from
international databases (namely the World Bank). It is therefore free of ideological
bias.
There are significant differences between the Sustainable Competitiveness and
commonly used metrics for competitiveness – e.g. the WEF’s Competitiveness
rankings, or more importantly, to international credit ratings. Which raises the
question: do credit-ratings really reflect country risks, and the ability of a country to
pay back interest over time?
The GSCI is based on integrated, current and future development prospects and
risks of nations. The results aim at serving as an alternative to commonly used metrics
and measurements of competitiveness, such as the GDP or credit ratings, for
academic purposes, policy or investment decisions.
We hope you find this information useful.
SolAbility Sustainable Intelligence

Sustainable
Competitive
Natural
Capital Summary
Resource
Management
Intellectual
Capital Governance Social
Capital Spotlight Data
page 5 the sustainable competitiveness index 2016
Natural Capital Governance Intellectual Capital Resource Efficiency Social Capital Methodology Tables Summary
Table of Contents
1 THE GLOBAL SUSTAINABLE COMPETITIVENESS INDEX ........................................... 7
1.1 WHAT? ..................................................................................................................... 7
1.2 WHY? ....................................................................................................................... 8
1.3 INDEX 2016: KEY TAKEAWAYS ..................................................................................... 9
1.4 THE 2016 GLOBAL INDEX RANKINGS .......................................................................... 10
1.5 HIGHER SUSTAINABILITY EQUALS HIGHER WEALTH ........................................................... 11
2 CONVENTIONAL VS SUSTAINABLE COMPETITIVENESS ........................................ 13
2.1 SOVEREIGN BOND RATINGS & SUSTAINABILITY ............................................................. 13
2.2 WEF COMPETITIVENESS VS. SUSTAINABLE COMPETITIVENESS .......................................... 15
2.3 DEVELOPMENT STRATEGIES & SUSTAINABLE COMPETITIVENESS .......................................... 20
3 NATURAL CAPITAL .................................................................................................. 23
4 GOVERNANCE ....................................................................................................... 27
5 INTELLECTUAL CAPITAL .......................................................................................... 31
6 RESOURCE MANAGEMENT .................................................................................... 35
7 SOCIAL CAPITAL .................................................................................................... 39
8 THE SUSTAINABLE COMPETITIVENESS MODEL & INDEX METHODOLOGY ........... 43
8.1 THE SUSTAINABLE COMPETITIVENESS MODEL ................................................................ 43
8.2 COMPETITIVENESS INDICATORS .................................................................................. 46
8.3 INDEX CALCULATION ................................................................................................ 48
9 DATA TABLES ........................................................................................................... 51

Sustainable
Competitive
Natural
Capital Summary
Resource
Management
Intellectual
Capital Governance
Social
Capital Spotlight Data
SolAbility page: 6

page 7 the sustainable competitiveness index 2016
Sustainable
Competitive Summary Social
Capital
Intellectual
Capital Resource
Management Governance Spotlight Data
Sustainable
Competitiveness Natural Capital Governance Intellectual Capital Resource Intensity
Sustainable vs. WEF
Competitiveness Tables Social Cohesion
1 The Global Sustainable Competitiveness Index
The Global Sustainable Competitiveness Index (GSCI) is an index based on 109
quantitative performance indicators grouped into the 5 pillars of sustainable
competitiveness. In order to ensure complete objectivity, the GSCI is based on
measureable quantitative performance data collected by the World Bank,
various UN agencies, the IMF and OECD. Data sets have been scored both for
the current levels as well as the recent development of the indicator in order to
not only reflect current standing, but also development potential. The GSCI aims
to evaluate the ability of countries to create and sustain wealth that does not
negatively affect the underlying fundament of wealth creation, based on the
definition of Sustainable Development. The GSCI integrates all aspects that make
economies lasting successful and is not limited commonly used financial factors
(such as the GDP, or credit ratings), or other output measurements such as
expressed in the WEF’s Competitiveness Index.
The 2016 Index is, again, a Scandinavian party: all 5 top spots are occupied by
the Scandinavian economies, lead for the first time by Sweden.
1.1 What?
The Sustainable Competitiveness Model
The Sustainable Competitiveness model has been developed with
an integrated view of what characterises the current and the future
state (i.e. competitiveness) of a nation-economy. It is based on a
competitiveness model that incorporates all relevant pillars of
sustained growth and wealth creation of a nation – natural capital
availability, resource efficiency, social cohesion, government-led
development direction, and innovation and business capabilities.
The Sustainable Competitiveness Index also integrates data trends
over time to allow for a better expression of future development
potential.
The Pillars of Sustainable Competitiveness
The main pillars of the Sustainable Competitiveness Model are:
• Natural Capital: the given natural environment
within the frontiers of a country, including
availability of resources, and the level of the
depletion of those resources.
• Social Capital: health, equality, security,
freedom and life satisfaction within a country
• Resource Management: the efficiency of using
available resources (human, technology,
natural and financial resources), both domestic
and imported) as a measurement of
operational competitiveness in a resource-
constraint World.
Sustainable
Competitiveness
Sustainable competitiveness is
the ability to generate and
sustain inclusive wealth without
diminishing future capability of
sustaining or increasing current
wealth levels.

SolAbility page: 8
the sustainable competitiveness index 2016
• Sustainable Innovation: the capability of a country to generate wealth
and jobs through innovation and value-added industries in the globalised
markets
• Governance Capability: the ability of governing bodies and authorities
to provide a framework for sustained and sustainable wealth generation
Sustainable competitiveness means that current wealth levels are not in danger
of being reduced or diminished through over-exploitation of resources (i.e.
natural and human resources), the lack of innovative edge required to compete
in the globalised markets (i.e. education), or the discrimination, marginalisation
or exploitation of segments of a society.
The Global Sustainable Competitiveness Index: Measuring development,
wealth, and prosperity – inclusively.
1.2 Why?
Conventional country comparisons, rankings and ratings are based on
economic and/or financial indicators. However, economic and financial
indicators - at best - reflect current economic success; without looking at or
explaining what makes this economic success possible. They also fail to account
for current developments – financial and non-financial - that shape future
potential or decline.
In addition, economic activities have adverse side-effects on the environment
and societies: pollution and depletion of natural resources, climate change,
health impacts, inequality and impacts on the socio-cultural fabric of a country.
Neglect of these factors can diminish the very basis of current economic output
and success measured in conventional ratings.
Economic and financial indicators are therefore insufficient measurements for
risk and investment analysis – or credit ratings. In other words: “competitiveness”
in its current meaning and commonly used financial/industrial indicators are an
insufficient basis for investment decisions and policy making.
The Sustainable Competitiveness Index is based on a model that integrates
economic and financial indicators with the pillars that make the business success
possible in the first place. It is based purely on comparable and measurable
performance data collected by recognised international agencies, therefore
excluding all subjectivity.
The Sustainable Competitiveness Index was developed to measure the level of
development – and the potential for development – of a country-economy
inclusively.

page 9 the sustainable competitiveness index 2016
Sustainable
Competitive Summary Social
Capital
Intellectual
Capital Resource
Management Governance Spotlight Data
Sustainable
Competitiveness Natural Capital Governance Intellectual Capital Resource Intensity
Sustainable vs. WEF
Competitiveness Tables Social Cohesion
1.3 Index 2016: Key Takeaways
The Sustainable Competiveness Ranking 2016 reveals some surprising, and other
not-so-surprising results:
• Sweden is leading the Sustainable Competitiveness – followed by the other
Scandinavian economies
• The top 20 are dominated by Norther European countries, including the
Baltic states and Slovenia
• The only non-European countries in the top 20 are New Zealand (12) and
Japan (15)
• Germany ranks 14, the UK 21, and the World’s largest economy, the US, is
ranked 32. The US ranks particularly low in resource efficiency, but also social
cohesion. If not tackled, the combination of the two is likely to undermine
the global status of the US in the future
• Of the large emerging economies, China is ranked 37, Brazil 41, Russia 45,
and India 152.
• Asian nations (South Korea, Japan, Singapore, and China) lead the
Intellectual Capital ranking. However, achieving sustained prosperity in
these countries might be compromised by Natural Capital constraints and
current high resource intensity/low resource efficiency
• The Social Cohesion ranking is headed by Northern European
(Scandinavian) countries, indicating that Social Cohesion is the result of
economic growth combined with social consensus
The Sustainable Competitiveness World Map2016
The Sustainable Competitiveness World Map. Dark areas indicate high competitiveness, light areas low
competitiveness
Sustainable
Competitiveness

SolAbility page: 10
the sustainable competitiveness index 2016
1.4 The 2016 Global Index Rankings
Due to changes in methodology, the results of the 2016 Index cannot be directly
compared to 2015 results. 2015 ranking comparison therefor heave been
omitted for the purpose of this report. Interested stakeholders can download all
previous indexes here.
Country Ra nk Sc ore Country Ra nk Sc ore Country Ra nk Sc ore Country Ra nk Sc ore
Sweden 1 60.9 Brunei 46 46.5 Mauritius 91 42.4 Egypt 136 38.2
Norway 2 59.4 Kazakhstan 47 46.2 Vietnam 92 42.4 Vanuatu 137 38.2
Finland 3 56.2 Argentina 48 46.2 Tunisia 93 42.2 Morocco 138 38.1
Denmark 4 56.0 Suriname 49 45.8 Namibia 94 42.2 Turkmenistan 139 38.0
Iceland 5 56.0 Boliv ia 50 45.8 Tanzania 95 42.2 Togo 140 37.9
Slov enia 6 54.8 Cuba 51 45.8 Kuwait 96 42.1 Samoa 141 37.8
Switzerland 7 54.4 Mongolia 52 45.3 Philippines 97 42.0 Jamaica 142 37.8
Ireland 8 53.9 Greece 53 45.2 Mozambique 98 42.0 Bahrain 143 37.6
Luxembourg 9 53.8 Malta 54 45.2 Papua New Guinea 99 41.7 Malawi 144 37.6
Austria 10 53.8 Israel 55 45.1 Thailand 100 41.6 Sudan 145 37.5
Estonia 11 53.6 Bosnia and Herzegov ina 56 45.1 United Arab Emirates 101 41.5 Guinea-Bissau 146 37.5
New Zealand 12 53.5 Indonesia 57 45.0 Dominica 102 41.5 Iran 147 37.5
Liechtenstein 13 52.4 Bhutan 58 45.0 Dominican Republic 103 41.4 Swaziland 148 37.5
Germany 14 52.1 Bulgaria 59 44.8 Nicaragua 104 41.4 Guatemala 149 37.3
Japan 15 52.0 Singapore 60 44.7 Cyprus 105 41.2 Rwanda 150 37.1
Slov akia 16 51.8 Republic of Congo 61 44.7 Seychelles 106 41.1 Comoros 151 37.0
France 17 51.8 Chile 62 44.6 Kenya 107 40.9 India 152 36.9
Lithuania 18 51.8 Uzbekistan 63 44.6 Equatorial Guinea 108 40.7 Solomon Islands 153 36.9
Croatia 19 51.0 Ukraine 64 44.6 Bahamas 109 40.6 Guinea 154 36.9
Latv ia 20 51.0 Burma 65 44.4 Guyana 110 40.6 Bangladesh 155 36.9
United Kingdom 21 51.0 Kyrgistan 66 44.3 Trinidad and Tobago 111 40.5 Burkina Faso 156 36.8
Canada 22 50.8 Laos 67 44.2 Algeria 112 40.4 Madagascar 157 36.7
Czech Republic 23 50.8 Qatar 68 44.2 Saudi Arabia 113 40.4 South Africa 158 36.5
Belarus 24 49.2 Mexico 69 44.2 Angola 114 40.3 Honduras 159 36.5
Poland 25 49.2 Oman 70 44.1 Azerbaijan 115 40.1 Gambia 160 36.3
Australia 26 49.1 Serbia 71 44.0 Maldiv es 116 40.1 Liberia 161 36.2
Portugal 27 48.9 Ghana 72 44.0 Cape Verde 117 40.0 Uganda 162 36.2
Belgium 28 48.4 Panama 73 43.9 Fiji 118 40.0 Chad 163 35.7
Netherlands 29 48.2 Venezuela 74 43.9 El Salv ador 119 39.8 Syria 164 35.5
Peru 30 48.0 Armenia 75 43.8 Zambia 120 39.8 Pakistan 165 35.3
Romania 31 47.7 Albania 76 43.8 Lebanon 121 39.8 Afghanistan 166 35.1
USA 32 47.6 Nepal 77 43.6 St. Kitts and Nev is 122 39.6 Sao Tome and Principe 167 34.3
Malaysia 33 47.4 Belize 78 43.6 Sierra Leone 123 39.5 Djibouti 168 34.0
Costa Rica 34 47.4 Democratic Republic of Congo79 43.5 Nigeria 124 39.3 Central African Republic 169 33.6
Hungary 35 47.3 Moldov a 80 43.5 Cambodia 125 39.2 Iraq 170 33.4
Uruguay 36 47.3 Cameroon 81 43.4 Senegal 126 39.2 Barbados 171 33.3
China 37 47.2 Timor-Leste 82 43.4 Sri Lanka 127 39.0 Zimbabwe 172 33.2
Georgia 38 47.1 Gabon 83 43.3 Libya 128 39.0 Mauritania 173 33.1
Spain 39 46.9 Ethiopia 84 43.2 Botswana 129 38.9 Burundi 174 32.8
South Korea 40 46.9 Macedonia 85 43.2 Lesotho 130 38.9 Grenada 175 32.8
Brazil 41 46.9 Montenegro 86 43.1 Benin 131 38.7 Eritrea 176 32.7
Paraguay 42 46.7 Ecuador 87 43.1 Mali 132 38.6 St. Lucia 177 32.6
Colombia 43 46.7 Turkey 88 43.0 Tonga 133 38.6 Haiti 178 32.6
Italy 44 46.6 Tajikistan 89 42.7 Jordan 134 38.5 Antigua and Barbuda 179 31.0
Russia 45 46.6 Cote d'Iv oire 90 42.5 Niger 135 38.3 Yemen 180 28.6

page 11 the sustainable competitiveness index 2016
Sustainable
Competitive Summary Social
Capital
Intellectual
Capital Resource
Management Governance Spotlight Data
Sustainable
Competitiveness Natural Capital Governance Intellectual Capital Resource Intensity
Sustainable vs. WEF
Competitiveness Tables Social Cohesion
1.5 Higher sustainability equals higher wealth
Leading nations in the Sustainable Competitiveness
ranking are mostly high-income countries,
suggesting a certain correlation between
Sustainable Competitiveness score and GDP per
capita or income levels (high income = high
sustainability). The same is true when visualizing
average deviations of GDP per capita and the
sustainable competitiveness score.
While a certain similarity between GDP rankings and
sustainability levels seems to be visible, the
correlation is superficial and refuted by too many
exceptions to the rule. This indicates that the
correlation is not from GDP to sustainable
competitiveness, but rather from sustainable
competitiveness to income levels. In other words:
higher sustainable competitiveness can be
associated with higher income levels.
However, the correlation or the influence of the sustainable competitiveness on
GDP or income level is not immediate; it is time-deferred. Like every endeavour
or project, an upfront investment is required to achieve desired results at a later
stage. The seeds have to be planted, the plants
need to be cared for before the harvest can be
collected. In addition, the presence of large natural
resources allows for exploitation of the natural
capital (e.g. the oil-rich countries of the Middle East).
However, such wealth is highly unsustainable and
the wealth generated will diminish with depletion of
resources in the absence of an adequate
alternative sustainable economy and the underlying
fundament requirements to achieve sustainable
wealth that does not depend on the exploitation of
non-renewable resources.
Regional spread
Scandinavia as a region achieves the highest
Sustainable Competitiveness score, followed by
other regions in the Northern hemisphere. Central
Asia is the only region that doesn't fit into the North-
South divide. From a European perspective, it is
interesting to note that Eastern Europe achieves a
higher score than Sothern Europe (which has
nominally higher income levels). All African Regions
are in the bottom half. The high-income countries of
the Middle East have sustained their economic
success with the exploitation of their mineral
resources. The low Sustainable Competitiveness of the region raises concerns on
whether those countries will be able to maintain or sustain their development
level once there fossil fuel wealth diminishes.
0 10 20 30 40 50 60
Eastern Africa
Middle East
Southern Africa
Western Africa
Central America
Northern Africa
Central Asia
South-east Asia
South America
Southern Europe
Eastern Europe
North-east Asia
North America
Australia & New Zealand
North-western Europe
Scandinavia
GDP/capita and sustainable
competitiveness
Regional spread of
sustainable competitiveness
scores
Sustainable
Competitiveness
SolAbility page: 12
the sustainable competitiveness index 2016

page 13 the sustainable competitiveness index 2016
Sustainable
Competitive Summary Social
Capital
Intellectual
Capital Resource
Management Governance Spotlight Data
Sustainable
Competitiveness Natural Capital Governance Intellectual Capital Resource Intensity
Sustainable vs. WEF
Competitiveness Tables Social Cohesion
2 Conventional vs Sustainable Competitiveness
2.1 Sovereign Bond Ratings & Sustainability
The sovereign risk rating of a country – commonly referred to as credit rating -
determines the level of interest a country has to pay for loans and credits. It is
therefore a very important parameter for every economy – it defines the level of
capital cost for new investments, whatever the nature of those investment may
be. The credit rating also affects the risks an investor is willing to take in overseas
investments. Sovereign risk ratings are calculated by a number of rating
agencies, most notable by the “three sisters”: Moody’s S&P, and Fitch. The ratings
of these three therefore have an immense impact on the cost of capital of a
specific country.
Sovereign risks are calculated based on a mix of economic, political and
financial risks – i.e. current risks that, like GDP calculations, do not take into
account the framework that enables and defines the current situation, i.e. the
fundament of what the rating is trying to reflect. They do not look at or consider
the wider environment – the ability and motivation of the workforce, the health
and well-being and the social fabric of a society, the physical environment
(natural and man-made) that have caused the current situation. Credit ratings
describe symptoms, they do not look at the root causes. It is therefore
questionable whether credit ratings truly reflect investor risks of investing in a
specific country.
So what if sovereign bonds were rated against sust ainability?
In order to test currently applied credit ratings, the
scores of the GSCI have been converted to ratings
equivalent to credit ratings - a sustainable credit
rating. The generated grades are compared to the
average credit rating of Moody’s, S&P, and Fitch.
While there seems to be a slight initial correlation
(higher sustainability equals positive credit rating)
on first sight, there are too many exceptions to the
rules to be considered correlating. For too many
economies, in particular of developed countries,
high credit rating is not reflected in high sustainable
competitiveness score.
In the asset management world, it now has
become near-standard to integrate some form of
“ESG” into investment risk/opportunity evaluation. However, it seems the credit
rating agencies are lagging behind the financial industry in this particular aspect:
current credit ratings do exclude ESG risks and therefore do not cover all investor
risks. It is high time that credit rating agencies take into account “intangibles” in
their credit risk calculation. Credit ratings have to reflect the underlying factors
that define the future development and capability of a country to generate and
sustain wealth. It is high time that credit ratings include sustainability in their risk
calculations.
Sustainable
competitiveness scores
plotted against sovereign
credit ratings (average of
Moody’s, S&P, Fitch) show
rather limited correlation,
indicating insufficient
coverage of sustainability
risks in current risk
calculation methodologies
R² = 0.1217
25
30
35
40
45
50
55
60
5 10 15 20 25 30
Su
sta
ina
ble
co
mp
etitive
ne
ss
Credit rating
Sustainable competitiveness vs. credit ratings
Sustainable vs. WEF
Rankings

SolAbility page: 14
the sustainable competitiveness index 2016
Sustainability-adjusted credit ratings
Some countries would see significant credit ratings upgrades, other downgrades
when comparing the current credit rating with a fictional credit rating based on
sustainable competitiveness. Based on this comparison, we have calculated a
fictional sustainability-adjusted credit rating. The US, the UK and Australia would
be significantly downgraded, while countries that have low credit ratings mostly
due to political reasons (Greece, Argentina), would receive more favourable
ratings (see table for comparison of selected countries).
However, what is most interesting is the World map of upgrades and downgrades
of individual countries based on a fictional sustainability-adjusted credit rating
(see World map below): oil-rich Middle Eastern countries (Saudi Arabia, Kuwait,
etc.) would be significantly downgraded several levels, while most countries in
South America, Eastern Europe and Central Africa would receive a credit rating
upgrade.
Country Credit rating (average of
Moody's, S&P; Fitch)
GSCI rating Level
Difference
Sustainability-
adjusted rating
Level
difference
Argentina CCC+ A− 10 BB 5
Australia AAA AA− -3 AA+ -1
Austria AA+ AAA 1 AAA 1
Bolivia BB A− 5 BBB− 2
Brazil BB+ A 5 BBB+ 3
Cambodia B B+ 1 B+ 1
Canada AAA AA+ -1 AAA 0
Chile AA− BBB+ -4 A -2
China AA− A -2 A+ -1
Denmark AAA AAA 0 AAA 0
Germany AAA AAA 0 AAA 0
Greece CCC BBB+ 10 BB− 5
Iceland BBB+ AAA 7 A+ 3
India BBB− B− -6 BB− -3
Indonesia BBB− BBB+ 3 BBB 2
Italy BBB+ A 3 A− 2
Japan A+ AAA 4 AA 2
Kuwait AA BB+ -8 A− -4
Mexico BBB+ BBB -1 BBB+ 0
Netherlands AAA A+ -4 AA -2
Norway AAA AAA 0 AAA 0
Pakistan B CCC -3 CCC+ -2
Portugal BB+ AA− 7 A− 4
Russia BB+ A 5 BBB+ 3
Saudi Arabia AA BB− -10 BBB+ -5
Sweden AAA AAA 0 AAA 0
Switzerland AAA AAA 0 AAA 0
United Kingdom AA+ AA+ 0 AA+ 0
United States AAA A+ -4 AA -2
Current, sustainability and sustainability-adjusted ratings of selected countries

page 15 the sustainable competitiveness index 2016
Sustainable
Competitive Summary Social
Capital
Intellectual
Capital Resource
Management Governance Spotlight Data
Sustainable
Competitiveness Natural Capital Governance Intellectual Capital Resource Intensity
Sustainable vs. WEF
Competitiveness Tables Social Cohesion
2.2 WEF Competitiveness vs. Sustainable Competitiveness
Different interpretations of different data sets and surveys put into indexes or
rankings can open interesting new perspectives, regardless of the accuracy and
real-life relevance of the index. However, real-life relevance and correlations to
actual success factors depend on a) the source and reliability of the raw data,
and b) - maybe more importantly - the definition of “competitiveness” that
underlies a specific index. The definition or understanding of the term
“competitiveness” guides the selection of competitiveness indicators and their
analysis, i.e. the success factors according the point of view of the publishing
organisation or the individuals behind the index.
The most cited Index when it comes to national competitiveness in the WEF
(World Economic Forum) Competitiveness Index. The WEF defines
competitiveness “as the set of institutions, policies, and factors that determine
the level of productivity of a country”. It is further argues that the level of
productivity sets the level of prosperity that can be earned by an economy, as
well as the rates of return obtained by investments in an economy. Productivity
and returns of investments of an economy are considered “the fundamental
drivers of its growth rates”, leading to “a more competitive economy which is
likely to sustain growth.” Contrarily to sovereign credit ratings, the WEF’s
Competitiveness includes some social (mainly related to health care systems)
and educational aspects. However, the “sustainability-adjusted”
Competitiveness Index which also included limited environmental factors quietly
has been shelved in the new 2016-17 edition. This limited approach has three
main limitations:
• The focus on economic/financial performance aspects assumes that an
economy works within bubble, independent of its physical environment
(i.e. independent of the actual land it is built on)
• It does not take into account the ramifications of current economic
activities on the future economic development and wealth creation
capabilities
• It is based on a momentary picture in time & does not take into account
past & current developments
Through the inclusion of the so-called “non-financial” characteristics of national
economies, the Sustainable Competitiveness Index aims at developing a
broader picture of competitiveness that incorporates the normally omitted
factors, which are essential pillars of an economy that is able to sustain growth
and wealth into the future.
The WEF Report aims to “help understand of the key factors that determine
economic growth, helps to explain why some countries are more successful than
others in raising income levels, (…), and offers an important tool in the formulation
of improved economic policies and institutional reforms”. These are very noble
intentions, indeed. The interesting question is whether this holds true - in particular
whether the competitiveness index correlates to actual wealth creation
capabilities.
Sustainable vs. WEF
Rankings

SolAbility page: 16
the sustainable competitiveness index 2016
2.2.1 Data sources
An interesting – and often overlooked – characteristic of the WEF rankings is that
it is to a large extend based on a survey conducted by the WEF, named the
“Executive Opinion Survey”. The Global Sustainable
Competitiveness Index, on the other hand, is based on measurable
performance indicators derived from the World Bank and different
UN agencies.
The WEF executive opinion survey is conducted annually with the
help of partner organisations across 150 countries amongst 15’000+
respondents. The yearly responses are adjusted using a moving
and discounted average of past surveys in order to reduce
“sensitivity to the specific point in time when the survey is
administered”. In addition, answers are adjusted for the economic
structure of the country. Target respondents are business leaders
from large and small companies in each country.
While the global coverage, computing and data weighting processes seem
fairly sophisticated, there remain some question marks to a competitiveness
index that is based mainly on perception surveys:
Do “business executives” opinion’s reflect a representative picture or are
the biased through their business mind?
While “business executives” might have a clear understanding of
the business environment and its regulation in their country, do
“executives” have the same understanding of services that they
perhaps never use, such as public services, public health services,
social services, and environmental issues (all of which are part of
the survey and basis for the Competitiveness Index)?
Is a survey – regardless of whether conducted amongst
“executives” or “non-executives” – that is based on individual
perceptions rather than on facts - a reliable source to compose a
ranking?
Surveys always reflect a momentary picture in time – perception
can change very quick, and therefore have limited validity into the
future
The WEF Index and the GSCI are obviously based on two different concepts. The
Global Sustainable Competitiveness is based on quantitative and measurable
performance indicators in order to exclude, as much as possible, subjectiveness.
Considering that a large percentage of the WEF’s GCI are based on perception
and opinions of leaders, wouldn’t it be more accurate to call the resulting
ranking a “Competitiveness Perception Index” rather than “Competitiveness
Index”?
The WEF Index is manly
based on perception
(survey) of a single and
very specific group of
individuals
The Global Sustainable
Competitiveness Index is
based on measurable
and comparable
performance data
collected from reliable
sources

page 17 the sustainable competitiveness index 2016
Sustainable
Competitive Summary Social
Capital
Intellectual
Capital Resource
Management Governance Spotlight Data
Sustainable
Competitiveness Natural Capital Governance Intellectual Capital Resource Intensity
Sustainable vs. WEF
Competitiveness Tables Social Cohesion
2.2.2 Indicators
For some years, the WEF published an add-on to its index, the sustainability
adjusted Competitiveness Index based on environmental regulation and some
performance indicators.
However (and sadly), the
sustainability-adjusted index
has quietly been shelved in
the new edition of the index.
The WEF Index is therefore
now where it always was -
focused on economic and
business related indicators.
The WEF index does cover
some indicators related to
social well-being; mainly
relating to availability &
quality of health care
services.
However, the WEF index
completely neglects
environmental issues. Also,
educational and innovation
consideration of the index
are based on opinion
surveys. Evaluation of school
systems and school quality
are highly subjective matters,
and it is at least questionable
whether elite surveys reflect
the education and
innovation capabilities
adequately.
The boxes provide an
overview and comparison of
the key indicator sectors
used for the Global
Sustainable Competitiveness
Index and the WEF Index.
Sustainable vs. WEF
Rankings

SolAbility page: 18
the sustainable competitiveness index 2016
2.2.3 Index comparison
There are certain similarities, but also striking differences between the rankings of
the Sustainable competitiveness Index and the WEF Index. A general
observation is that the WEF
Index shows a fairly high
correlation to current GDP
levels – countries with a
current high GDP output
also rank high on the WEF
Index, and vice versa. This
correlation is also visible for
the GSCI, but to a much
lesser extent, and with
significant exceptions. For
example countries of the
Middle East whose output
and wealth is based on oil
rank (comparably) high on
the WEF Index, but rather
low on the GSCI. Saudi
Arabia, Kuwait and Qatar
e.g. are all in the top 20%
according to the WEF
Index, but in the lower 40s
(Qatar & Kuwait) and even
60s (Saudi Arabia) in the
GSCI. The same applies for
some of the largest
economies: the US is
ranked 3rd (top 2%) in the
WEF Index, but only 32 (top
16%) in the GSCI.
Many developing
countries, on the other
hand, are ranking
significantly higher on the
GSCI than compared to
the WEF; most likely
because the GSCI also
takes into account the
development potential
based on the countries tangible and intangible resources. The same is true for
most Eastern European economies, and, in particular, for the Baltic countries.
Rank Percentile ranking
Country GSCI WEF +/- GSCI WEF +/-
Sweden 1 6 +5 1 4 +3
Norway 2 11 +9 1 8 +7
Finland 3 10 +7 2 7 +5
Denmark 4 12 +8 2 9 +7
Iceland 5 27 +22 3 20 +17
Slovenia 6 56 +50 3 41 +38
Switzerland 7 1 -6 4 1 -3
Estonia 11 30 +19 6 22 +16
New Zealand 12 13 +1 7 9 +2
Germany 14 5 -9 8 4 -4
Japan 15 8 -7 8 6 -2
Slovakia 16 - n/a 9 n/a n/a
France 17 21 +4 9 15 +6
Lithuania 18 35 +17 10 25 +15
Latv ia 20 49 +29 11 36 +25
United Kingdom 21 7 -14 12 5 -7
Canada 22 15 -7 12 11 -1
Czech Republic 23 31 +8 13 22 +9
Poland 25 36 +11 14 26 +12
Australia 26 22 -4 14 16 +2
Portugal 27 46 +19 15 33 +18
Belgium 28 17 -11 16 12 -4
Netherlands 29 4 -25 16 3 -13
USA 32 3 -29 18 2 -16
Costa Rica 34 54 +20 19 39 +20
China 37 28 -9 21 20 -1
Spain 39 32 -7 22 23 +1
South Korea 40 26 -14 22 19 -3
Brazil 41 81 +40 23 59 +36
Italy 44 44 - 24 32 +8
Argentina 48 104 +56 27 75 +48
Boliv ia 50 121 +71 28 88 +60
Greece 53 86 +33 29 62 +33
Singapore 60 2 -58 33 1 -32
Qatar 68 18 -50 38 13 -25
Turkey 88 55 -33 49 40 -9
Saudi Arabia 113 29 -84 63 21 -42
India 152 39 -113 84 28 -56
Comparison of GSCI and the
WEF Index rankings. Due to
the different number of
countries in the two indexes,
percentile rankings are more
meaningful than absolute
rankings
Green indicates higher
rankings in the GSCI as
compared to the WEF; blue
lower

page 19 the sustainable competitiveness index 2016
Sustainable
Competitive Summary Social
Capital
Intellectual
Capital Resource
Management Governance Spotlight Data
Sustainable
Competitiveness Natural Capital Governance Intellectual Capital Resource Intensity
Sustainable vs. WEF
Competitiveness Tables Social Cohesion
The WEF vs Sustainable Competitiveness: Recap
The comparison of methodologies and empirical analysis of correlations with
wealth levels and new wealth creation (growth and growth rate changes as
measured in GDP or GNI per capital) leads to 4 major observations:
The data sources: the WEF index is based on qualitative opinion surveys (“the
executive survey”). While the high global number of respondents should lead to
a representative picture, it is questionable whether opinion surveys based on a
small bandwidth of the population (“the executives”) are a true reflection of the
respective quality and/or performance – in particular when it comes to non-
business aspects such as quality of public services (education, health, policing),
or environmental matters. Reliance on data, on the other hand, would require
exact and accurate data, which in turn requires the availability of data and
application of streamlined data accounting across all countries – which, at this
point in time, cannot be guaranteed for all relevant sustainable performance
data.
The selection of indicators: the WEF Competitiveness Index is based on the notion
that “competitiveness” is based on economic performance and drivers that
enhance economic performance (infrastructure, education, and regulations
that affect businesses). In recognition that such economic activities might not be
fully sustainable (i.e. not the sole ingredients of competitiveness in the longer
term), the WEF has been developing a “sustainable competitiveness”
framework. It is sad that – however limited this framework was – that this efforts
have been shelved.
High correlation to current GDP: The WEF Competitiveness shows a distinctive
correlation to current GDP levels under exclusion of any environmental or
equality indicators. The WEF ranking-GDP correlation also holds true in instances
where current high GDP levels have been achieved mainly through the
exploitation of natural resources (e.g. the fossil-rich states in the Middle East). In
other words: the Competitiveness Report is a ranking of past achievements and
current wealth of nations. This is not necessarily a sign of competitiveness, i.e. a
country's capability to sustain and increase wealth in the future.
Low correlation to new wealth creation (growth and changes of growth rates):
empiric analysis of the WEF competitiveness scores and actual growth rates
(measured in GDP or GNI) shows little correlation, and even less so to changes in
growth rates. The Competitiveness Report aims to identify components of
competitiveness and serve as tool for policy making to increase competitiveness,
and due to the “brand-value” and international media presence is probably one
of the most recognised indexes. However, there is no statistical (empiric)
evidence that would support the notion that competitiveness - as defined
through the selection of components by the WEF Index - actually lead to new or
higher growth. Comparative analysis with the Sustainable Competitiveness Index
suggests that full integration of sustainability factors yields a higher correlation to
growth and growth changes, i.e. the capability to sustain or create new growth,
the definition of future competitiveness.
Of course we believe that Sustainable Competitiveness Index is a better
evaluation of a nation-economy…
Sustainable vs. WEF
Rankings

SolAbility page: 20
the sustainable competitiveness index 2016
2.3 Development strategies & sustainable competitiveness
The World is still recovering from the fallout of the financial crisis 2007/2008 (or
about to fall into another bust, as some observers suggest. So what is “sustainable
competitiveness” in the face of the global current situation look, and what are
lessons to be taken away, based on the sustainable competitiveness elements?
The availability and state of natural capital does not affect short-term
economic development or recovery – unless the capital in question is oil
or other commodities in demand on the global market. Exploitation of
natural resources (natural capital) can of course bring short-term
economic benefits, but is often accompanied by diminishing the basis of
future development (e.g. in the case of forest exploitation)
Resource intensity is cost. The higher the resource efficiency, the higher
the competitiveness of an economy. However, resource intensity is not
directly linked to short-term economic development. While resource
usage is increasing with initial development, efficiency tends to increase
with higher development and investments. However, economic decline
(as has occurred in Greece since 2010), leads to lower resource
consumption.
Social capital is negatively affected by economic decline, while the
correlation of development and increasing social capital is less straight-
forward. A declining economy leads to fewer financial resources
available for social capital aspects (health, community development,
integration), and leads to higher criminality as well as individual despair –
both of which negatively affect the competitiveness of a nation-
economy on the long term.
There seems to be a fairly direct connection of Intellectual capital
availability and positive/negative economic development. All countries
that have cut investments (including, but not restricted to, innovation,
R&D and education), have seen a slower recovery or even further
decline since the financial crisis – and vice versa. While it may look
sensible at first glance to cut expenditure to reduce deficits, this strategy
obviously does not work, because it also cuts the required base to kick-
start growth. It is unsustainable competitive, i.e. not sustainable
competitive. It also goes to show what sustainable competitiveness
means: analysing the likely outcome of measurements before they are
implemented – i.e. calculating not only the cuts, but also the cost of cuts.
A majority of policy makers these days seem to be blind to the long-term
cost of cuts. Unbelievable as that sounds – they do not look ahead.
The analysis of individual indicators suggests a fairly straightforward
connection between the Governance framework provided to the
economy: countries who cut investments (infrastructure, general
investments), countries with a large (uncontrolled) domestic financial
investment markets, and a low industrial base have all declined more
and recovered slower than countries with higher investments, smaller
domestic financial markets and a better industrial base. It also seems
straightforward that a steep increase of financial market size in short term
seems to be the indication of an imminent burst of a bubble.

page 21 the sustainable competitiveness index 2016
Sustainable
Competitive Summary Social
Capital
Intellectual
Capital Resource
Management Governance Spotlight Data
Sustainable
Competitiveness Natural Capital Governance Intellectual Capital Resource Intensity
Sustainable vs. WEF
Competitiveness Tables Social Cohesion
Why are ideologies sti ll dictating policy making?
As consultants, we are used to look at different possibilities free of sympathy for
a single option. We analyse what works best, is most efficient, and least costly in
implementation and maintenance, and base recommendations and tools
based on this analysis.
It is shocking that – 27 years after the fall of the Wall (famously declared as the
end of history, i.e. the end of ideological fights) - political policy and decision
making is more based on ideologies and believes, and not on facts and analysis.
Controversial political debates nowadays seem to be even more based on
ideologies and/or theories, rather than experiences. Ideological thinking seems
to be even more rigid these days than in the days of the Cold War. The debates
and discussion on how to deal with the fall-out (let alone the cause) of the
financial crises is marred by ideologically driven assumptions. In some circles,
questioning the wisdom of the markets or asking about the long-term cost of
investment & spending cuts is akin to be outed as a deep-red communist and/or
parasite. The other side of the spectrum also seems to be lacking a coherent
recipe to manage the changing realities with an over-focus on corporate
bashing, and relying on calls for solidarity to deal with the complexity of today’s
World.
Regardless of what side of the argument the policy is coming from – what is
astonishing is the fact that in this modern world, policy decisions are based on
ideologies rather than analytics that take into account the wider horizon and
past experiences, both successful and unsuccessfully, to find workable efficient
solution to whatever the challenge may be. Sustainable competitiveness
research suggests
Not many lessons of 2007/2008 has been implemented. De-regulated
financial markets where capital flows in and out, always to the promise
of the highest possible short-term return, are a recipe for instability,
ceaselessly absorbing huge resources to manage (let alone repair) the
damage of bursting small and bigger bubbles in the financial markets
caused by over-expectations and over-investments, constantly and
negatively affecting all other markets (i.e. real economic activities). A
complete decoupling of financial markets and the productive economy
is therefore required. Gambling is okay, as long as the bet is not the real
economy. The financial markets in their current form are a threat to
wealth creation.
A sound industrial (productive and/or manufacturing) base is required for
long-term development and sustainable wealth creation. This in term
requires investments – in infrastructure, technology, R&D, innovation,
efficiency, education. Of course, throwing money at something per se
will not do. Investments have to be conducted and managed wisely,
based on proper analysis that foresees all possible implications and side-
effects. Sustainable competitiveness analysis.
Sometimes it is market tools that are most efficient, sometimes it is incentives,
sometimes regulations. Whatever works best – in most cases a combination of
the above – should be applied. What we need is more analytics, and less
ideology. We don’t need theories, and we definitely need less ideologies - we
need solutions that work. Analysis, scenario planning and experiences from the
past, both successful and unsuccessful, should guide policy making, and not
believes, theories and ideologies.
Sustainable vs. WEF
Rankings

SolAbility page: 22
the sustainable competitiveness index 2016

page 23 the sustainable competitiveness index 2016
Sustainable
Competitive Summary Social
Capital
Intellectual
Capital Resource
Management Governance Spotlight Data
Sustainable
Competitiveness Natural Capital Governance Intellectual Capital Resource Intensity
Sustainable vs. WEF
Competitiveness Tables Social Cohesion
3 Natural Capital
The Natural Capital of a country is defined by the natural physical environment.
The Natural Capital model incorporates the essence of resources available that
allow a country to be completely self-sustaining: land, water, climate,
biodiversity, food production and capacity, and energy and mineral resources.
In addition, the level of depletion or degradation of those resources that could
endanger future self-sufficiency are taken into account to reflect the full picture
of the available natural capital.
The number of data points related to natural capital available from a variety of
sources is nearly endless. The main challenge is to select the most relevant and
meaningful indicators amongst the wealth of available data. In order to define
meaningful and relevant, the core issues affecting the sustainable use of natural
capital have been defined in the natural capital model below:
Natural capital indicators
Based on the definition of the key natural capital areas, data series are chosen
as indicators that reflect the sustainable competitiveness of a country based on
its natural resources (natural capital).
The indicators have been analysed for the latest data point available as well as
their development over time, reflecting the current status and the future outlook
of Natural Capital availability (environmental sustainability) in relation to the size
and population of a country. In addition, indictors that measure the depletion or
degradation of the natural resources have been taken into account. The
combination of these indicators reflect the current status as well as the ability to
sustain the population and the national economy.
As some of the above key areas are difficult to express in numerical values, some
quantitative scores compiled by UN agencies have been used for certain
indicators, such as biodiversity potential, resource depletion, and the ecological
footprint.
For the full list of indicators used, please refer to the methodology section.
Key elements of
competitiveness drivers in the
Natural Capital Sub-Index
Natural Capital

SolAbility page: 24
the sustainable competitiveness index 2016
Natural Capital - the neglected fundament
Natural capital is the very basis on which a country is built: its physical
environment and conditions. The ability to sustain the existing natural capital is
composed of two main factors: the characteristics of the given geography and
climate, combined with the extent of human activities that have or will affect
the ability of natural capital to sustain the population and the economy.
A nation’s natural capital is a given value – it is as it is – i.e. there are limitations
to human ability to improve or change the available natural capital. While it
takes little to impair or exploit the natural capital, rebuilding or improving natural
capital factors is difficult, and requires significant time and resources.
Natural Capital Ranking Observations
High-ranking countries are characterised by abundant water availability – which
is equally the source of a rich biodiversity.
Many of the highest scoring countries are located in tropical areas, underscoring
the overarching importance of the availability of sufficient water. While these
countries currently may lack social, intellectual and governance capital, their
Natural Capital would allow them to develop sustainable competitiveness over
time. A certain correlation with the level of human activities and population
density can also be observed: large countries with a comparably small
population density and rich biodiversity are on top of the Natural Capital ranking
(North America, Scandinavia, Brazil).
The top ten of the natural capital ranking sees some surprising and less well
known countries like Congo, Bhutan, Cameroon, Suriname, Guyana, and Laos,
whereas the OECD’s representation in the top twenty is limited to Sweden,
Canada, New Zealand and Iceland. The low rankings of India (173) and China
(155) are affected by a combination of arid climate, high population density and
depletion levels, raising concerns over those countries’ ability to self-sustain their
large populations in the absence of well-planned counter-measurements.
The Natural Capital World Map. Dark areas indicate high, light areas low levels of natural capital

page 25 the sustainable competitiveness index 2016
Sustainable
Competitive Summary Social
Capital
Intellectual
Capital Resource
Management Governance Spotlight Data
Sustainable
Competitiveness Natural Capital Governance Intellectual Capital Resource Intensity
Sustainable vs. WEF
Competitiveness Tables Social Cohesion
Global Natural Capital Rankings
Scores and rankings of the level of Natural Capital by country:
Country Ra nk Sc ore Country Ra nk Sc ore Country Ra nk Sc ore Country Ra nk Sc ore
Democratic Republic of Congo1 70.9 Mali 46 53.5 Togo 91 45.3 Rwanda 136 36.8
Sweden 2 67.6 Austria 47 53.5 Dominica 92 45.2 Sri Lanka 137 36.5
Canada 3 66.5 Timor-Leste 48 53.3 Indonesia 93 44.8 Syria 138 36.4
Finland 4 66.3 Guinea-Bissau 49 53.0 Vanuatu 94 44.8 Egypt 139 36.2
Suriname 5 65.9 Slov enia 50 52.9 Ukraine 95 44.6 Benin 140 35.6
Estonia 6 65.4 Chile 51 52.5 Albania 96 44.2 Oman 141 35.6
Cameroon 7 65.4 Switzerland 52 52.4 Japan 97 44.2 Kenya 142 35.4
Bhutan 8 65.3 Nicaragua 53 52.1 Spain 98 44.1 Grenada 143 35.3
Guyana 9 64.7 Australia 54 52.0 Lesotho 99 43.4 Tonga 144 35.3
Laos 10 63.8 Georgia 55 51.9 Czech Republic 100 43.0 Niger 145 35.1
Republic of Congo 11 63.0 Bosnia and Herzegov ina 56 51.6 Comoros 101 43.0 Senegal 146 35.1
Papua New Guinea 12 62.8 Slov akia 57 51.3 Malawi 102 42.8 Botswana 147 35.0
Equatorial Guinea 13 62.0 Fiji 58 51.3 Tajikistan 103 42.8 Iran 148 35.0
New Zealand 14 62.0 Zambia 59 51.2 Trinidad and Tobago 104 42.6 Saudi Arabia 149 34.9
Norway 15 62.0 Denmark 60 51.0 Nigeria 105 42.5 Belgium 150 34.8
Cote d'Iv oire 16 61.9 Liechtenstein 61 50.5 Uzbekistan 106 42.2 Burundi 151 34.7
Russia 17 61.1 Ecuador 62 50.5 Cuba 107 42.2 Djibouti 152 34.6
Paraguay 18 60.9 Mozambique 63 50.2 St. Kitts and Nev is 108 42.1 Thailand 153 34.6
Brazil 19 60.2 Malaysia 64 49.9 Libya 109 42.1 South Korea 154 34.4
Latv ia 20 60.2 Portugal 65 49.8 Chad 110 41.9 China 155 34.3
Venezuela 21 59.9 Liberia 66 49.5 Namibia 111 41.8 Philippines 156 34.0
Lithuania 22 59.6 Bahamas 67 49.2 Cape Verde 112 41.6 Turkmenistan 157 33.6
Central African Republic 23 59.5 Mexico 68 49.2 Guatemala 113 41.5 Qatar 158 33.0
Iceland 24 59.5 Sudan 69 49.0 Burkina Faso 114 40.6 Iraq 159 33.0
Burma 25 59.3 Montenegro 70 48.9 Vietnam 115 40.3 United Arab Emirates 160 32.8
Uruguay 26 58.8 Romania 71 48.7 El Salv ador 116 40.3 Maldiv es 161 32.0
Belarus 27 58.7 Brunei 72 48.6 Honduras 117 39.9 Israel 162 31.9
Peru 28 58.0 Serbia 73 48.4 Uganda 118 39.9 Eritrea 163 30.7
Sierra Leone 29 57.9 Samoa 74 48.4 Algeria 119 39.8 Antigua and Barbuda 164 30.5
Angola 30 57.9 Luxembourg 75 48.2 Germany 120 39.8 Barbados 165 30.5
USA 31 57.2 Greece 76 48.1 Zimbabwe 121 39.7 Kuwait 166 29.6
Bulgaria 32 57.2 Poland 77 48.1 Netherlands 122 39.6 Pakistan 167 29.5
Guinea 33 56.9 Ethiopia 78 47.9 United Kingdom 123 39.5 Azerbaijan 168 29.0
Argentina 34 56.6 Costa Rica 79 47.7 Armenia 124 38.9 Lebanon 169 28.6
Boliv ia 35 56.4 Gambia 80 47.0 Mongolia 125 38.7 Malta 170 28.5
France 36 56.3 Ghana 81 46.8 Sao Tome and Principe 126 38.6 Yemen 171 28.4
Colombia 37 56.2 Swaziland 82 46.7 Mauritania 127 38.6 Tunisia 172 28.3
Belize 38 56.0 Kazakhstan 83 46.5 Seychelles 128 38.5 India 173 28.2
Madagascar 39 55.5 Italy 84 46.4 Mauritius 129 38.2 Haiti 174 27.8
Solomon Islands 40 55.3 Dominican Republic 85 46.3 Turkey 130 37.7 Singapore 175 26.3
Croatia 41 55.2 Cambodia 86 46.0 Afghanistan 131 37.5 Jamaica 176 26.2
Gabon 42 54.5 Macedonia 87 45.9 St. Lucia 132 37.4 Bahrain 177 24.9
Ireland 43 54.0 Nepal 88 45.9 South Africa 133 37.4 Cyprus 178 24.7
Tanzania 44 53.9 Kyrgistan 89 45.4 Moldov a 134 37.2 Bangladesh 179 24.3
Panama 45 53.6 Hungary 90 45.4 Morocco 135 36.9 Jordan 180 20.2
Natural Capital

SolAbility page: 26
the sustainable competitiveness index 2016
page 27 the sustainable competitiveness index 2016
Sustainable
Competitive Summary Social
Capital
Intellectual
Capital Resource
Management Governance Spotlight Data
Sustainable
Competitiveness Natural Capital Governance Intellectual Capital Resource Intensity
Sustainable vs. WEF
Competitiveness Tables Social Cohesion
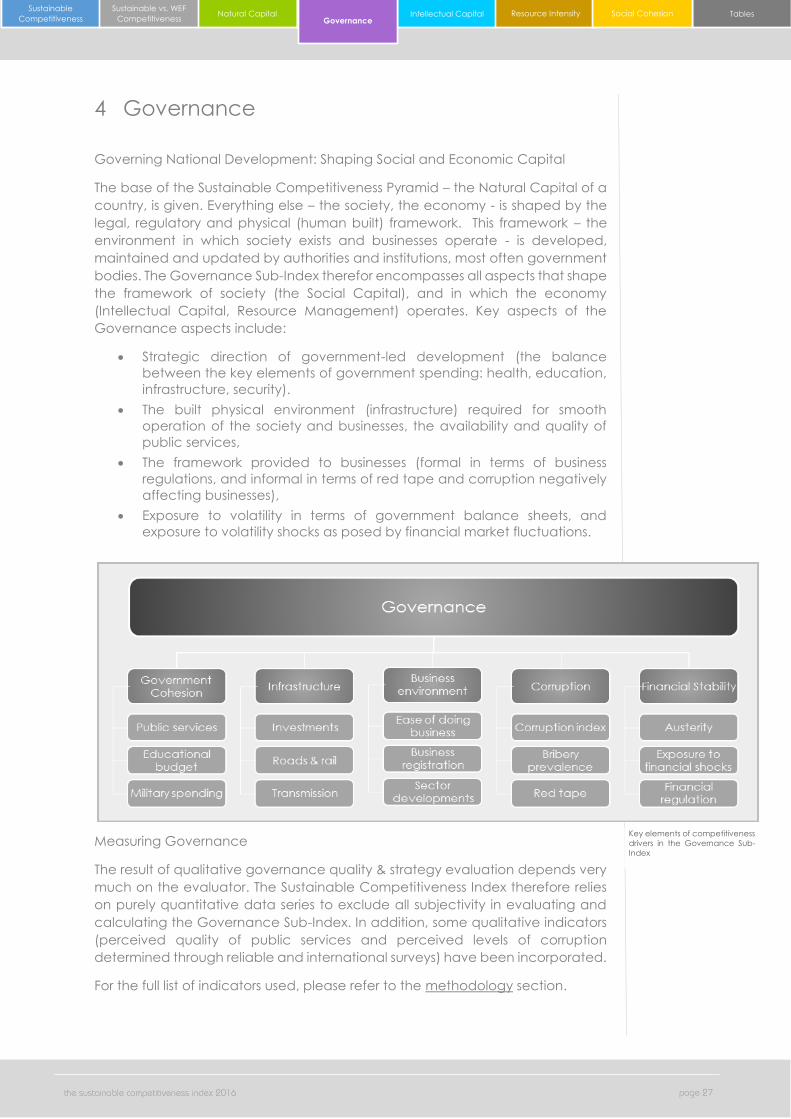
4 Governance
Governing National Development: Shaping Social and Economic Capital
The base of the Sustainable Competitiveness Pyramid – the Natural Capital of a
country, is given. Everything else – the society, the economy - is shaped by the
legal, regulatory and physical (human built) framework. This framework – the
environment in which society exists and businesses operate - is developed,
maintained and updated by authorities and institutions, most often government
bodies. The Governance Sub-Index therefor encompasses all aspects that shape
the framework of society (the Social Capital), and in which the economy
(Intellectual Capital, Resource Management) operates. Key aspects of the
Governance aspects include:
Strategic direction of government-led development (the balance
between the key elements of government spending: health, education,
infrastructure, security).
The built physical environment (infrastructure) required for smooth
operation of the society and businesses, the availability and quality of
public services,
The framework provided to businesses (formal in terms of business
regulations, and informal in terms of red tape and corruption negatively
affecting businesses),
Exposure to volatility in terms of government balance sheets, and
exposure to volatility shocks as posed by financial market fluctuations.
Measuring Governance
The result of qualitative governance quality & strategy evaluation depends very
much on the evaluator. The Sustainable Competitiveness Index therefore relies
on purely quantitative data series to exclude all subjectivity in evaluating and
calculating the Governance Sub-Index. In addition, some qualitative indicators
(perceived quality of public services and perceived levels of corruption
determined through reliable and international surveys) have been incorporated.
For the full list of indicators used, please refer to the methodology section.
Key elements of competitiveness
drivers in the Governance Sub-
Index
Governance

SolAbility page: 28
the sustainable competitiveness index 2016
The Governance World Map
The Governance Sub-Index of the Sustainable Competitiveness Index is based
on quantitative data series – i.e. not qualitative evaluation of government
systems. In addition, some aspects of government direction implications (such as
human rights, freedom of press, etc.) are assigned to the Social Capital Index.
The Governance Sub-Index aims at evaluating the suitability of a country’s
regulatory framework and infrastructure environment to facilitate sustainable
competitiveness. The regulatory and infrastructure framework should enable a
framework in which the country’s natural, social and intellectual capital can
flourish to generate new and sustain existing wealth.
Observations on the Governance ranking include:
The Governance Ranking is topped by Estonia, followed by Indonesia.
China is ranked 6
The highest ranked European country is Germany (4), followed by Estonia
(6), Norway (7), and Iceland (8).
The USA is ranked 19, while the UK is somewhat left behind at 88.
Most African nations are also ranked low
South America scores above average in this on this Sustainable
Competitiveness Sub-Index
The Governance World Map. Dark areas indicate high, light areas low levels of Governance quality
page 29 the sustainable competitiveness index 2016
Sustainable
Competitive Summary Social
Capital
Intellectual
Capital Resource
Management Governance Spotlight Data
Sustainable
Competitiveness Natural Capital Governance Intellectual Capital Resource Intensity
Sustainable vs. WEF
Competitiveness Tables Social Cohesion
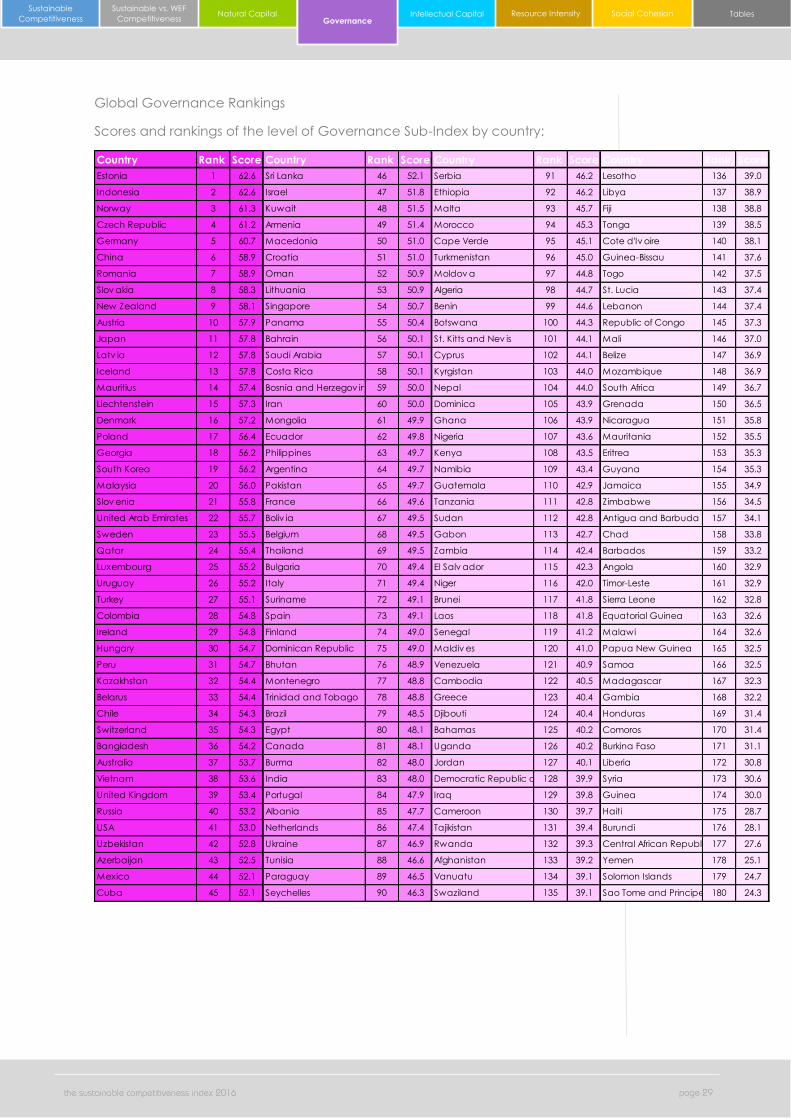
Global Governance Rankings
Scores and rankings of the level of Governance Sub-Index by country:
Country Rank Score Country Rank Score Country Rank Score Country Rank Score
Estonia 1 62.6 Sri Lanka 46 52.1 Serbia 91 46.2 Lesotho 136 39.0
Indonesia 2 62.6 Israel 47 51.8 Ethiopia 92 46.2 Libya 137 38.9
Norway 3 61.3 Kuwait 48 51.5 Malta 93 45.7 Fiji 138 38.8
Czech Republic 4 61.2 Armenia 49 51.4 Morocco 94 45.3 Tonga 139 38.5
Germany 5 60.7 Macedonia 50 51.0 Cape Verde 95 45.1 Cote d'Iv oire 140 38.1
China 6 58.9 Croatia 51 51.0 Turkmenistan 96 45.0 Guinea-Bissau 141 37.6
Romania 7 58.9 Oman 52 50.9 Moldov a 97 44.8 Togo 142 37.5
Slov akia 8 58.3 Lithuania 53 50.9 Algeria 98 44.7 St. Lucia 143 37.4
New Zealand 9 58.1 Singapore 54 50.7 Benin 99 44.6 Lebanon 144 37.4
Austria 10 57.9 Panama 55 50.4 Botswana 100 44.3 Republic of Congo 145 37.3
Japan 11 57.8 Bahrain 56 50.1 St. Kitts and Nev is 101 44.1 Mali 146 37.0
Latv ia 12 57.8 Saudi Arabia 57 50.1 Cyprus 102 44.1 Belize 147 36.9
Iceland 13 57.8 Costa Rica 58 50.1 Kyrgistan 103 44.0 Mozambique 148 36.9
Mauritius 14 57.4 Bosnia and Herzegov ina 59 50.0 Nepal 104 44.0 South Africa 149 36.7
Liechtenstein 15 57.3 Iran 60 50.0 Dominica 105 43.9 Grenada 150 36.5
Denmark 16 57.2 Mongolia 61 49.9 Ghana 106 43.9 Nicaragua 151 35.8
Poland 17 56.4 Ecuador 62 49.8 Nigeria 107 43.6 Mauritania 152 35.5
Georgia 18 56.2 Philippines 63 49.7 Kenya 108 43.5 Eritrea 153 35.3
South Korea 19 56.2 Argentina 64 49.7 Namibia 109 43.4 Guyana 154 35.3
Malaysia 20 56.0 Pakistan 65 49.7 Guatemala 110 42.9 Jamaica 155 34.9
Slov enia 21 55.8 France 66 49.6 Tanzania 111 42.8 Zimbabwe 156 34.5
United Arab Emirates 22 55.7 Boliv ia 67 49.5 Sudan 112 42.8 Antigua and Barbuda 157 34.1
Sweden 23 55.5 Belgium 68 49.5 Gabon 113 42.7 Chad 158 33.8
Qatar 24 55.4 Thailand 69 49.5 Zambia 114 42.4 Barbados 159 33.2
Luxembourg 25 55.2 Bulgaria 70 49.4 El Salv ador 115 42.3 Angola 160 32.9
Uruguay 26 55.2 Italy 71 49.4 Niger 116 42.0 Timor-Leste 161 32.9
Turkey 27 55.1 Suriname 72 49.1 Brunei 117 41.8 Sierra Leone 162 32.8
Colombia 28 54.8 Spain 73 49.1 Laos 118 41.8 Equatorial Guinea 163 32.6
Ireland 29 54.8 Finland 74 49.0 Senegal 119 41.2 Malawi 164 32.6
Hungary 30 54.7 Dominican Republic 75 49.0 Maldiv es 120 41.0 Papua New Guinea 165 32.5
Peru 31 54.7 Bhutan 76 48.9 Venezuela 121 40.9 Samoa 166 32.5
Kazakhstan 32 54.4 Montenegro 77 48.8 Cambodia 122 40.5 Madagascar 167 32.3
Belarus 33 54.4 Trinidad and Tobago 78 48.8 Greece 123 40.4 Gambia 168 32.2
Chile 34 54.3 Brazil 79 48.5 Djibouti 124 40.4 Honduras 169 31.4
Switzerland 35 54.3 Egypt 80 48.1 Bahamas 125 40.2 Comoros 170 31.4
Bangladesh 36 54.2 Canada 81 48.1 Uganda 126 40.2 Burkina Faso 171 31.1
Australia 37 53.7 Burma 82 48.0 Jordan 127 40.1 Liberia 172 30.8
Vietnam 38 53.6 India 83 48.0 Democratic Republic of Congo128 39.9 Syria 173 30.6
United Kingdom 39 53.4 Portugal 84 47.9 Iraq 129 39.8 Guinea 174 30.0
Russia 40 53.2 Albania 85 47.7 Cameroon 130 39.7 Haiti 175 28.7
USA 41 53.0 Netherlands 86 47.4 Tajikistan 131 39.4 Burundi 176 28.1
Uzbekistan 42 52.8 Ukraine 87 46.9 Rwanda 132 39.3 Central African Republic 177 27.6
Azerbaijan 43 52.5 Tunisia 88 46.6 Afghanistan 133 39.2 Yemen 178 25.1
Mexico 44 52.1 Paraguay 89 46.5 Vanuatu 134 39.1 Solomon Islands 179 24.7
Cuba 45 52.1 Seychelles 90 46.3 Swaziland 135 39.1 Sao Tome and Principe 180 24.3
Governance

SolAbility page: 30
the sustainable competitiveness index 2016
page 31 the sustainable competitiveness index 2016
Sustainable
Competitive Summary Social
Capital
Intellectual
Capital Resource
Management Governance Spotlight Data
Sustainable
Competitiveness Natural Capital Governance Intellectual Capital Resource Intensity
Sustainable vs. WEF
Competitiveness Tables Social Cohesion
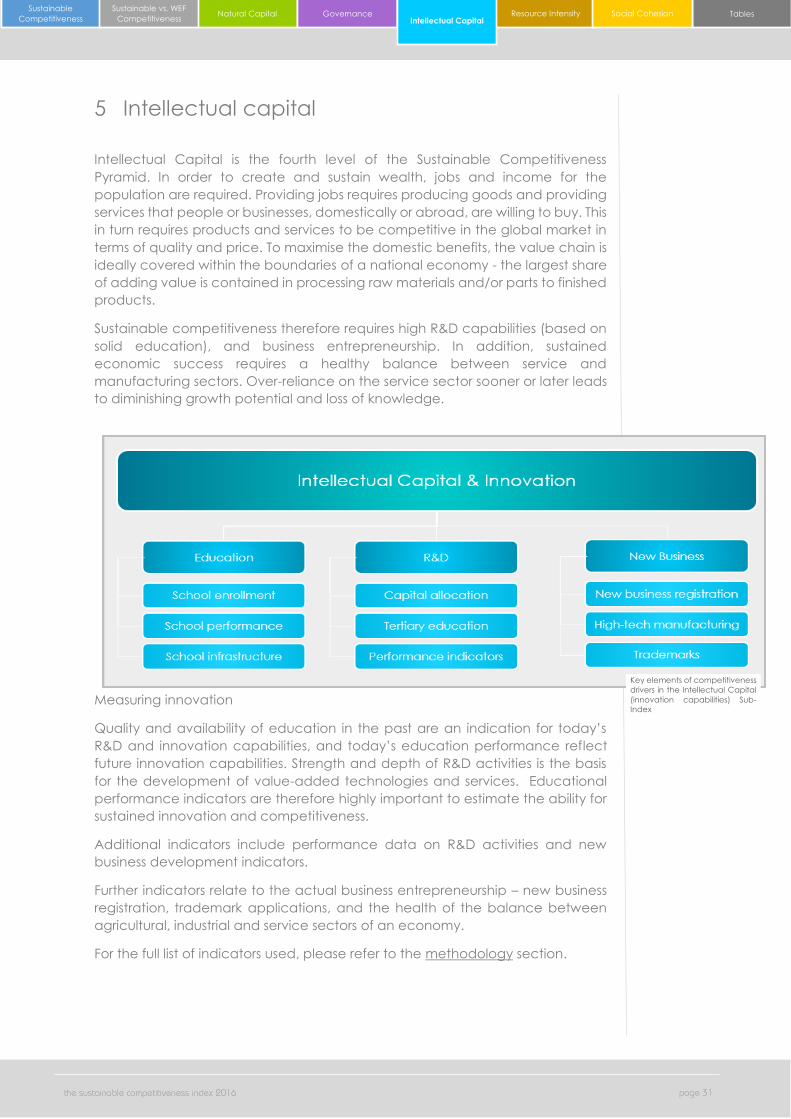
5 Intellectual capital
Intellectual Capital is the fourth level of the Sustainable Competitiveness
Pyramid. In order to create and sustain wealth, jobs and income for the
population are required. Providing jobs requires producing goods and providing
services that people or businesses, domestically or abroad, are willing to buy. This
in turn requires products and services to be competitive in the global market in
terms of quality and price. To maximise the domestic benefits, the value chain is
ideally covered within the boundaries of a national economy - the largest share
of adding value is contained in processing raw materials and/or parts to finished
products.
Sustainable competitiveness therefore requires high R&D capabilities (based on
solid education), and business entrepreneurship. In addition, sustained
economic success requires a healthy balance between service and
manufacturing sectors. Over-reliance on the service sector sooner or later leads
to diminishing growth potential and loss of knowledge.
Measuring innovation
Quality and availability of education in the past are an indication for today’s
R&D and innovation capabilities, and today’s education performance reflect
future innovation capabilities. Strength and depth of R&D activities is the basis
for the development of value-added technologies and services. Educational
performance indicators are therefore highly important to estimate the ability for
sustained innovation and competitiveness.
Additional indicators include performance data on R&D activities and new
business development indicators.
Further indicators relate to the actual business entrepreneurship – new business
registration, trademark applications, and the health of the balance between
agricultural, industrial and service sectors of an economy.
For the full list of indicators used, please refer to the methodology section.
Key elements of competitiveness
drivers in the Intellectual Capital
(innovation capabilities) Sub-
Index
Intellectual Capital

SolAbility page: 32
the sustainable competitiveness index 2016
The Intellectual Capital World Map
Intellectual Capital is the basis for innovation capability and sustainable
economic competitiveness. The indicators used for assessing these criteria are
composed of data points relating to education, innovation capabilities, and
entrepreneurship. Countries with a high score in this ranking are more likely than
others to develop (or sustain) successful economies through research and know-
ledge driven industries, i.e. high-value added industries, and therefore achieve
higher growth rates. All indicators used to assess the innovation capability and
sustainable competitiveness have been scored against size of the population or
against GDP in order to gain a full picture of the competitiveness, independent
of the size of a country. In addition, developments (trends) of performance
indicators have also been taken into account. Key observations of the
Intellectual Capital ranking include:
The innovation and competitiveness ranking is topped by South Korea –
by a very large margin
North-Eastern Asian nations (China, Japan, Singapore) and the OECD
countries from the Northern hemisphere dominate the intellectual capital
this sub-index.
Eastern European countries and Former Soviet Republics also fare well.
Malaysia (25), Cuba (38) and Thailand (43) are the highest ranked
countries of the Southern hemisphere.
Russia is ranked 42, Brazil 50, and India 116.
The Intellectual Capital World Map. Dark areas indicate high, light areas low availability of Intellectual Capital

page 33 the sustainable competitiveness index 2016
Sustainable
Competitive Summary Social
Capital
Intellectual
Capital Resource
Management Governance Spotlight Data
Sustainable
Competitiveness Natural Capital Governance Intellectual Capital Resource Intensity
Sustainable vs. WEF
Competitiveness Tables Social Cohesion
Global Innovation Rankings
Scores and rankings of Intellectual Capital Sub-Index by country:
Country Ra nk Sc ore Country Ra nk Sc ore Country Ra nk Sc ore Country Ra nk Sc ore
South Korea 1 75.2 Venezuela 46 45.7 Mexico 91 37.3 Honduras 136 29.4
Sweden 2 70.8 Kyrgistan 47 45.6 Armenia 92 37.3 Rwanda 137 28.6
Slov enia 3 68.0 Belarus 48 45.3 Tajikistan 93 37.2 Panama 138 28.3
Japan 4 65.7 Spain 49 45.2 United Arab Emirates 94 36.9 Nigeria 139 28.2
Finland 5 64.2 Brazil 50 44.9 Ghana 95 36.9 Mali 140 28.1
Germany 6 63.7 Latv ia 51 44.8 Suriname 96 36.8 Nicaragua 141 28.0
China 7 63.0 Vietnam 52 44.7 Vanuatu 97 36.7 Benin 142 27.2
Denmark 8 62.9 Costa Rica 53 44.7 Philippines 98 36.7 Sao Tome and Principe 143 27.0
Norway 9 62.4 Bulgaria 54 44.6 Samoa 99 36.6 Niger 144 26.9
Singapore 10 62.3 Cyprus 55 43.7 Egypt 100 36.6 Lesotho 145 26.4
Malta 11 62.2 Barbados 56 43.6 Cape Verde 101 36.4 Burkina Faso 146 26.4
Switzerland 12 61.1 Serbia 57 43.6 Timor-Leste 102 36.3 Papua New Guinea 147 26.3
Netherlands 13 60.7 Paraguay 58 43.4 Turkmenistan 103 36.2 Cote d'Iv oire 148 26.2
United Kingdom 14 60.4 Chile 59 43.4 Swaziland 104 36.1 Haiti 149 25.8
Israel 15 60.0 Mongolia 60 43.4 Ecuador 105 35.9 Ethiopia 150 25.4
Liechtenstein 16 59.3 Oman 61 43.2 South Africa 106 35.7 Sudan 151 24.9
Iceland 17 58.7 Peru 62 43.1 Dominica 107 35.5 Djibouti 152 24.6
Austria 18 58.2 Uzbekistan 63 42.6 Algeria 108 35.2 Iraq 153 24.1
USA 19 57.9 Jordan 64 42.6 Qatar 109 35.1 Cambodia 154 24.0
New Zealand 20 57.8 Bahamas 65 42.4 Seychelles 110 35.0 Chad 155 23.9
Czech Republic 21 57.1 Moldov a 66 42.1 Trinidad and Tobago 111 34.8 Sierra Leone 156 23.8
Belgium 22 56.9 Botswana 67 42.1 Senegal 112 34.7 Mozambique 157 23.3
France 23 56.4 Georgia 68 42.0 Romania 113 34.7 Equatorial Guinea 158 22.8
Ireland 24 55.9 Macedonia 69 41.9 Kenya 114 34.5 Angola 159 22.3
Malaysia 25 54.4 Albania 70 41.8 Gabon 115 34.4 Gambia 160 22.3
Lithuania 26 54.4 Tunisia 71 41.5 India 116 34.4 Guinea-Bissau 161 22.1
Portugal 27 54.2 Mauritius 72 41.3 Laos 117 34.4 Cameroon 162 21.7
Luxembourg 28 52.5 Bahrain 73 41.0 Bhutan 118 34.3 Mauritania 163 21.5
Estonia 29 51.9 Morocco 74 40.9 Uruguay 119 34.2 Tanzania 164 21.4
Hungary 30 51.5 Saudi Arabia 75 40.9 Azerbaijan 120 33.8 Burundi 165 21.4
Poland 31 51.1 Argentina 76 40.6 Indonesia 121 33.5 Liberia 166 21.3
Croatia 32 50.8 Maldiv es 77 40.3 Guyana 122 32.2 Afghanistan 167 21.2
Australia 33 50.5 Jamaica 78 40.1 Republic of Congo 123 32.1 Bangladesh 168 21.1
Canada 34 50.5 Fiji 79 39.7 El Salv ador 124 31.7 Togo 169 20.9
Ukraine 35 50.3 St. Kitts and Nev is 80 39.5 Grenada 125 31.7 Democratic Republic of Congo170 20.2
Slov akia 36 49.9 Colombia 81 39.1 Sri Lanka 126 31.6 Eritrea 171 19.8
Brunei 37 49.9 Namibia 82 39.0 Bosnia and Herzegov ina 127 31.4 Uganda 172 19.5
Cuba 38 49.8 Kuwait 83 38.8 Malawi 128 31.0 Guatemala 173 19.2
Italy 39 49.3 Iran 84 38.7 Antigua and Barbuda 129 30.9 Guinea 174 18.8
Kazakhstan 40 49.1 Montenegro 85 38.7 Burma 130 30.6 Zambia 175 17.9
Greece 41 49.0 Belize 86 38.0 Nepal 131 29.8 Zimbabwe 176 17.8
Russia 42 48.9 Dominican Republic 87 37.8 Comoros 132 29.7 Yemen 177 17.7
Thailand 43 48.8 St. Lucia 88 37.5 Libya 133 29.6 Central African Republic 178 15.4
Turkey 44 48.4 Tonga 89 37.4 Syria 134 29.5 Madagascar 179 15.3
Lebanon 45 48.0 Boliv ia 90 37.4 Solomon Islands 135 29.4 Pakistan 180 15.0
Intellectual Capital

SolAbility page: 34
the sustainable competitiveness index 2016

page 35 the sustainable competitiveness index 2016
Sustainable
Competitive Summary Social
Capital
Intellectual
Capital Resource
Management Governance Spotlight Data
Sustainable
Competitiveness Natural Capital Governance Intellectual Capital Resource Intensity
Sustainable vs. WEF
Competitiveness Tables Social Cohesion
6 Resource Management
The second level of the sustainable competitiveness pyramid is the ability to
manage available resource (natural capital, human capital, financial capital)
efficiently – regardless of whether the capital is scarce or abundant. Whether a
country does or does not possess resources within its boundaries (natural and
other resources), efficiency in using resources – whether domestic or imported -
is a cost factor, affecting the competitiveness and thus wealth of nations. Over-
exploitation of existing natural resources also affects the natural capital of the
country, i.e. the ability of a country to support its population and economy with
the required resources into the future.
In addition, non-renewable resources that are used today might be scarce and
expensive tomorrow, affecting competitiveness, wealth and the quality of life in
the future. A number of factors are pointing to rising cost for resources in the
future, in particular natural resources: scarcity and depletion of energy, water,
and mineral resources, increasing consumption (particular in non-OECD
countries), financial speculation on raw materials, and possibly geo-political
influences. The key objective of the resource management category is therefore
to evaluate a country’s ability to deal with rising cost and sustain economic
growth in the face of rising prices in the global commodity markets.
Vital natural resources include water, energy, and raw materials. Most of the
resources used today are non-renewable, or only partly renewable: fossil-based
energy, and minerals. Water aquifers and other natural products (e.g. wood) are
renewable, as long as their capacity is not overused and the replacement
patterns are not drastically altered, e.g. trough depletion, biodiversity loss,
pollution, or climate change.
Resource efficiency indicators are evaluated both in terms of intensity (per
capita) and efficiency (relative GDP). The availability of accurate global data is
not as wide as in other criteria, particularly in terms of usage of raw materials.
Other than steel & minerals usage, reliable raw material usage statistics are not
available on a global level. The focus is therefore on energy, energy sources,
water, steel usage, as well as GHG emission intensity and productivity. For the full
list of indicators, refer to the methodology section.
Key elements of competitiveness
drivers in the Resource
Management Sub-Index
Resource Intensity

SolAbility page: 36
the sustainable competitiveness index 2016
Resource Management World Map
The resource intensity ranking is topped by less developed countries, with no
OECD nation or developed economy in the top 20. Ireland and Sweden, the
highest ranking of the developed economies, are placed 21 & 26, followed by
Latvia (33), and Luxembourg (35). The UK, thanks to a near-complete de-
industrialisation ranks 39. World’s economic powerhouses score comparable low:
Germany is ranked 149, Japan 162, and the USA at 161. Brazil is positioned the
highest among the large emerging economies (66), while India (138), China (166)
and Russia (152) have a distinctive potential for improving their sustainable
competitiveness through improving resource intensity and resource
management – i.e. reducing costs, at the end of the day.
The Resource Management Sub-Index is composed of indicators scored relative
to population (e.g. GHG per capita) as well as relative to economic output (e.g.
energy consumption per GDP). Indicators measured against population (per
capita) clearly favour countries with low resource and raw material consumption
(i.e. less developed countries), while indicators scored relative to GDP measure
economic efficiency.
The resource intensity map shows that the resource intensity of less developed
countries seems to be lower than that of higher developed countries - despite
the weighting (as calculated by relevance) for scores measured against
economic output (GDP) being significantly higher than for absolute intensity
scores (measured against capita).
The main implications of higher or lower resource management capabilities are
related to stability and sustained economic growth: should global prices for raw
materials and energy rise significantly in the future (as trends and the majority of
available research suggests), the countries in the lower ranks will face substantial
higher costs and challenges to maintain their growth compared to countries with
higher efficiency and intensity scores.
The Resource Intensity World Map. Dark areas indicate low, light areas indicate high resource Intensity.

page 37 the sustainable competitiveness index 2016
Sustainable
Competitive Summary Social
Capital
Intellectual
Capital Resource
Management Governance Spotlight Data
Sustainable
Competitiveness Natural Capital Governance Intellectual Capital Resource Intensity
Sustainable vs. WEF
Competitiveness Tables Social Cohesion
Resource Management Rankings
Scores and rankings of the level of Resource Management Sub-Index by country:
Country Ra nk Sc ore Country Ra nk Sc ore Country Ra nk Sc ore Country Ra nk Sc ore
Republic of Congo 1 61.4 Burma 46 47.4 Portugal 91 42.4 Libya 136 37.9
Mozambique 2 61.3 Uruguay 47 47.1 Iceland 92 42.4 Liechtenstein 137 37.6
Ethiopia 3 59.1 Rwanda 48 47.0 Fiji 93 42.1 India 138 37.6
Kenya 4 58.9 Malawi 49 46.8 Laos 94 42.1 St. Kitts and Nev is 139 37.4
Democratic Republic of Congo5 58.2 Burkina Faso 50 46.6 Botswana 95 42.1 Algeria 140 37.4
Angola 6 57.8 Papua New Guinea 51 46.4 Guyana 96 42.1 Slov enia 141 37.2
Tanzania 7 57.8 Gambia 52 46.4 Mongolia 97 42.0 Dominican Republic 142 36.7
Nigeria 8 57.5 Panama 53 46.4 Djibouti 98 42.0 Canada 143 36.7
Nepal 9 56.7 Switzerland 54 46.2 Cuba 99 42.0 South Africa 144 36.4
Togo 10 56.0 Lithuania 55 46.1 Qatar 100 41.7 Thailand 145 36.2
Zambia 11 55.3 Chad 56 46.0 Afghanistan 101 41.4 Mauritania 146 35.8
Cote d'Iv oire 12 55.1 Peru 57 46.0 Spain 102 41.4 United Arab Emirates 147 35.7
Cameroon 13 54.8 Burundi 58 45.9 Finland 103 41.4 Oman 148 35.6
Nicaragua 14 54.7 Moldov a 59 45.7 Samoa 104 41.3 Germany 149 35.4
Haiti 15 54.6 Croatia 60 45.6 Syria 105 41.2 Iraq 150 35.3
Honduras 16 54.4 Bangladesh 61 45.6 Brunei 106 41.1 Macedonia 151 35.0
Guatemala 17 54.4 Tunisia 62 45.5 Vanuatu 107 40.9 Russia 152 34.8
Jamaica 18 53.8 Romania 63 45.4 Australia 108 40.9 Lebanon 153 34.6
Equatorial Guinea 19 53.8 Madagascar 64 45.4 Solomon Islands 109 40.9 Morocco 154 34.5
Benin 20 53.1 Slov akia 65 45.3 Belgium 110 40.7 Bhutan 155 34.4
Ireland 21 52.7 Brazil 66 45.3 Mali 111 40.7 Ukraine 156 34.4
Gabon 22 52.3 Indonesia 67 45.1 Austria 112 40.7 Singapore 157 34.4
Ghana 23 52.0 Sierra Leone 68 44.8 Mexico 113 40.6 Turkmenistan 158 34.3
Lesotho 24 51.9 Senegal 69 44.8 Seychelles 114 40.4 Bahamas 159 34.3
Costa Rica 25 51.6 Cape Verde 70 44.6 Mauritius 115 40.1 Netherlands 160 33.9
Sweden 26 51.5 Armenia 71 44.6 Italy 116 40.1 USA 161 33.8
Sao Tome and Principe 27 51.2 Pakistan 72 44.5 Poland 117 40.1 Japan 162 33.7
Philippines 28 51.0 Cyprus 73 44.4 Central African Republic 118 40.0 Kuwait 163 33.6
Namibia 29 50.9 Timor-Leste 74 43.8 Venezuela 119 40.0 Malaysia 164 33.3
Boliv ia 30 50.7 Tonga 75 43.7 Swaziland 120 40.0 Bahrain 165 33.1
Cambodia 31 50.3 Georgia 76 43.4 Maldiv es 121 39.8 China 166 32.7
Colombia 32 50.2 Dominica 77 43.4 Czech Republic 122 39.6 Grenada 167 32.3
Latv ia 33 50.1 Albania 78 43.4 Sri Lanka 123 39.6 Serbia 168 32.3
El Salv ador 34 50.0 Greece 79 43.3 New Zealand 124 39.5 Iran 169 32.2
Luxembourg 35 50.0 Guinea 80 43.2 Belarus 125 39.4 Vietnam 170 32.2
Belize 36 49.8 Sudan 81 43.2 Argentina 126 39.4 Turkey 171 32.1
Comoros 37 49.6 Yemen 82 43.1 Uzbekistan 127 39.4 St. Lucia 172 32.0
Eritrea 38 49.5 Liberia 83 43.1 Hungary 128 39.4 Bulgaria 173 31.9
United Kingdom 39 49.3 Trinidad and Tobago 84 43.1 Kyrgistan 129 39.4 Montenegro 174 31.9
Uganda 40 49.2 Guinea-Bissau 85 43.0 Jordan 130 39.3 Kazakhstan 175 31.4
Niger 41 49.1 Chile 86 43.0 Suriname 131 39.3 Barbados 176 30.3
Denmark 42 48.7 Bosnia and Herzegov ina 87 43.0 Azerbaijan 132 39.1 Antigua and Barbuda 177 30.2
Paraguay 43 48.3 Zimbabwe 88 42.8 Ecuador 133 39.0 Egypt 178 30.0
Norway 44 48.3 France 89 42.7 Israel 134 38.8 Saudi Arabia 179 26.9
Tajikistan 45 47.7 Malta 90 42.6 Estonia 135 37.9 South Korea 180 25.1
Resource Intensity

SolAbility page: 38
the sustainable competitiveness index 2016
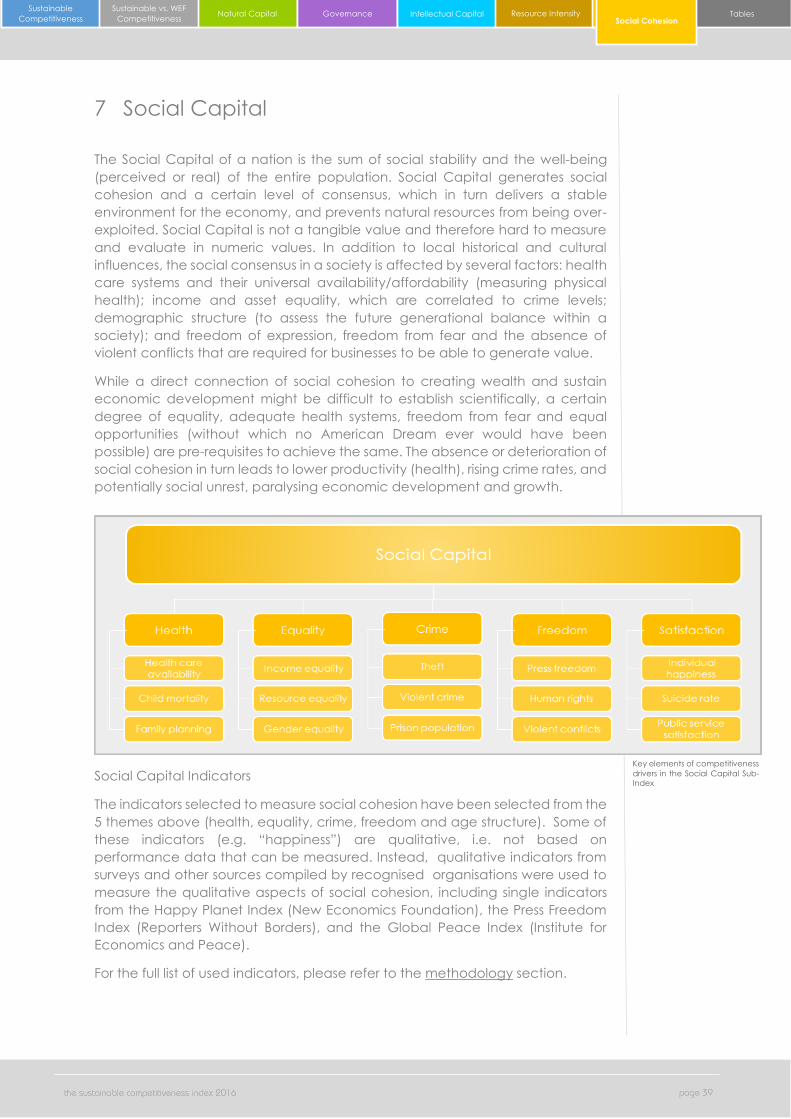
page 39 the sustainable competitiveness index 2016
Sustainable
Competitive Summary Social
Capital
Intellectual
Capital Resource
Management Governance Spotlight Data
Sustainable
Competitiveness Natural Capital Governance Intellectual Capital Resource Intensity
Sustainable vs. WEF
Competitiveness Tables Social Cohesion
7 Social Capital
The Social Capital of a nation is the sum of social stability and the well-being
(perceived or real) of the entire population. Social Capital generates social
cohesion and a certain level of consensus, which in turn delivers a stable
environment for the economy, and prevents natural resources from being over-
exploited. Social Capital is not a tangible value and therefore hard to measure
and evaluate in numeric values. In addition to local historical and cultural
influences, the social consensus in a society is affected by several factors: health
care systems and their universal availability/affordability (measuring physical
health); income and asset equality, which are correlated to crime levels;
demographic structure (to assess the future generational balance within a
society); and freedom of expression, freedom from fear and the absence of
violent conflicts that are required for businesses to be able to generate value.
While a direct connection of social cohesion to creating wealth and sustain
economic development might be difficult to establish scientifically, a certain
degree of equality, adequate health systems, freedom from fear and equal
opportunities (without which no American Dream ever would have been
possible) are pre-requisites to achieve the same. The absence or deterioration of
social cohesion in turn leads to lower productivity (health), rising crime rates, and
potentially social unrest, paralysing economic development and growth.
Social Capital Indicators
The indicators selected to measure social cohesion have been selected from the
5 themes above (health, equality, crime, freedom and age structure). Some of
these indicators (e.g. “happiness”) are qualitative, i.e. not based on
performance data that can be measured. Instead, qualitative indicators from
surveys and other sources compiled by recognised organisations were used to
measure the qualitative aspects of social cohesion, including single indicators
from the Happy Planet Index (New Economics Foundation), the Press Freedom
Index (Reporters Without Borders), and the Global Peace Index (Institute for
Economics and Peace).
For the full list of used indicators, please refer to the methodology section.
Key elements of competitiveness
drivers in the Social Capital Sub-
Index
Social Cohesion
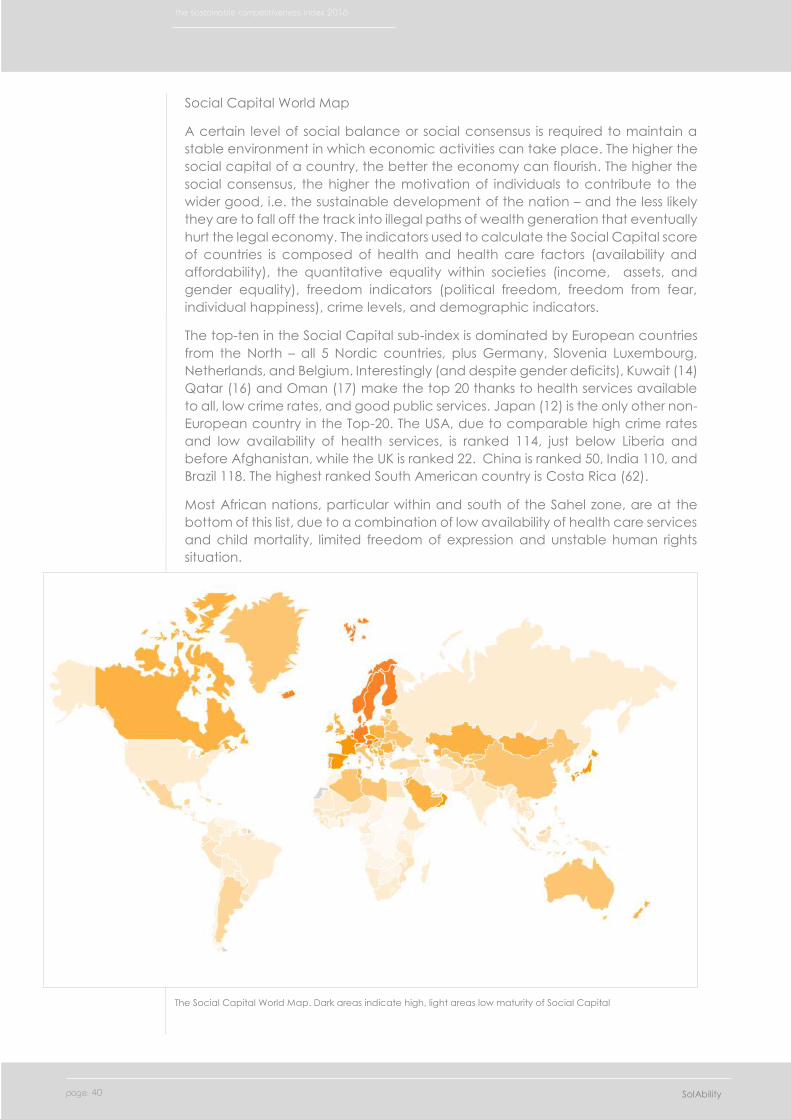
SolAbility page: 40
the sustainable competitiveness index 2016
Social Capital World Map
A certain level of social balance or social consensus is required to maintain a
stable environment in which economic activities can take place. The higher the
social capital of a country, the better the economy can flourish. The higher the
social consensus, the higher the motivation of individuals to contribute to the
wider good, i.e. the sustainable development of the nation – and the less likely
they are to fall off the track into illegal paths of wealth generation that eventually
hurt the legal economy. The indicators used to calculate the Social Capital score
of countries is composed of health and health care factors (availability and
affordability), the quantitative equality within societies (income, assets, and
gender equality), freedom indicators (political freedom, freedom from fear,
individual happiness), crime levels, and demographic indicators.
The top-ten in the Social Capital sub-index is dominated by European countries
from the North – all 5 Nordic countries, plus Germany, Slovenia Luxembourg,
Netherlands, and Belgium. Interestingly (and despite gender deficits), Kuwait (14)
Qatar (16) and Oman (17) make the top 20 thanks to health services available
to all, low crime rates, and good public services. Japan (12) is the only other non-
European country in the Top-20. The USA, due to comparable high crime rates
and low availability of health services, is ranked 114, just below Liberia and
before Afghanistan, while the UK is ranked 22. China is ranked 50, India 110, and
Brazil 118. The highest ranked South American country is Costa Rica (62).
Most African nations, particular within and south of the Sahel zone, are at the
bottom of this list, due to a combination of low availability of health care services
and child mortality, limited freedom of expression and unstable human rights
situation.
The Social Capital World Map. Dark areas indicate high, light areas low maturity of Social Capital

page 41 the sustainable competitiveness index 2016
Sustainable
Competitive Summary Social
Capital
Intellectual
Capital Resource
Management Governance Spotlight Data
Sustainable
Competitiveness Natural Capital Governance Intellectual Capital Resource Intensity
Sustainable vs. WEF
Competitiveness Tables Social Cohesion
Global Social Capital Rankings
Scores and rankings of the level of Social Capital Sub-Index by country:
Country Ra nk Sc ore Country Ra nk Sc ore Country Ra nk Sc ore Country Ra nk Sc ore
Norway 1 63.3 Italy 46 47.8 Indonesia 91 39.2 Gambia 136 33.7
Luxembourg 2 63.0 Moldov a 47 47.8 Laos 92 39.2 Mali 137 33.6
Iceland 3 61.8 Maldiv es 48 47.6 Bangladesh 93 39.2 Rwanda 138 33.6
Germany 4 60.6 Montenegro 49 47.4 Bahrain 94 39.1 Trinidad and Tobago 139 33.4
Denmark 5 60.4 China 50 47.2 Thailand 95 39.0 Colombia 140 33.4
Slov enia 6 60.1 Kyrgistan 51 47.2 Niger 96 38.6 Morocco 141 32.9
Finland 7 60.0 Malta 52 47.0 Philippines 97 38.6 Venezuela 142 32.8
Belgium 8 60.0 Armenia 53 46.7 Peru 98 38.4 Benin 143 32.8
Netherlands 9 59.5 Ukraine 54 46.7 Sierra Leone 99 38.4 Gabon 144 32.8
Sweden 10 59.3 United Arab Emirates 55 46.5 Mozambique 100 38.3 Chad 145 32.8
Austria 11 58.6 Libya 56 46.3 Suriname 101 38.1 Cape Verde 146 32.5
Japan 12 58.4 Azerbaijan 57 46.3 Pakistan 102 38.0 Equatorial Guinea 147 32.5
Switzerland 13 58.2 Tajikistan 58 46.3 Tonga 103 38.0 Kenya 148 32.4
Kuwait 14 57.2 Uzbekistan 59 46.1 Ethiopia 104 37.6 Zambia 149 32.2
Liechtenstein 15 57.1 Hungary 60 45.6 Belize 105 37.4 Uganda 150 32.1
Qatar 16 55.8 Greece 61 45.1 Dominican Republic 106 37.4 Guinea-Bissau 151 32.0
Oman 17 55.2 Seychelles 62 45.1 Bahamas 107 36.9 Iran 152 31.7
Spain 18 55.0 Algeria 63 45.1 Burma 108 36.6 Zimbabwe 153 31.4
Slov akia 19 54.3 Argentina 64 44.7 Nicaragua 109 36.6 Cote d'Iv oire 154 31.3
France 20 53.9 South Korea 65 43.5 India 110 36.6 Botswana 155 31.3
Czech Republic 21 53.0 Malaysia 66 43.4 South Africa 111 36.5 Comoros 156 31.1
Croatia 22 52.5 Israel 67 43.1 Namibia 112 36.2 Angola 157 30.8
Canada 23 52.4 Costa Rica 68 43.1 Liberia 113 36.2 Sao Tome and Principe 158 30.2
Ireland 24 52.4 Cuba 69 42.8 USA 114 36.1 Samoa 159 30.2
Mongolia 25 52.3 Macedonia 70 42.3 Afghanistan 115 35.9 Togo 160 30.0
United Kingdom 26 52.2 Latv ia 71 42.0 Cameroon 116 35.6 Chile 161 29.9
Brunei 27 51.1 Georgia 72 41.9 Guinea 117 35.5 Republic of Congo 162 29.4
Romania 28 50.7 Turkey 73 41.9 Brazil 118 35.5 Antigua and Barbuda 163 29.3
Timor-Leste 29 50.7 Bhutan 74 41.9 Cambodia 119 35.3 Vanuatu 164 29.3
Jordan 30 50.5 Nepal 75 41.8 Sri Lanka 120 35.2 Yemen 165 28.8
Poland 31 50.4 Albania 76 41.7 Madagascar 121 35.0 Barbados 166 28.8
Lebanon 32 50.2 Mexico 77 41.6 Mauritius 122 35.0 Guyana 167 28.7
Portugal 33 50.2 Turkmenistan 78 41.0 Boliv ia 123 35.0 Djibouti 168 28.7
Singapore 34 50.0 Vietnam 79 40.9 Tanzania 124 35.0 Democratic Republic of Congo169 28.5
Estonia 35 50.0 Uruguay 80 40.9 El Salv ador 125 34.9 Guatemala 170 28.3
New Zealand 36 49.9 Bulgaria 81 40.7 Russia 126 34.8 Fiji 171 28.2
Serbia 37 49.7 Papua New Guinea 82 40.7 Paraguay 127 34.7 Grenada 172 28.2
Kazakhstan 38 49.6 Panama 83 40.7 St. Kitts and Nev is 128 34.6 Eritrea 173 28.2
Bosnia and Herzegov ina 39 49.6 Ghana 84 40.2 Malawi 129 34.6 Sudan 174 27.9
Tunisia 40 49.4 Senegal 85 40.1 Iraq 130 34.5 Honduras 175 27.5
Cyprus 41 49.3 Ecuador 86 40.1 Burundi 131 34.2 Haiti 176 26.0
Saudi Arabia 42 49.0 Egypt 87 40.0 Mauritania 132 34.1 Central African Republic 177 25.6
Australia 43 48.5 Syria 88 39.6 Solomon Islands 133 34.1 Swaziland 178 25.5
Belarus 44 48.3 Burkina Faso 89 39.3 Lesotho 134 33.9 Nigeria 179 24.8
Lithuania 45 47.8 Dominica 90 39.2 Jamaica 135 33.9 St. Lucia 180 18.5
Social Cohesion

SolAbility page: 42
the sustainable competitiveness index 2016

page 43 the sustainable competitiveness index 2016
Sustainable
Competitive Summary Social
Capital
Intellectual
Capital Resource
Management Governance Spotlight Data
Sustainable
Competitiveness Natural Capital Governance Intellectual Capital Resource Intensity
Sustainable vs. WEF
Competitiveness Tables Social Cohesion
8 The Sustainable Competitiveness Model &
Index Methodology
8.1 The Sustainable Competitiveness Model
The three-dimensional sustainability model of reconciling the economy, the
environment and the society is often used and applied in the corporate world to
evaluate and manage sustainability issues and performance.
However, corporations are entities that operate in very
different boundaries and with different goals than
states and nation-economies. The elements of the
model therefore have to be adapted to the
characteristics of nations and their fundament of
sustained prosperity.
While corporate or economic entities (depending on
the nature of their business) are working with natural
capital, they do not depend on the location of the
capital (natural, human, financial) they utilize, and
therefore can move their operations to where the
external conditions are most favourable, both in terms
of physical location (offices/factories) and markets, as
well as in terms of business fields. Transport and
international trade have made countries and people
less dependent on their immediate environment
through international trade of resources, including
water. However, countries and population cannot simply move should
fundamental resources (water, agricultural output) become scarce or the
country inhabitable due to climate change. At the end of the day people rely
on, and life off, the natural capital of their environment for better or worse.
The Sustainable Competitiveness Pyramid
Sustainable competitiveness - they ability to
generate and sustain inclusive wealth and
dignifying standard of life for all citizens in a
globalised world of competing economies,
consists of 5 key elements that interact and
influence each other: natural capital (the
given natural environment and climate, minus
human induced degradation and pollution),
social capital, intellectual capital (the ability
to compete in a globalised market through
sustained innovation), resource management
(the ability to extract the highest possible
value from existing resources (natural, human,
financial), and governance (the framework given, normally by government
policies & investments, in which a national economy operates).
Model of sustainable
development often
applied in ESG research
The Sustainable
Competitiveness
Pyramid
Methodology &
Tables

SolAbility page: 44
the sustainable competitiveness index 2016
It is now widely accepted that economic activities have adverse impacts or side-
effects on the non-financial assets of a country. The negative impacts of
economic activities - including negative impacts on the social fabric and
cohabitation within a society - can undermine or even reverse future growth and
wealth creation. Due to the omission of key non-financial indicators and
performance that are fundamental to sustain economic activities,
conventionally used measurements to measure wealth of nations such as the
GDP have limited informative value for the future development of a country.
Sustainable competitiveness means the ability of a country to meet the needs
and basic requirements of current generations while sustaining or growing the
national and individual wealth into the future without depleting natural and
social capital.
The Sustainable Competitiveness Index is built and calculated based on the
sustainable competitiveness model that covers 106 data indicators grouped in5
pillars:
Social Cohesion is the fundamental stability required to maintain interruption-free
economic activities: the health of populations, equality, security and freedom
within a country
Natural Capital is the based to sustain a society and economic activities:
the given natural environment within the frontiers of a country, including
availability of resources, and the level of the depletion of those resources.
Resource Intensity is a measurement of efficiency, and thus an element
of competitiveness: the efficiency of using available resources (domestic
or imported) as a measurement of operational competitiveness in a
resource-constraint World.
Social Cohesion is the fundamental stability required to maintain
interruption-free economic activities: the health of populations, equality,
security and freedom within a country
Sustainable Innovation is key to sustain economic development in the
globalised market: the capability of a country to generate wealth and
jobs through innovation and value-added industries in the globalised
markets
The Governance framework is the environment businesses and a national
economy are operating in. It is key to future development, not only for
software, but also hardware.

page 45 the sustainable competitiveness index 2016
Sustainable
Competitive Summary Social
Capital
Intellectual
Capital Resource
Management Governance Spotlight Data
Sustainable
Competitiveness Natural Capital Governance Intellectual Capital Resource Intensity
Sustainable vs. WEF
Competitiveness Tables Social Cohesion
Methodology Development
The competitiveness of a nation is influenced by a wide range of factors, i.e. is a
complex matter. We are striving to develop a model that can reflect all aspects
that define the level of competitiveness. The methodology for the Sustainable
Competitiveness is therefore constantly reviewed and has evolved over time. For
the 2014 Index, the methodology has been overhauled significantly with a
redesign of the Sustainable Competitiveness model and additional indicators
added (71 in 2013, 104 in 2014). The changes to the Sustainable Competitiveness
Model and indicators have been undertaken based on past experiences, new
research, data availability, and back-track analysis.
Due to the changes in the methodology, rankings of the current rankings prior to
2014 are not fully compatible with current rankings. While vast majority of
countries remain in the same bracket of ranking despite the changes
methodology, direct comparison of rankings have a limited informative value.
From an index point of view, it might be preferable to base rankings on the same
methodology and data. However, we believe that delivering the most accurate
result possible is more important than direct of year-on-year rankings
comparison. The main changes that have been implemented as a result of the
methodology review include changes to the model of competitiveness on which
the calculation is based, and further adaptation to availability of congruent
data series.
The sustainable competitiveness model has been adapted to better reflect the
elements that characterise and influence sustainable competitiveness of nation-
economy, and how those elements influence and impact each other. The
model used for the first Index consisted of 4 key elements – Natural Capital,
Resource Intensity, Sustainable Innovation, and Social Cohesion. Since 2014, the
Sustainable Competitiveness model is based on a pyramid with 5 levels. The
basic conditions form the basis of the pyramid, on which the next level is built.
Vice-versa, the higher levels of the pyramid are influencing the performance of
the levels below.
The base level of the Pyramid is the Natural Capital (the given physical
environment and resources) – the resources that feed the population,
provide energy, and materials
The second level is Resource Management – the ability to use available
resources at the highest possible efficiency - natural resources, human
resources, intellectual resources, financial resources.
The third level is the Social Capital of a country, the cohesion between
generations, genders, income groups and other society groups. Social
cohesion is required for the prosperous development of human capital,
i.e. Social Capital is the provision of a framework that facilitates the third
level of the pyramid
The fourth level is the Intellectual Capital, the fundament for the ability to
compete and generate wealth in a globalised competitive market
through design and manufacturing of value-adding products and
service. It is the basis for management capabilities
The fifth and highest level is Governance – the direction and framework
provided by government interventions, expenditure, and investments.
Government policies (or the absence of such policies) have strong
influence and or impact on all lower levels of the Sustainable
Competitiveness Pyramid.

SolAbility page: 46
the sustainable competitiveness index 2016
8.2 Competitiveness Indicators
The sustainable competitiveness model is based on a pyramid, where each level
is required to support the next higher level. In the top-down direction, the
different levels of the pyramid have influence the state of the lower levels.
Natural Capital
The natural capital is the base of the pyramid, and is defined
by the characteristics of the given physical environment of a
country. The natural capital consists of a mixture of size,
population, geography, climate, biodiversity and availability
of natural resources (renewable and non-renewable), as well
as the level of depletion/degradation of the available
resources. The combination of these factors and the level of
depletion of the non-renewable resources due to human
activity and climate change represents the potential for
sustaining a prosperous livelihood for the population and the
economy of a nation into the future.
Indicators used encompass water, forest and biodiversity
indicators, agricultural indicators, land degradation and
desertification, minerals and energy resources, pollution
indicators and depletion indicators.
Resource Management
The more efficient a nation is using resources (natural, human,
financial), the more wealth the country is able to generate.
In addition, higher efficiency means smaller negative impacts of potential supply
scarcity of resources (food, energy, water, minerals). Higher efficiency is also
equal to lower cost per production unit throughout all sectors, private and
public. Efficient use of resources and energy is an indicator for
a nation’s ability to maintain or improve living standard levels
both under a future business-as-usual Indicators used cover
water usage and intensity, energy usage, intensity and energy
sources, climate change emissions and intensity as well as
certain raw material usage. However, global data availability
for raw materials consumption other than steel is limited and
therefore could not be included.
Indicators used cover water usage and intensity, energy
usage, intensity and energy sources, climate change emissions
and intensity as well as certain raw material usage. However,
global data availability for raw materials consumption other
than steel is limited and therefore could not be included.
Natural capital
Fossil energy prevalence (% of total)
Ecological consumption footprint
Renewable freshwater availability/capita
Electricity from hydropower (%)
Forest area (% of total)
Arable land (ha/capita)
Potential arable land (ha/capita)
Land degradation (% of total)
Land at risk of desertification
Extreme weather incidents
Mineral reserves (per GNI and capita)
Population density
Cereal yield (kg per hectare)
Natural resource depletion
Endangered species
Energy self-sufficiency
Land area below 5 m (% of total)
Population living below 5m (% of total)
Average rainfall (mm)
SO2 emissions per capita
Biodiversity Benefit Index (GEF)
Fertilizer consumption/ha
Tourist attractiveness
Ocean Health Index
Population exposed to climate risks
Primary education completion
Resource Management
NOx emissions per GDP
NOx emissions per capita
Energy per GDP
Energy per capita
CO2 emissions / GDP
CO2 emissions /capita
Freshwater withdrawal rate
Electricity consumption per capita
Electricity from coal (%)
Electricity from oil (%)
Renewable electricity excluding hydro (%)
Water productivity
Steel usage efficiency per capita (T/CAPITA)
Air pollution - death due to respiratory infections
Urban air pollution
Hazardous waste per GDP
Obesity rate
GNI per capita
Electricity consumption / GDP

page 47 the sustainable competitiveness index 2016
Sustainable
Competitive Summary Social
Capital
Intellectual
Capital Resource
Management Governance Spotlight Data
Sustainable
Competitiveness Natural Capital Governance Intellectual Capital Resource Intensity
Sustainable vs. WEF
Competitiveness Tables Social Cohesion
Social Capital
The economy requires stability to run free of interruptions.
Nations and societies therefore need a minimum level of
social cohesion, coherence, and solidarity between different
regions, between authorities and the people, between
different interest groups, between income levels, between
generations, and between individuals. A lack of social
cohesion in any of the above aspects leads to social gaps
that eventually lead to increased crime, violence and
insecurity that can seriously undermine the stability the
economy requires as a basis to thrive in the long run.
Indictors used cover health performance indicators, birth
statistics, income differences, equal opportunities (gender,
economic), freedom of press, human rights considerations,
the level of crime against both possession and humans, and
perceived levels of well-being and happiness.
Intellectual Capital
The backbone of sustained economic success is the ability to
continuously improve and innovate on all levels and
throughout all institutions (not limited to the private sector).
Sustaining competitiveness also requires a long-term view
beyond momentary political interests or opinions, and long-
term investments in crucial areas (education, infrastructure).
Economies that are being deprived from investments sooner
or later face decline, as some nations of the formerly
“leading” West are currently learning the hard way. Indicators
used for the innovation capability sub-index cover education
levels, R&D performance indicators, infrastructure investment
levels, employment indexes, and the balance of the
agricultural-industrial-service sectors.
Governance
With the given physical environment and conditions in place,
the sustained competitiveness of a country is determined by
what the society and the economy is able to extract from
available resources. This, in turn, is characterized by the
framework provided by authorities. The framework of a
country provides the basis for businesses and the social
consensus. Governance indicator consist of both physical
indicators (infrastructure) as well as non-physical attributes
(business legislation, level of corruption, government
investments, exposure to business and volatility risks, exposure
to financial risks, etc.)
Social Capital Doctors per 1000 people
Hospital bed availability
Nurses per 1000 people
Child mortality rate
Birth per woman
Teen moms
Overweight
Life satisfaction index
Press Freedom Index
Peace Index
People reported to the police (%)
Theft
Homicide rate
Prison population rate (per 100'000 people)
Aging society
Suicide rate
Public health spending (% of total health)
Women in parliament (% of MPs)
Human rights index
Intellectual Capital
Primary education completion
Primary student repetitions
Secondary education enrolment
Tertiary education enrolment
Mean school years
R&D FTEs per million people
R&D spending
High tech exports
Patent applications per 1 million people
Patent applications (per GDP)
New business registrations per 1 million people
Trademark applications
Manufacturing value added
Education spending (% of government budget)
Pupil-teacher ratio
Pupil gender ratio
Governance
Mobile communication availability
Transmission losses
Internet availability
TI CPI Index
Bribery payments - % of businesses
Employment in the service sector
Employment in the manufacturing sector
Unemployment
Investments
Austerity Index
GINI coefficient (income distribution inequality)
Income quintile ratio
Quality of public services
Poverty development
Military spending (% of total government
spending)
Rail network per area & population
Government debt
Access to electricity
Bank capital-asset ratio
Market fluctuation exposure: stock trading
volume (% of GDP)
Market fluctuation exposure: company value (%
of GDP)
Imports (% of GDP)
Population (total)
GNI (total)
Ease of doing business
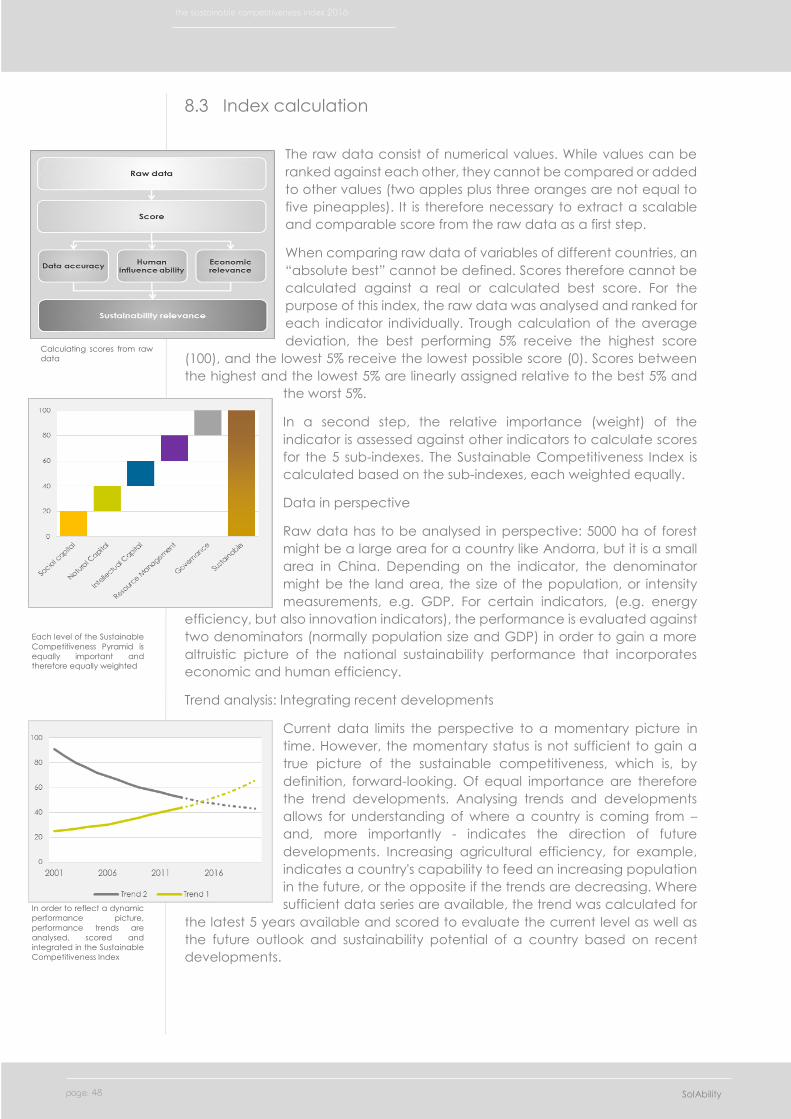
SolAbility page: 48
the sustainable competitiveness index 2016
8.3 Index calculation
The raw data consist of numerical values. While values can be
ranked against each other, they cannot be compared or added
to other values (two apples plus three oranges are not equal to
five pineapples). It is therefore necessary to extract a scalable
and comparable score from the raw data as a first step.
When comparing raw data of variables of different countries, an
“absolute best” cannot be defined. Scores therefore cannot be
calculated against a real or calculated best score. For the
purpose of this index, the raw data was analysed and ranked for
each indicator individually. Trough calculation of the average
deviation, the best performing 5% receive the highest score
(100), and the lowest 5% receive the lowest possible score (0). Scores between
the highest and the lowest 5% are linearly assigned relative to the best 5% and
the worst 5%.
In a second step, the relative importance (weight) of the
indicator is assessed against other indicators to calculate scores
for the 5 sub-indexes. The Sustainable Competitiveness Index is
calculated based on the sub-indexes, each weighted equally.
Data in perspective
Raw data has to be analysed in perspective: 5000 ha of forest
might be a large area for a country like Andorra, but it is a small
area in China. Depending on the indicator, the denominator
might be the land area, the size of the population, or intensity
measurements, e.g. GDP. For certain indicators, (e.g. energy
efficiency, but also innovation indicators), the performance is evaluated against
two denominators (normally population size and GDP) in order to gain a more
altruistic picture of the national sustainability performance that incorporates
economic and human efficiency.
Trend analysis: Integrating recent developments
Current data limits the perspective to a momentary picture in
time. However, the momentary status is not sufficient to gain a
true picture of the sustainable competitiveness, which is, by
definition, forward-looking. Of equal importance are therefore
the trend developments. Analysing trends and developments
allows for understanding of where a country is coming from –
and, more importantly - indicates the direction of future
developments. Increasing agricultural efficiency, for example,
indicates a country's capability to feed an increasing population
in the future, or the opposite if the trends are decreasing. Where
sufficient data series are available, the trend was calculated for
the latest 5 years available and scored to evaluate the current level as well as
the future outlook and sustainability potential of a country based on recent
developments.
In order to reflect a dynamic
performance picture,
performance trends are
analysed, scored and
integrated in the Sustainable
Competitiveness Index
Each level of the Sustainable
Competitiveness Pyramid is
equally important and
therefore equally weighted
Calculating scores from raw
data

page 49 the sustainable competitiveness index 2016
Sustainable
Competitive Summary Social
Capital
Intellectual
Capital Resource
Management Governance Spotlight Data
Sustainable
Competitiveness Natural Capital Governance Intellectual Capital Resource Intensity
Sustainable vs. WEF
Competitiveness Tables Social Cohesion
Methodology Details
Data Sources
Over 90% of the sustainable competitiveness indicators are purely quantitative
performance indicators. Data sources were chosen according to reliability and
availability of global data. The largest percentage of indicators was derived from
the World Bank’s indicator database, followed by data sets and indicators
provided by various UN agencies. Index calculation
Data reliability & accuracy
The accuracy of the index relies on the accuracy of the underlying data. Given
the many individual and agencies involved in data collected around the World,
it cannot be excluded that some of the data is not completely accurate. Data
sources chosen for this Index (World Bank, UN agencies) are considered
reasonably reliable. Raw data from the various databases was used as a basis
for calculation as-is, i.e. without verifying the actual data.
Limitations of quantitative analysis
In order to exclude subjectivity, only quantitative data has been taken into
account. However, quantitative indicators sometimes are not able to
differentiate or express real and actual levels of quality. High spending on health
care for example does not necessarily guarantee high quality health care system
available for the average citizen. Equally, the percentage of school enrolment
(on all levels, form primary levels to college and universities) is not necessarily an
expression of the quality of the education. However, for some indicators, quality
is equally important to quantity from a sustainability viewpoint. For such
indicators, quantitative indicators have limited informative value and serve as a
proxy.
While explanatory power of quantitative indicators is limited, conducting a
qualitative evaluation of the 73 indicators used on the global level would go far
beyond the limitations of this index. For indicators with a potentially low
correlation between quantity and quality, the weighting has been adjusted
accordingly. In order to integrate some qualitative aspects, results of global
surveys have been included, e.g. for the quality of public services, or perceived
life satisfaction.
Time frame of data used
The Sustainable Competitiveness Index 2016 is based on the latest available
data. For most data series, the latest data available (October 2016) dates 2015
or 2014. Where 2015 data was available, 2015 data has been used. Where 2015
or 2015 data was not available, 2013 data was used, and in a few cases 2012
data has been used.
Availability of data
For some indicators data is not available for all countries (in particular for the less
or least developed economies). If non-available data points would be
converted to a 0 (zero) score, the rankings would be distorted. In order to present
a balanced overall picture, the missing data points from those countries have
been replaced with calculated values, extrapolated based on regional
averages, income and development levels, as well as geographical features
and climatic averages.

SolAbility page: 50
the sustainable competitiveness index 2016

page 51 the sustainable competitiveness index 2016
Sustainable
Competitive Summary Social
Capital
Intellectual
Capital Resource
Management Governance Spotlight Data
Sustainable
Competitiveness Natural Capital Governance Intellectual Capital Resource Intensity
Sustainable vs. WEF
Competitiveness Tables Social Cohesion
9 Data Tables
The Global Sustainable Competitiveness Index
Country Ra nk Sc ore Country Ra nk Sc ore Country Ra nk Sc ore Country Ra nk Sc ore
Sweden 1 60.9 Brunei 46 46.5 Mauritius 91 42.4 Egypt 136 38.2
Norway 2 59.4 Kazakhstan 47 46.2 Vietnam 92 42.4 Vanuatu 137 38.2
Finland 3 56.2 Argentina 48 46.2 Tunisia 93 42.2 Morocco 138 38.1
Denmark 4 56.0 Suriname 49 45.8 Namibia 94 42.2 Turkmenistan 139 38.0
Iceland 5 56.0 Boliv ia 50 45.8 Tanzania 95 42.2 Togo 140 37.9
Slov enia 6 54.8 Cuba 51 45.8 Kuwait 96 42.1 Samoa 141 37.8
Switzerland 7 54.4 Mongolia 52 45.3 Philippines 97 42.0 Jamaica 142 37.8
Ireland 8 53.9 Greece 53 45.2 Mozambique 98 42.0 Bahrain 143 37.6
Luxembourg 9 53.8 Malta 54 45.2 Papua New Guinea 99 41.7 Malawi 144 37.6
Austria 10 53.8 Israel 55 45.1 Thailand 100 41.6 Sudan 145 37.5
Estonia 11 53.6 Bosnia and Herzegov ina 56 45.1 United Arab Emirates 101 41.5 Guinea-Bissau 146 37.5
New Zealand 12 53.5 Indonesia 57 45.0 Dominica 102 41.5 Iran 147 37.5
Liechtenstein 13 52.4 Bhutan 58 45.0 Dominican Republic 103 41.4 Swaziland 148 37.5
Germany 14 52.1 Bulgaria 59 44.8 Nicaragua 104 41.4 Guatemala 149 37.3
Japan 15 52.0 Singapore 60 44.7 Cyprus 105 41.2 Rwanda 150 37.1
Slov akia 16 51.8 Republic of Congo 61 44.7 Seychelles 106 41.1 Comoros 151 37.0
France 17 51.8 Chile 62 44.6 Kenya 107 40.9 India 152 36.9
Lithuania 18 51.8 Uzbekistan 63 44.6 Equatorial Guinea 108 40.7 Solomon Islands 153 36.9
Croatia 19 51.0 Ukraine 64 44.6 Bahamas 109 40.6 Guinea 154 36.9
Latv ia 20 51.0 Burma 65 44.4 Guyana 110 40.6 Bangladesh 155 36.9
United Kingdom 21 51.0 Kyrgistan 66 44.3 Trinidad and Tobago 111 40.5 Burkina Faso 156 36.8
Canada 22 50.8 Laos 67 44.2 Algeria 112 40.4 Madagascar 157 36.7
Czech Republic 23 50.8 Qatar 68 44.2 Saudi Arabia 113 40.4 South Africa 158 36.5
Belarus 24 49.2 Mexico 69 44.2 Angola 114 40.3 Honduras 159 36.5
Poland 25 49.2 Oman 70 44.1 Azerbaijan 115 40.1 Gambia 160 36.3
Australia 26 49.1 Serbia 71 44.0 Maldiv es 116 40.1 Liberia 161 36.2
Portugal 27 48.9 Ghana 72 44.0 Cape Verde 117 40.0 Uganda 162 36.2
Belgium 28 48.4 Panama 73 43.9 Fiji 118 40.0 Chad 163 35.7
Netherlands 29 48.2 Venezuela 74 43.9 El Salv ador 119 39.8 Syria 164 35.5
Peru 30 48.0 Armenia 75 43.8 Zambia 120 39.8 Pakistan 165 35.3
Romania 31 47.7 Albania 76 43.8 Lebanon 121 39.8 Afghanistan 166 35.1
USA 32 47.6 Nepal 77 43.6 St. Kitts and Nev is 122 39.6 Sao Tome and Principe 167 34.3
Malaysia 33 47.4 Belize 78 43.6 Sierra Leone 123 39.5 Djibouti 168 34.0
Costa Rica 34 47.4 Democratic Republic of Congo79 43.5 Nigeria 124 39.3 Central African Republic 169 33.6
Hungary 35 47.3 Moldov a 80 43.5 Cambodia 125 39.2 Iraq 170 33.4
Uruguay 36 47.3 Cameroon 81 43.4 Senegal 126 39.2 Barbados 171 33.3
China 37 47.2 Timor-Leste 82 43.4 Sri Lanka 127 39.0 Zimbabwe 172 33.2
Georgia 38 47.1 Gabon 83 43.3 Libya 128 39.0 Mauritania 173 33.1
Spain 39 46.9 Ethiopia 84 43.2 Botswana 129 38.9 Burundi 174 32.8
South Korea 40 46.9 Macedonia 85 43.2 Lesotho 130 38.9 Grenada 175 32.8
Brazil 41 46.9 Montenegro 86 43.1 Benin 131 38.7 Eritrea 176 32.7
Paraguay 42 46.7 Ecuador 87 43.1 Mali 132 38.6 St. Lucia 177 32.6
Colombia 43 46.7 Turkey 88 43.0 Tonga 133 38.6 Haiti 178 32.6
Italy 44 46.6 Tajikistan 89 42.7 Jordan 134 38.5 Antigua and Barbuda 179 31.0
Russia 45 46.6 Cote d'Iv oire 90 42.5 Niger 135 38.3 Yemen 180 28.6

SolAbility page: 52
the sustainable competitiveness index 2016
Natural Capital Sub-Index
Country Ra nk Sc ore Country Ra nk Sc ore Country Ra nk Sc ore Country Ra nk Sc ore
Democratic Republic of Congo1 70.9 Mali 46 53.5 Togo 91 45.3 Rwanda 136 36.8
Sweden 2 67.6 Austria 47 53.5 Dominica 92 45.2 Sri Lanka 137 36.5
Canada 3 66.5 Timor-Leste 48 53.3 Indonesia 93 44.8 Syria 138 36.4
Finland 4 66.3 Guinea-Bissau 49 53.0 Vanuatu 94 44.8 Egypt 139 36.2
Suriname 5 65.9 Slov enia 50 52.9 Ukraine 95 44.6 Benin 140 35.6
Estonia 6 65.4 Chile 51 52.5 Albania 96 44.2 Oman 141 35.6
Cameroon 7 65.4 Switzerland 52 52.4 Japan 97 44.2 Kenya 142 35.4
Bhutan 8 65.3 Nicaragua 53 52.1 Spain 98 44.1 Grenada 143 35.3
Guyana 9 64.7 Australia 54 52.0 Lesotho 99 43.4 Tonga 144 35.3
Laos 10 63.8 Georgia 55 51.9 Czech Republic 100 43.0 Niger 145 35.1
Republic of Congo 11 63.0 Bosnia and Herzegov ina 56 51.6 Comoros 101 43.0 Senegal 146 35.1
Papua New Guinea 12 62.8 Slov akia 57 51.3 Malawi 102 42.8 Botswana 147 35.0
Equatorial Guinea 13 62.0 Fiji 58 51.3 Tajikistan 103 42.8 Iran 148 35.0
New Zealand 14 62.0 Zambia 59 51.2 Trinidad and Tobago 104 42.6 Saudi Arabia 149 34.9
Norway 15 62.0 Denmark 60 51.0 Nigeria 105 42.5 Belgium 150 34.8
Cote d'Iv oire 16 61.9 Liechtenstein 61 50.5 Uzbekistan 106 42.2 Burundi 151 34.7
Russia 17 61.1 Ecuador 62 50.5 Cuba 107 42.2 Djibouti 152 34.6
Paraguay 18 60.9 Mozambique 63 50.2 St. Kitts and Nev is 108 42.1 Thailand 153 34.6
Brazil 19 60.2 Malaysia 64 49.9 Libya 109 42.1 South Korea 154 34.4
Latv ia 20 60.2 Portugal 65 49.8 Chad 110 41.9 China 155 34.3
Venezuela 21 59.9 Liberia 66 49.5 Namibia 111 41.8 Philippines 156 34.0
Lithuania 22 59.6 Bahamas 67 49.2 Cape Verde 112 41.6 Turkmenistan 157 33.6
Central African Republic 23 59.5 Mexico 68 49.2 Guatemala 113 41.5 Qatar 158 33.0
Iceland 24 59.5 Sudan 69 49.0 Burkina Faso 114 40.6 Iraq 159 33.0
Burma 25 59.3 Montenegro 70 48.9 Vietnam 115 40.3 United Arab Emirates 160 32.8
Uruguay 26 58.8 Romania 71 48.7 El Salv ador 116 40.3 Maldiv es 161 32.0
Belarus 27 58.7 Brunei 72 48.6 Honduras 117 39.9 Israel 162 31.9
Peru 28 58.0 Serbia 73 48.4 Uganda 118 39.9 Eritrea 163 30.7
Sierra Leone 29 57.9 Samoa 74 48.4 Algeria 119 39.8 Antigua and Barbuda 164 30.5
Angola 30 57.9 Luxembourg 75 48.2 Germany 120 39.8 Barbados 165 30.5
USA 31 57.2 Greece 76 48.1 Zimbabwe 121 39.7 Kuwait 166 29.6
Bulgaria 32 57.2 Poland 77 48.1 Netherlands 122 39.6 Pakistan 167 29.5
Guinea 33 56.9 Ethiopia 78 47.9 United Kingdom 123 39.5 Azerbaijan 168 29.0
Argentina 34 56.6 Costa Rica 79 47.7 Armenia 124 38.9 Lebanon 169 28.6
Boliv ia 35 56.4 Gambia 80 47.0 Mongolia 125 38.7 Malta 170 28.5
France 36 56.3 Ghana 81 46.8 Sao Tome and Principe 126 38.6 Yemen 171 28.4
Colombia 37 56.2 Swaziland 82 46.7 Mauritania 127 38.6 Tunisia 172 28.3
Belize 38 56.0 Kazakhstan 83 46.5 Seychelles 128 38.5 India 173 28.2
Madagascar 39 55.5 Italy 84 46.4 Mauritius 129 38.2 Haiti 174 27.8
Solomon Islands 40 55.3 Dominican Republic 85 46.3 Turkey 130 37.7 Singapore 175 26.3
Croatia 41 55.2 Cambodia 86 46.0 Afghanistan 131 37.5 Jamaica 176 26.2
Gabon 42 54.5 Macedonia 87 45.9 St. Lucia 132 37.4 Bahrain 177 24.9
Ireland 43 54.0 Nepal 88 45.9 South Africa 133 37.4 Cyprus 178 24.7
Tanzania 44 53.9 Kyrgistan 89 45.4 Moldov a 134 37.2 Bangladesh 179 24.3
Panama 45 53.6 Hungary 90 45.4 Morocco 135 36.9 Jordan 180 20.2

page 53 the sustainable competitiveness index 2016
Sustainable
Competitive Summary Social
Capital
Intellectual
Capital Resource
Management Governance Spotlight Data
Sustainable
Competitiveness Natural Capital Governance Intellectual Capital Resource Intensity
Sustainable vs. WEF
Competitiveness Tables Social Cohesion
Resource Intensity Sub-Index
Country Ra nk Sc ore Country Ra nk Sc ore Country Ra nk Sc ore Country Ra nk Sc ore
Republic of Congo 1 61.4 Burma 46 47.4 Portugal 91 42.4 Libya 136 37.9
Mozambique 2 61.3 Uruguay 47 47.1 Iceland 92 42.4 Liechtenstein 137 37.6
Ethiopia 3 59.1 Rwanda 48 47.0 Fiji 93 42.1 India 138 37.6
Kenya 4 58.9 Malawi 49 46.8 Laos 94 42.1 St. Kitts and Nev is 139 37.4
Democratic Republic of Congo5 58.2 Burkina Faso 50 46.6 Botswana 95 42.1 Algeria 140 37.4
Angola 6 57.8 Papua New Guinea 51 46.4 Guyana 96 42.1 Slov enia 141 37.2
Tanzania 7 57.8 Gambia 52 46.4 Mongolia 97 42.0 Dominican Republic 142 36.7
Nigeria 8 57.5 Panama 53 46.4 Djibouti 98 42.0 Canada 143 36.7
Nepal 9 56.7 Switzerland 54 46.2 Cuba 99 42.0 South Africa 144 36.4
Togo 10 56.0 Lithuania 55 46.1 Qatar 100 41.7 Thailand 145 36.2
Zambia 11 55.3 Chad 56 46.0 Afghanistan 101 41.4 Mauritania 146 35.8
Cote d'Iv oire 12 55.1 Peru 57 46.0 Spain 102 41.4 United Arab Emirates 147 35.7
Cameroon 13 54.8 Burundi 58 45.9 Finland 103 41.4 Oman 148 35.6
Nicaragua 14 54.7 Moldov a 59 45.7 Samoa 104 41.3 Germany 149 35.4
Haiti 15 54.6 Croatia 60 45.6 Syria 105 41.2 Iraq 150 35.3
Honduras 16 54.4 Bangladesh 61 45.6 Brunei 106 41.1 Macedonia 151 35.0
Guatemala 17 54.4 Tunisia 62 45.5 Vanuatu 107 40.9 Russia 152 34.8
Jamaica 18 53.8 Romania 63 45.4 Australia 108 40.9 Lebanon 153 34.6
Equatorial Guinea 19 53.8 Madagascar 64 45.4 Solomon Islands 109 40.9 Morocco 154 34.5
Benin 20 53.1 Slov akia 65 45.3 Belgium 110 40.7 Bhutan 155 34.4
Ireland 21 52.7 Brazil 66 45.3 Mali 111 40.7 Ukraine 156 34.4
Gabon 22 52.3 Indonesia 67 45.1 Austria 112 40.7 Singapore 157 34.4
Ghana 23 52.0 Sierra Leone 68 44.8 Mexico 113 40.6 Turkmenistan 158 34.3
Lesotho 24 51.9 Senegal 69 44.8 Seychelles 114 40.4 Bahamas 159 34.3
Costa Rica 25 51.6 Cape Verde 70 44.6 Mauritius 115 40.1 Netherlands 160 33.9
Sweden 26 51.5 Armenia 71 44.6 Italy 116 40.1 USA 161 33.8
Sao Tome and Principe 27 51.2 Pakistan 72 44.5 Poland 117 40.1 Japan 162 33.7
Philippines 28 51.0 Cyprus 73 44.4 Central African Republic 118 40.0 Kuwait 163 33.6
Namibia 29 50.9 Timor-Leste 74 43.8 Venezuela 119 40.0 Malaysia 164 33.3
Boliv ia 30 50.7 Tonga 75 43.7 Swaziland 120 40.0 Bahrain 165 33.1
Cambodia 31 50.3 Georgia 76 43.4 Maldiv es 121 39.8 China 166 32.7
Colombia 32 50.2 Dominica 77 43.4 Czech Republic 122 39.6 Grenada 167 32.3
Latv ia 33 50.1 Albania 78 43.4 Sri Lanka 123 39.6 Serbia 168 32.3
El Salv ador 34 50.0 Greece 79 43.3 New Zealand 124 39.5 Iran 169 32.2
Luxembourg 35 50.0 Guinea 80 43.2 Belarus 125 39.4 Vietnam 170 32.2
Belize 36 49.8 Sudan 81 43.2 Argentina 126 39.4 Turkey 171 32.1
Comoros 37 49.6 Yemen 82 43.1 Uzbekistan 127 39.4 St. Lucia 172 32.0
Eritrea 38 49.5 Liberia 83 43.1 Hungary 128 39.4 Bulgaria 173 31.9
United Kingdom 39 49.3 Trinidad and Tobago 84 43.1 Kyrgistan 129 39.4 Montenegro 174 31.9
Uganda 40 49.2 Guinea-Bissau 85 43.0 Jordan 130 39.3 Kazakhstan 175 31.4
Niger 41 49.1 Chile 86 43.0 Suriname 131 39.3 Barbados 176 30.3
Denmark 42 48.7 Bosnia and Herzegov ina 87 43.0 Azerbaijan 132 39.1 Antigua and Barbuda 177 30.2
Paraguay 43 48.3 Zimbabwe 88 42.8 Ecuador 133 39.0 Egypt 178 30.0
Norway 44 48.3 France 89 42.7 Israel 134 38.8 Saudi Arabia 179 26.9
Tajikistan 45 47.7 Malta 90 42.6 Estonia 135 37.9 South Korea 180 25.1

SolAbility page: 54
the sustainable competitiveness index 2016
Social Capital Sub-Index
Country Ra nk Sc ore Country Ra nk Sc ore Country Ra nk Sc ore Country Ra nk Sc ore
Norway 1 63.3 Italy 46 47.8 Indonesia 91 39.2 Gambia 136 33.7
Luxembourg 2 63.0 Moldov a 47 47.8 Laos 92 39.2 Mali 137 33.6
Iceland 3 61.8 Maldiv es 48 47.6 Bangladesh 93 39.2 Rwanda 138 33.6
Germany 4 60.6 Montenegro 49 47.4 Bahrain 94 39.1 Trinidad and Tobago 139 33.4
Denmark 5 60.4 China 50 47.2 Thailand 95 39.0 Colombia 140 33.4
Slov enia 6 60.1 Kyrgistan 51 47.2 Niger 96 38.6 Morocco 141 32.9
Finland 7 60.0 Malta 52 47.0 Philippines 97 38.6 Venezuela 142 32.8
Belgium 8 60.0 Armenia 53 46.7 Peru 98 38.4 Benin 143 32.8
Netherlands 9 59.5 Ukraine 54 46.7 Sierra Leone 99 38.4 Gabon 144 32.8
Sweden 10 59.3 United Arab Emirates 55 46.5 Mozambique 100 38.3 Chad 145 32.8
Austria 11 58.6 Libya 56 46.3 Suriname 101 38.1 Cape Verde 146 32.5
Japan 12 58.4 Azerbaijan 57 46.3 Pakistan 102 38.0 Equatorial Guinea 147 32.5
Switzerland 13 58.2 Tajikistan 58 46.3 Tonga 103 38.0 Kenya 148 32.4
Kuwait 14 57.2 Uzbekistan 59 46.1 Ethiopia 104 37.6 Zambia 149 32.2
Liechtenstein 15 57.1 Hungary 60 45.6 Belize 105 37.4 Uganda 150 32.1
Qatar 16 55.8 Greece 61 45.1 Dominican Republic 106 37.4 Guinea-Bissau 151 32.0
Oman 17 55.2 Seychelles 62 45.1 Bahamas 107 36.9 Iran 152 31.7
Spain 18 55.0 Algeria 63 45.1 Burma 108 36.6 Zimbabwe 153 31.4
Slov akia 19 54.3 Argentina 64 44.7 Nicaragua 109 36.6 Cote d'Iv oire 154 31.3
France 20 53.9 South Korea 65 43.5 India 110 36.6 Botswana 155 31.3
Czech Republic 21 53.0 Malaysia 66 43.4 South Africa 111 36.5 Comoros 156 31.1
Croatia 22 52.5 Israel 67 43.1 Namibia 112 36.2 Angola 157 30.8
Canada 23 52.4 Costa Rica 68 43.1 Liberia 113 36.2 Sao Tome and Principe 158 30.2
Ireland 24 52.4 Cuba 69 42.8 USA 114 36.1 Samoa 159 30.2
Mongolia 25 52.3 Macedonia 70 42.3 Afghanistan 115 35.9 Togo 160 30.0
United Kingdom 26 52.2 Latv ia 71 42.0 Cameroon 116 35.6 Chile 161 29.9
Brunei 27 51.1 Georgia 72 41.9 Guinea 117 35.5 Republic of Congo 162 29.4
Romania 28 50.7 Turkey 73 41.9 Brazil 118 35.5 Antigua and Barbuda 163 29.3
Timor-Leste 29 50.7 Bhutan 74 41.9 Cambodia 119 35.3 Vanuatu 164 29.3
Jordan 30 50.5 Nepal 75 41.8 Sri Lanka 120 35.2 Yemen 165 28.8
Poland 31 50.4 Albania 76 41.7 Madagascar 121 35.0 Barbados 166 28.8
Lebanon 32 50.2 Mexico 77 41.6 Mauritius 122 35.0 Guyana 167 28.7
Portugal 33 50.2 Turkmenistan 78 41.0 Boliv ia 123 35.0 Djibouti 168 28.7
Singapore 34 50.0 Vietnam 79 40.9 Tanzania 124 35.0 Democratic Republic of Congo169 28.5
Estonia 35 50.0 Uruguay 80 40.9 El Salv ador 125 34.9 Guatemala 170 28.3
New Zealand 36 49.9 Bulgaria 81 40.7 Russia 126 34.8 Fiji 171 28.2
Serbia 37 49.7 Papua New Guinea 82 40.7 Paraguay 127 34.7 Grenada 172 28.2
Kazakhstan 38 49.6 Panama 83 40.7 St. Kitts and Nev is 128 34.6 Eritrea 173 28.2
Bosnia and Herzegov ina 39 49.6 Ghana 84 40.2 Malawi 129 34.6 Sudan 174 27.9
Tunisia 40 49.4 Senegal 85 40.1 Iraq 130 34.5 Honduras 175 27.5
Cyprus 41 49.3 Ecuador 86 40.1 Burundi 131 34.2 Haiti 176 26.0
Saudi Arabia 42 49.0 Egypt 87 40.0 Mauritania 132 34.1 Central African Republic 177 25.6
Australia 43 48.5 Syria 88 39.6 Solomon Islands 133 34.1 Swaziland 178 25.5
Belarus 44 48.3 Burkina Faso 89 39.3 Lesotho 134 33.9 Nigeria 179 24.8
Lithuania 45 47.8 Dominica 90 39.2 Jamaica 135 33.9 St. Lucia 180 18.5

page 55 the sustainable competitiveness index 2016
Sustainable
Competitive Summary Social
Capital
Intellectual
Capital Resource
Management Governance Spotlight Data
Sustainable
Competitiveness Natural Capital Governance Intellectual Capital Resource Intensity
Sustainable vs. WEF
Competitiveness Tables Social Cohesion
Intellectual Capital Sub-Index
Country Ra nk Sc ore Country Ra nk Sc ore Country Ra nk Sc ore Country Ra nk Sc ore
South Korea 1 75.2 Venezuela 46 45.7 Mexico 91 37.3 Honduras 136 29.4
Sweden 2 70.8 Kyrgistan 47 45.6 Armenia 92 37.3 Rwanda 137 28.6
Slov enia 3 68.0 Belarus 48 45.3 Tajikistan 93 37.2 Panama 138 28.3
Japan 4 65.7 Spain 49 45.2 United Arab Emirates 94 36.9 Nigeria 139 28.2
Finland 5 64.2 Brazil 50 44.9 Ghana 95 36.9 Mali 140 28.1
Germany 6 63.7 Latv ia 51 44.8 Suriname 96 36.8 Nicaragua 141 28.0
China 7 63.0 Vietnam 52 44.7 Vanuatu 97 36.7 Benin 142 27.2
Denmark 8 62.9 Costa Rica 53 44.7 Philippines 98 36.7 Sao Tome and Principe 143 27.0
Norway 9 62.4 Bulgaria 54 44.6 Samoa 99 36.6 Niger 144 26.9
Singapore 10 62.3 Cyprus 55 43.7 Egypt 100 36.6 Lesotho 145 26.4
Malta 11 62.2 Barbados 56 43.6 Cape Verde 101 36.4 Burkina Faso 146 26.4
Switzerland 12 61.1 Serbia 57 43.6 Timor-Leste 102 36.3 Papua New Guinea 147 26.3
Netherlands 13 60.7 Paraguay 58 43.4 Turkmenistan 103 36.2 Cote d'Iv oire 148 26.2
United Kingdom 14 60.4 Chile 59 43.4 Swaziland 104 36.1 Haiti 149 25.8
Israel 15 60.0 Mongolia 60 43.4 Ecuador 105 35.9 Ethiopia 150 25.4
Liechtenstein 16 59.3 Oman 61 43.2 South Africa 106 35.7 Sudan 151 24.9
Iceland 17 58.7 Peru 62 43.1 Dominica 107 35.5 Djibouti 152 24.6
Austria 18 58.2 Uzbekistan 63 42.6 Algeria 108 35.2 Iraq 153 24.1
USA 19 57.9 Jordan 64 42.6 Qatar 109 35.1 Cambodia 154 24.0
New Zealand 20 57.8 Bahamas 65 42.4 Seychelles 110 35.0 Chad 155 23.9
Czech Republic 21 57.1 Moldov a 66 42.1 Trinidad and Tobago 111 34.8 Sierra Leone 156 23.8
Belgium 22 56.9 Botswana 67 42.1 Senegal 112 34.7 Mozambique 157 23.3
France 23 56.4 Georgia 68 42.0 Romania 113 34.7 Equatorial Guinea 158 22.8
Ireland 24 55.9 Macedonia 69 41.9 Kenya 114 34.5 Angola 159 22.3
Malaysia 25 54.4 Albania 70 41.8 Gabon 115 34.4 Gambia 160 22.3
Lithuania 26 54.4 Tunisia 71 41.5 India 116 34.4 Guinea-Bissau 161 22.1
Portugal 27 54.2 Mauritius 72 41.3 Laos 117 34.4 Cameroon 162 21.7
Luxembourg 28 52.5 Bahrain 73 41.0 Bhutan 118 34.3 Mauritania 163 21.5
Estonia 29 51.9 Morocco 74 40.9 Uruguay 119 34.2 Tanzania 164 21.4
Hungary 30 51.5 Saudi Arabia 75 40.9 Azerbaijan 120 33.8 Burundi 165 21.4
Poland 31 51.1 Argentina 76 40.6 Indonesia 121 33.5 Liberia 166 21.3
Croatia 32 50.8 Maldiv es 77 40.3 Guyana 122 32.2 Afghanistan 167 21.2
Australia 33 50.5 Jamaica 78 40.1 Republic of Congo 123 32.1 Bangladesh 168 21.1
Canada 34 50.5 Fiji 79 39.7 El Salv ador 124 31.7 Togo 169 20.9
Ukraine 35 50.3 St. Kitts and Nev is 80 39.5 Grenada 125 31.7 Democratic Republic of Congo170 20.2
Slov akia 36 49.9 Colombia 81 39.1 Sri Lanka 126 31.6 Eritrea 171 19.8
Brunei 37 49.9 Namibia 82 39.0 Bosnia and Herzegov ina 127 31.4 Uganda 172 19.5
Cuba 38 49.8 Kuwait 83 38.8 Malawi 128 31.0 Guatemala 173 19.2
Italy 39 49.3 Iran 84 38.7 Antigua and Barbuda 129 30.9 Guinea 174 18.8
Kazakhstan 40 49.1 Montenegro 85 38.7 Burma 130 30.6 Zambia 175 17.9
Greece 41 49.0 Belize 86 38.0 Nepal 131 29.8 Zimbabwe 176 17.8
Russia 42 48.9 Dominican Republic 87 37.8 Comoros 132 29.7 Yemen 177 17.7
Thailand 43 48.8 St. Lucia 88 37.5 Libya 133 29.6 Central African Republic 178 15.4
Turkey 44 48.4 Tonga 89 37.4 Syria 134 29.5 Madagascar 179 15.3
Lebanon 45 48.0 Boliv ia 90 37.4 Solomon Islands 135 29.4 Pakistan 180 15.0

SolAbility page: 56
the sustainable competitiveness index 2016
Governance Sub-Index
Country Rank Score Country Rank Score Country Rank Score Country Rank Score
Estonia 1 62.6 Sri Lanka 46 52.1 Serbia 91 46.2 Lesotho 136 39.0
Indonesia 2 62.6 Israel 47 51.8 Ethiopia 92 46.2 Libya 137 38.9
Norway 3 61.3 Kuwait 48 51.5 Malta 93 45.7 Fiji 138 38.8
Czech Republic 4 61.2 Armenia 49 51.4 Morocco 94 45.3 Tonga 139 38.5
Germany 5 60.7 Macedonia 50 51.0 Cape Verde 95 45.1 Cote d'Iv oire 140 38.1
China 6 58.9 Croatia 51 51.0 Turkmenistan 96 45.0 Guinea-Bissau 141 37.6
Romania 7 58.9 Oman 52 50.9 Moldov a 97 44.8 Togo 142 37.5
Slov akia 8 58.3 Lithuania 53 50.9 Algeria 98 44.7 St. Lucia 143 37.4
New Zealand 9 58.1 Singapore 54 50.7 Benin 99 44.6 Lebanon 144 37.4
Austria 10 57.9 Panama 55 50.4 Botswana 100 44.3 Republic of Congo 145 37.3
Japan 11 57.8 Bahrain 56 50.1 St. Kitts and Nev is 101 44.1 Mali 146 37.0
Latv ia 12 57.8 Saudi Arabia 57 50.1 Cyprus 102 44.1 Belize 147 36.9
Iceland 13 57.8 Costa Rica 58 50.1 Kyrgistan 103 44.0 Mozambique 148 36.9
Mauritius 14 57.4 Bosnia and Herzegov ina 59 50.0 Nepal 104 44.0 South Africa 149 36.7
Liechtenstein 15 57.3 Iran 60 50.0 Dominica 105 43.9 Grenada 150 36.5
Denmark 16 57.2 Mongolia 61 49.9 Ghana 106 43.9 Nicaragua 151 35.8
Poland 17 56.4 Ecuador 62 49.8 Nigeria 107 43.6 Mauritania 152 35.5
Georgia 18 56.2 Philippines 63 49.7 Kenya 108 43.5 Eritrea 153 35.3
South Korea 19 56.2 Argentina 64 49.7 Namibia 109 43.4 Guyana 154 35.3
Malaysia 20 56.0 Pakistan 65 49.7 Guatemala 110 42.9 Jamaica 155 34.9
Slov enia 21 55.8 France 66 49.6 Tanzania 111 42.8 Zimbabwe 156 34.5
United Arab Emirates 22 55.7 Boliv ia 67 49.5 Sudan 112 42.8 Antigua and Barbuda 157 34.1
Sweden 23 55.5 Belgium 68 49.5 Gabon 113 42.7 Chad 158 33.8
Qatar 24 55.4 Thailand 69 49.5 Zambia 114 42.4 Barbados 159 33.2
Luxembourg 25 55.2 Bulgaria 70 49.4 El Salv ador 115 42.3 Angola 160 32.9
Uruguay 26 55.2 Italy 71 49.4 Niger 116 42.0 Timor-Leste 161 32.9
Turkey 27 55.1 Suriname 72 49.1 Brunei 117 41.8 Sierra Leone 162 32.8
Colombia 28 54.8 Spain 73 49.1 Laos 118 41.8 Equatorial Guinea 163 32.6
Ireland 29 54.8 Finland 74 49.0 Senegal 119 41.2 Malawi 164 32.6
Hungary 30 54.7 Dominican Republic 75 49.0 Maldiv es 120 41.0 Papua New Guinea 165 32.5
Peru 31 54.7 Bhutan 76 48.9 Venezuela 121 40.9 Samoa 166 32.5
Kazakhstan 32 54.4 Montenegro 77 48.8 Cambodia 122 40.5 Madagascar 167 32.3
Belarus 33 54.4 Trinidad and Tobago 78 48.8 Greece 123 40.4 Gambia 168 32.2
Chile 34 54.3 Brazil 79 48.5 Djibouti 124 40.4 Honduras 169 31.4
Switzerland 35 54.3 Egypt 80 48.1 Bahamas 125 40.2 Comoros 170 31.4
Bangladesh 36 54.2 Canada 81 48.1 Uganda 126 40.2 Burkina Faso 171 31.1
Australia 37 53.7 Burma 82 48.0 Jordan 127 40.1 Liberia 172 30.8
Vietnam 38 53.6 India 83 48.0 Democratic Republic of Congo128 39.9 Syria 173 30.6
United Kingdom 39 53.4 Portugal 84 47.9 Iraq 129 39.8 Guinea 174 30.0
Russia 40 53.2 Albania 85 47.7 Cameroon 130 39.7 Haiti 175 28.7
USA 41 53.0 Netherlands 86 47.4 Tajikistan 131 39.4 Burundi 176 28.1
Uzbekistan 42 52.8 Ukraine 87 46.9 Rwanda 132 39.3 Central African Republic 177 27.6
Azerbaijan 43 52.5 Tunisia 88 46.6 Afghanistan 133 39.2 Yemen 178 25.1
Mexico 44 52.1 Paraguay 89 46.5 Vanuatu 134 39.1 Solomon Islands 179 24.7
Cuba 45 52.1 Seychelles 90 46.3 Swaziland 135 39.1 Sao Tome and Principe 180 24.3

page 57 the sustainable competitiveness index 2016
Sustainable
Competitive Summary Social
Capital
Intellectual
Capital Resource
Management Governance Spotlight Data
Sustainable
Competitiveness Natural Capital Governance Intellectual Capital Resource Intensity
Sustainable vs. WEF
Competitiveness Tables Social Cohesion
Disclaimer
No warranty
This publication is derived from sources believed to be accurate and reliable, but
neither its accuracy nor completeness is guaranteed. The material and information in
this publication are provided "as is" and without warranties of any kind, either expressed
or implied. SolAbility disclaims all warranties, expressed or implied, including, but not
limited to, implied warranties of merchantability and fitness for a particular purpose.
Any opinions and views in this publication reflect the current judgment of the authors
and may change without notice. It is each reader's responsibility to evaluate the
accuracy, completeness and usefulness of any opinions, advice, services or other
information provided in this publication.
Limitation of liability
All information contained in this publication is distributed with the understanding that
the authors, publishers and distributors are not rendering legal, accounting or other
professional advice or opinions on specific facts or matters and accordingly assume
no liability whatsoever in connection with its use. In no event shall SolAbility be liable for
any direct, indirect, special, incidental or consequential damages arising out of the use
of any opinion or information expressly or implicitly contained in this publication.
Copyright
Unless otherwise noted, text, images and layout of this publication are the exclusive
property of SolAbility. Republication is welcome.
No Offer
The information and opinions contained in this publication constitutes neither a
solicitation, nor a recommendation, nor an offer to buy or sell investment instruments
or other services, or to engage in any other kind of transaction. The information
described in this publication is not directed to persons in any jurisdiction where the
provision of such information would run counter to local laws and regulation.

SolAbility page: 58
the sustainable competitiveness index 2016
5th edition
www.solability.com