Embed Size (px)
Citation preview

That shrinking feeling: Tracing the changing shape of the European banking industry
www.pwc.com/financialservices
February 2015

Contents
About the report 3
Introduction 4
Infographics 6
A Rubik’s cube of regulation 12
The winding road to capital adequacy 13
Why have assets declined? 16
The short and long end of liquidity 20
International perspective 24
The way forward 26
Conclusion 28
Case studies 29
Notes 36
Appendix 37
Contacts 42

About the report
This report outlines the space that European banks are increasingly likely to occupy and attempts to shed light on how the industry has changed since the announcement of the Basel III rules in 2010. The EIU gathered balance sheet data from 33 banks across the European Union (EU), Australia, Canada, Japan and the US; 17 of the banks were from Europe. The data covered the period 2009–2013. Some data from banks in the US and Japan were omitted because the information was insufficient and non-substantial.
That shrinking feeling: Tracing the changing shape of the European banking industry is a report commissioned by PwC and written by the Economist Intelligence Unit (EIU). Based on a quantitative analysis of the European banking industry’s aggregate balance sheet, which was performed by the EIU, the report investigates how banks are adapting to profound changes in regulation.
PwC That shrinking feeling: Tracing the changing shape of the European banking industry 3
4 PwC That shrinking feeling: Tracing the changing shape of the European banking industry
Introduction
The prognosis is improving. The powerful medicine administered by regulators has fortified the balance sheets of banks and reduced the risks associated with proprietary trading and wholesale funding. Banks are being required to set aside ever more capital and to value their assets more consistently.
But the banks remain in a period of painful transition. They remain unsure what new regulatory and legal requirements they will be asked to meet – to say nothing of what further misconduct fines they might have to pay. Banks globally have paid an estimated USD 170 billion in fines since 2008, according to Macquarie.1 Europe’s banks account for a non-negligible chunk of this total. Banks also do not know when their underlying business will pick up. Subdued credit demand and very low net interest margins have depressed profitability. Europe needs healthy banks to finance recovery and so help stave off deflation. In the US, where capital markets are more developed, bank assets are about two-thirds of GDP. In Europe, by contrast, bank assets are almost three times the size of the economy.2 The ECB has wheeled out a succession
of cheap-funding schemes designed to spur banks to lend more, especially to small and medium-sized enterprises (SMEs). They have helped at the margin, but the main problem is tepid demand for credit. Companies and households alike are still looking to pay down debt, not take on more. Big companies that do want to borrow can often raise money on finer terms in the bond market than through banks. True, SMEs are hungry for finance, but years of recession and sub-par growth have made the sector a risky proposition.
When the economy does eventually improve, our analysis suggests that big banks will be reasonably well-positioned to take advantage. They will certainly look very different than before the crisis. Because of new regulations, risky activities such as proprietary trading, complex securitisations and over-the-counter derivatives deals are now either proscribed or prohibitively expensive because of additional capital charges. Instead, CEOs are stressing the importance of getting back to basics – regaining public trust by providing straightforward products that businesses and households genuinely need.
Six years on from the ‘great financial crisis’, the European banking system is no longer on life support: all banks have regained access to the debt markets; funding strains have eased, reducing their reliance on European Central Bank (ECB) liquidity; and bailed-out lenders are repaying state aid. Many banks, though, are still too sickly to help finance an economic recovery or deliver decent returns to their shareholders.

PwC That shrinking feeling: Tracing the changing shape of the European banking industry 5
These key findings of our report show how banks’ balance sheets have changed in a way that supports this new way of doing business:
• The EU banks in our report already meet the basic, fully loaded Basel III risk-weighted capital (RWC) requirements. (Note, however, that 24 banks fell below the defined thresholds of the European Banking Authority’s [EBA] recent stress tests, which were based on Basel’s transitional capital requirements. The result was an aggregate capital shortfall of EUR 24.6 billion, based on the banks’ end-2013 balance sheets.)3
• Their capital ratios are now generally as strong as those of other global banks.
• The banks are leaner. They have reduced total assets and shed non-core businesses while also expanding their deposit base.
• Banks have overhauled their mix of risk-weighted assets (RWAs). Trading book assets and corporate loans have shrunk. Mortgage lending and sovereign exposure has increased.
• Liquidity has improved considerably. Banks hold more cash and near-cash assets. Short-term borrowings now make up far less of their liabilities.
• The banks already meet the Basel III 30-day Liquidity Coverage Ratio (LCR).
• They also handily exceed the interim minimum leverage ratio of 3%, an important backup to the RWC requirement.
Reconciling these sometimes conflicting standards is tricky. Banks will have to keep juggling both sides of their balance sheets as regulators impose more capital requirements and insist on greater transparency in how they model the riskiness of their assets. Banks are getting better, but are not yet cured.
This report is structured as follows. An infographic provides a visual narrative of the key points in this report. After that, a section on the challenges of meeting Basel III’s various requirements sets the scene. The capital position of EU banks is then examined, setting the stage for an analysis of their assets, liquidity and funding. The conclusion weighs the progress made by the sector and the problems it will still have to overcome.
When the economy does eventually improve, our analysis suggests that big banks will be reasonably well-positioned to take advantage.

6 PwC That shrinking feeling: Tracing the changing shape of the European banking industry
Infographics
PwC That shrinking feeling: Tracing the changing shape of the European banking industry 7
2011 2012 201320102009 2011 2012 201320102009
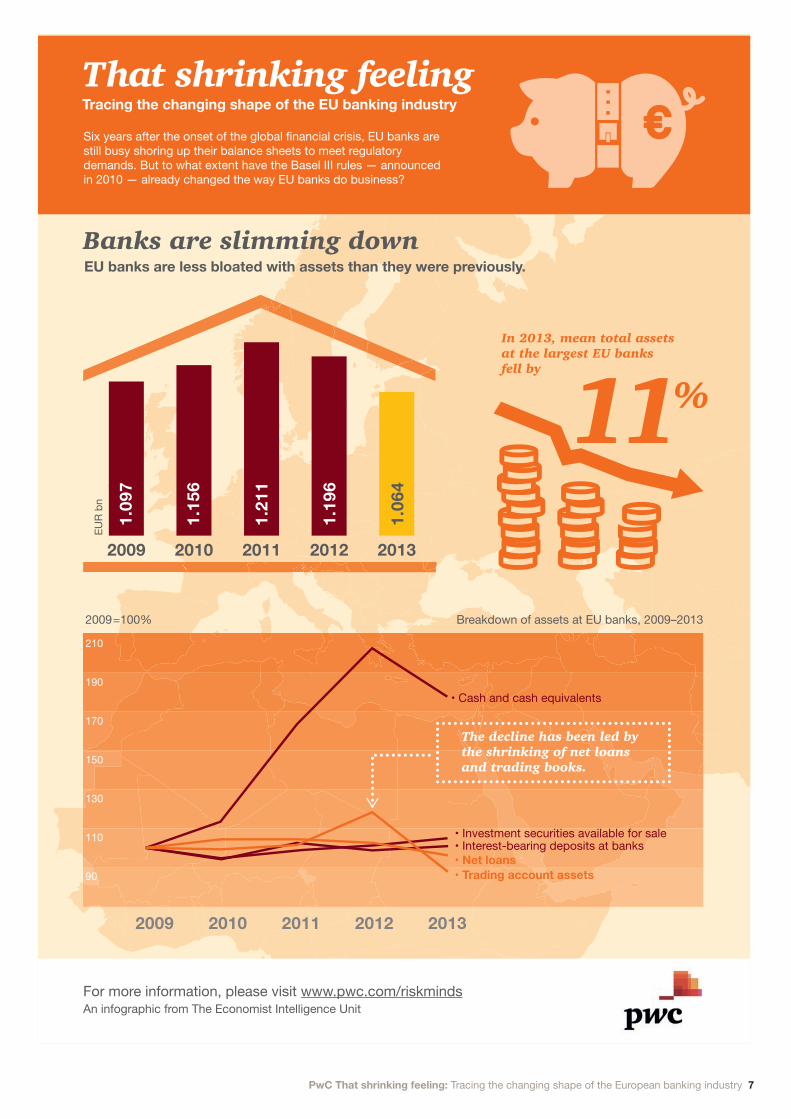
Banks are slimming down
210
190
170
150
130
110
90
2009=100%
The decline has been led bythe shrinking of net loans and trading books.
EUR
bnThat shrinking feelingTracing the changing shape of the EU banking industry
Six years after the onset of the global financial crisis, EU banks are still busy shoring up their balance sheets to meet regulatory demands. But to what extent have the Basel III rules — announcedin 2010 — already changed the way EU banks do business? EUR mn Trading book/market risk, 2011–2013
30000
25000
20000
15000
10000
5000
0
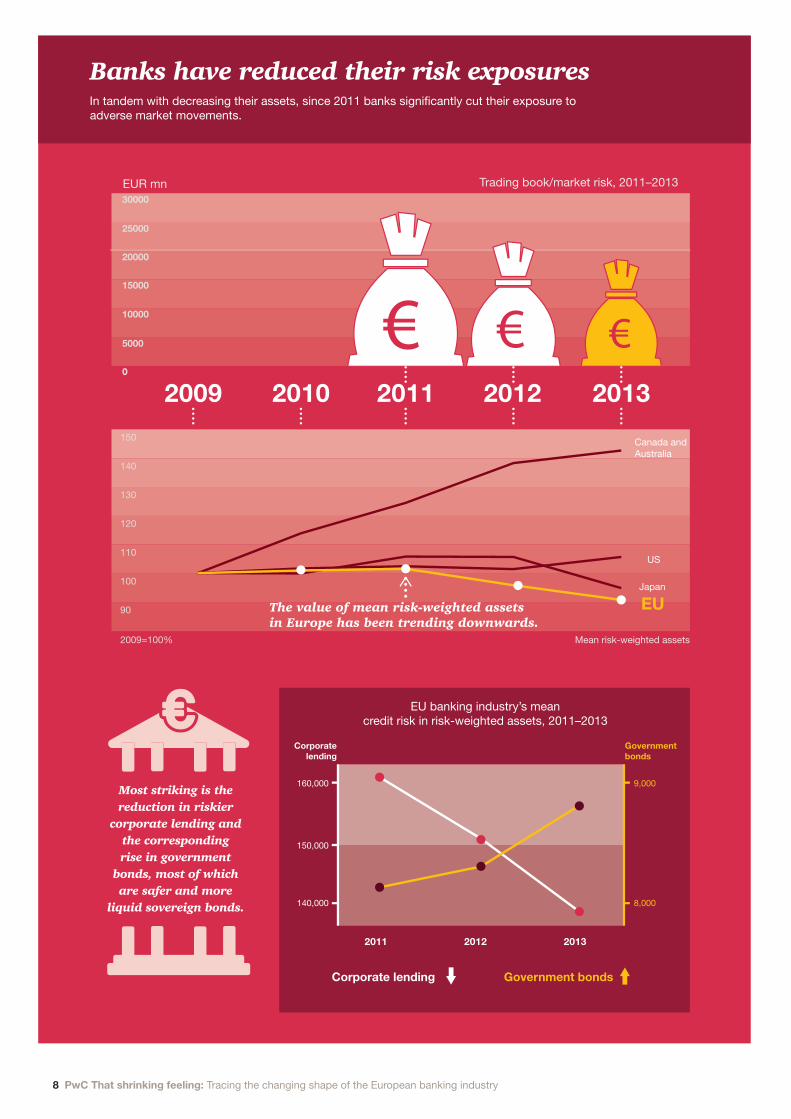
Banks have reduced their risk exposuresIn tandem with decreasing their assets, since 2011 banks significantly cut their exposure to adverse market movements.
Most striking is the reduction in riskier
corporate lending and the corresponding rise in government
bonds, most of which are safer and more
liquid sovereign bonds.
The value of mean risk-weighted assets in Europe has been trending downwards.
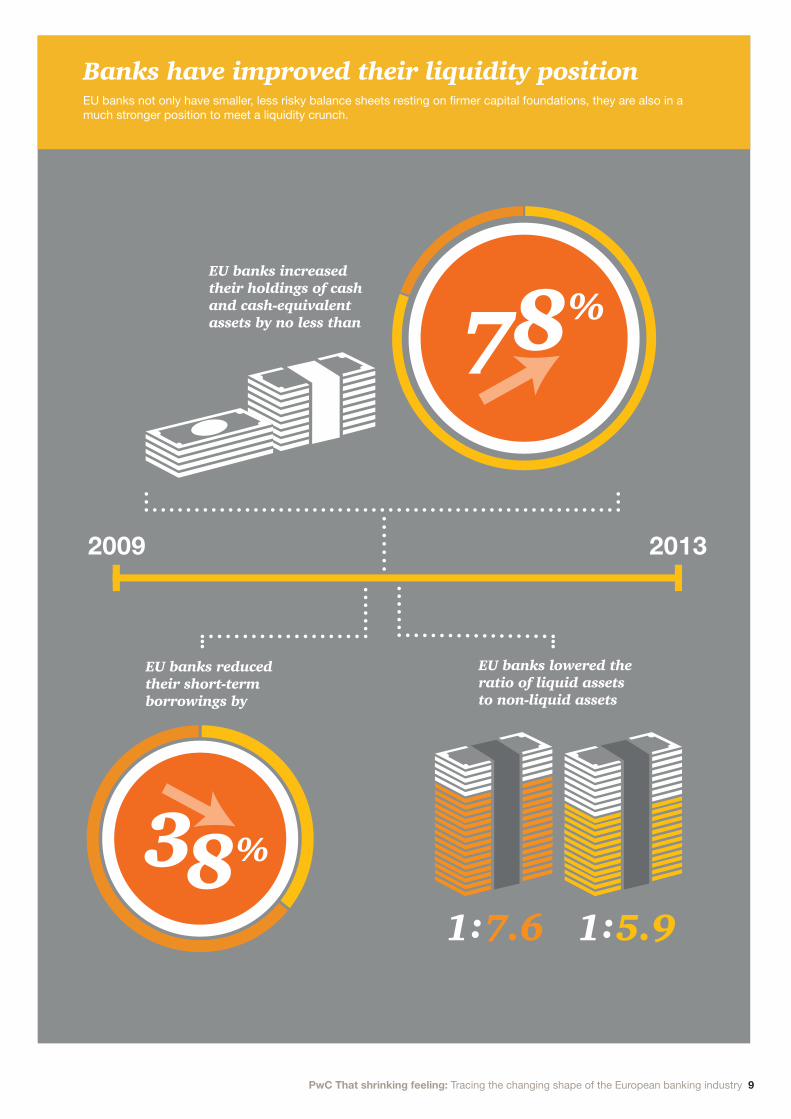
Banks have improved their liquidity positionEU banks not only have smaller, less risky balance sheets resting on firmer capital foundations, they are also in a much stronger position to meet a liquidity crunch.
A springboard for change?This combination of reduced leverage, increased capital quality and a stronger liquidity position has led to a fitter and leaner banking industry.
2009 2013
EU banks increased their holdings of cash and cash-equivalent assets by no less than
EU banks reduced their short-term borrowings by
EU banks lowered the ratio of liquid assets to non-liquid assets
8%711%
In 2013, mean total assetsat the largest EU banksfell by
150
140
130
120
110
100
90
2009=100% Mean risk-weighted assets
Canada andAustralia
US
Japan
EU 2009=100% Value of EU bank loans, 2009–2013
EU banks are less bloated with assets than they were previously.
2011 2012 201320102009
2011 2012 201320102009
• Cash and cash equivalents
• Net loans•�Trading account assets
• Investment securities available for sale• Interest-bearing deposits at banks
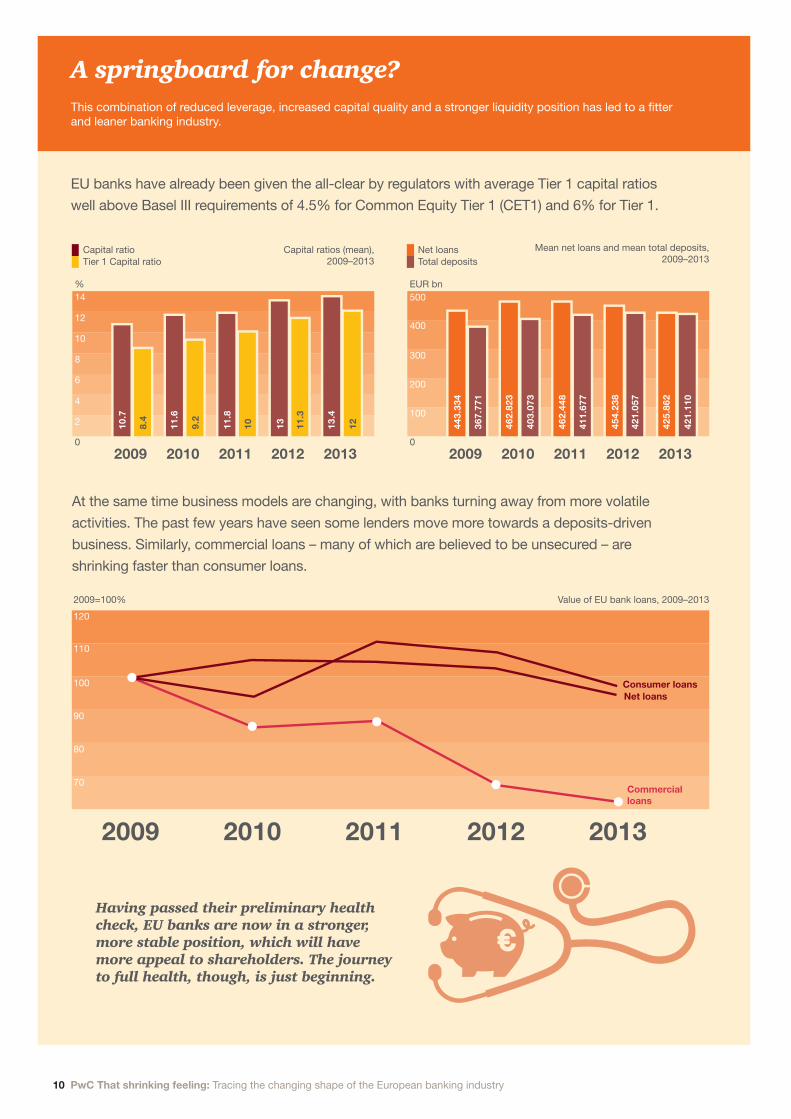
At the same time business models are changing, with banks turning away from more volatile activities. The past few years have seen some lenders move more towards a deposits-driven business. Similarly, commercial loans – many of which are believed to be unsecured – are shrinking faster than consumer loans.
Having passed their preliminary health check, EU banks are now in a stronger, more stable position, which will have more appeal to shareholders. The journey to full health, though, is just beginning.
Tier 1 Capital ratioCapital ratios (mean),
2009–2013Capital ratio
14
12
10
8
6
4
2 10.7
8.4
11.6
9.2
11.8
10 13 11.3
13.4
12
%
Total depositsNet loans
500
400
300
200
100
443.
334
367.
771
462.
823
403.
073
462.
448
411.
677
454.
238
421.
057
425.
862
421.
110
EUR bn
Mean net loans and mean total deposits,2009–2013
EU banks have already been given the all-clear by regulators with average Tier 1 capital ratios well above Basel III requirements of 4.5% for Common Equity Tier 1 (CET1) and 6% for Tier 1.
120
110
100
90
80
70
2011 2012 201320102009
2011 2012 201320102009
Consumer loansNet loans
Commercial loans
160,000
150,000
140,000
9,000
8,000
2011 2012 2013
EU banking industry’s meancredit risk in risk-weighted assets, 2011–2013
Corporatelending
Corporate lending Government bonds
Governmentbonds
1.09
7
1.15
6
1.21
1
1.19
6
1.06
4
Breakdown of assets at EU banks, 2009–2013
For more information, please visit www.pwc.com/riskminds An infographic from The Economist Intelligence Unit
0 0
8%3
8 PwC That shrinking feeling: Tracing the changing shape of the European banking industry
2011 2012 201320102009 2011 2012 201320102009
Banks are slimming down
210
190
170
150
130
110
90
2009=100%
The decline has been led bythe shrinking of net loans and trading books.
EUR
bn
That shrinking feelingTracing the changing shape of the EU banking industry
Six years after the onset of the global financial crisis, EU banks are still busy shoring up their balance sheets to meet regulatory demands. But to what extent have the Basel III rules — announcedin 2010 — already changed the way EU banks do business? EUR mn Trading book/market risk, 2011–2013
30000
25000
20000
15000
10000
5000
0
Banks have reduced their risk exposuresIn tandem with decreasing their assets, since 2011 banks significantly cut their exposure to adverse market movements.
Most striking is the reduction in riskier
corporate lending and the corresponding rise in government
bonds, most of which are safer and more
liquid sovereign bonds.
The value of mean risk-weighted assets in Europe has been trending downwards.
Banks have improved their liquidity positionEU banks not only have smaller, less risky balance sheets resting on firmer capital foundations, they are also in a much stronger position to meet a liquidity crunch.
A springboard for change?This combination of reduced leverage, increased capital quality and a stronger liquidity position has led to a fitter and leaner banking industry.
2009 2013
EU banks increased their holdings of cash and cash-equivalent assets by no less than
EU banks reduced their short-term borrowings by
EU banks lowered the ratio of liquid assets to non-liquid assets
8%711%
In 2013, mean total assetsat the largest EU banksfell by
150
140
130
120
110
100
90
2009=100% Mean risk-weighted assets
Canada andAustralia
US
Japan
EU 2009=100% Value of EU bank loans, 2009–2013
EU banks are less bloated with assets than they were previously.
2011 2012 201320102009
2011 2012 201320102009
• Cash and cash equivalents
• Net loans•�Trading account assets
• Investment securities available for sale• Interest-bearing deposits at banks
At the same time business models are changing, with banks turning away from more volatile activities. The past few years have seen some lenders move more towards a deposits-driven business. Similarly, commercial loans – many of which are believed to be unsecured – are shrinking faster than consumer loans.
Having passed their preliminary health check, EU banks are now in a stronger, more stable position, which will have more appeal to shareholders. The journey to full health, though, is just beginning.
Tier 1 Capital ratioCapital ratios (mean),
2009–2013Capital ratio
14
12
10
8
6
4
2 10.7
8.4
11.6
9.2
11.8
10 13 11.3
13.4
12
%
Total depositsNet loans
500
400
300
200
100
443.
334
367.
771
462.
823
403.
073
462.
448
411.
677
454.
238
421.
057
425.
862
421.
110
EUR bn
Mean net loans and mean total deposits,2009–2013
EU banks have already been given the all-clear by regulators with average Tier 1 capital ratios well above Basel III requirements of 4.5% for Common Equity Tier 1 (CET1) and 6% for Tier 1.
120
110
100
90
80
70
2011 2012 201320102009
2011 2012 201320102009
Consumer loansNet loans
Commercial loans
160,000
150,000
140,000
9,000
8,000
2011 2012 2013
EU banking industry’s meancredit risk in risk-weighted assets, 2011–2013
Corporatelending
Corporate lending Government bonds
Governmentbonds
1.09
7
1.15
6
1.21
1
1.19
6
1.06
4
Breakdown of assets at EU banks, 2009–2013
For more information, please visit www.pwc.com/riskminds An infographic from The Economist Intelligence Unit
0 0
8%3
PwC That shrinking feeling: Tracing the changing shape of the European banking industry 9
2011 2012 201320102009 2011 2012 201320102009
Banks are slimming down
210
190
170
150
130
110
90
2009=100%
The decline has been led bythe shrinking of net loans and trading books.
EUR
bn
That shrinking feelingTracing the changing shape of the EU banking industry
Six years after the onset of the global financial crisis, EU banks are still busy shoring up their balance sheets to meet regulatory demands. But to what extent have the Basel III rules — announcedin 2010 — already changed the way EU banks do business? EUR mn Trading book/market risk, 2011–2013
30000
25000
20000
15000
10000
5000
0
Banks have reduced their risk exposuresIn tandem with decreasing their assets, since 2011 banks significantly cut their exposure to adverse market movements.
Most striking is the reduction in riskier
corporate lending and the corresponding rise in government
bonds, most of which are safer and more
liquid sovereign bonds.
The value of mean risk-weighted assets in Europe has been trending downwards.
Banks have improved their liquidity positionEU banks not only have smaller, less risky balance sheets resting on firmer capital foundations, they are also in a much stronger position to meet a liquidity crunch.
A springboard for change?This combination of reduced leverage, increased capital quality and a stronger liquidity position has led to a fitter and leaner banking industry.
2009 2013
EU banks increased their holdings of cash and cash-equivalent assets by no less than
EU banks reduced their short-term borrowings by
EU banks lowered the ratio of liquid assets to non-liquid assets
8%711%
In 2013, mean total assetsat the largest EU banksfell by
150
140
130
120
110
100
90
2009=100% Mean risk-weighted assets
Canada andAustralia
US
Japan
EU 2009=100% Value of EU bank loans, 2009–2013
EU banks are less bloated with assets than they were previously.
2011 2012 201320102009
2011 2012 201320102009
• Cash and cash equivalents
• Net loans•�Trading account assets
• Investment securities available for sale• Interest-bearing deposits at banks
At the same time business models are changing, with banks turning away from more volatile activities. The past few years have seen some lenders move more towards a deposits-driven business. Similarly, commercial loans – many of which are believed to be unsecured – are shrinking faster than consumer loans.
Having passed their preliminary health check, EU banks are now in a stronger, more stable position, which will have more appeal to shareholders. The journey to full health, though, is just beginning.
Tier 1 Capital ratioCapital ratios (mean),
2009–2013Capital ratio
14
12
10
8
6
4
2 10.7
8.4
11.6
9.2
11.8
10 13 11.3
13.4
12
%
Total depositsNet loans
500
400
300
200
100
443.
334
367.
771
462.
823
403.
073
462.
448
411.
677
454.
238
421.
057
425.
862
421.
110
EUR bn
Mean net loans and mean total deposits,2009–2013
EU banks have already been given the all-clear by regulators with average Tier 1 capital ratios well above Basel III requirements of 4.5% for Common Equity Tier 1 (CET1) and 6% for Tier 1.
120
110
100
90
80
70
2011 2012 201320102009
2011 2012 201320102009
Consumer loansNet loans
Commercial loans
160,000
150,000
140,000
9,000
8,000
2011 2012 2013
EU banking industry’s meancredit risk in risk-weighted assets, 2011–2013
Corporatelending
Corporate lending Government bonds
Governmentbonds
1.09
7
1.15
6
1.21
1
1.19
6
1.06
4
Breakdown of assets at EU banks, 2009–2013
For more information, please visit www.pwc.com/riskminds An infographic from The Economist Intelligence Unit
0 0
8%3
10 PwC That shrinking feeling: Tracing the changing shape of the European banking industry
2011 2012 201320102009 2011 2012 201320102009
Banks are slimming down
210
190
170
150
130
110
90
2009=100%
The decline has been led bythe shrinking of net loans and trading books.
EUR
bn
That shrinking feelingTracing the changing shape of the EU banking industry
Six years after the onset of the global financial crisis, EU banks are still busy shoring up their balance sheets to meet regulatory demands. But to what extent have the Basel III rules — announcedin 2010 — already changed the way EU banks do business? EUR mn Trading book/market risk, 2011–2013
30000
25000
20000
15000
10000
5000
0
Banks have reduced their risk exposuresIn tandem with decreasing their assets, since 2011 banks significantly cut their exposure to adverse market movements.
Most striking is the reduction in riskier
corporate lending and the corresponding rise in government
bonds, most of which are safer and more
liquid sovereign bonds.
The value of mean risk-weighted assets in Europe has been trending downwards.
Banks have improved their liquidity positionEU banks not only have smaller, less risky balance sheets resting on firmer capital foundations, they are also in a much stronger position to meet a liquidity crunch.
A springboard for change?This combination of reduced leverage, increased capital quality and a stronger liquidity position has led to a fitter and leaner banking industry.
2009 2013
EU banks increased their holdings of cash and cash-equivalent assets by no less than
EU banks reduced their short-term borrowings by
EU banks lowered the ratio of liquid assets to non-liquid assets
8%711%
In 2013, mean total assetsat the largest EU banksfell by
150
140
130
120
110
100
90
2009=100% Mean risk-weighted assets
Canada andAustralia
US
Japan
EU 2009=100% Value of EU bank loans, 2009–2013
EU banks are less bloated with assets than they were previously.
2011 2012 201320102009
2011 2012 201320102009
• Cash and cash equivalents
• Net loans•�Trading account assets
• Investment securities available for sale• Interest-bearing deposits at banks
At the same time business models are changing, with banks turning away from more volatile activities. The past few years have seen some lenders move more towards a deposits-driven business. Similarly, commercial loans – many of which are believed to be unsecured – are shrinking faster than consumer loans.
Having passed their preliminary health check, EU banks are now in a stronger, more stable position, which will have more appeal to shareholders. The journey to full health, though, is just beginning.
Tier 1 Capital ratioCapital ratios (mean),
2009–2013Capital ratio
14
12
10
8
6
4
2 10.7
8.4
11.6
9.2
11.8
10 13 11.3
13.4
12
%
Total depositsNet loans
500
400
300
200
100
443.
334
367.
771
462.
823
403.
073
462.
448
411.
677
454.
238
421.
057
425.
862
421.
110
EUR bn
Mean net loans and mean total deposits,2009–2013
EU banks have already been given the all-clear by regulators with average Tier 1 capital ratios well above Basel III requirements of 4.5% for Common Equity Tier 1 (CET1) and 6% for Tier 1.
120
110
100
90
80
70
2011 2012 201320102009
2011 2012 201320102009
Consumer loansNet loans
Commercial loans
160,000
150,000
140,000
9,000
8,000
2011 2012 2013
EU banking industry’s meancredit risk in risk-weighted assets, 2011–2013
Corporatelending
Corporate lending Government bonds
Governmentbonds
1.09
7
1.15
6
1.21
1
1.19
6
1.06
4
Breakdown of assets at EU banks, 2009–2013
For more information, please visit www.pwc.com/riskminds An infographic from The Economist Intelligence Unit
0 0
8%3

PwC That shrinking feeling: Tracing the changing shape of the European banking industry 11

12 PwC That shrinking feeling: Tracing the changing shape of the European banking industry
A Rubik’s Cube of regulation
Striking this balance has not been easy. To take one example, Barclays Bank had been focusing on optimising its RWAs until the UK Prudential Regulation Authority (PRA) unexpectedly demanded in 2013 that it meet a 3% leverage target within a year.4
Suddenly faced with a binding constraint on its business, the bank hurriedly arranged a GBP 5.8 billion rights issue to shore up its capital and managed to end 2013, just on target. By June 2014, the regulator’s deadline, it had strengthened the ratio to 3.4%.5
Barclays was not alone in its struggles. The Asset Quality Review (AQR) undertaken by the ECB showed that 14 out of 130 euro-area banks failed to meet the 3% leverage ratio before the review of their balance sheets at the end of 2013.6
The AQR reduced leverage ratios by 0.33% on average, pushing another three banks below the 3% threshold. And in its end-2013 monitoring exercise, the Basel Committee on Banking Supervision (BCBS) said 25 of 227 international banks it surveyed would fall short of the leverage ratio. Moreover, even after raising enough capital to meet the separate RWC requirements, 20 of the banks would still fail the leverage test, the report said.7
With regulators unlikely to keep the leverage ratio as low as 3%, it could become much more than a mere backstop, according to Alain Laurin, an analyst with Moody’s Investors Service: “Possibly the leverage ratio will be the first trigger, the first threshold, to bite before risk-weighted assets. It may be the main constraint.”
The implication is that banks will have to remain very active in managing their RWAs to solve the conundrum that is Basel III: the greater the density of RWAs, the more CET1 capital will be required, which makes the leverage ratio less of a constraint. On the other hand, a bank with fewer RWAs can manage with less capital, but may find the leverage ratio becomes binding.
Sven Oestmann, senior banks analyst at Fidelity Worldwide Investment, said Europe’s banks were doing their best to muddle through. “It’s a difficult game to play when you don’t really know the rules,” he said.
To judge just how well the banks are playing the regulatory game, the report looks first at their capital strength.
Twist a Rubik’s Cube in one direction and you risk making things worse in others. That has been the experience of a number of EU banks as they adjust to the competing regulatory constraints of Basel III. For example, stocking up on low-risk-weighted sovereign bonds helps a bank meet its RWC and LCR targets, but makes it harder to comply with the simple leverage ratio, which measures total assets.
The winding road to capital adequacy
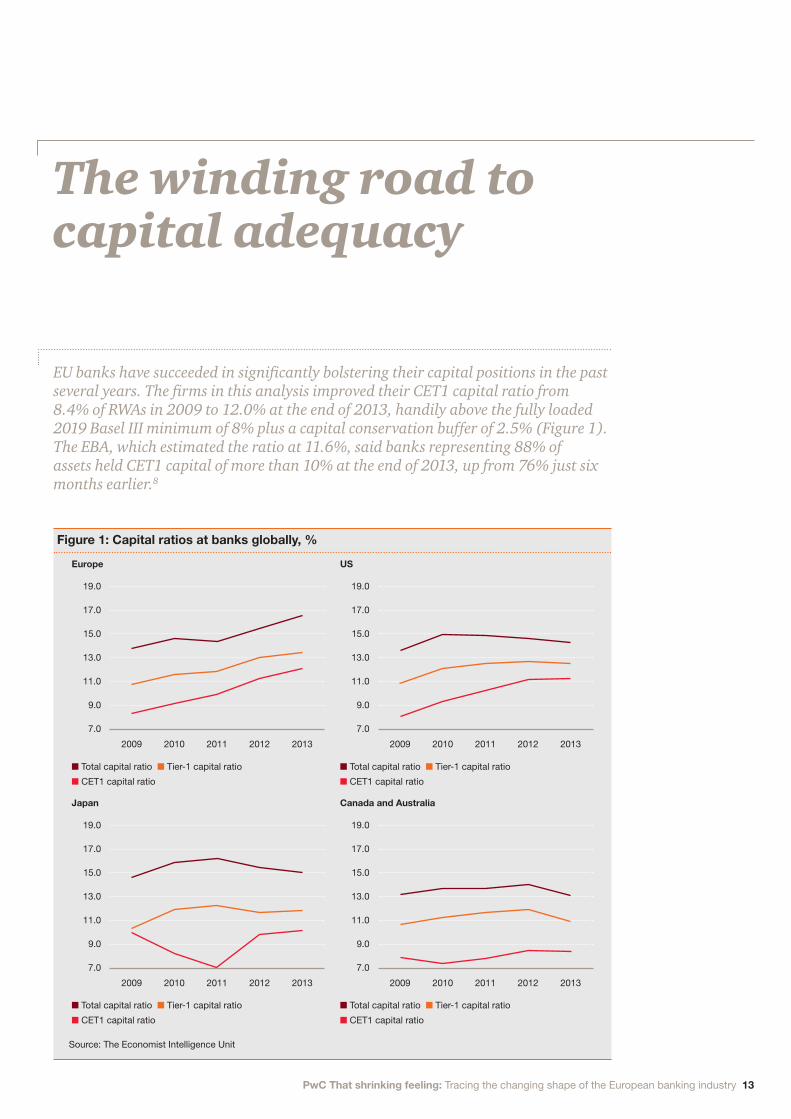
EU banks have succeeded in significantly bolstering their capital positions in the past several years. The firms in this analysis improved their CET1 capital ratio from 8.4% of RWAs in 2009 to 12.0% at the end of 2013, handily above the fully loaded 2019 Basel III minimum of 8% plus a capital conservation buffer of 2.5% (Figure 1). The EBA, which estimated the ratio at 11.6%, said banks representing 88% of assets held CET1 capital of more than 10% at the end of 2013, up from 76% just six months earlier.8
PwC That shrinking feeling: Tracing the changing shape of the European banking industry 13
Figure 1: Capital ratios at banks globally, %
Europe
Japan
US
Canada and Australia
Source: The Economist Intelligence Unit
n Total capital ratio n Tier-1 capital ratio
n CET1 capital ratio
n Total capital ratio n Tier-1 capital ratio
n CET1 capital ratio
n Total capital ratio n Tier-1 capital ratio
n CET1 capital ratio
n Total capital ratio n Tier-1 capital ratio
n CET1 capital ratio
2009
2009
2009
2009
2010
2010
2010
2010
2011
2011
2011
2011
2012
2012
2012
2012
2013
2013
2013
2013
19.0
19.0
19.0
19.0
17.0
17.0
17.0
17.0
15.0
15.0
15.0
15.0
9.0
9.0
9.0
9.0
11.0
11.0
11.0
11.0
13.0
13.0
13.0
13.0
7.0
7.0
7.0
7.0
14 PwC That shrinking feeling: Tracing the changing shape of the European banking industry
The ratios for overall Tier 1 capital and total capital tell a similar tale of strengthening. However, other regulations are looming including total loss-absorbing capacity (TLAC)9 and the net stable funding ratio (NSFR). The BCBS finalised the latter on 31 October and it is due to come into effect in 2018.10
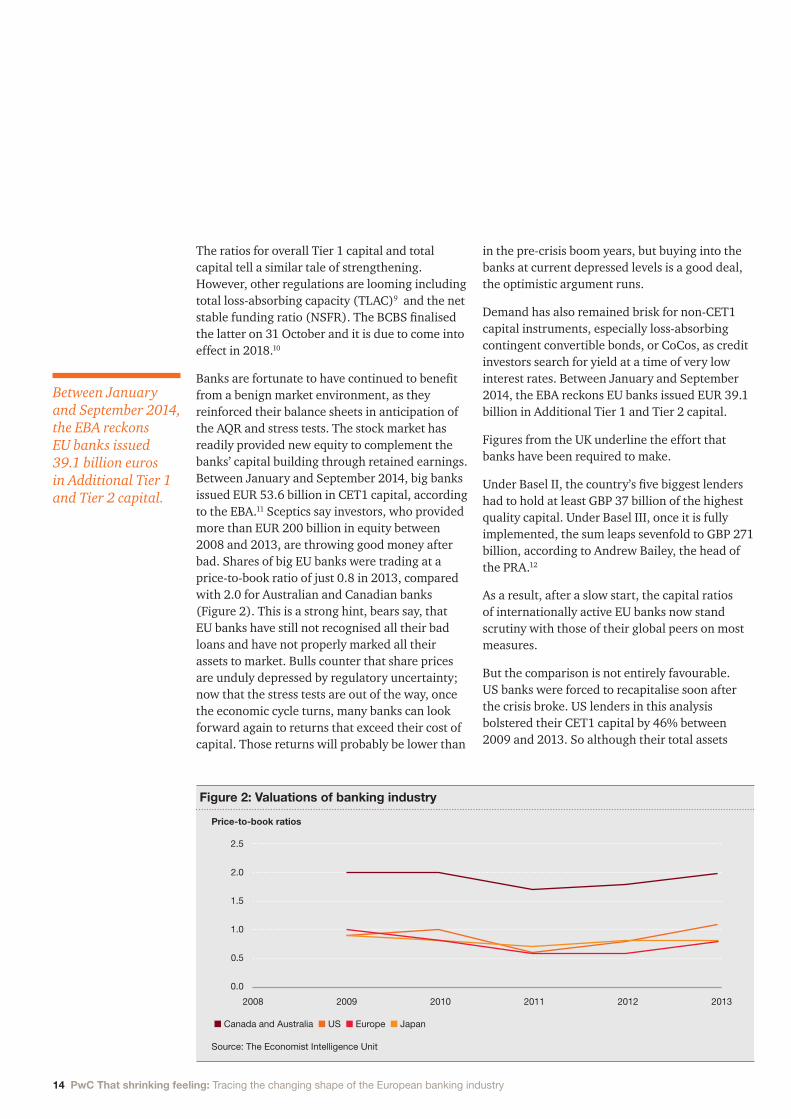
Banks are fortunate to have continued to benefit from a benign market environment, as they reinforced their balance sheets in anticipation of the AQR and stress tests. The stock market has readily provided new equity to complement the banks’ capital building through retained earnings. Between January and September 2014, big banks issued EUR 53.6 billion in CET1 capital, according to the EBA.11 Sceptics say investors, who provided more than EUR 200 billion in equity between 2008 and 2013, are throwing good money after bad. Shares of big EU banks were trading at a price-to-book ratio of just 0.8 in 2013, compared with 2.0 for Australian and Canadian banks (Figure 2). This is a strong hint, bears say, that EU banks have still not recognised all their bad loans and have not properly marked all their assets to market. Bulls counter that share prices are unduly depressed by regulatory uncertainty; now that the stress tests are out of the way, once the economic cycle turns, many banks can look forward again to returns that exceed their cost of capital. Those returns will probably be lower than
in the pre-crisis boom years, but buying into the banks at current depressed levels is a good deal, the optimistic argument runs.
Demand has also remained brisk for non-CET1 capital instruments, especially loss-absorbing contingent convertible bonds, or CoCos, as credit investors search for yield at a time of very low interest rates. Between January and September 2014, the EBA reckons EU banks issued EUR 39.1 billion in Additional Tier 1 and Tier 2 capital.
Figures from the UK underline the effort that banks have been required to make.
Under Basel II, the country’s five biggest lenders had to hold at least GBP 37 billion of the highest quality capital. Under Basel III, once it is fully implemented, the sum leaps sevenfold to GBP 271 billion, according to Andrew Bailey, the head of the PRA.12
As a result, after a slow start, the capital ratios of internationally active EU banks now stand scrutiny with those of their global peers on most measures.
But the comparison is not entirely favourable.US banks were forced to recapitalise soon after the crisis broke. US lenders in this analysis bolstered their CET1 capital by 46% between 2009 and 2013. So although their total assets
Figure 2: Valuations of banking industry
Price-to-book ratios
Source: The Economist Intelligence Unit
n Canada and Australia n US n Europe n Japan
2008 2009 2010 2011 2012 2013
2.5
2.0
0.5
1.0
1.5
0.0
Between January and September 2014, the EBA reckons EU banks issued 39.1 billion euros in Additional Tier 1 and Tier 2 capital.
PwC That shrinking feeling: Tracing the changing shape of the European banking industry 15
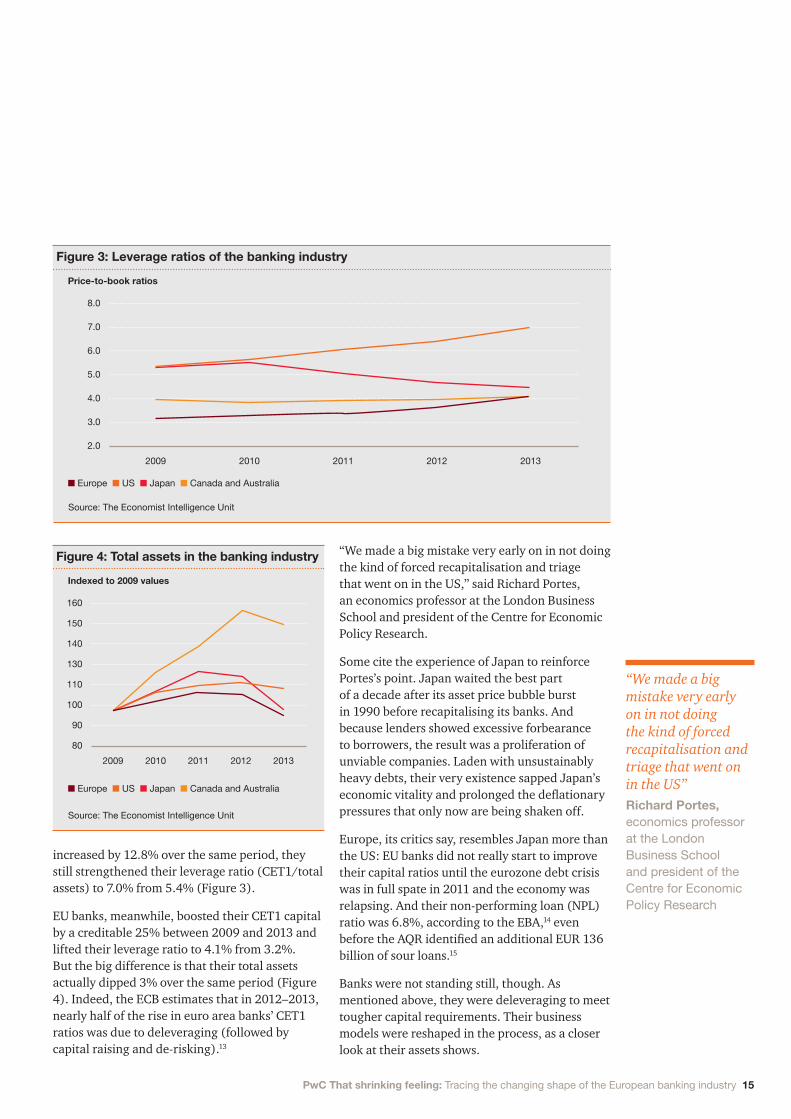
increased by 12.8% over the same period, they still strengthened their leverage ratio (CET1/total assets) to 7.0% from 5.4% (Figure 3).
EU banks, meanwhile, boosted their CET1 capital by a creditable 25% between 2009 and 2013 and lifted their leverage ratio to 4.1% from 3.2%. But the big difference is that their total assets actually dipped 3% over the same period (Figure 4). Indeed, the ECB estimates that in 2012–2013, nearly half of the rise in euro area banks’ CET1 ratios was due to deleveraging (followed by capital raising and de-risking).13
“We made a big mistake very early on in not doing the kind of forced recapitalisation and triage that went on in the US,” said Richard Portes, an economics professor at the London Business School and president of the Centre for Economic Policy Research.
Some cite the experience of Japan to reinforce Portes’s point. Japan waited the best part of a decade after its asset price bubble burst in 1990 before recapitalising its banks. And because lenders showed excessive forbearance to borrowers, the result was a proliferation of unviable companies. Laden with unsustainably heavy debts, their very existence sapped Japan’s economic vitality and prolonged the deflationary pressures that only now are being shaken off.
Europe, its critics say, resembles Japan more than the US: EU banks did not really start to improve their capital ratios until the eurozone debt crisis was in full spate in 2011 and the economy was relapsing. And their non-performing loan (NPL) ratio was 6.8%, according to the EBA,14 even before the AQR identified an additional EUR 136 billion of sour loans.15
Banks were not standing still, though. As mentioned above, they were deleveraging to meet tougher capital requirements. Their business models were reshaped in the process, as a closer look at their assets shows.
Figure 3: Leverage ratios of the banking industry
Price-to-book ratios
Source: The Economist Intelligence Unit
n Europe n US n Japan n Canada and Australia
2009 2010 2011 2012 2013
8.0
7.0
3.0
4.0
5.0
6.0
2.0
Figure 4: Total assets in the banking industry
Indexed to 2009 values
Source: The Economist Intelligence Unit
n Europe n US n Japan n Canada and Australia
2009 2010 2011 2012 2013
160
140
150
130
90
100
110
80
“We made a big mistake very early on in not doing the kind of forced recapitalisation and triage that went on in the US”Richard Portes, economics professor at the London Business School and president of the Centre for Economic Policy Research
16 PwC That shrinking feeling: Tracing the changing shape of the European banking industry
Why have assets declined?
There have been two main drivers for the decline in assets.
• First, banks have been able to shrink their derivative books, thanks to a drop in the market value of interest rate derivatives and increased netting of centrally cleared instruments.
• Second, banks have shed risky loans to the corporate sector, especially in countries that have suffered from the eurozone debt crisis, in favour of less capital-intensive assets such as sovereign bonds, mortgages and secured loans.
In the eurozone, these two factors accounted for a half and a third, respectively, of the total shrinkage in assets since May 2012, according to the ECB.18
Some banks had in fact started to deleverage aggressively much earlier, notably those required to shed assets as a condition for state aid. But many others were able to hold off, thanks to the ECB’s pair of three-year long-term refinancing
operations (LTROs) in late 2011 and early 2012, which eased the pressure to reduce assets in response to funding constraints. This bought banks time, but political, regulatory and shareholder pressure to trim the size and riskiness of their balance sheets steadily mounted. The EBA’s 2011 stress test was widely criticised as too lenient, not least because it failed to spot weaknesses in banks that failed a few months later.19 The scepticism with which financial markets and public opinion greeted the EBA results, subsequently criticised as unreliable even by the EU’s own auditors, was a signal that tougher regulation was coming.20 Banks stepped up their preparations.
Importantly, they were able to quicken the pace of asset reduction from mid-2012 onwards, supported by an improvement in valuations as more non-bank financial institutions – flush with cash – entered the market for distressed assets. Their appetite has enabled banks to sell non-core and non-performing assets for prices closer to their book value.
The estimated 3% drop in assets by EU banks in this analysis from 2009 to 2013 might be conservative. While this analysis shows a decline of EUR 1.47 trillion from a peak in 2012, the EBA reckons EU banks cut EUR 3.4 trillion in assets between 2011 and the end of 2013.16 The ECB puts the fall in euro area-domiciled assets between May 2012 and March 2014 at EUR 4.3 trillion.17 By any of the benchmarks, deleveraging has been significant.
PwC That shrinking feeling: Tracing the changing shape of the European banking industry 17
Lloyds was among the banks to have shed portfolios of non-core assets, including NPLs, in 2014.21 In October, private equity fund AnaCap bought EUR 1.9 billion of NPLs from UniCredit in one of the largest such transactions to date in Italy.22 Joe Giannamore, co-managing partner at AnaCap, said the AQR and stress tests had been a success because they had brought substantial amounts of new private capital into the industry. “The point is to precipitate change,” he said. “All the regulators want is transparency on the balance sheet with a sensible level of capital to prevent shocks to the system through a normal economic cycle.”
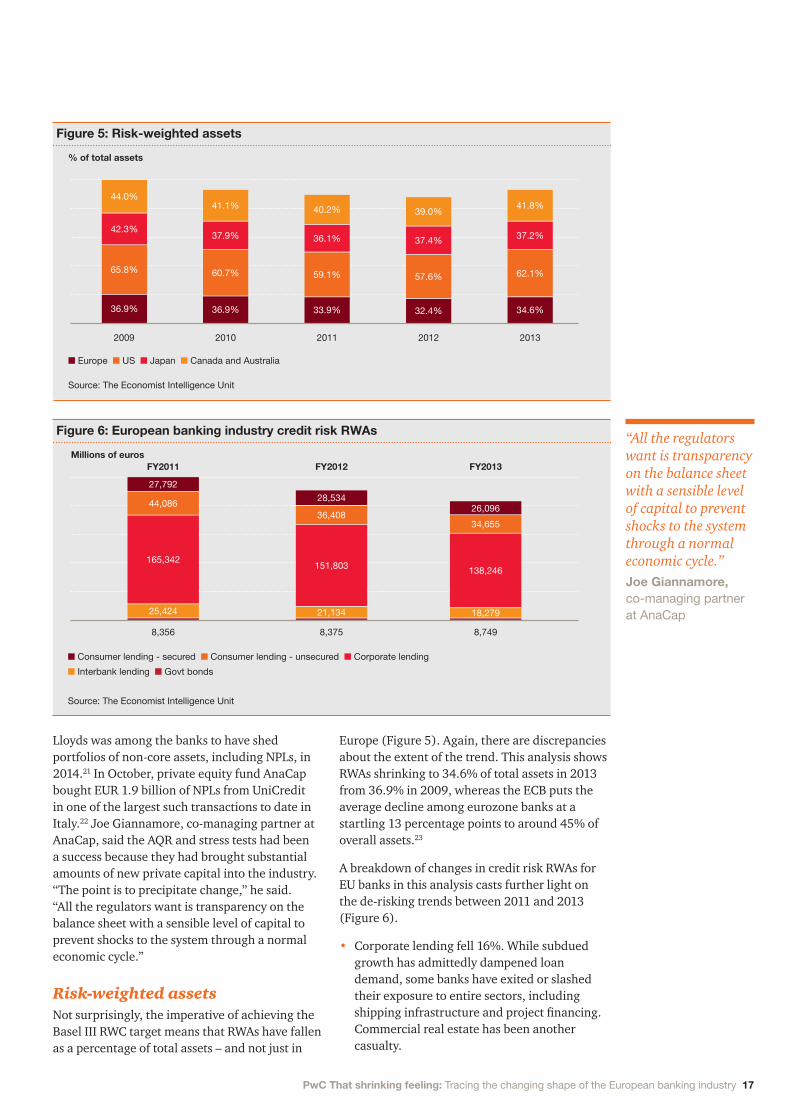
Risk-weighted assetsNot surprisingly, the imperative of achieving the Basel III RWC target means that RWAs have fallen as a percentage of total assets – and not just in
Europe (Figure 5). Again, there are discrepancies about the extent of the trend. This analysis shows RWAs shrinking to 34.6% of total assets in 2013 from 36.9% in 2009, whereas the ECB puts the average decline among eurozone banks at a startling 13 percentage points to around 45% of overall assets.23
A breakdown of changes in credit risk RWAs for EU banks in this analysis casts further light on the de-risking trends between 2011 and 2013 (Figure 6).
• Corporate lending fell 16%. While subdued growth has admittedly dampened loan demand, some banks have exited or slashed their exposure to entire sectors, including shipping infrastructure and project financing. Commercial real estate has been another casualty.
Figure 5: Risk-weighted assets
% of total assets
Source: The Economist Intelligence Unit
n Europe n US n Japan n Canada and Australia
2009 2010 2011 2012 2013
44.0%
42.3%
36.9% 36.9% 33.9% 32.4% 34.6%
65.8% 60.7% 59.1% 57.6% 62.1%
37.9% 36.1% 37.4% 37.2%
41.1% 40.2% 39.0%41.8%
Figure 6: European banking industry credit risk RWAs
Millions of eurosFY2011 FY2012 FY2013
Source: The Economist Intelligence Unit
n Consumer lending - secured n Consumer lending - unsecured n Corporate lending
n Interbank lending n Govt bonds
8,356 8,375 8,749
27,792
44,086
165,342
25,424 18,279
151,803 138,246
36,40834,655
28,53426,096
21,134
“All the regulators want is transparency on the balance sheet with a sensible level of capital to prevent shocks to the system through a normal economic cycle.”Joe Giannamore, co-managing partner at AnaCap
18 PwC That shrinking feeling: Tracing the changing shape of the European banking industry
• Whereas secured consumer lending fell 6%, unsecured consumer lending slumped 21%.
• Trading book assets shrank 31%. FICC (fixed income, currencies and commodities) has traditionally been an important – if volatile – driver of investment bank profits, but many banks have pulled back from the sector since the crisis, due to weak revenues as well as stricter regulation and legal challenges.
• Interbank lending fell 28% as the euro crisis prompted more than half of lenders surveyed by the EBA to limit their exposures to banks in debt-stressed countries – a worrying sign of fragmentation in the single market.24
• Government bond holdings rose 5%, according to this analysis of credit risk RWAs. But Fitch Ratings says big EU banks increased their sovereign exposure by 27.2%, or EUR 576 billion, to around EUR 2.7 trillion between 2011 and 2013 as they sought to enhance their liquidity ratios and lower their average risk weights.25 The ECB says domestic government debt accounts for almost 10% of the assets of banks in Italy and Spain.26
Model behaviour?There is a large degree of scepticism as to whether banks have genuinely reduced the riskiness of their assets. Have they been taking advantage of the discretion regulators allow them to adjust their internal model-based approaches? The ECB admitted it was “difficult to assess to what extent the asset shedding has led to a true de-risking of balance sheets”. No wonder: the central bank found that the decline in RWAs as a share of total assets at the banks it tracks ranged from 16% to 85%.27 The EBA added that the flexibility banks have to tweak their risk models “may in some situations raise concerns as to whether related improvements in capital ratios adequately address the assessment of risk”.28
One of the most important goals of the stress tests was to improve public confidence in the health of Europe’s banks by assessing their balance sheets in a more transparent, consistent way. “The banks have gamed the risk-weighting system hugely until now,” said Mr Portes.
Nevertheless, the evidence of fairly significant balance sheet de-risking is consistent. The EBA, in announcing its stress-test results, said EU banks reduced their credit risk exposure by 19% between 2011 and 2013. Twenty-one major eurozone banks surveyed by the ECB cut their total credit risk capital charges by 34% over the same period as their aggregated credit exposure at default (EAD), a measure used in the Basel framework, fell by a net EUR 682 billion. Exposures to corporate borrowers accounted for the bulk of the decline, followed by financial institutions and securitisations. By contrast, exposure to less risky residential mortgages and sovereign debt rose markedly.29
“One of the most important goals of the stress tests was to improve public confidence in the health of Europe’s banks by assessing their balance sheets in a more transparent, consistent way.”

PwC That shrinking feeling: Tracing the changing shape of the European banking industry 19
20 PwC That shrinking feeling: Tracing the changing shape of the European banking industry
The short and long end of liquidity
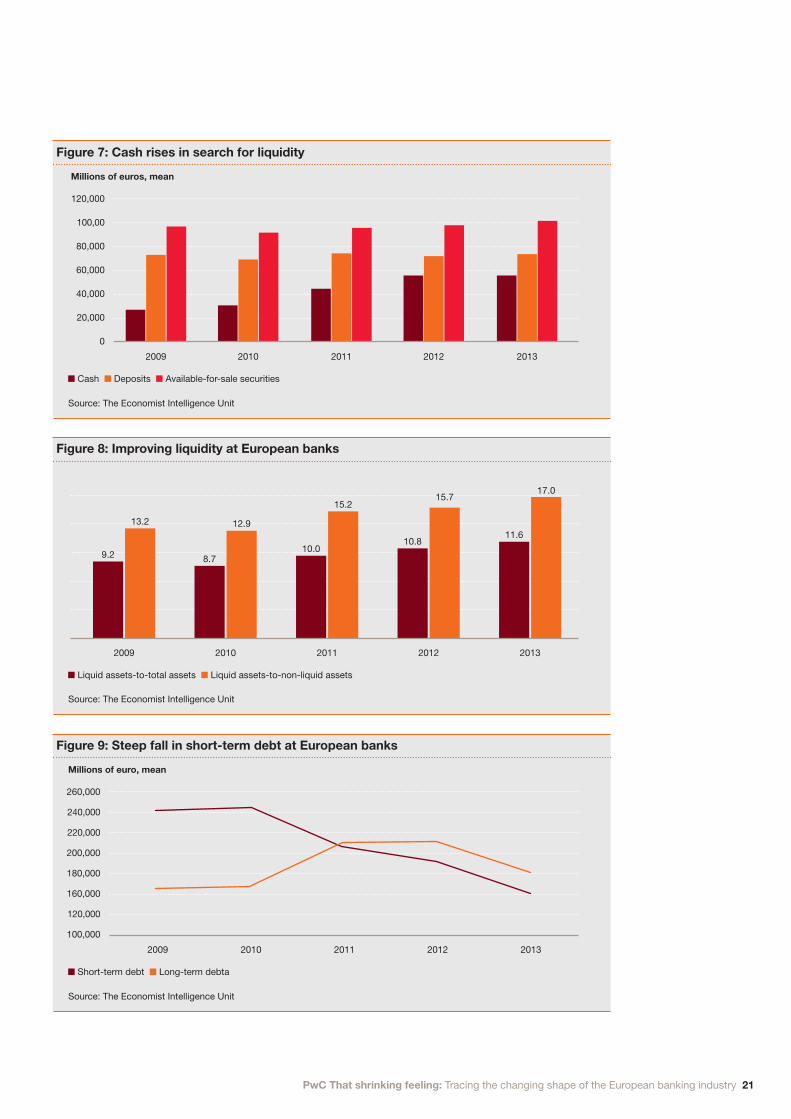
Specifically, between 2009 and 2013, the lenders in this analysis have:
• increased their holdings of cash and cash-equivalent assets by no less than 78% (Figure 7).
• increased the share of liquid assets from 9.2% of total assets to 11.6% (Figure 8).
• reduced their short-term borrowings by 38%. Thanks to the ECB’s two LTROs, but also because they have worked hard at extending term-funding maturities, banks at the end of last year held EUR 200 billion more long-term than short-term debt. That is an astonishing turnaround: five years previously, short-term debt dwarfed long-term borrowing by EUR 875 billion (Figure 9).
Not surprisingly, then, the EBA says EU banks on average already meet the Basel III LCR of 100%, which is due to be phased in between 2015 and 2019. The vast majority of bankers firmly intend to exceed the minimum.30 The purpose is to enable banks to withstand a 30-day liquidity drought by requiring them to hold enough high-quality liquid assets. Recall that US money market funds withdrew USD 50 billion-plus of short-term dollar funding from French banks in 2011, prompting the ECB to open a dollar financing window.31, 32
EU banks not only have smaller, less risky balance sheets resting on firmer capital foundations, they are also in a much stronger position to meet a liquidity crunch – another crucial part of the puzzle that Basel regulators require lenders to solve to avert a repeat of the 2007/2008 crisis.
PwC That shrinking feeling: Tracing the changing shape of the European banking industry 21
Figure 7: Cash rises in search for liquidity
Millions of euros, mean
Source: The Economist Intelligence Unit
n Cash n Deposits n Available-for-sale securities
2009 2010 2011 2012 2013
120,000
100,00
20,000
40,000
60,000
80,000
0
Figure 8: Improving liquidity at European banks
Source: The Economist Intelligence Unit
n Liquid assets-to-total assets n Liquid assets-to-non-liquid assets
2009 2010 2011 2012 2013
9.2
13.2
8.7
12.9
10.010.8
11.6
15.215.7
17.0
Figure 9: Steep fall in short-term debt at European banks
Millions of euro, mean
Source: The Economist Intelligence Unit
n Short-term debt n Long-term debta
2009 2010 2011 2012 2013
260,000
220,000
240,000
120,000
160,000
180,000
200,000
100,000
22 PwC That shrinking feeling: Tracing the changing shape of the European banking industry
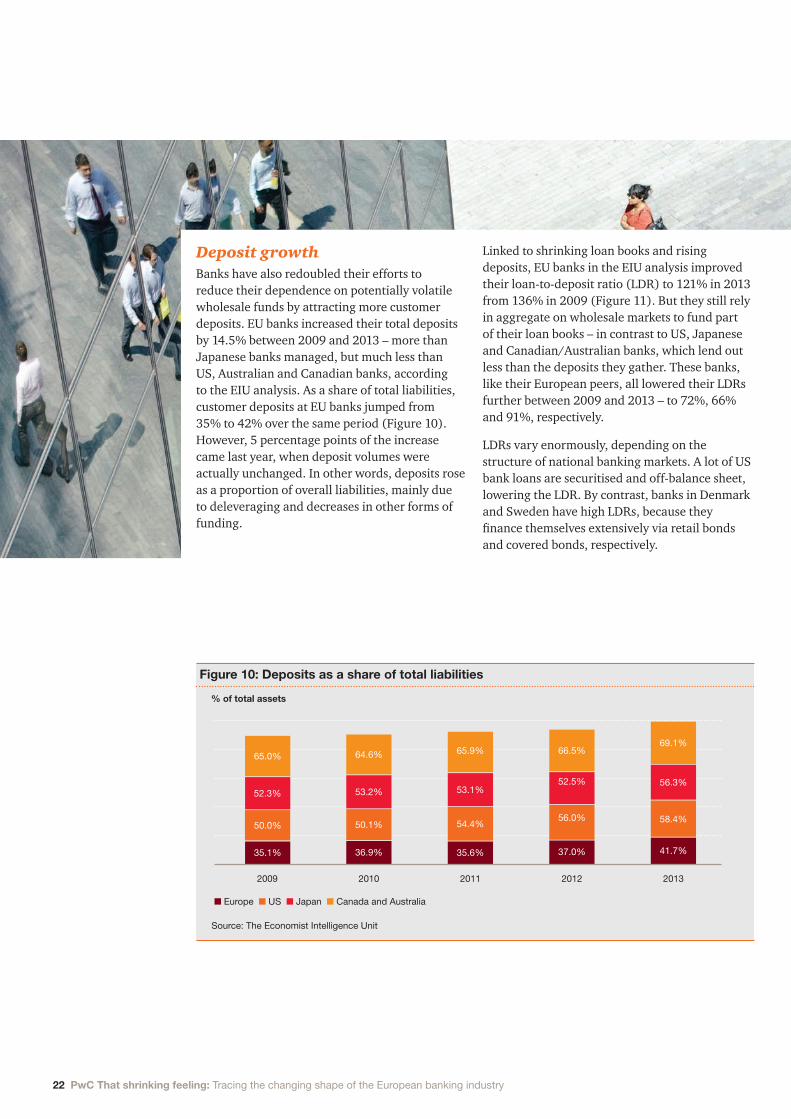
Deposit growthBanks have also redoubled their efforts to reduce their dependence on potentially volatile wholesale funds by attracting more customer deposits. EU banks increased their total deposits by 14.5% between 2009 and 2013 – more than Japanese banks managed, but much less than US, Australian and Canadian banks, according to the EIU analysis. As a share of total liabilities, customer deposits at EU banks jumped from 35% to 42% over the same period (Figure 10). However, 5 percentage points of the increase came last year, when deposit volumes were actually unchanged. In other words, deposits rose as a proportion of overall liabilities, mainly due to deleveraging and decreases in other forms of funding.
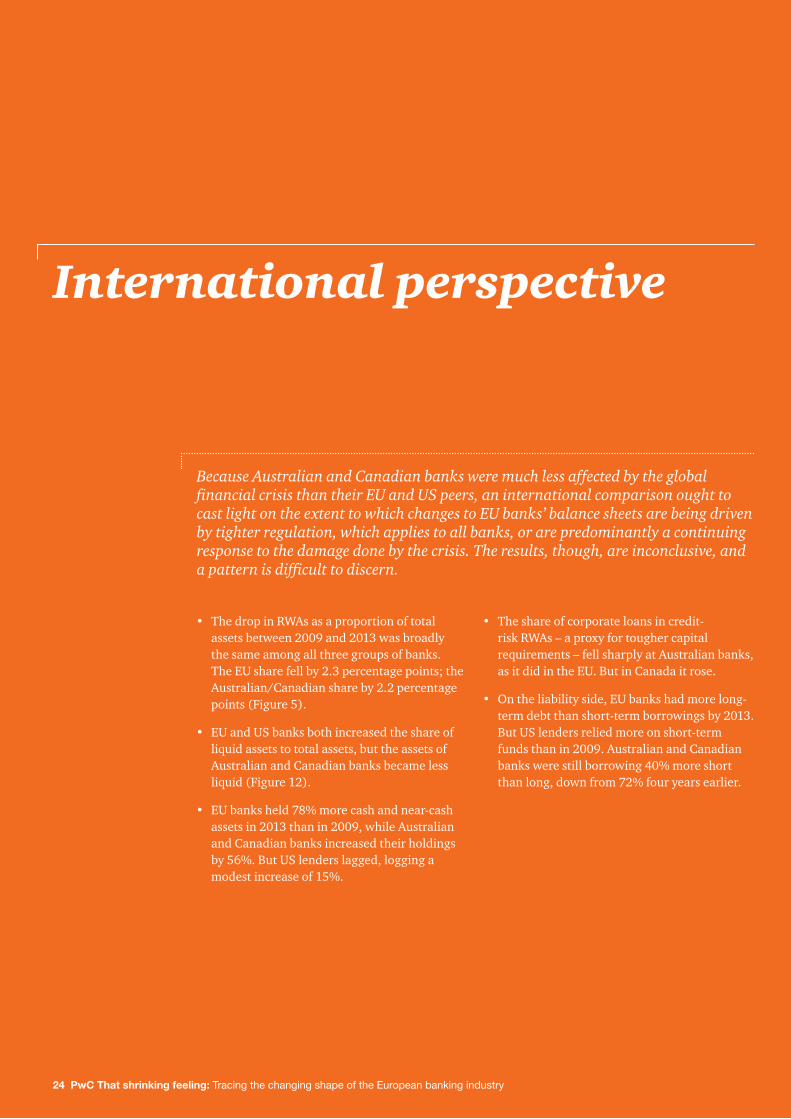
Linked to shrinking loan books and rising deposits, EU banks in the EIU analysis improved their loan-to-deposit ratio (LDR) to 121% in 2013 from 136% in 2009 (Figure 11). But they still rely in aggregate on wholesale markets to fund part of their loan books – in contrast to US, Japanese and Canadian/Australian banks, which lend out less than the deposits they gather. These banks, like their European peers, all lowered their LDRs further between 2009 and 2013 – to 72%, 66% and 91%, respectively.
LDRs vary enormously, depending on the structure of national banking markets. A lot of US bank loans are securitised and off-balance sheet, lowering the LDR. By contrast, banks in Denmark and Sweden have high LDRs, because they finance themselves extensively via retail bonds and covered bonds, respectively.
Figure 10: Deposits as a share of total liabilities
% of total assets
Source: The Economist Intelligence Unit
n Europe n US n Japan n Canada and Australia
2009 2010 2011 2012 2013
65.0%
52.3%
35.1% 36.9% 35.6% 37.0% 41.7%
50.0% 50.1% 54.4%56.0% 58.4%
53.2% 53.1%52.5% 56.3%
64.6% 65.9% 66.5%69.1%
PwC That shrinking feeling: Tracing the changing shape of the European banking industry 23
Too many banks on the debt-stressed eurozone periphery still rely on ECB refinancing. But now that the acute phase of Europe’s crisis has passed, the EBA’s survey evidence suggests EU banks overall have grown more comfortable with their funding mix: fewer banks are planning further LDR cuts and fewer are willing to compete on price for deposits.33
If bankers are more relaxed, it is thanks to an improvement in market conditions that has enabled banks across the EU to regain access to market funding. Indeed, with investors hungry for yield, banks had been able to sell sufficient debt to enable them to repay half of the ECB’s three-year LTRO funds by March 2014, well ahead of schedule.
Figure 11: Loan-to-deposit ratio gradually ease
Source: The Economist Intelligence Unit
n Europe n Canada and Australia n Japan n US
2009 2010 2011 2012 2013
160.0
140.0
20.0
40.0
60.0
120.0
100.0
80.0
0.0
24 PwC That shrinking feeling: Tracing the changing shape of the European banking industry
International perspective
• The drop in RWAs as a proportion of total assets between 2009 and 2013 was broadly the same among all three groups of banks. The EU share fell by 2.3 percentage points; the Australian/Canadian share by 2.2 percentage points (Figure 5).
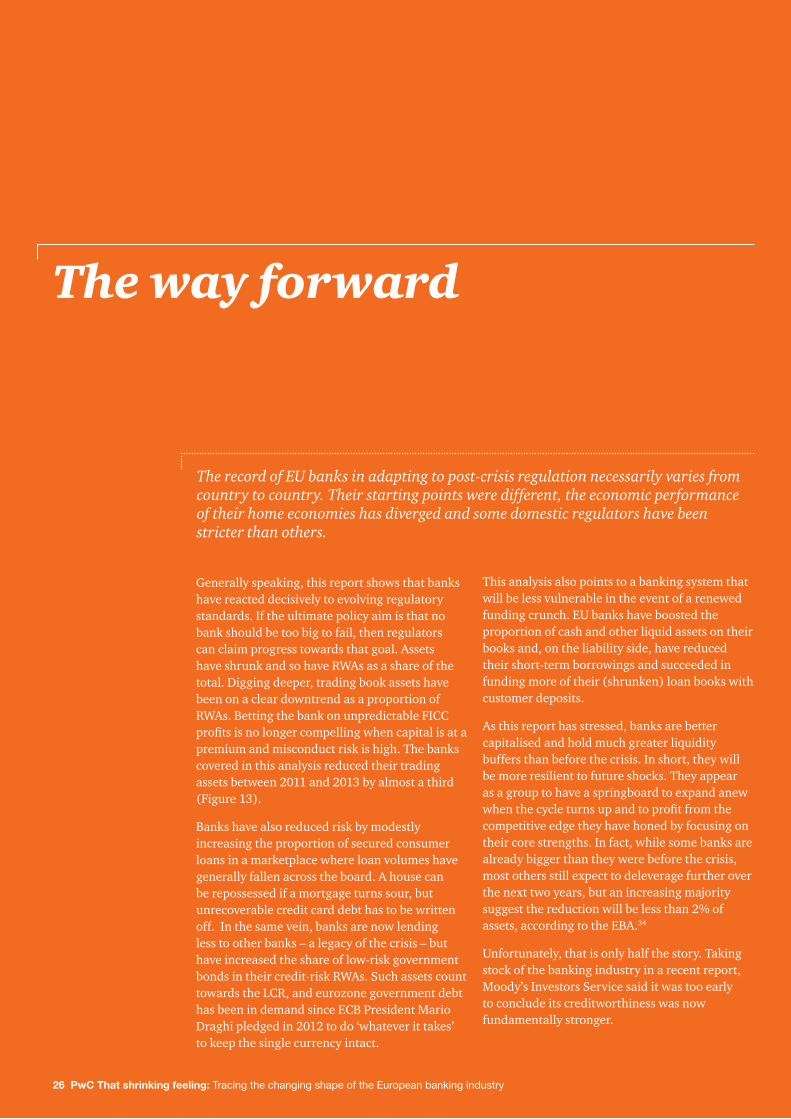
• EU and US banks both increased the share of liquid assets to total assets, but the assets of Australian and Canadian banks became less liquid (Figure 12).
• EU banks held 78% more cash and near-cash assets in 2013 than in 2009, while Australian and Canadian banks increased their holdings by 56%. But US lenders lagged, logging a modest increase of 15%.
• The share of corporate loans in credit-risk RWAs – a proxy for tougher capital requirements – fell sharply at Australian banks, as it did in the EU. But in Canada it rose.
• On the liability side, EU banks had more long-term debt than short-term borrowings by 2013. But US lenders relied more on short-term funds than in 2009. Australian and Canadian banks were still borrowing 40% more short than long, down from 72% four years earlier.
Because Australian and Canadian banks were much less affected by the global financial crisis than their EU and US peers, an international comparison ought to cast light on the extent to which changes to EU banks’ balance sheets are being driven by tighter regulation, which applies to all banks, or are predominantly a continuing response to the damage done by the crisis. The results, though, are inconclusive, and a pattern is difficult to discern.
PwC That shrinking feeling: Tracing the changing shape of the European banking industry 25
Figure 12: Liquidity trends in the banking industry
Liqid assets-to-total assets, %
Source: The Economist Intelligence Unit
n Europe n US n Canada and Australia
2009 2010 2011 2012 2013
14
12
2
4
6
10
8
0
26 PwC That shrinking feeling: Tracing the changing shape of the European banking industry
The way forward
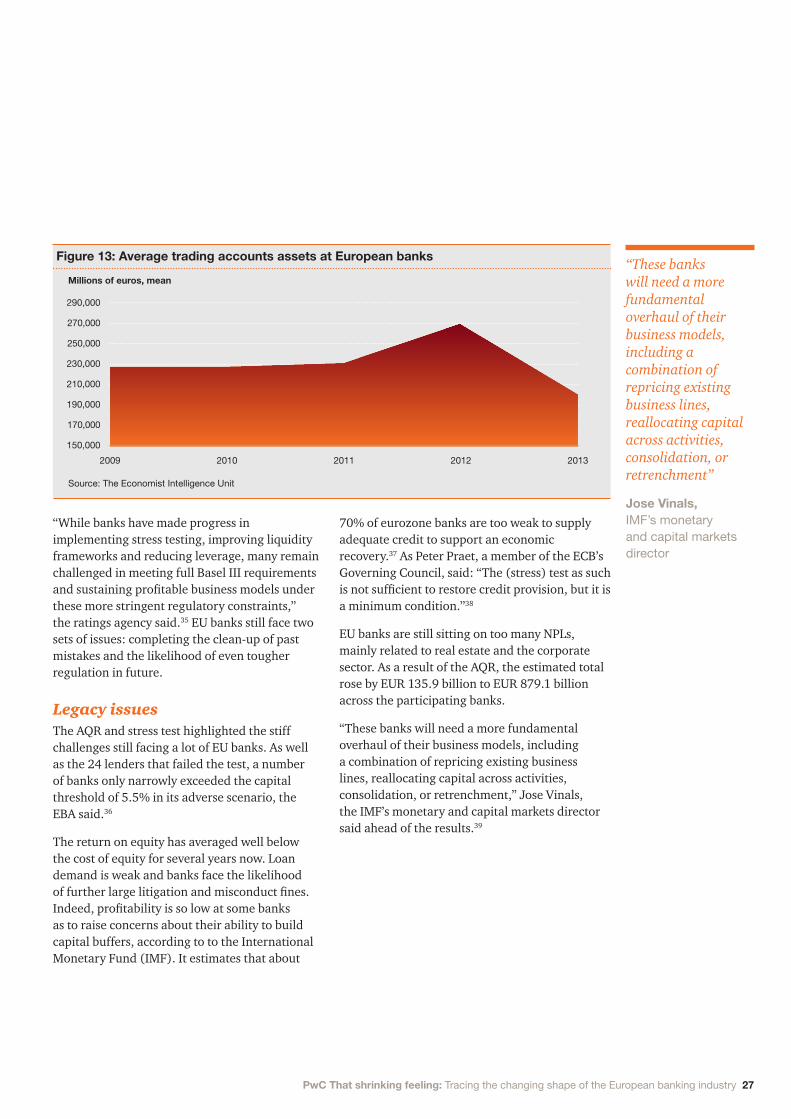
Generally speaking, this report shows that banks have reacted decisively to evolving regulatory standards. If the ultimate policy aim is that no bank should be too big to fail, then regulators can claim progress towards that goal. Assets have shrunk and so have RWAs as a share of the total. Digging deeper, trading book assets have been on a clear downtrend as a proportion of RWAs. Betting the bank on unpredictable FICC profits is no longer compelling when capital is at a premium and misconduct risk is high. The banks covered in this analysis reduced their trading assets between 2011 and 2013 by almost a third (Figure 13).
Banks have also reduced risk by modestly increasing the proportion of secured consumer loans in a marketplace where loan volumes have generally fallen across the board. A house can be repossessed if a mortgage turns sour, but unrecoverable credit card debt has to be written off. In the same vein, banks are now lending less to other banks – a legacy of the crisis – but have increased the share of low-risk government bonds in their credit-risk RWAs. Such assets count towards the LCR, and eurozone government debt has been in demand since ECB President Mario Draghi pledged in 2012 to do ‘whatever it takes’ to keep the single currency intact.
This analysis also points to a banking system that will be less vulnerable in the event of a renewed funding crunch. EU banks have boosted the proportion of cash and other liquid assets on their books and, on the liability side, have reduced their short-term borrowings and succeeded in funding more of their (shrunken) loan books with customer deposits.
As this report has stressed, banks are better capitalised and hold much greater liquidity buffers than before the crisis. In short, they will be more resilient to future shocks. They appear as a group to have a springboard to expand anew when the cycle turns up and to profit from the competitive edge they have honed by focusing on their core strengths. In fact, while some banks are already bigger than they were before the crisis, most others still expect to deleverage further over the next two years, but an increasing majority suggest the reduction will be less than 2% of assets, according to the EBA.34
Unfortunately, that is only half the story. Taking stock of the banking industry in a recent report, Moody’s Investors Service said it was too early to conclude its creditworthiness was now fundamentally stronger.
The record of EU banks in adapting to post-crisis regulation necessarily varies from country to country. Their starting points were different, the economic performance of their home economies has diverged and some domestic regulators have been stricter than others.
PwC That shrinking feeling: Tracing the changing shape of the European banking industry 27
“While banks have made progress in implementing stress testing, improving liquidity frameworks and reducing leverage, many remain challenged in meeting full Basel III requirements and sustaining profitable business models under these more stringent regulatory constraints,” the ratings agency said.35 EU banks still face two sets of issues: completing the clean-up of past mistakes and the likelihood of even tougher regulation in future.
Legacy issuesThe AQR and stress test highlighted the stiff challenges still facing a lot of EU banks. As well as the 24 lenders that failed the test, a number of banks only narrowly exceeded the capital threshold of 5.5% in its adverse scenario, the EBA said.36
The return on equity has averaged well below the cost of equity for several years now. Loan demand is weak and banks face the likelihood of further large litigation and misconduct fines. Indeed, profitability is so low at some banks as to raise concerns about their ability to build capital buffers, according to to the International Monetary Fund (IMF). It estimates that about
70% of eurozone banks are too weak to supply adequate credit to support an economic recovery.37 As Peter Praet, a member of the ECB’s Governing Council, said: “The (stress) test as such is not sufficient to restore credit provision, but it is a minimum condition.”38
EU banks are still sitting on too many NPLs, mainly related to real estate and the corporate sector. As a result of the AQR, the estimated total rose by EUR 135.9 billion to EUR 879.1 billion across the participating banks.
“These banks will need a more fundamental overhaul of their business models, including a combination of repricing existing business lines, reallocating capital across activities, consolidation, or retrenchment,” Jose Vinals, the IMF’s monetary and capital markets director said ahead of the results.39
Figure 13: Average trading accounts assets at European banks
Millions of euros, mean
Source: The Economist Intelligence Unit
2009 2010 2011 2012 2013
290,000
250,000
270,000
170,000
190,000
210,000
230,000
150,000
“These banks will need a more fundamental overhaul of their business models, including a combination of repricing existing business lines, reallocating capital across activities, consolidation, or retrenchment”
Jose Vinals, IMF’s monetary and capital markets director
28 PwC That shrinking feeling: Tracing the changing shape of the European banking industry
Conclusion
But the Basel regulators are far from finished. The proposal for TLAC aims to ensure that taxpayers do not have to pay the bill if a bank fails. Rulemakers are recommending that banks issue enough subordinated debt and other securities that can be written down to cover resolution costs. Global systemically important banks could, as a result, have to hold capital and bail-in debt equal to as much as a quarter of their RWAs, once various buffers are included.
“The bar keeps being raised. The regulators haven’t finished asking for everything they’re going to ask for,” said Bridget Gandy, co-head of EMEA Financial Institutions at Fitch. “It’s almost impossible to navigate through the rule changes.”
Banks face uncertainty, not only over the size of the TLAC requirement, but also over the impact it would have on their liability stacks. All else equal, banks would have an incentive to issue more debt that can be bailed in and to rely less on deposits, which are partly insured and are more difficult politically to seize to pay for a bailout.
In addition to TLAC, policymakers have yet to finalise a host of other rules and requirements that will have a profound impact on banks’ balance sheet management and business practices. Many investors and analysts are convinced that regulators will keep increasing capital requirements to ensure banks take fewer risks and are never again, as in 2008, too big to fail. They reckon the minimum leverage requirement, in practice, will not be 3%, but at least 4% or 4.5%.
“Banks are probably reasonably well-positioned against current requirements, but they will need to build capital quite significantly over the next few years as those requirements tighten up,” Mr Oestmann at Fidelity said.
Banks are on a journey. They have come a long way in a short time. But it is impossible to know how far they still are from their destination.
If EU banks could halt the ticking of the regulatory clock, they could at least plan with confidence and allocate capital strategically to secure sustainable returns. After all, the rigorous capital discipline and risk management required by Basel III should eventually translate into a more efficient banking industry.
Case studies
What follows are three case studies, illustrative of how banks in EU countries have been meeting the challenge of higher capital standards, adapting their businesses to global standards and dealing with pressures to reduce system-wide risk.
PwC That shrinking feeling: Tracing the changing shape of the European banking industry 29
30 PwC That shrinking feeling: Tracing the changing shape of the European banking industry
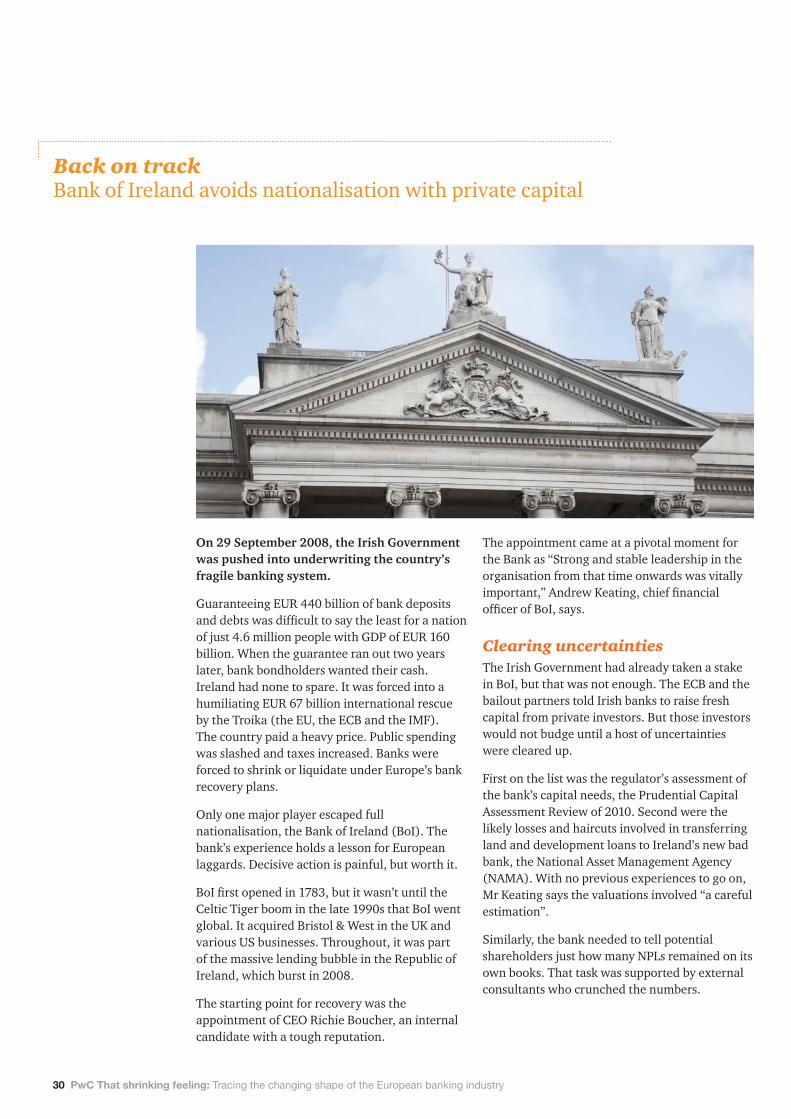
On 29 September 2008, the Irish Government was pushed into underwriting the country’s fragile banking system.
Guaranteeing EUR 440 billion of bank deposits and debts was difficult to say the least for a nation of just 4.6 million people with GDP of EUR 160 billion. When the guarantee ran out two years later, bank bondholders wanted their cash. Ireland had none to spare. It was forced into a humiliating EUR 67 billion international rescue by the Troika (the EU, the ECB and the IMF). The country paid a heavy price. Public spending was slashed and taxes increased. Banks were forced to shrink or liquidate under Europe’s bank recovery plans.
Only one major player escaped full nationalisation, the Bank of Ireland (BoI). The bank’s experience holds a lesson for European laggards. Decisive action is painful, but worth it.
BoI first opened in 1783, but it wasn’t until the Celtic Tiger boom in the late 1990s that BoI went global. It acquired Bristol & West in the UK and various US businesses. Throughout, it was part of the massive lending bubble in the Republic of Ireland, which burst in 2008.
The starting point for recovery was the appointment of CEO Richie Boucher, an internal candidate with a tough reputation.
The appointment came at a pivotal moment for the Bank as “Strong and stable leadership in the organisation from that time onwards was vitally important,” Andrew Keating, chief financial officer of BoI, says.
Clearing uncertaintiesThe Irish Government had already taken a stake in BoI, but that was not enough. The ECB and the bailout partners told Irish banks to raise fresh capital from private investors. But those investors would not budge until a host of uncertainties were cleared up.
First on the list was the regulator’s assessment of the bank’s capital needs, the Prudential Capital Assessment Review of 2010. Second were the likely losses and haircuts involved in transferring land and development loans to Ireland’s new bad bank, the National Asset Management Agency (NAMA). With no previous experiences to go on, Mr Keating says the valuations involved “a careful estimation”.
Similarly, the bank needed to tell potential shareholders just how many NPLs remained on its own books. That task was supported by external consultants who crunched the numbers.
Back on track Bank of Ireland avoids nationalisation with private capital
PwC That shrinking feeling: Tracing the changing shape of the European banking industry 31
Then there were the group’s various pension schemes. The defined benefit schemes faced a funding gap of EUR 1.5 billion. Shareholders were not going to write a blank cheque to fill it. Instead, a ‘shared solution’ was agreed. Staff took a hit on future benefits, cutting the deficit by half. The bank then agreed to cover the remainder over the next seven years. Getting staff onside was a logistical challenge, Mr Keating says.
“We needed written agreement from 10,000 members. It was done in circa three months, with 100% consent,” he says.
Taking on a bigger burdenIrish banks also had to agree to EU restructuring plans for having received state aid. BoI accepted a bigger burden in exchange for early clarity and a chance its capital raising would succeed. It was forced to sell some UK businesses and to slim down on home turf.
Luck also played a part in the turnaround. Early in the process, BoI shifted its accounting year forward to accommodate a EUR 3.5 billion issue of new equity and debt-for-equity swaps. Had it taken place a week later, it would have likely failed in the early stages of the European sovereign debt crisis.
The following year, the Troika demanded additional private capital injections. With Ireland owning a 36% stake already, many worried that private investors would steer clear. Salvation came in the shape of Prem Watsa of Canadian firm Fairfax Financial. He convinced a consortium to take a 35% stake in 2011.* The state’s holding was more than halved as a result. Nationalisation was avoided.
“It was unexpected by the market – a huge positive surprise. This equity investment in Bank of Ireland, together with the EU summit supporting the euro in July 2011, contributed to the inflection point for Irish bonds” says Mr Keating.
RecoveringThe tough job of recovery proceeded. The bank was expected to sell EUR 10 billion of loan assets in three years. But costs could be as high as 25%. In fact, the lot was sold in 18 months at a cost of just 8%.
Wholesale funding was slashed by shrinking assets and boosting deposits. That led to an unsustainable savings’ rate war on home turf. BoI took flak for being the first to pull back. At least it could still rely on its distribution links with Britain’s Post Office to pull in deposits from across the Irish Sea.
Overseas lending was curtailed too. The bank aimed to shrink its balance sheet to EUR 90 billion, but it ended up at EUR 83 billion. Mr Keating says the shrinkage has little to do with the recent European stress tests and AQR. Bank of Ireland passed the tests with ease but had already turned on the lending taps.
“We have had a consistent message. We have the capital, liquidity and infrastructure to expand our business sustainably. When investors ask if there was a difference in our lending appetite pre- and post-AQR, I say absolutely not,” he says.
If the bank’s appetite has not changed, that of its customers has. BoI is approving more credit facilities than customers are willing to use. Retail customers cannot find the residential properties they want, even though applicants can meet lending criteria. And small business and corporate customers do not want to stretch themselves too much, even as the economy recovers.
The bank’s books look better and taxpayers have been rewarded. They pumped a total of EUR 4.8 billion into BoI. They have already had back EUR 6 billion and, separately, they continue to have a valuable equity state of 14% in BoI – EUR 1.5 billion at today’s share price.
“Bank of Ireland’s determination was to reduce the risk to the taxpayer, to repay the investment from the State and to reward the taxpayers for their support,” says Keating.
If the bank’s appetite has not changed, that of its customers has. BoI is approving more credit facilities than customers are willing to use. Retail customers cannot find the residential properties they want, even though applicants can meet lending criteria.
*CBC News, Fairfax triples its money on Bank of Ireland stake, 4 March, 2014.
32 PwC That shrinking feeling: Tracing the changing shape of the European banking industry
Over 200 years ago, a fire devastated large swathes of Copenhagen. Homes needed rebuilding but credit was scarce. As a result, lenders clubbed together, forming a joint-liability association to grant mortgages that were funded by mortgage bonds, not deposits.
Today, this mortgage funding model in Denmark is supporting the cause of European regulators when it comes to ensuring the capital adequacy of banks so that taxpayers no longer face massive bailout bills. Some adaptation was required though to balance the objectives of global standards with local markets.
While the Danish covered bond market is more sophisticated today than when it first started, its mutuality elements remain similar from day one. Strict rules protect bond investors by imposing high standards on lending, typically no more than 80% loan-to-values on residential property.
The system is still based on the ‘match-funding’ principle; new bonds are issued to the value of the mortgages granted that day. The market is safe, say the country’s lenders – not a single bond has defaulted in over 200 years.
“It was a low-profit sector to offer cheap, stable and relatively low-risk finance to members,” says Klaus Kristiansen, head of asset and liability management at Realkredit Danmark, a major bond issuer and part of the Danske Bank group.
Because the system worked so well, homeownership and mortgage finance have been robust. The only time volumes shrank was during the Danish state bankruptcy of 1813. Not even the Great Depression and World War II interrupted the Danish mortgage market.
The covered bond market subsequently expanded to cover other financing needs, such as agriculture, industry and office properties. Today, two-thirds of financing for Denmark’s real economy depends on covered bonds.
Lack of supplyThe AAA-rated covered bond market is worth over DKK 2.5 trillion, over three times larger than Denmark’s outstanding sovereign debt. That is the source of a problem for Danish banks, which must comply with new global capital rules.
Sovereign debt is usually considered risk-free and highly liquid, so it counts among the best quality assets that banks can place in their capital buffers. However, there is simply not enough sovereign debt supply for Danish banks.
A lesson in adaptation Danske Bank’s quest for quality capital
PwC That shrinking feeling: Tracing the changing shape of the European banking industry 33
“In the euro market, there are lots of government issuers you can go to. There is only one kroner issuer and with government debt to GDP of 45% the sovereign pool is limited,” says Christoffer Møllenbach, head of group treasury at Danske Bank.
Under Basel III, covered bonds are Level 2 assets, limiting their use to 40% of any bank’s liquidity buffer. Had Europe’s LCR regulations followed suit, Danish banks would be hard-pressed to find alternatives.
Danish politicians were quick to recognise this was an issue, so ministers and the industry set to lobbying long and hard. They had to prove that Danish-covered bonds are high quality and extremely liquid, even in the event of a global credit crisis.
Danish mortgage bonds differ markedly from their German or Spanish counterparts, both of which are issued on the primary market as ‘buy and hold’ investments. Danish bonds on the other hand are all listed on the OMX Nordic Exchange and traded daily in the secondary market.
Mr Kristiansen and Mr Møllenbach say the fact that issuance, trading and price-finding continued in the aftermath of the collapse of Lehman Brothers was key. Both the European Commission and the EBA were eventually convinced.
“Reason and logic prevailed, but these things take time,” says Mr Møllenbach.
The challenge of changing marketsHe also thinks Europe’s acceptance of the Danish case is helpful to diversify exposures. Had LCR buffer requirements been too tight and uniform, all European banks would be forced to buy up the same securities. German banks would buy German debt, UK banks would stock up on short-dated gilts etc.
“In a systemic event, who is going to be on the other side of those trades?” he added.
There are still challenges for the Danish banking industry. For example, foreign investors have become attracted to the quality of Denmark’s local covered bonds, but some in the industry worry that foreign investors may be more fickle than Danish pension funds.
The profile of the bonds themselves has changed, too. Danish mortgages used to come with tenors of ten years and longer, as in the US. But falling interest rates have pushed up demand for adjustable-rate mortgages (ARMs) in which annual resets allow borrowers to lower their monthly payments. The one-year bonds that back these variable mortgage rates currently make up some 30–40% of the market.
For Mr Møllenbach, that could mean plenty of extra work. One-year maturities are not adequate to fulfil his liquidity requirements. So bond issuers and the banks that facilitate Danish mortgages are nudging homeowners back towards three- to five-year fixes.
But that push back towards longer fixed rate mortgages (and therefore longer dated bonds) would cause problems if any Danish bank went bust. It could take up to 30 years to resolve a mortgage bank. To pre-empt a problem, the Danish regulator suggested each bank holds a buffer of 2% of total loans outstanding that can be used to create a bridge bank until assets are sold.
For now, Denmark’s banking industry has adapted well to new capital rules, granted Danske Bank and its competitors are not considered globally systemically important banks (G-SIBs). The potential for new and changing global standards though may mean lessons of adaptation will continually have to be applied in Denmark.
Danish mortgage bonds differ markedly from their German or Spanish counterparts, both of which are issued on the primary market as ‘buy and hold’ investments. Danish bonds on the other hand are all listed on the OMX Nordic Exchange and traded daily in the secondary market.
34 PwC That shrinking feeling: Tracing the changing shape of the European banking industry
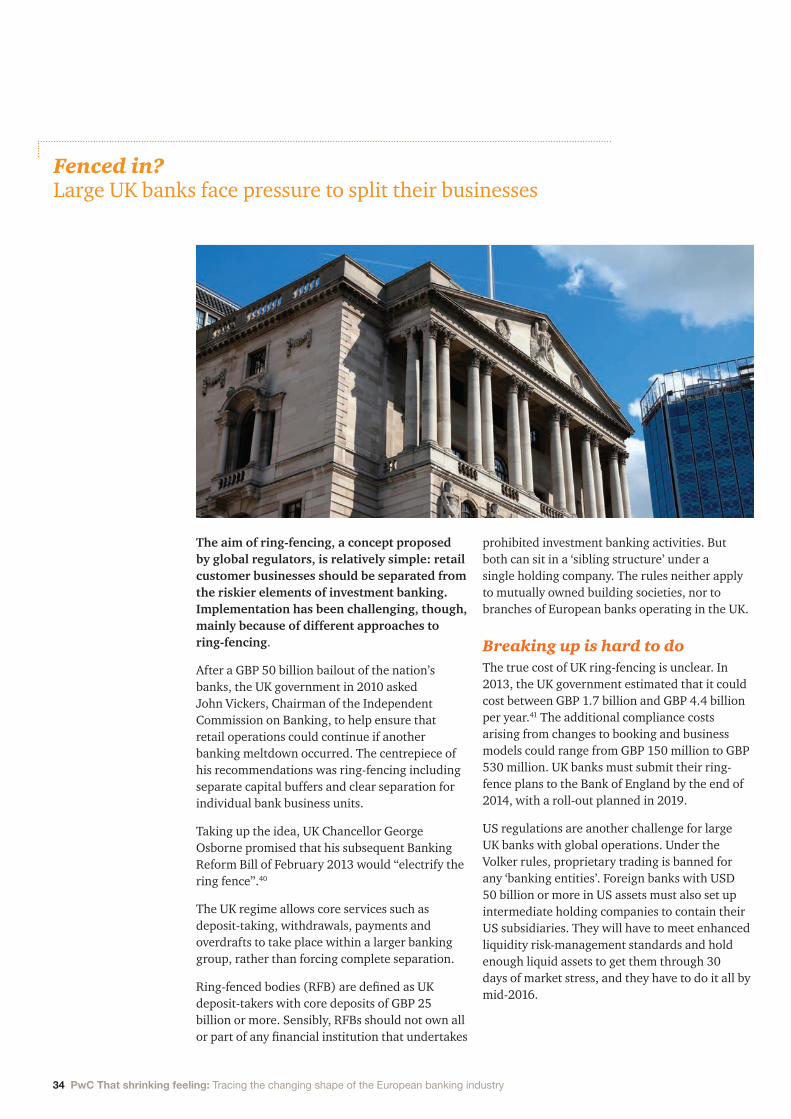
The aim of ring-fencing, a concept proposed by global regulators, is relatively simple: retail customer businesses should be separated from the riskier elements of investment banking. Implementation has been challenging, though, mainly because of different approaches to ring-fencing.
After a GBP 50 billion bailout of the nation’s banks, the UK government in 2010 asked John Vickers, Chairman of the Independent Commission on Banking, to help ensure that retail operations could continue if another banking meltdown occurred. The centrepiece of his recommendations was ring-fencing including separate capital buffers and clear separation for individual bank business units.
Taking up the idea, UK Chancellor George Osborne promised that his subsequent Banking Reform Bill of February 2013 would “electrify the ring fence”.40
The UK regime allows core services such as deposit-taking, withdrawals, payments and overdrafts to take place within a larger banking group, rather than forcing complete separation.
Ring-fenced bodies (RFB) are defined as UK deposit-takers with core deposits of GBP 25 billion or more. Sensibly, RFBs should not own all or part of any financial institution that undertakes
prohibited investment banking activities. But both can sit in a ‘sibling structure’ under a single holding company. The rules neither apply to mutually owned building societies, nor to branches of European banks operating in the UK.
Breaking up is hard to doThe true cost of UK ring-fencing is unclear. In 2013, the UK government estimated that it could cost between GBP 1.7 billion and GBP 4.4 billion per year.41 The additional compliance costs arising from changes to booking and business models could range from GBP 150 million to GBP 530 million. UK banks must submit their ring-fence plans to the Bank of England by the end of 2014, with a roll-out planned in 2019.
US regulations are another challenge for large UK banks with global operations. Under the Volker rules, proprietary trading is banned for any ‘banking entities’. Foreign banks with USD 50 billion or more in US assets must also set up intermediate holding companies to contain their US subsidiaries. They will have to meet enhanced liquidity risk-management standards and hold enough liquid assets to get them through 30 days of market stress, and they have to do it all by mid-2016.
Fenced in? Large UK banks face pressure to split their businesses
PwC That shrinking feeling: Tracing the changing shape of the European banking industry 35
As a result, UK banks must decide to stick with US operations or pull back.
The costs of transformationBarclays is an obvious ring-fencing contender. Despite shrinking its investment banking business, it still accounts for slightly less than one-quarter of all profits. Because its operations are global, the bank may have to create one structure in the US, one in the UK and possibly another covering Europe and elsewhere, each with its own capital, governance and board of directors.
“I think obviously structural reform and ring-fencing is going to be a theme over the next two, three, four years, as we go into 2018 and beyond,” said Barclays group finance director Tushar Morzaria on a call with analysts after the bank announced its third quarter results in November.42
A particular challenge for a large global entity like Barclays is that regulators in Europe and the US have their own ideas about what ring-fencing means.
In Europe, proposals made in January 2014 suggested an outright ban on proprietary trading in financial instruments and commodities by Europe’s largest banks. They also give supervisory powers to force banks to move other higher risk activities, including market-making, derivatives and securitisation, into separate legal units.
So while UK proposals seal off retail operations, Europe intends to throw a wall around investment banking divisions.
To make matters more complex for international banks, France and Germany are pushing ahead with their own plans to define which parts of banks can do business with derivatives and complex instruments.
For Barclays, ring-fencing is part of a broader restructuring plan underway, dubbed Project Transform. The group has sold its non-core Spanish and UAE retail divisions.43
The bank expects to spend GBP 1.3 billion in 2014 on its restructuring programme. Forecast costs associated with Project Transform are GBP 0.7 billion in 2015 and GBP 200 million the following year. “I think you’ll see the bulk of the expenditure on ring fencing probably take place a lot next year, 2016 and 2017,” said Mr Morzaria.44
Pulled in different directionsFor large and complex banks such as Barclays, the issue of different national regulatory standards is significant. If the standards diverge sharply, the risk profiles of business units could change. As a result, shareholders may discriminate more between say the North American entity of a bank and its entity in continental Europe. The entities belong to one banking group whose operating entities may be pulled in different directions.
It is conceivable that markets could increasingly reflect different regulatory standards in share prices. That could also have the effect of pulling apart a bank’s businesses.
In Europe, proposals made in January 2014 suggested an outright ban on proprietary trading in financial instruments and commodities by Europe’s largest banks.
36 PwC That shrinking feeling: Tracing the changing shape of the European banking industry
Notes1 Bloomberg, UK banks seen facing additional $41 billion in
conduct charges, 1 Oct 2014.
2 IMF, European Union: Publication of financial sector assessment program documentation – Technical note on progress with bank restructuring and resolution in Europe, p6, March 2013.
3 European Banking Authority, Press release: EBA publishes 2014 EU-wide stress test results, 26 Oct 2014.
4 Barclays PLC, 2013 Annual report, p61, March 2014.
5 Barclays PLC, Results announcement, p4, 30 June 2014.
6 https://www.bankingsupervision.europa.eu/banking/comprehensive/html/index.en.html
7 Basel Committee on Banking Supervision, Basel III monitoring report, Sept 2014.
8 European Banking Authority, Risk assessment of the European banking system, June 2014.
9 Financial Stability Board, Press release: FSB consults on proposal for a common international standard on total loss-absorbing capacity (TLAC) for global systemic banks, 10 Nov 2014.
10 Bank for International Settlements, Press release: Net stable funding ratio finalised by the Basel committee, 31 Oct 2014.
11 European Banking Authority, Press release: EBA publishes 2014 EU-wide stress test results, 26 Oct 2014.
12 Speech given by Andrew Bailey, deputy governor, prudential regulation and chief executive officer, Prudential Regulation Authority, The capital adequacy of banks: today’s issues and what we have learned from the past, 10 July 2014.
13 European Central Bank, Financial stability review, May 2014.
14 European Banking Authority, Risk assessment of the European banking system, June 2014.
15 https://www.bankingsupervision.europa.eu/banking/comprehensive/html/index.en.html
16 European Banking Authority, Risk assessment of the European banking system, June 2014.
17 European Central Bank, Financial stability review, May 2014.
18 Ibid.
19 See for example The Economist, Gentlemen, start your audits, 5 Oct 2013.
20 European Court of Auditors, European banking supervision taking shape – EBA and its changing context, 2 July 2014.
21 Irish Independent, Lloyds offloads €1.1bn of Irish loans to Lone Star, 17 Oct 2014.
22 Wall Street Journal, AnaCap buys $2.4 billion loan portfolio from UniCredit, 15 Oct 2014.
23 European Central Bank, Financial stability review, May 2014.
24 European Banking Authority, Risk assessment of the European banking system, p41, June 2014.
25 Fitch Ratings, Basel III: Shifting the Credit Landscape, Oct 2014.
26 European Central Bank, Financial stability review, p83, May 2014.
27 Ibid., p70.
28 European Banking Authority, Risk assessment of the European banking system, June 2014.
29 European Central Bank, Financial stability review, p71, May 2014.
30 European Banking Authority, Risk assessment of the European banking system, p39, June 2014.
31 Bloomberg, French banks rush to raise EUR 37bn in early 2012 funds, 1 Oct 2014.
32 Natixis, Special report: US money market funds: shifts in funding for French and European banks, 15 Nov 2011.
33 European Banking Authority, Risk assessment of the European banking system, June 2014.
34 European Banking Authority, Risk assessment of the European banking system, June 2014.
35 Moody’s Investors Service, Basel III Implementation in Full Swing: Global Overview and Credit Implications, Aug 2014.
36 European Banking Authority, Press release: EBA publishes 2014 EU-wide stress test results, 26 Oct 2014.
37 IMF, The new global imbalance: Too much financial risk taking, not enough economic risk taking, 8 Oct 2014.
38 https://www.ecb.europa.eu/press/inter/date/2014/html/sp141028.en.html
39 IMF, The new global imbalance: Too much financial risk taking, not enough economic risk taking, 8 Oct 2014.
40 International Business Times, George Osborne vows to ‘electrify’ bank ring fence in new break-up threat, 4 Feb 2013.
41 HM Treasury, Banking reform: Draft secondary legislation, July 2013.
42 Barclays PLC, Interim Management Statement sell side briefing Q3 2014, analyst transcript Q&A, p14-17, 5 Nov 2014. Retrieved from: http://www.barclays.com/content/dam/barclayspublic/docs/InvestorRelations/IRNewsPresentations/2014Presentations/q3-2014-ims-sellside-briefing-transcript.pdf
43 Reuters, Britain’s Barclays to sell Spanish assets to Caixabank, 31 August 2014.
44 Barclays PLC, Interim Management Statement sell side briefing Q3 2014, analyst transcript Q&A, p14-17, 5 Nov 2014. Retrieved from: http://www.barclays.com/content/dam/barclayspublic/docs/InvestorRelations/IRNewsPresentations/2014Presentations/q3-2014-ims-sellside-briefing-transcript.pdf
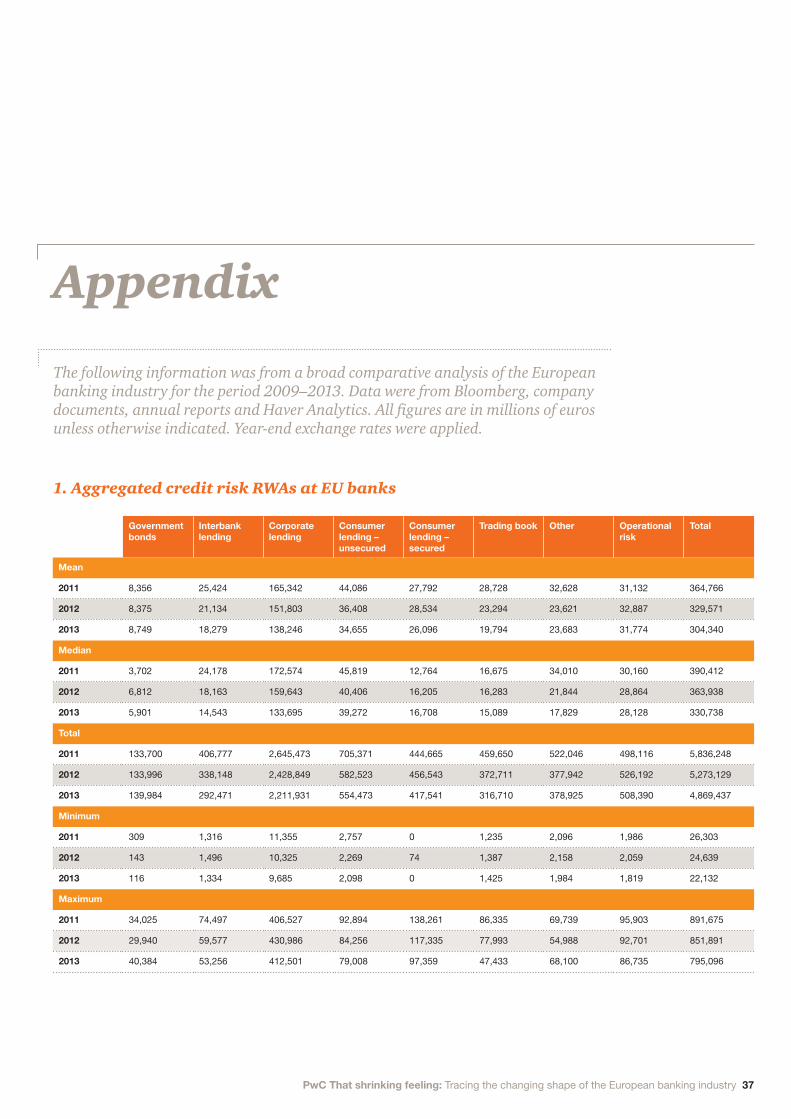
PwC That shrinking feeling: Tracing the changing shape of the European banking industry 37
Appendix
The following information was from a broad comparative analysis of the European banking industry for the period 2009–2013. Data were from Bloomberg, company documents, annual reports and Haver Analytics. All figures are in millions of euros unless otherwise indicated. Year-end exchange rates were applied.
Government bonds
Interbank lending
Corporate lending
Consumer lending – unsecured
Consumer lending – secured
Trading book Other Operational risk
Total
Mean
2011 8,356 25,424 165,342 44,086 27,792 28,728 32,628 31,132 364,766
2012 8,375 21,134 151,803 36,408 28,534 23,294 23,621 32,887 329,571
2013 8,749 18,279 138,246 34,655 26,096 19,794 23,683 31,774 304,340
Median
2011 3,702 24,178 172,574 45,819 12,764 16,675 34,010 30,160 390,412
2012 6,812 18,163 159,643 40,406 16,205 16,283 21,844 28,864 363,938
2013 5,901 14,543 133,695 39,272 16,708 15,089 17,829 28,128 330,738
Total
2011 133,700 406,777 2,645,473 705,371 444,665 459,650 522,046 498,116 5,836,248
2012 133,996 338,148 2,428,849 582,523 456,543 372,711 377,942 526,192 5,273,129
2013 139,984 292,471 2,211,931 554,473 417,541 316,710 378,925 508,390 4,869,437
Minimum
2011 309 1,316 11,355 2,757 0 1,235 2,096 1,986 26,303
2012 143 1,496 10,325 2,269 74 1,387 2,158 2,059 24,639
2013 116 1,334 9,685 2,098 0 1,425 1,984 1,819 22,132
Maximum
2011 34,025 74,497 406,527 92,894 138,261 86,335 69,739 95,903 891,675
2012 29,940 59,577 430,986 84,256 117,335 77,993 54,988 92,701 851,891
2013 40,384 53,256 412,501 79,008 97,359 47,433 68,100 86,735 795,096
1. Aggregated credit risk RWAs at EU banks
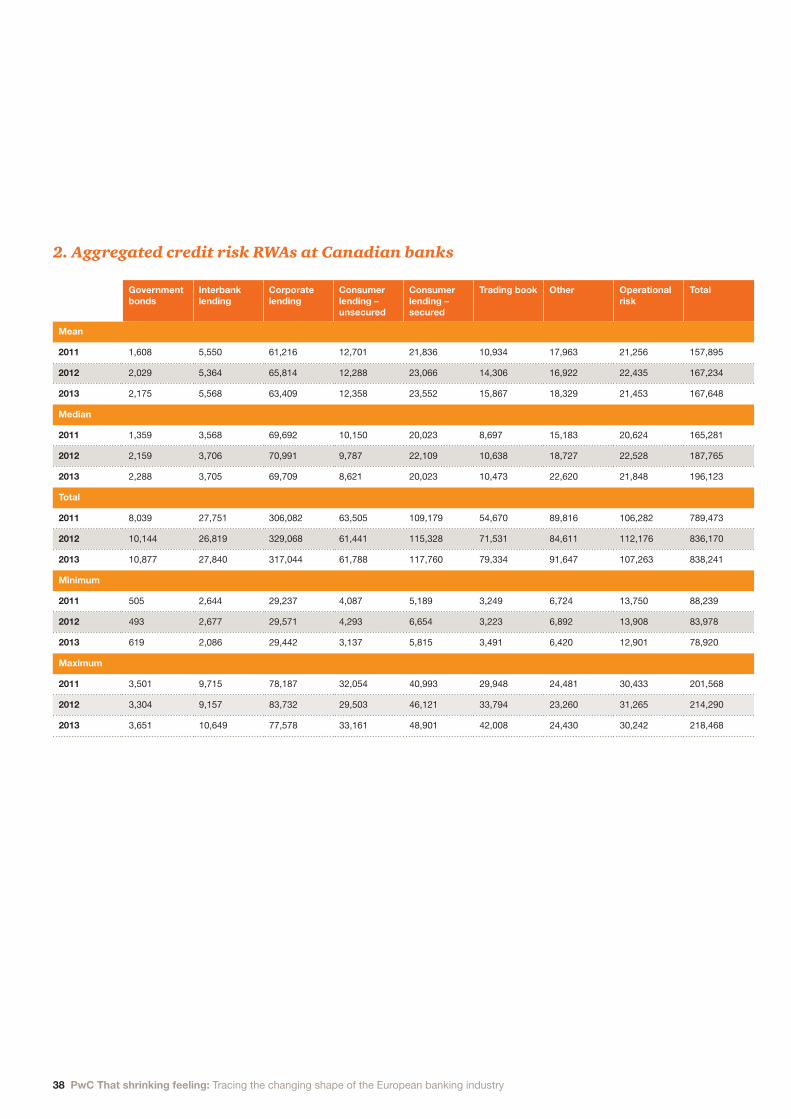
38 PwC That shrinking feeling: Tracing the changing shape of the European banking industry
Government bonds
Interbank lending
Corporate lending
Consumer lending – unsecured
Consumer lending – secured
Trading book Other Operational risk
Total
Mean
2011 1,608 5,550 61,216 12,701 21,836 10,934 17,963 21,256 157,895
2012 2,029 5,364 65,814 12,288 23,066 14,306 16,922 22,435 167,234
2013 2,175 5,568 63,409 12,358 23,552 15,867 18,329 21,453 167,648
Median
2011 1,359 3,568 69,692 10,150 20,023 8,697 15,183 20,624 165,281
2012 2,159 3,706 70,991 9,787 22,109 10,638 18,727 22,528 187,765
2013 2,288 3,705 69,709 8,621 20,023 10,473 22,620 21,848 196,123
Total
2011 8,039 27,751 306,082 63,505 109,179 54,670 89,816 106,282 789,473
2012 10,144 26,819 329,068 61,441 115,328 71,531 84,611 112,176 836,170
2013 10,877 27,840 317,044 61,788 117,760 79,334 91,647 107,263 838,241
Minimum
2011 505 2,644 29,237 4,087 5,189 3,249 6,724 13,750 88,239
2012 493 2,677 29,571 4,293 6,654 3,223 6,892 13,908 83,978
2013 619 2,086 29,442 3,137 5,815 3,491 6,420 12,901 78,920
Maximum
2011 3,501 9,715 78,187 32,054 40,993 29,948 24,481 30,433 201,568
2012 3,304 9,157 83,732 29,503 46,121 33,794 23,260 31,265 214,290
2013 3,651 10,649 77,578 33,161 48,901 42,008 24,430 30,242 218,468
2. Aggregated credit risk RWAs at Canadian banks
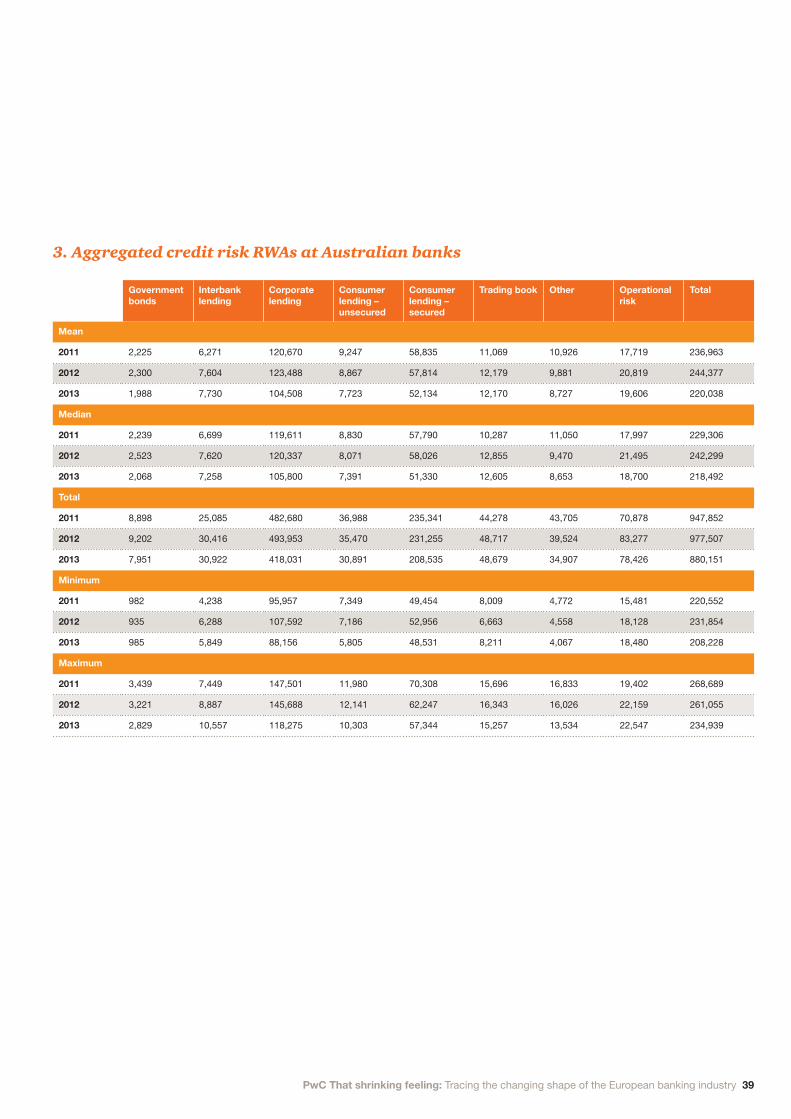
PwC That shrinking feeling: Tracing the changing shape of the European banking industry 39
Government bonds
Interbank lending
Corporate lending
Consumer lending – unsecured
Consumer lending – secured
Trading book Other Operational risk
Total
Mean
2011 2,225 6,271 120,670 9,247 58,835 11,069 10,926 17,719 236,963
2012 2,300 7,604 123,488 8,867 57,814 12,179 9,881 20,819 244,377
2013 1,988 7,730 104,508 7,723 52,134 12,170 8,727 19,606 220,038
Median
2011 2,239 6,699 119,611 8,830 57,790 10,287 11,050 17,997 229,306
2012 2,523 7,620 120,337 8,071 58,026 12,855 9,470 21,495 242,299
2013 2,068 7,258 105,800 7,391 51,330 12,605 8,653 18,700 218,492
Total
2011 8,898 25,085 482,680 36,988 235,341 44,278 43,705 70,878 947,852
2012 9,202 30,416 493,953 35,470 231,255 48,717 39,524 83,277 977,507
2013 7,951 30,922 418,031 30,891 208,535 48,679 34,907 78,426 880,151
Minimum
2011 982 4,238 95,957 7,349 49,454 8,009 4,772 15,481 220,552
2012 935 6,288 107,592 7,186 52,956 6,663 4,558 18,128 231,854
2013 985 5,849 88,156 5,805 48,531 8,211 4,067 18,480 208,228
Maximum
2011 3,439 7,449 147,501 11,980 70,308 15,696 16,833 19,402 268,689
2012 3,221 8,887 145,688 12,141 62,247 16,343 16,026 22,159 261,055
2013 2,829 10,557 118,275 10,303 57,344 15,257 13,534 22,547 234,939
3. Aggregated credit risk RWAs at Australian banks
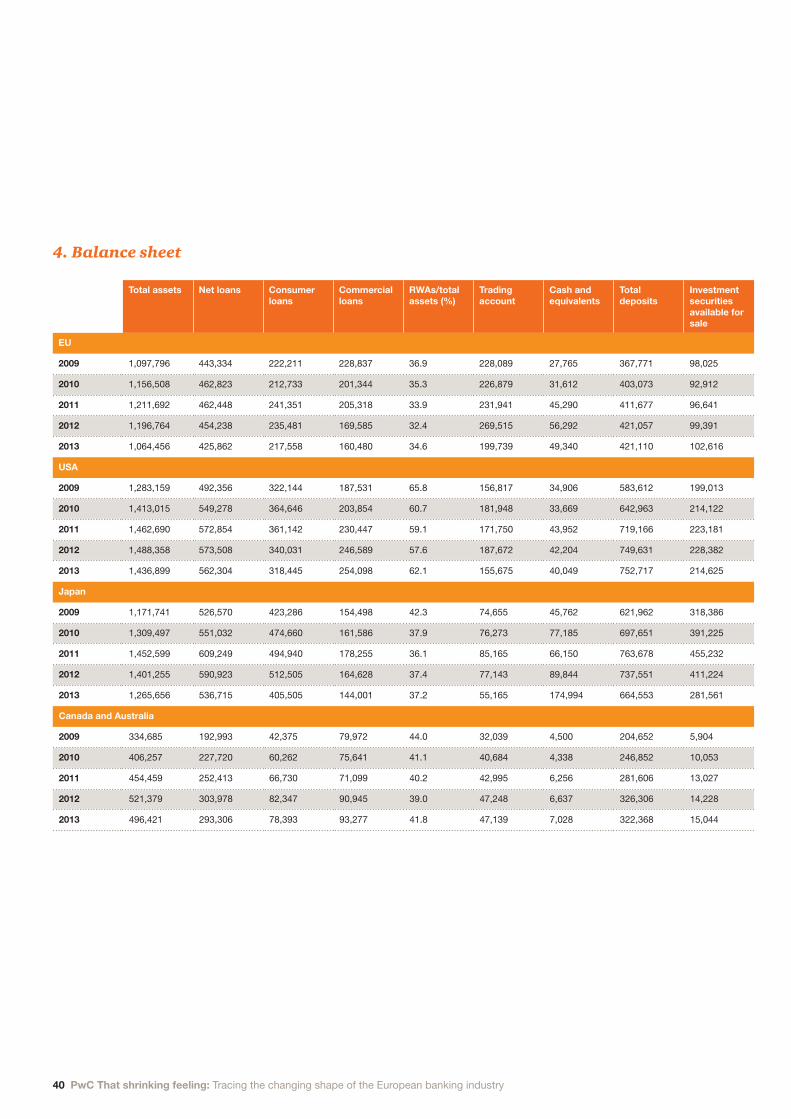
40 PwC That shrinking feeling: Tracing the changing shape of the European banking industry
Total assets Net loans Consumer loans
Commercial loans
RWAs/total assets (%)
Trading account
Cash and equivalents
Total deposits
Investment securities available for sale
EU
2009 1,097,796 443,334 222,211 228,837 36.9 228,089 27,765 367,771 98,025
2010 1,156,508 462,823 212,733 201,344 35.3 226,879 31,612 403,073 92,912
2011 1,211,692 462,448 241,351 205,318 33.9 231,941 45,290 411,677 96,641
2012 1,196,764 454,238 235,481 169,585 32.4 269,515 56,292 421,057 99,391
2013 1,064,456 425,862 217,558 160,480 34.6 199,739 49,340 421,110 102,616
USA
2009 1,283,159 492,356 322,144 187,531 65.8 156,817 34,906 583,612 199,013
2010 1,413,015 549,278 364,646 203,854 60.7 181,948 33,669 642,963 214,122
2011 1,462,690 572,854 361,142 230,447 59.1 171,750 43,952 719,166 223,181
2012 1,488,358 573,508 340,031 246,589 57.6 187,672 42,204 749,631 228,382
2013 1,436,899 562,304 318,445 254,098 62.1 155,675 40,049 752,717 214,625
Japan
2009 1,171,741 526,570 423,286 154,498 42.3 74,655 45,762 621,962 318,386
2010 1,309,497 551,032 474,660 161,586 37.9 76,273 77,185 697,651 391,225
2011 1,452,599 609,249 494,940 178,255 36.1 85,165 66,150 763,678 455,232
2012 1,401,255 590,923 512,505 164,628 37.4 77,143 89,844 737,551 411,224
2013 1,265,656 536,715 405,505 144,001 37.2 55,165 174,994 664,553 281,561
Canada and Australia
2009 334,685 192,993 42,375 79,972 44.0 32,039 4,500 204,652 5,904
2010 406,257 227,720 60,262 75,641 41.1 40,684 4,338 246,852 10,053
2011 454,459 252,413 66,730 71,099 40.2 42,995 6,256 281,606 13,027
2012 521,379 303,978 82,347 90,945 39.0 47,248 6,637 326,306 14,228
2013 496,421 293,306 78,393 93,277 41.8 47,139 7,028 322,368 15,044
4. Balance sheet
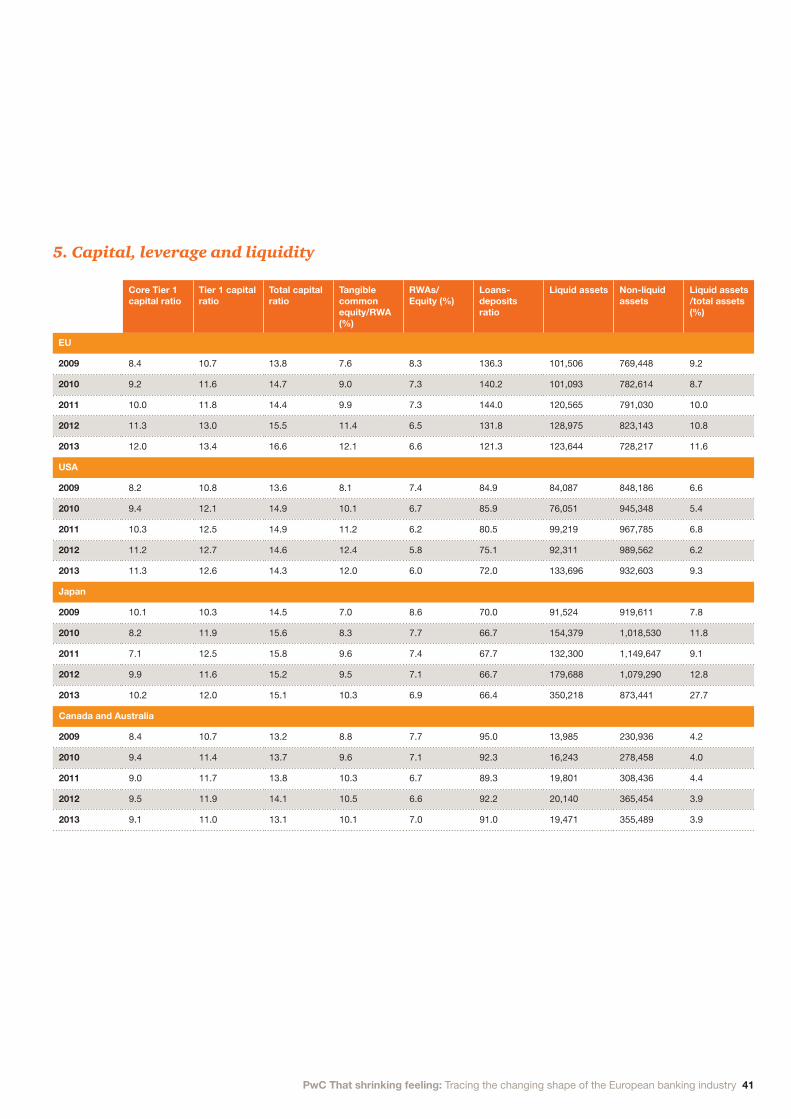
PwC That shrinking feeling: Tracing the changing shape of the European banking industry 41
Core Tier 1 capital ratio
Tier 1 capital ratio
Total capital ratio
Tangible common equity/RWA (%)
RWAs/ Equity (%)
Loans-deposits ratio
Liquid assets Non-liquid assets
Liquid assets /total assets (%)
EU
2009 8.4 10.7 13.8 7.6 8.3 136.3 101,506 769,448 9.2
2010 9.2 11.6 14.7 9.0 7.3 140.2 101,093 782,614 8.7
2011 10.0 11.8 14.4 9.9 7.3 144.0 120,565 791,030 10.0
2012 11.3 13.0 15.5 11.4 6.5 131.8 128,975 823,143 10.8
2013 12.0 13.4 16.6 12.1 6.6 121.3 123,644 728,217 11.6
USA
2009 8.2 10.8 13.6 8.1 7.4 84.9 84,087 848,186 6.6
2010 9.4 12.1 14.9 10.1 6.7 85.9 76,051 945,348 5.4
2011 10.3 12.5 14.9 11.2 6.2 80.5 99,219 967,785 6.8
2012 11.2 12.7 14.6 12.4 5.8 75.1 92,311 989,562 6.2
2013 11.3 12.6 14.3 12.0 6.0 72.0 133,696 932,603 9.3
Japan
2009 10.1 10.3 14.5 7.0 8.6 70.0 91,524 919,611 7.8
2010 8.2 11.9 15.6 8.3 7.7 66.7 154,379 1,018,530 11.8
2011 7.1 12.5 15.8 9.6 7.4 67.7 132,300 1,149,647 9.1
2012 9.9 11.6 15.2 9.5 7.1 66.7 179,688 1,079,290 12.8
2013 10.2 12.0 15.1 10.3 6.9 66.4 350,218 873,441 27.7
Canada and Australia
2009 8.4 10.7 13.2 8.8 7.7 95.0 13,985 230,936 4.2
2010 9.4 11.4 13.7 9.6 7.1 92.3 16,243 278,458 4.0
2011 9.0 11.7 13.8 10.3 6.7 89.3 19,801 308,436 4.4
2012 9.5 11.9 14.1 10.5 6.6 92.2 20,140 365,454 3.9
2013 9.1 11.0 13.1 10.1 7.0 91.0 19,471 355,489 3.9
5. Capital, leverage and liquidity

Contacts
Dominic Nixon Global Head of FS Risk PwC Singapore +65 6236 3188 [email protected]
Chris Matten FS Risk Leader, Asia Pacific PwC Singapore +65 6236 3878 [email protected]
If you would like to discuss any of the content in more depth please speak to your usual PwC contact, or one of the following:
42 PwC That shrinking feeling: Tracing the changing shape of the European banking industry


www.pwc.com/financialservices This publication has been prepared for general guidance on matters of interest only, and does not constitute professional advice. You should not act upon the information contained in this publication without obtaining specific professional advice. No representation or warranty (express or implied) is given as to the accuracy or completeness of the information contained in this publication, and, to the extent permitted by law, PwC does not accept or assume any liability, responsibility or duty of care for any consequences of you or anyone else acting, or refraining to act, in reliance on the information contained in this publication or for any decision based on it.
© 2015 PwC. All rights reserved. PwC refers to the PwC network and/or one or more of its member firms, each of which is a separate legal entity. Please see www.pwc.com/structure for further details.