Embed Size (px)
Citation preview
Full Year Results for 2015February 4, 2016
4.2.2016 2
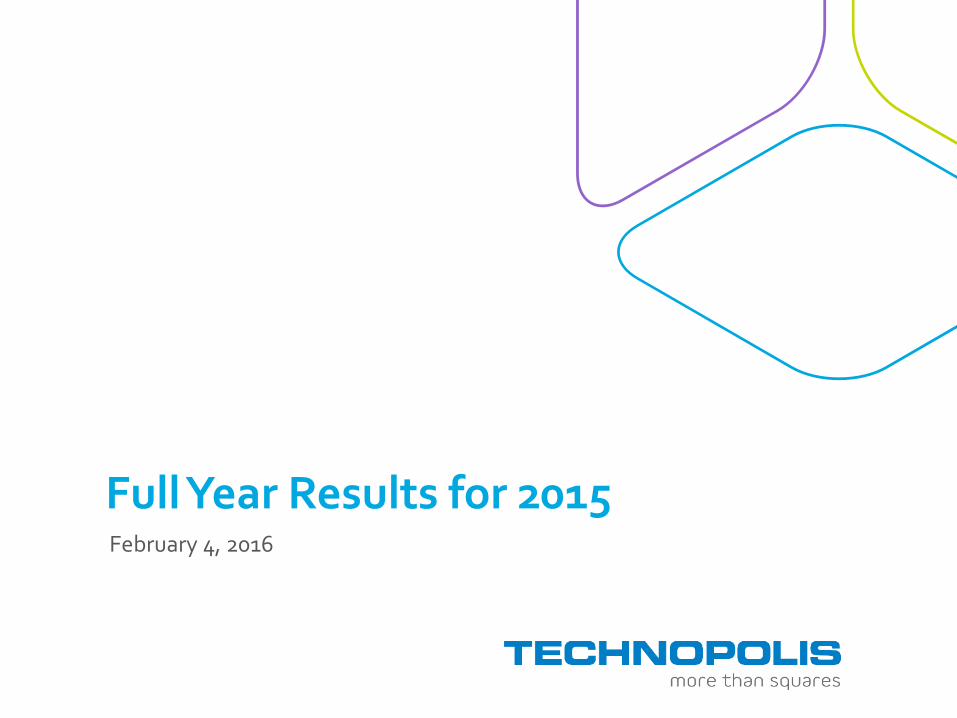
2015 in Brief
Net sales up 5.5%, EBITDA up 6.7%
Occupancy 94.6% (94.7%)
EBITDA margin improved, 54.5 (53.9)%
Service revenue EUR 20.3 million (+20.3%)
Fair values up EUR 1.3 million
Equity ratio rose to 39.3 (38.5)%
4.2.2016 3
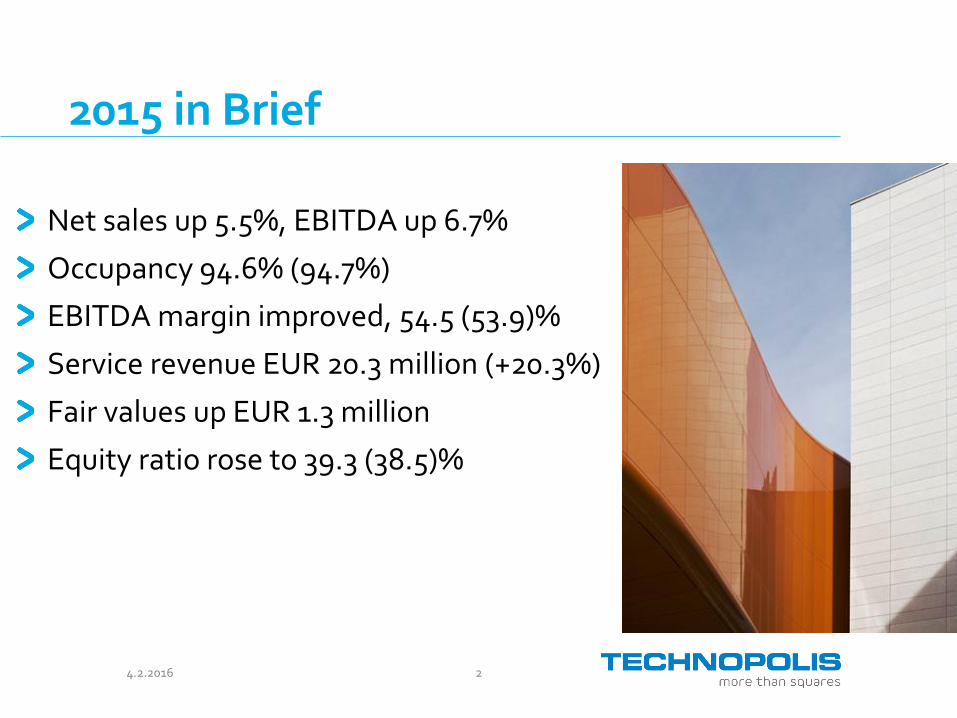
Group Financial Occupancy
80%
85%
90%
95%
100%10 Yr. Avg.
94.5%
Q4/1594.6%
4.2.2016 4
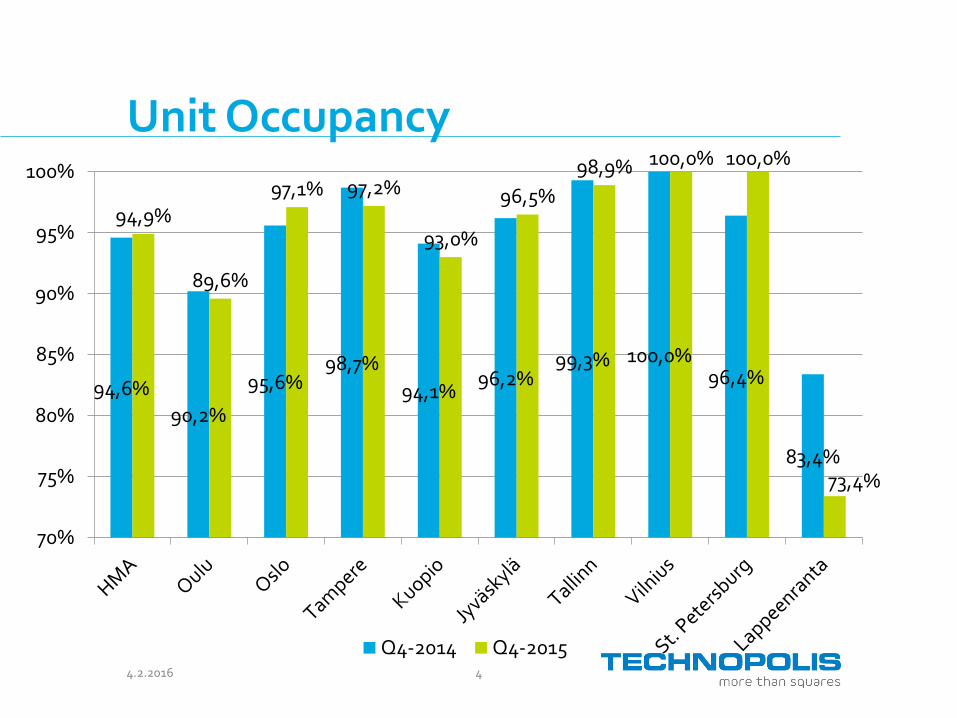
Unit Occupancy
94,6%
90,2%
95,6%98,7%
94,1%96,2%
99,3% 100,0%96,4%
83,4%
94,9%
89,6%
97,1% 97,2%
93,0%
96,5%
98,9% 100,0% 100,0%
73,4%
70%
75%
80%
85%
90%
95%
100%
Q4-2014 Q4-2015
4.2.2016 5
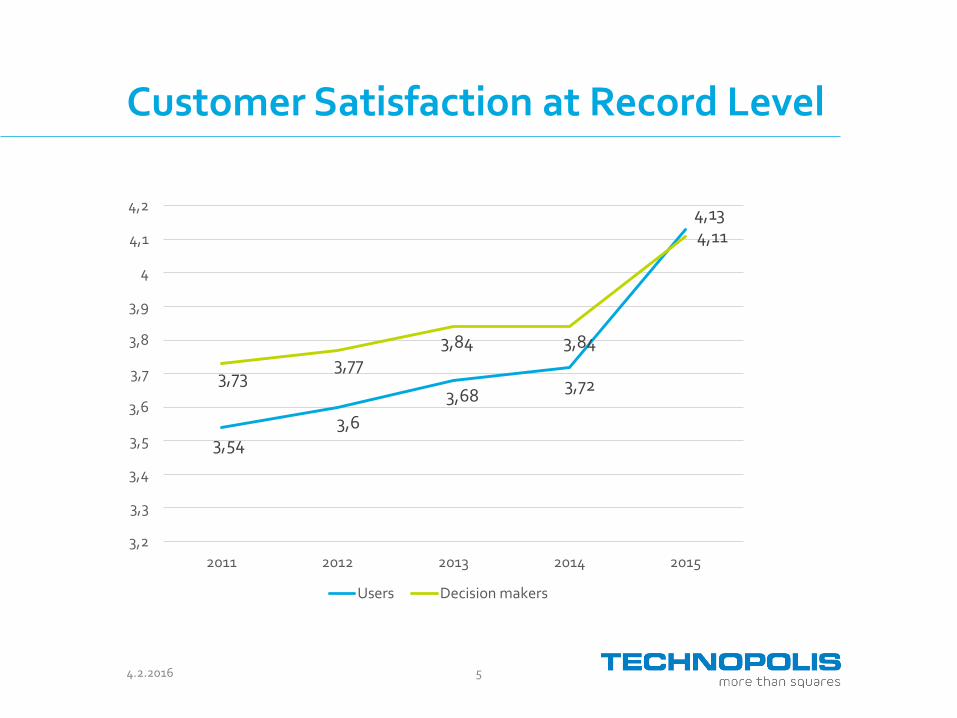
Customer Satisfaction at Record Level
3,543,6
3,683,72
4,13
3,733,77
3,84 3,84
4,11
3,2
3,3
3,4
3,5
3,6
3,7
3,8
3,9
4
4,1
4,2
2011 2012 2013 2014 2015
Users Decision makers
4.2.2016 6
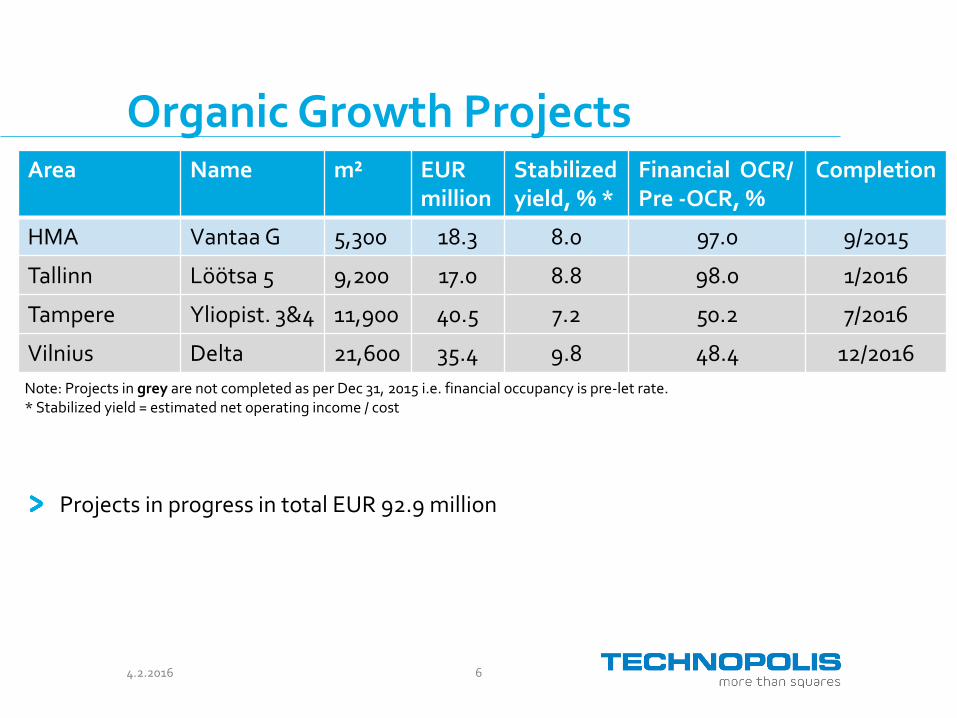
Area Name m² EUR million
Stabilized yield, % *
Financial OCR/ Pre -OCR, %
Completion
HMA Vantaa G 5,300 18.3 8.0 97.0 9/2015
Tallinn Löötsa 5 9,200 17.0 8.8 98.0 1/2016
Tampere Yliopist. 3&4 11,900 40.5 7.2 50.2 7/2016
Vilnius Delta 21,600 35.4 9.8 48.4 12/2016
Organic Growth Projects
Projects in progress in total EUR 92.9 million
Note: Projects in grey are not completed as per Dec 31, 2015 i.e. financial occupancy is pre-let rate.* Stabilized yield = estimated net operating income / cost
4.2.2016 7
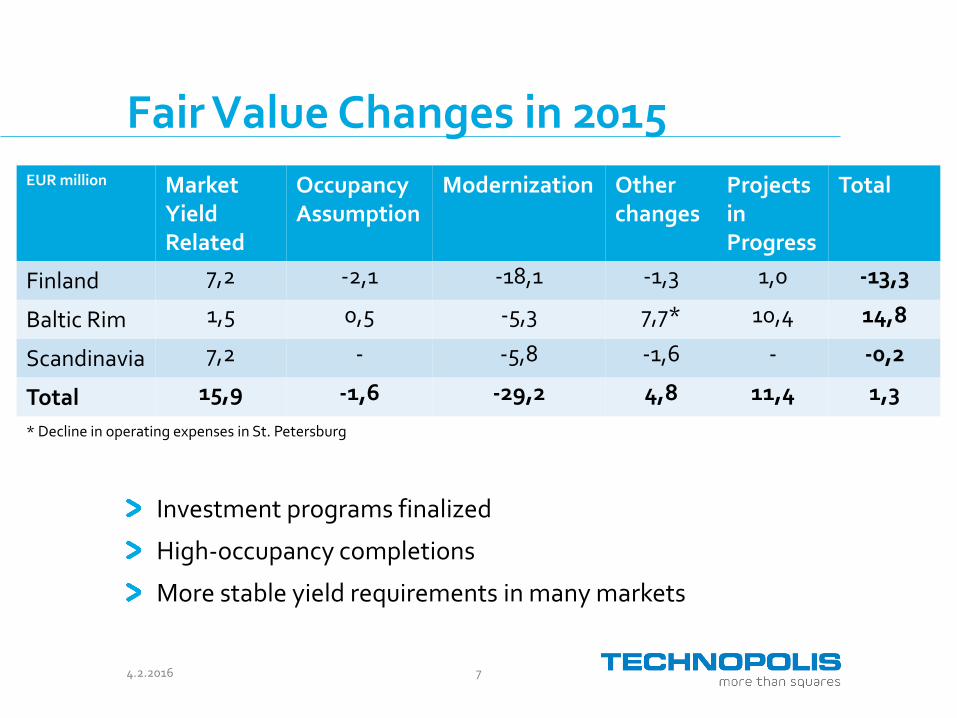
Fair Value Changes in 2015
Investment programs finalized
High-occupancy completions
More stable yield requirements in many markets
EUR million MarketYield Related
OccupancyAssumption
Modernization Other changes
Projects in Progress
Total
Finland 7,2 -2,1 -18,1 -1,3 1,0 -13,3
Baltic Rim 1,5 0,5 -5,3 7,7* 10,4 14,8
Scandinavia 7,2 - -5,8 -1,6 - -0,2
Total 15,9 -1,6 -29,2 4,8 11,4 1,3
* Decline in operating expenses in St. Petersburg
4.2.2016 8
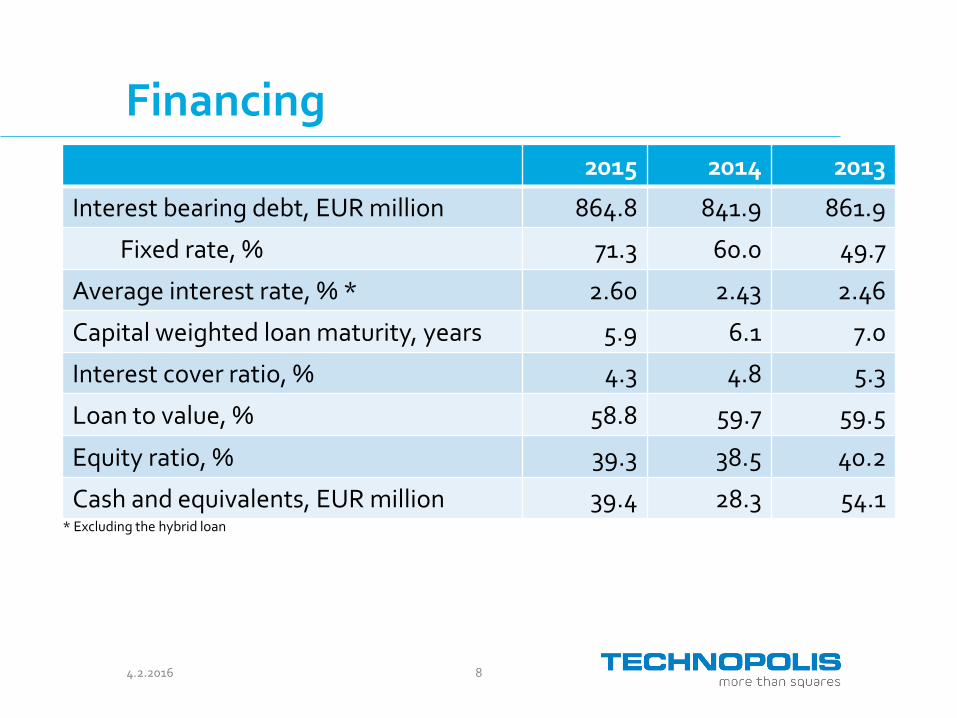
Financing2015 2014 2013
Interest bearing debt, EUR million 864.8 841.9 861.9
Fixed rate, % 71.3 60.0 49.7
Average interest rate, % * 2.60 2.43 2.46
Capital weighted loan maturity, years 5.9 6.1 7.0
Interest cover ratio, % 4.3 4.8 5.3
Loan to value, % 58.8 59.7 59.5
Equity ratio, % 39.3 38.5 40.2
Cash and equivalents, EUR million 39.4 28.3 54.1* Excluding the hybrid loan
4.2.2016 9
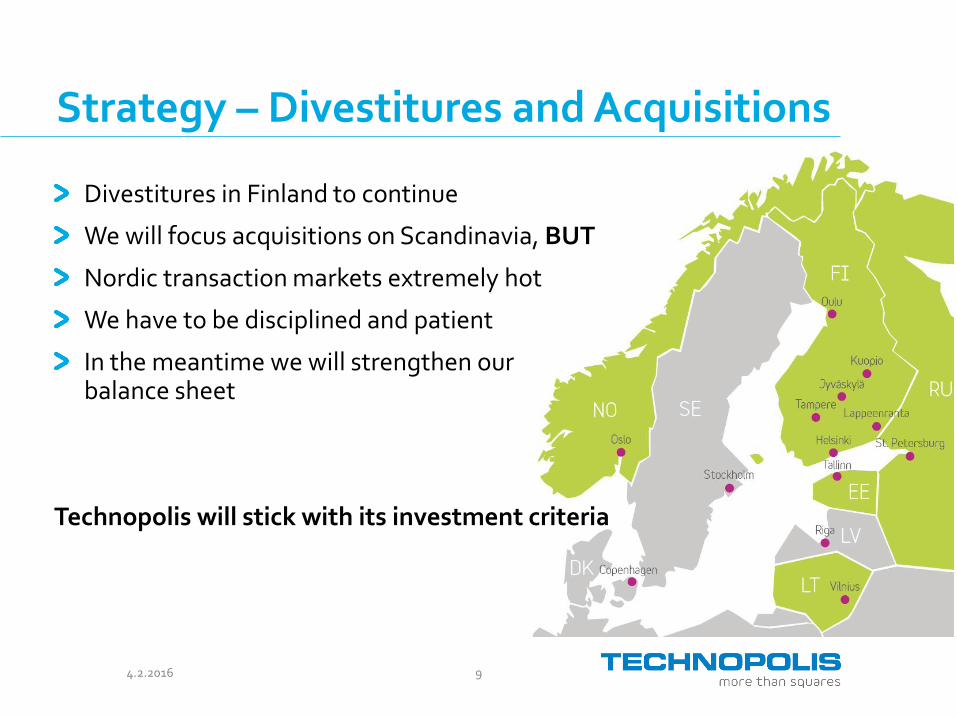
Strategy – Divestitures and Acquisitions
Divestitures in Finland to continue
We will focus acquisitions on Scandinavia, BUT
Nordic transaction markets extremely hot
We have to be disciplined and patient
In the meantime we will strengthen our balance sheet
Technopolis will stick with its investment criteria
104.2.2016
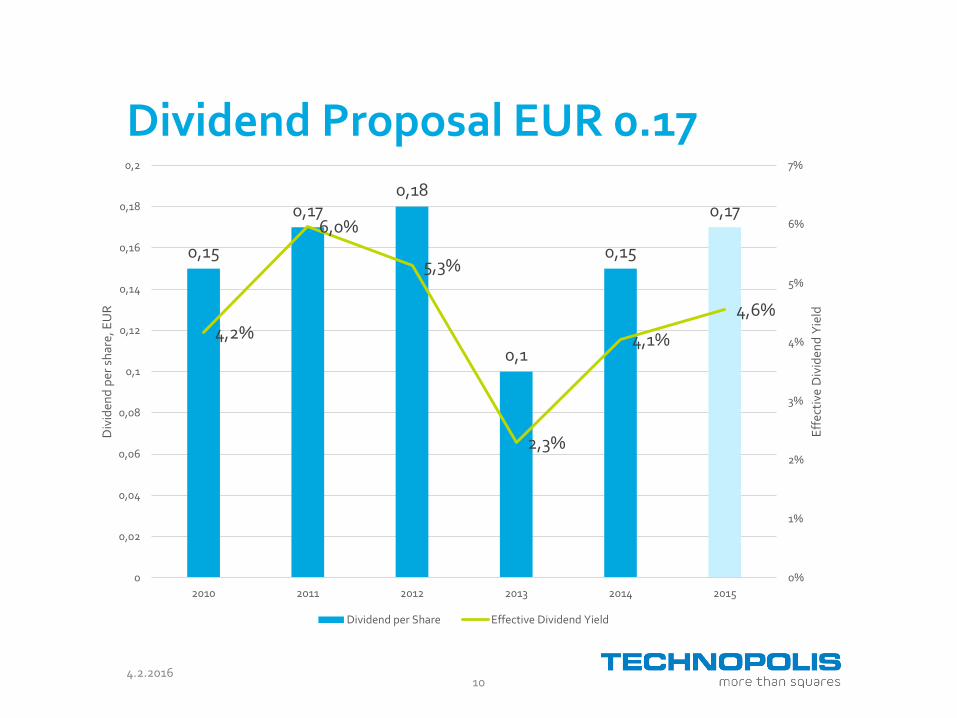
Dividend Proposal EUR 0.17
0,15
0,170,18
0,1
0,15
0,17
4,2%
6,0%
5,3%
2,3%
4,1%
4,6%
0%
1%
2%
3%
4%
5%
6%
7%
0
0,02
0,04
0,06
0,08
0,1
0,12
0,14
0,16
0,18
0,2
2010 2011 2012 2013 2014 2015
Eff
ecti
ve D
ivid
end
Yie
ld
Div
iden
d p
er s
har
e, E
UR
Dividend per Share Effective Dividend Yield
4.2.2016 11
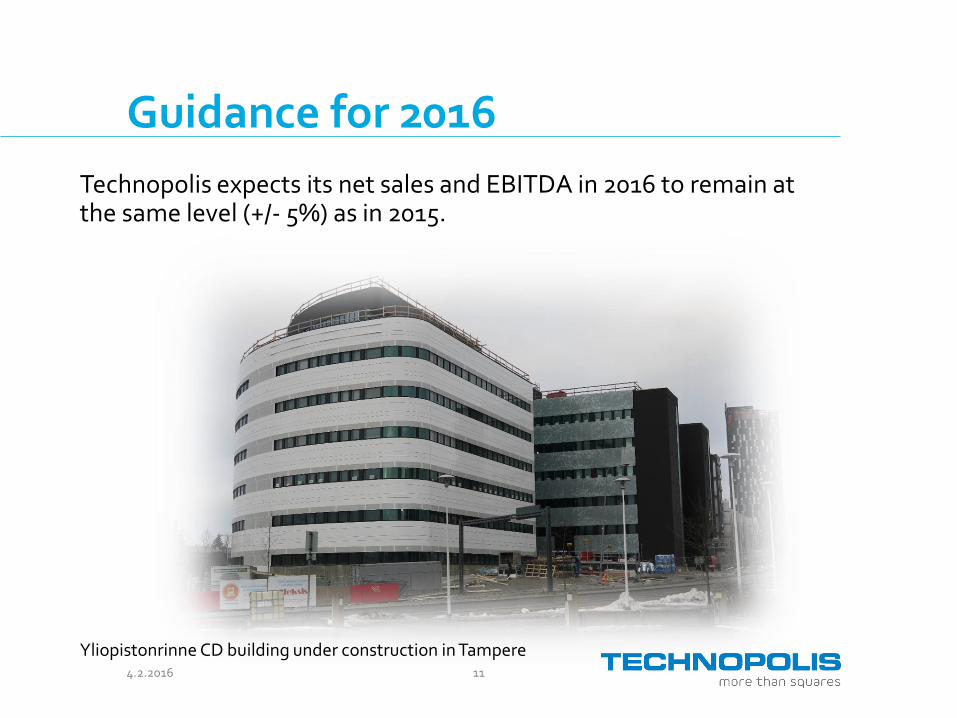
Guidance for 2016
Technopolis expects its net sales and EBITDA in 2016 to remain at the same level (+/- 5%) as in 2015.
Yliopistonrinne CD building under construction in Tampere
Appendices: Additional Data
134.2.2016
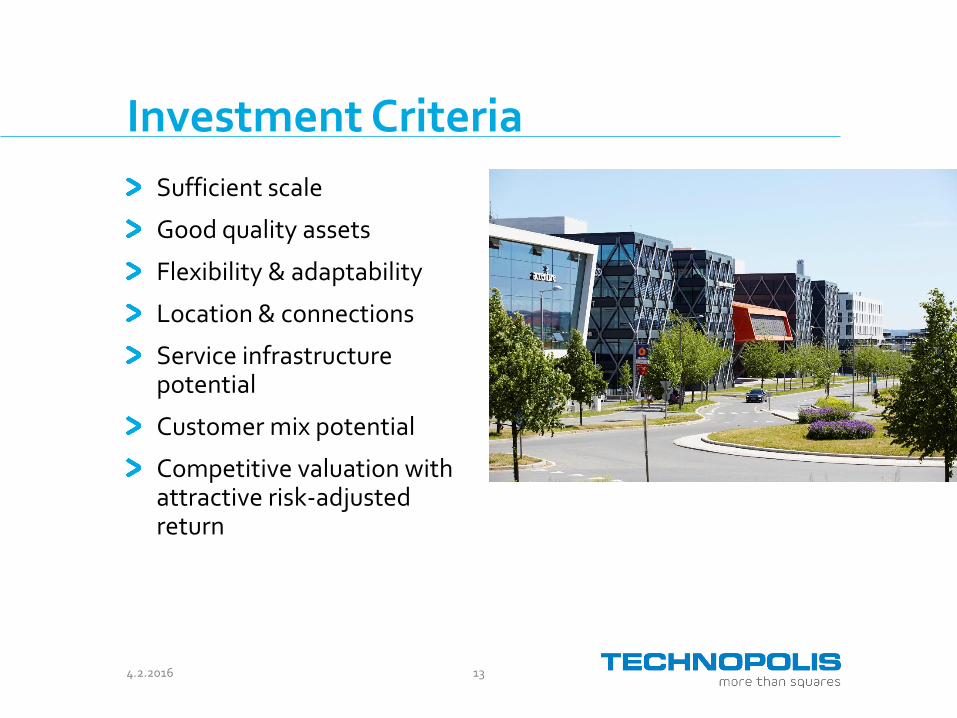
Investment Criteria
Sufficient scale
Good quality assets
Flexibility & adaptability
Location & connections
Service infrastructure potential
Customer mix potential
Competitive valuation with attractive risk-adjusted return
4.2.2016 14
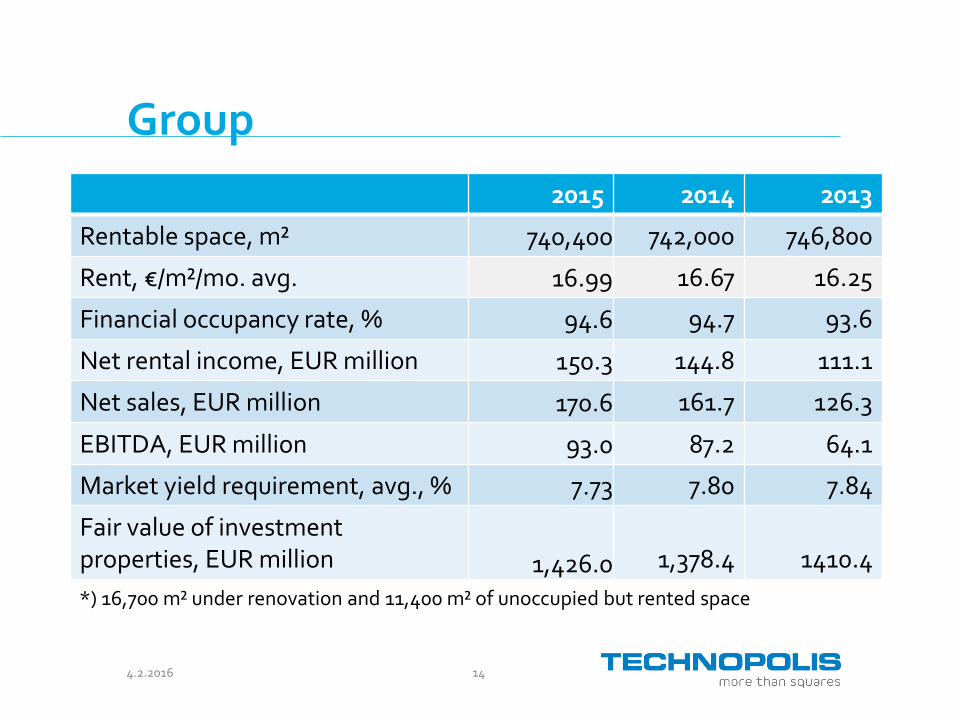
Group
2015 2014 2013
Rentable space, m² 740,400 742,000 746,800
Rent, €/m²/mo. avg. 16.99 16.67 16.25
Financial occupancy rate, % 94.6 94.7 93.6
Net rental income, EUR million 150.3 144.8 111.1
Net sales, EUR million 170.6 161.7 126.3
EBITDA, EUR million 93.0 87.2 64.1
Market yield requirement, avg., % 7.73 7.80 7.84
Fair value of investment properties, EUR million 1,426.0 1,378.4 1410.4
*) 16,700 m² under renovation and 11,400 m² of unoccupied but rented space
4.2.2016 15
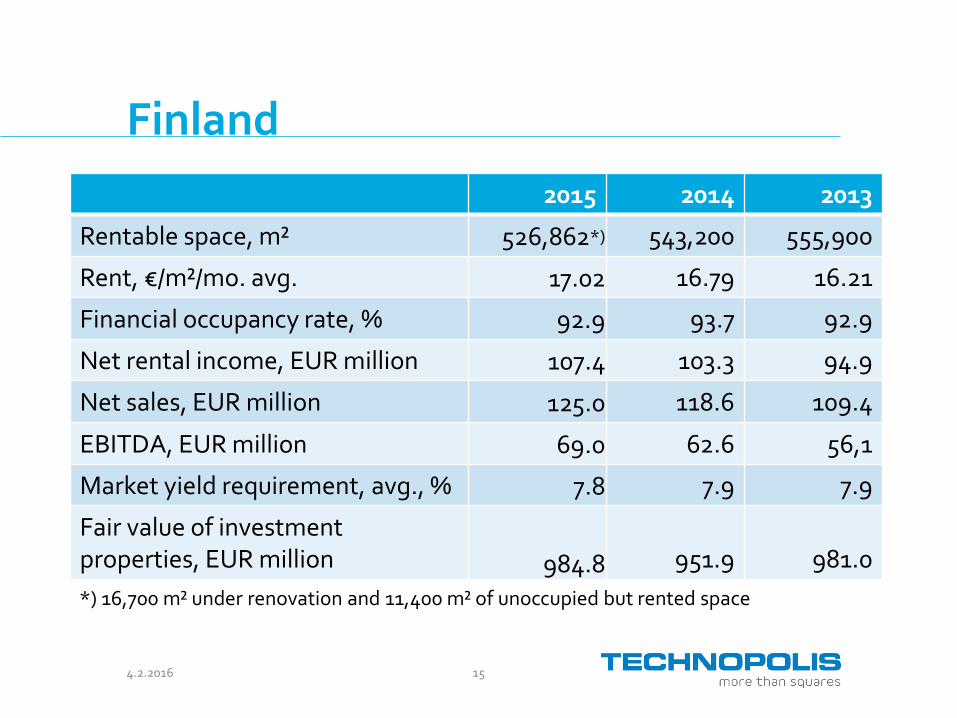
Finland
2015 2014 2013
Rentable space, m² 526,862*) 543,200 555,900
Rent, €/m²/mo. avg. 17.02 16.79 16.21
Financial occupancy rate, % 92.9 93.7 92.9
Net rental income, EUR million 107.4 103.3 94.9
Net sales, EUR million 125.0 118.6 109.4
EBITDA, EUR million 69.0 62.6 56,1
Market yield requirement, avg., % 7.8 7.9 7.9
Fair value of investment properties, EUR million 984.8 951.9 981.0
*) 16,700 m² under renovation and 11,400 m² of unoccupied but rented space
4.2.2016 16
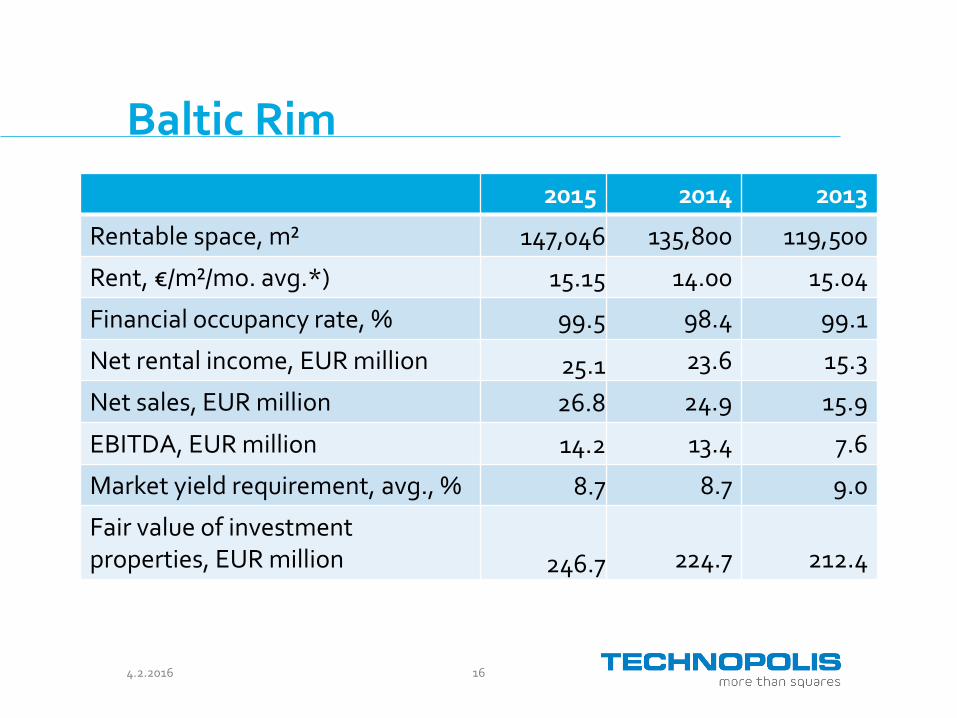
Baltic Rim
2015 2014 2013
Rentable space, m² 147,046 135,800 119,500
Rent, €/m²/mo. avg.*) 15.15 14.00 15.04
Financial occupancy rate, % 99.5 98.4 99.1
Net rental income, EUR million 25.1 23.6 15.3
Net sales, EUR million 26.8 24.9 15.9
EBITDA, EUR million 14.2 13.4 7.6
Market yield requirement, avg., % 8.7 8.7 9.0
Fair value of investment properties, EUR million 246.7 224.7 212.4
4.2.2016 17
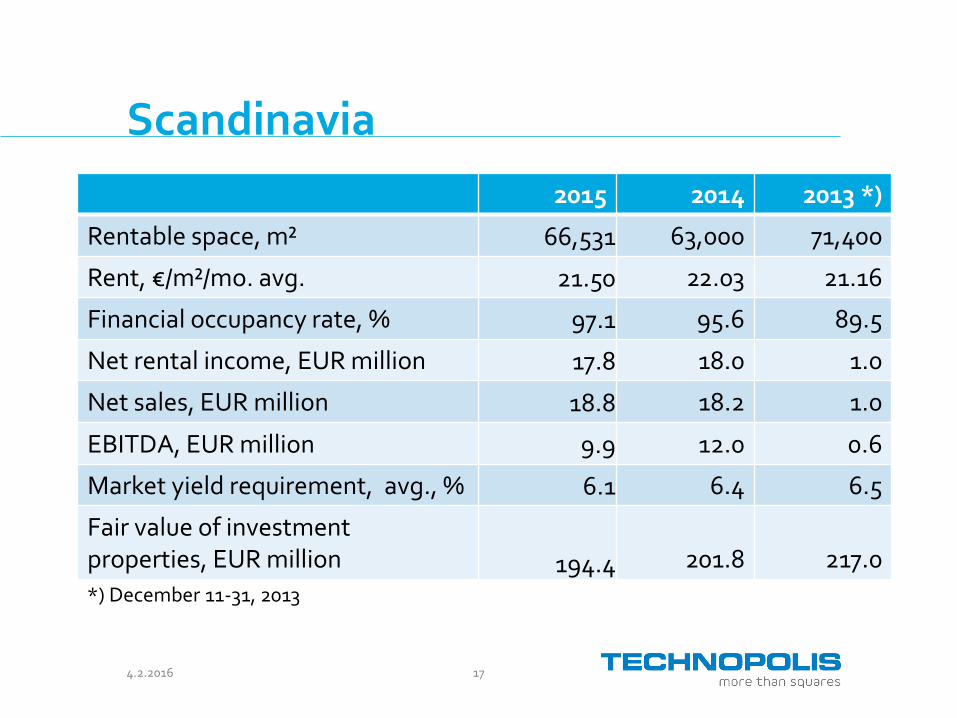
Scandinavia
2015 2014 2013 *)
Rentable space, m² 66,531 63,000 71,400
Rent, €/m²/mo. avg. 21.50 22.03 21.16
Financial occupancy rate, % 97.1 95.6 89.5
Net rental income, EUR million 17.8 18.0 1.0
Net sales, EUR million 18.8 18.2 1.0
EBITDA, EUR million 9.9 12.0 0.6
Market yield requirement, avg., % 6.1 6.4 6.5
Fair value of investment properties, EUR million 194.4 201.8 217.0
*) December 11-31, 2013
4.2.2016 18
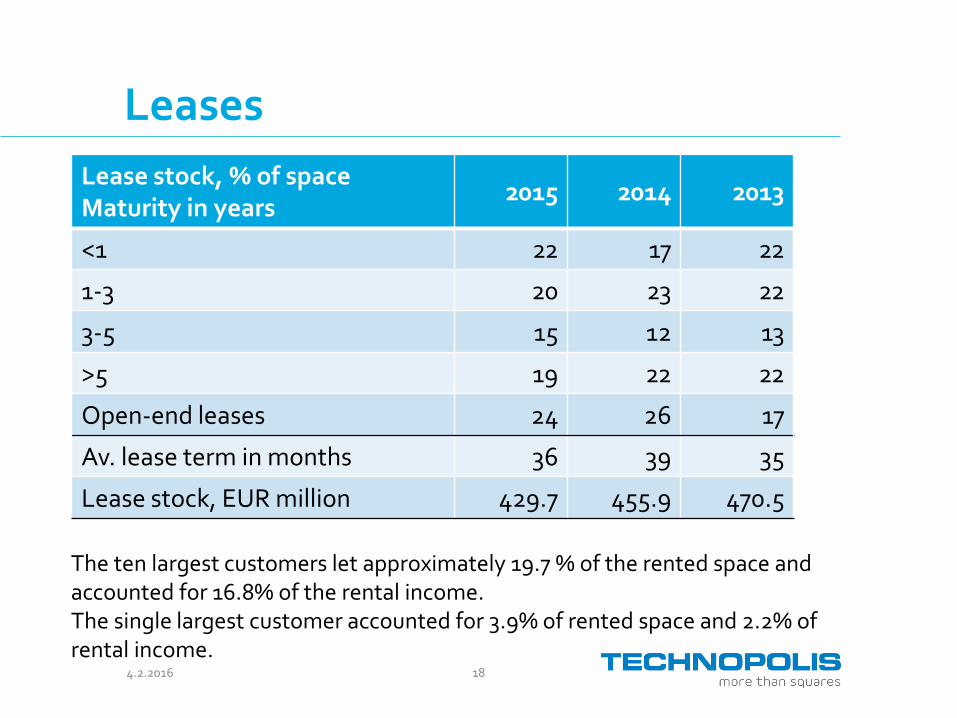
Leases
Lease stock, % of space Maturity in years
2015 2014 2013
<1 22 17 22
1-3 20 23 22
3-5 15 12 13
>5 19 22 22
Open-end leases 24 26 17
Av. lease term in months 36 39 35
Lease stock, EUR million 429.7 455.9 470.5
The ten largest customers let approximately 19.7 % of the rented space and accounted for 16.8% of the rental income. The single largest customer accounted for 3.9% of rented space and 2.2% of rental income.
4.2.2016 19
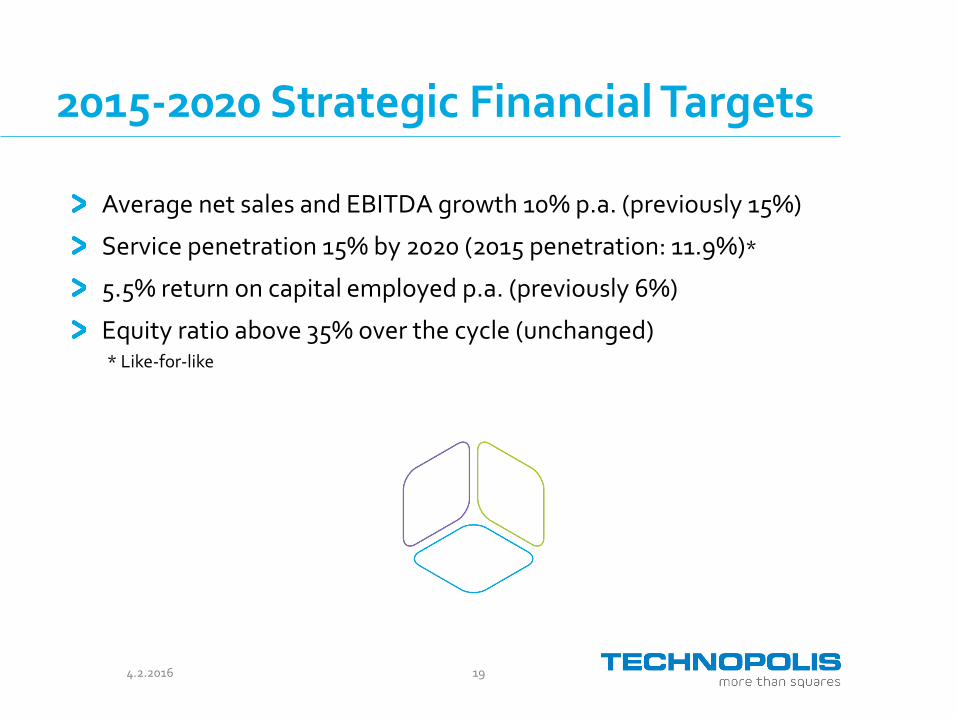
2015-2020 Strategic Financial Targets
Average net sales and EBITDA growth 10% p.a. (previously 15%)
Service penetration 15% by 2020 (2015 penetration: 11.9%)*
5.5% return on capital employed p.a. (previously 6%)
Equity ratio above 35% over the cycle (unchanged)* Like-for-like
4.2.2016 20
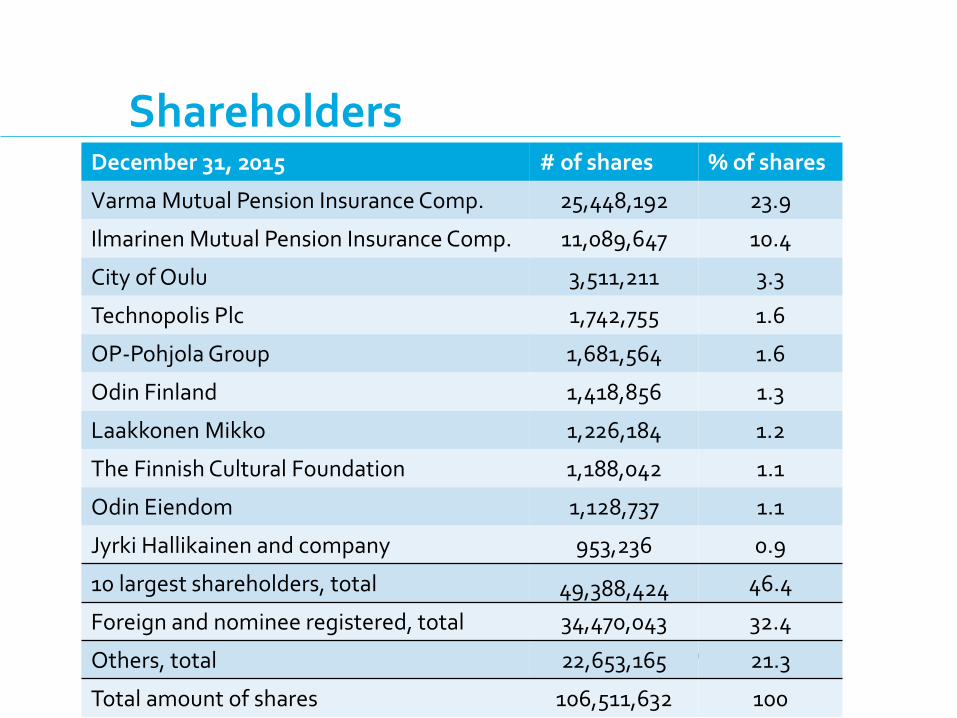
December 31, 2015 # of shares % of shares
Varma Mutual Pension Insurance Comp. 25,448,192 23.9
Ilmarinen Mutual Pension Insurance Comp. 11,089,647 10.4
City of Oulu 3,511,211 3.3
Technopolis Plc 1,742,755 1.6
OP-Pohjola Group 1,681,564 1.6
Odin Finland 1,418,856 1.3
Laakkonen Mikko 1,226,184 1.2
The Finnish Cultural Foundation 1,188,042 1.1
Odin Eiendom 1,128,737 1.1
Jyrki Hallikainen and company 953,236 0.9
10 largest shareholders, total 49,388,424 46.4
Foreign and nominee registered, total 34,470,043 32.4
Others, total 22,653,165 21.3
Total amount of shares 106,511,632 100
Shareholders
www.technopolis.fi Find us on: facebook.com/TechnopolisPlc
twitter.com/TechnopolisPlc
Thank you


![Analyst Presentation (Q3 FY2015-16) [Company Update]](https://img.pdfslide.us/doc/110x75/577ca4d41a28abea748b4871/analyst-presentation-q3-fy2015-16-company-update.jpg)


![Analyst Presentation (Q1 FY2015-16) [Company Update]](https://img.pdfslide.us/doc/110x75/577cb26f1a28aba7118c046a/analyst-presentation-q1-fy2015-16-company-update.jpg)