Embed Size (px)
Citation preview

8TH ANNUAL PARENTS, KIDS & MONEY SURVEY—COLLEGE RELATED FINDINGST. Rowe PriceAugust 2016
Detailed Results
2
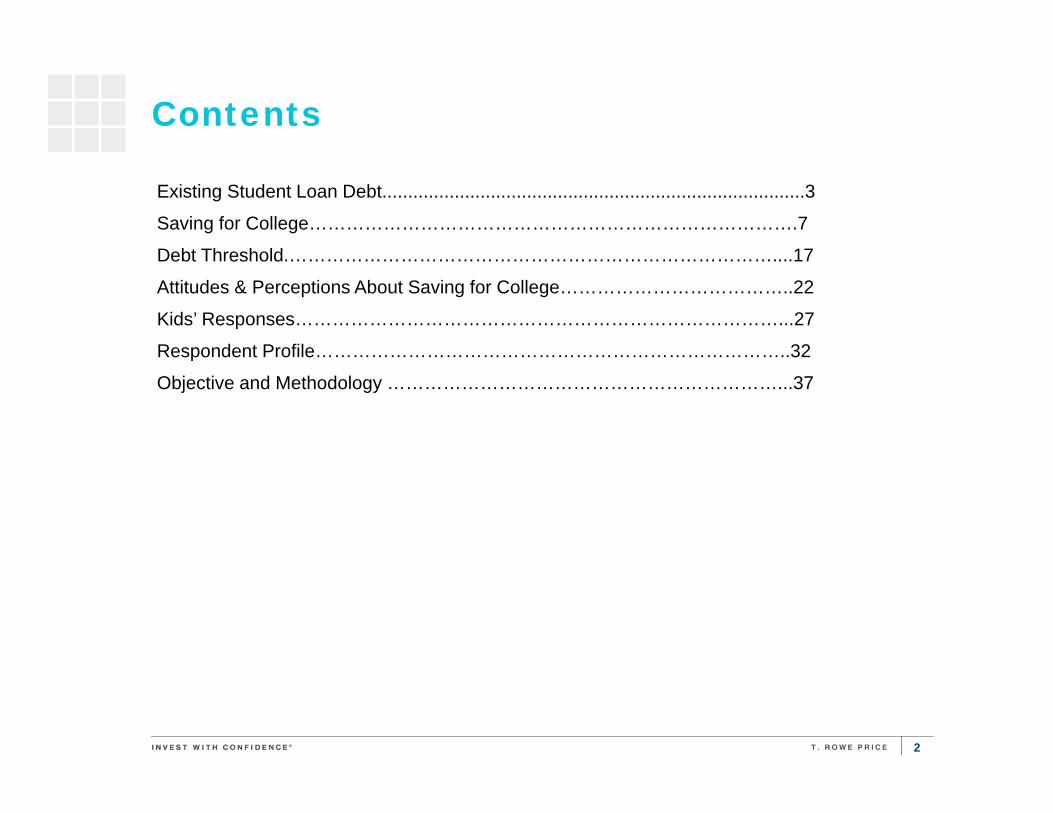
Contents
Saving for kids’
education
Existing Student Loan Debt..................................................................................3
Saving for College…………………………………………………………………….7
Debt Threshold.……………………………………………………………………....17
Attitudes & Perceptions About Saving for College………………………………..22
Kids’ Responses……………………………………………………………………...27
Respondent Profile…………………………………………………………………..32
Objective and Methodology ………………………………………………………...37
EXISTING STUDENT LOAN DEBT
4
16%
2%9%
12%
14%20%
23%
40%
48%
56%
0% 10% 20% 30% 40% 50% 60%
I don't have any debt
Other
Payday loan
Student loan (from kids' education)
Friend/relative debt
Student loan (from parents' education)
Medical debt
Car loan
Mortgage
Credit card debt
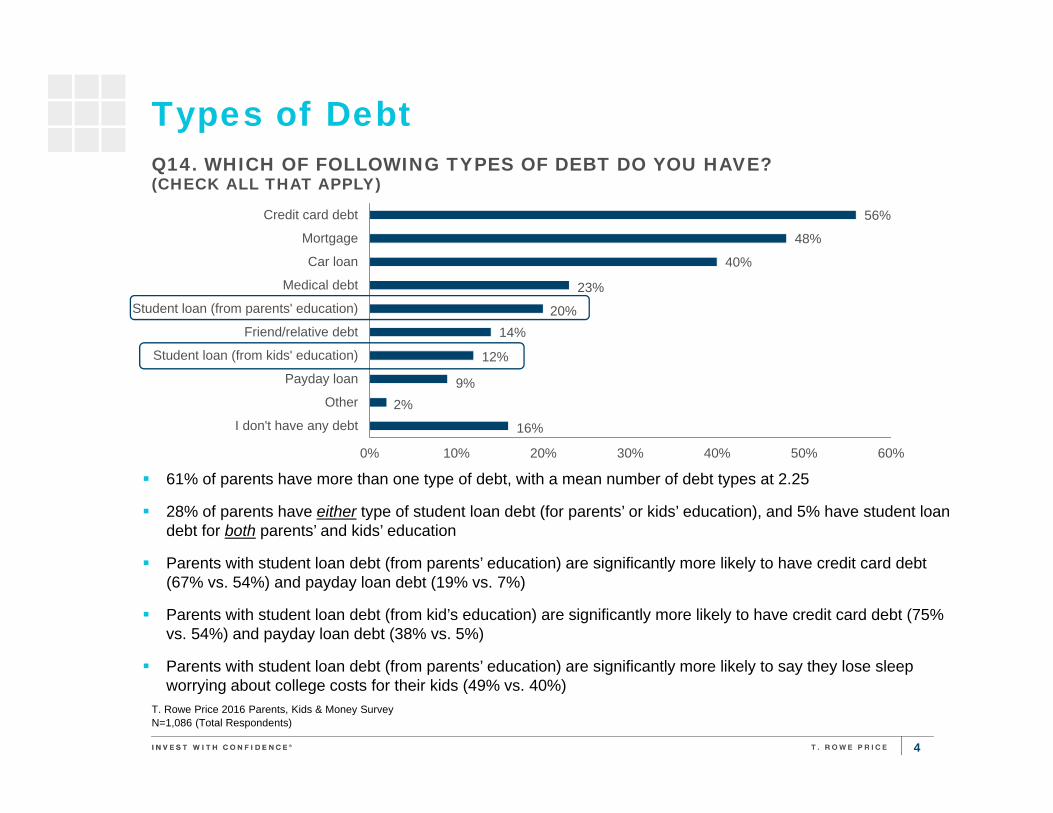
Types of Debt
T. Rowe Price 2016 Parents, Kids & Money Survey N=1,086 (Total Respondents)
Q14. WHICH OF FOLLOWING TYPES OF DEBT DO YOU HAVE?(CHECK ALL THAT APPLY)
61% of parents have more than one type of debt, with a mean number of debt types at 2.25
28% of parents have either type of student loan debt (for parents’ or kids’ education), and 5% have student loan debt for both parents’ and kids’ education
Parents with student loan debt (from parents’ education) are significantly more likely to have credit card debt (67% vs. 54%) and payday loan debt (19% vs. 7%)
Parents with student loan debt (from kid’s education) are significantly more likely to have credit card debt (75% vs. 54%) and payday loan debt (38% vs. 5%)
Parents with student loan debt (from parents’ education) are significantly more likely to say they lose sleep worrying about college costs for their kids (49% vs. 40%)
5
27%
21%
29%
23%
0% 5% 10% 15% 20% 25% 30% 35% 40%
$30,000 or more
$15,000 to $29,999
$5,000 to $14,999
Less than $5,000
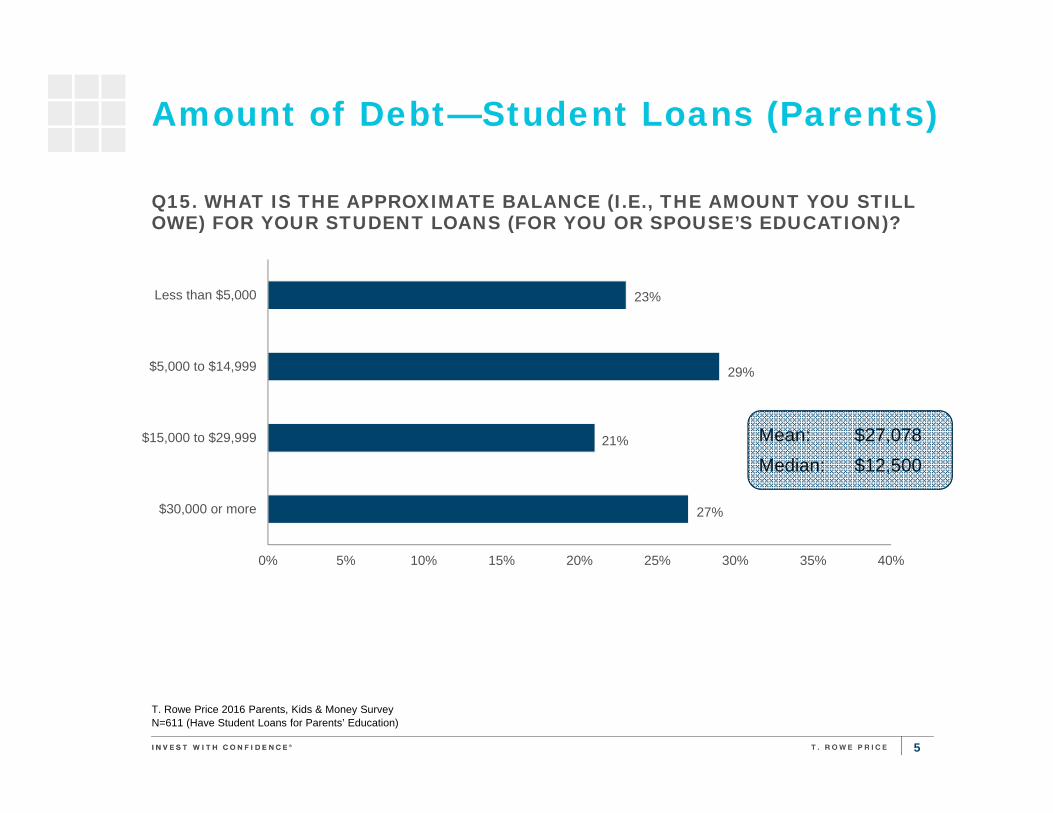
Amount of Debt—Student Loans (Parents)
T. Rowe Price 2016 Parents, Kids & Money Survey N=611 (Have Student Loans for Parents’ Education)
Q15. WHAT IS THE APPROXIMATE BALANCE (I.E., THE AMOUNT YOU STILL OWE) FOR YOUR STUDENT LOANS (FOR YOU OR SPOUSE’S EDUCATION)?
Mean: $27,078Median: $12,500

6
32%
22%
18%
27%
0% 5% 10% 15% 20% 25% 30% 35% 40%
$10,000 or more
$5,000 to $9,999
$1,000 to $4,999
Less than $1,000
Amount of Debt— Student Loans (Kids)
T. Rowe Price 2016 Parents, Kids & Money Survey N=134 (Have Student Loans for Kids’ Education)
Q15. WHAT IS THE APPROXIMATE BALANCE (I.E., THE AMOUNT YOU STILL OWE) FOR YOUR STUDENT LOANS (FOR YOUR KIDS)?
Mean: $10,768Median: $5,000

SAVING FOR COLLEGE

8
33%
67%
0% 10% 20% 30% 40% 50% 60% 70% 80%
Saving for retirement
Saving for kids' college education
Family Saving Priority
T. Rowe Price 2016 Parents, Kids & Money Survey N=1,086 (Total Respondents)
Q16. WHICH OF THE FOLLOWING IS THE HIGHER PRIORITY FOR YOU AND YOUR FAMILY?
Gender Age
Men Women Millennial Gen X Boomer
Saving for kids’ college education 70% 63% 77% 65% 57%
Saving for retirement 30% 37% 23% 35% 43%
9
5%4%
1%
4%5%
2%3%
7%1%
12%1%
4%2%2%
11%1%
3%4%
28%
0% 5% 10% 15% 20% 25% 30%
Never181716151413121110
987654321
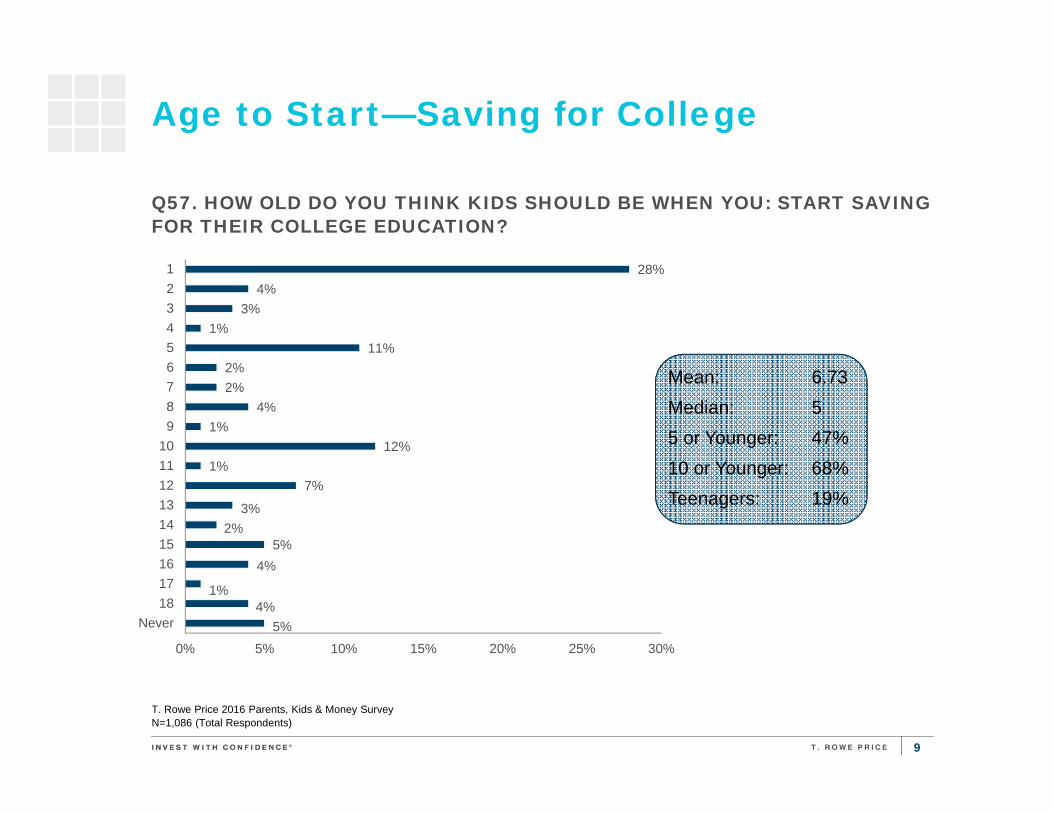
Age to Start—Saving for College
T. Rowe Price 2016 Parents, Kids & Money Survey N=1,086 (Total Respondents)
Q57. HOW OLD DO YOU THINK KIDS SHOULD BE WHEN YOU: START SAVING FOR THEIR COLLEGE EDUCATION?
Mean: 6.73Median: 55 or Younger: 47%10 or Younger: 68%Teenagers: 19%
10
17%
40%
51%
54%
58%
0% 10% 20% 30% 40% 50% 60% 70%
None of the above
Money saved for other goals
An emergency fund to cover unexpected expenses
Money saved for retirement
Money saved for kids’ college education
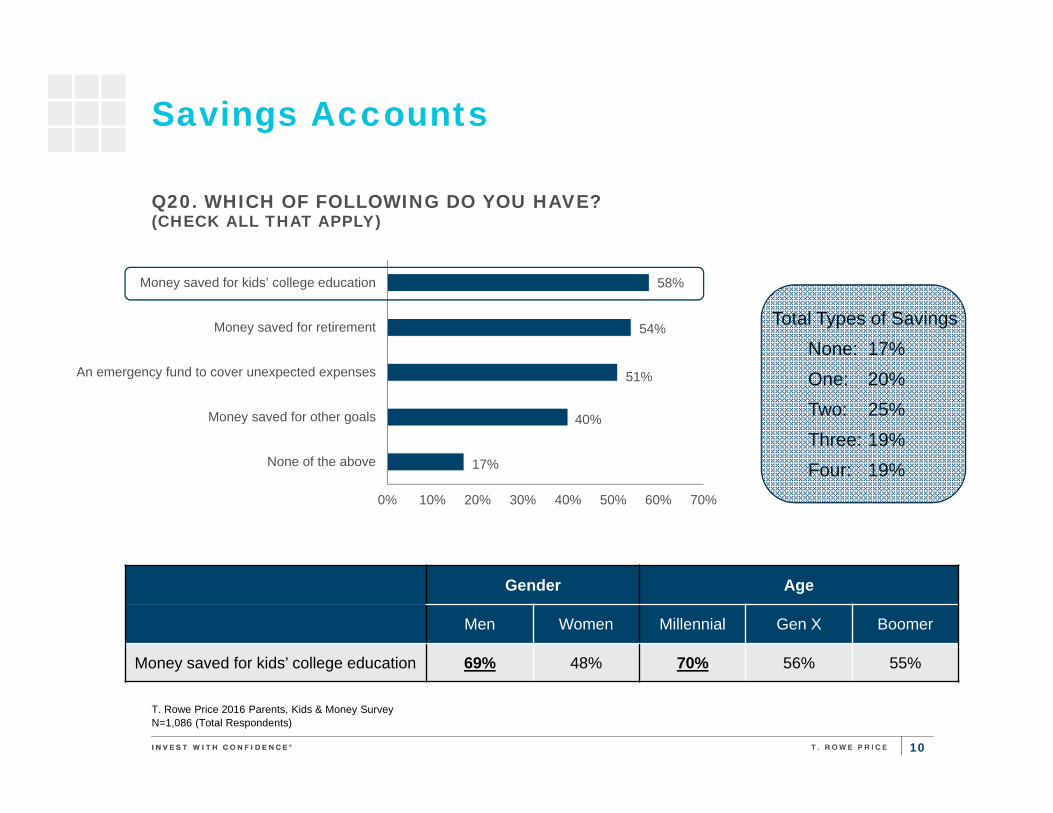
Savings Accounts
T. Rowe Price 2016 Parents, Kids & Money Survey N=1,086 (Total Respondents)
Q20. WHICH OF FOLLOWING DO YOU HAVE?(CHECK ALL THAT APPLY)
Total Types of Savings None: 17%One: 20%Two: 25%Three: 19%Four: 19%
Gender Age
Men Women Millennial Gen X Boomer
Money saved for kids’ college education 69% 48% 70% 56% 55%
11
2%
1%
5%
12%
55%
24%
0% 10% 20% 30% 40% 50% 60%
I don't contribute
Every other year
Annually
Quarterly
Monthly
Weekly
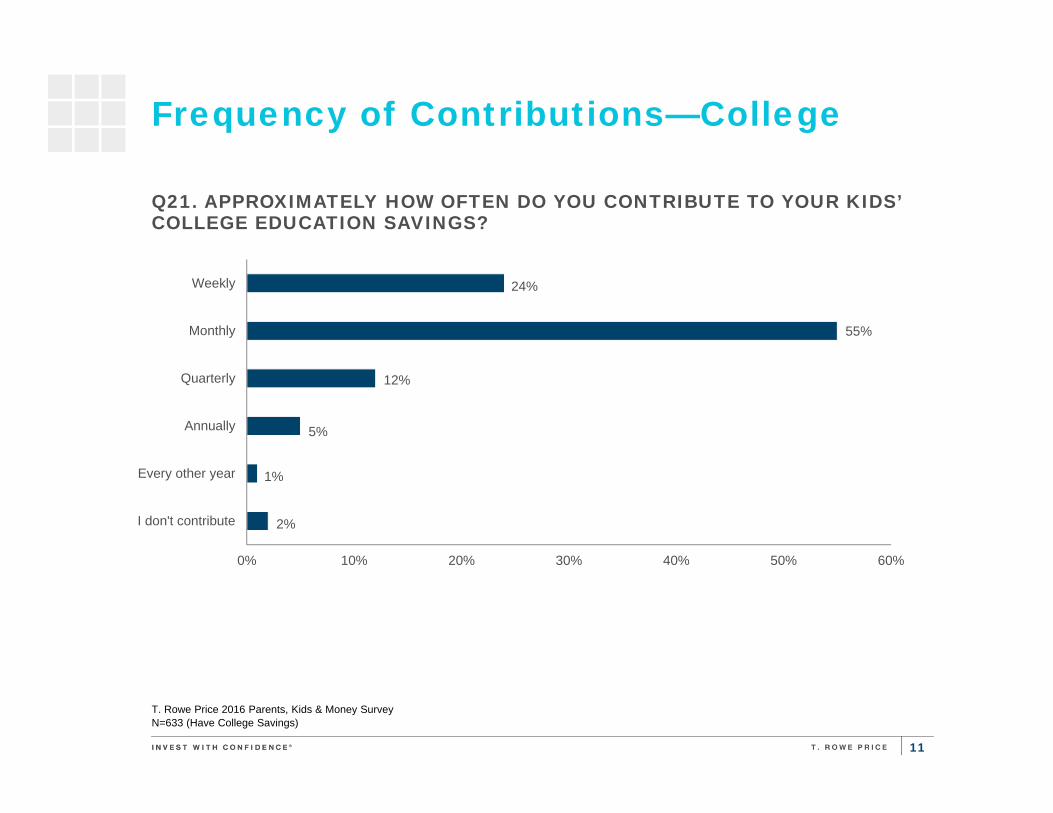
Frequency of Contributions—College
T. Rowe Price 2016 Parents, Kids & Money Survey N=633 (Have College Savings)
Q21. APPROXIMATELY HOW OFTEN DO YOU CONTRIBUTE TO YOUR KIDS’ COLLEGE EDUCATION SAVINGS?

12
College Savings Accounts
T. Rowe Price 2016 Parents, Kids & Money Survey N=628 (Have College Savings)
1%3%
9%
11%
12%13%
15%
20%21%
22%24%
37%43%
0% 5% 10% 15% 20% 25% 30% 35% 40% 45% 50%
Not sureOther
Roth IRAAnnuity or other insurance product
Traditional IRAUGMA or UTMA account
Individual securities or brokerage account401(k) plan
Certificate of deposit (CD)Checking account
Savings bond529 account
Regular savings account
Q33. WHAT TYPES OF ACCOUNTS DO YOU USE FOR COLLEGE SAVINGS?(CHECK ALL THAT APPLY)
Total # of Accounts One: 50%Two: 20%Three: 11%Four +: 19%
Mean: 2.32
Of those parents who have college savings, 37% use a 529, while 27% use a retirement account (401(k) or IRA)
Millennials are less likely than Gen Xers or Baby Boomers to use a 529 account for college savings (22% vs. 42% vs. 42%)
13
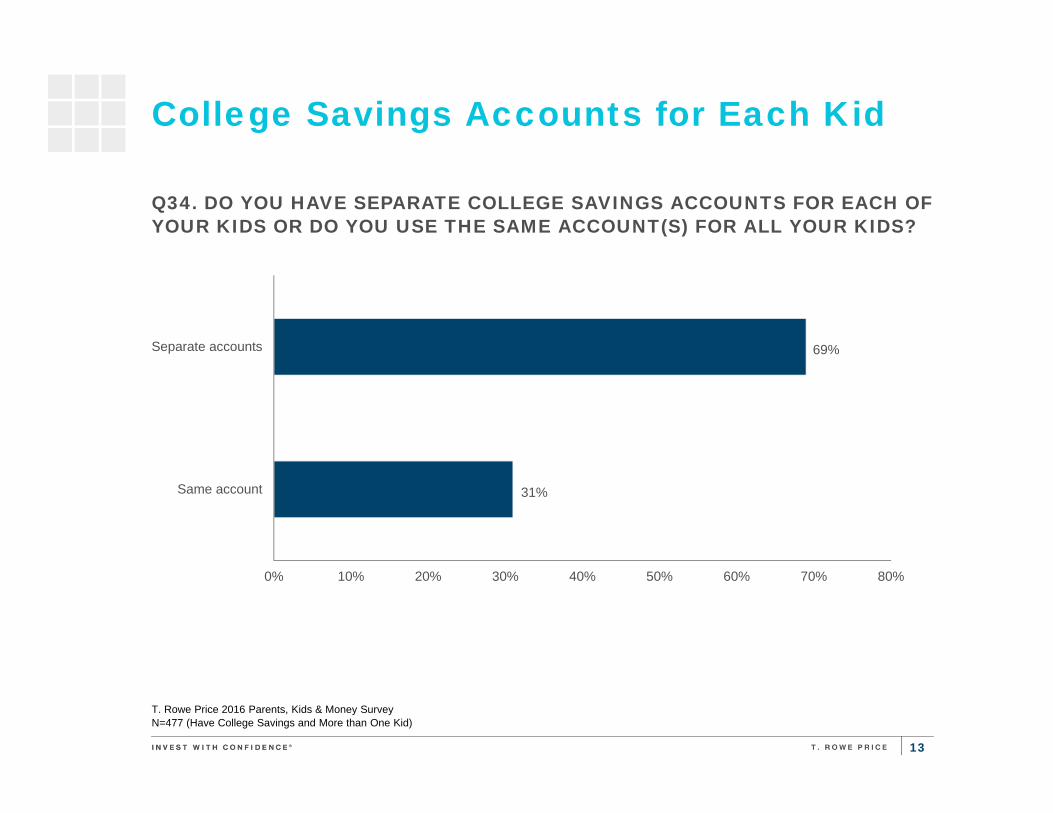
College Savings Accounts for Each Kid
T. Rowe Price 2016 Parents, Kids & Money Survey N=477 (Have College Savings and More than One Kid)
31%
69%
0% 10% 20% 30% 40% 50% 60% 70% 80%
Same account
Separate accounts
Q34. DO YOU HAVE SEPARATE COLLEGE SAVINGS ACCOUNTS FOR EACH OF YOUR KIDS OR DO YOU USE THE SAME ACCOUNT(S) FOR ALL YOUR KIDS?
14
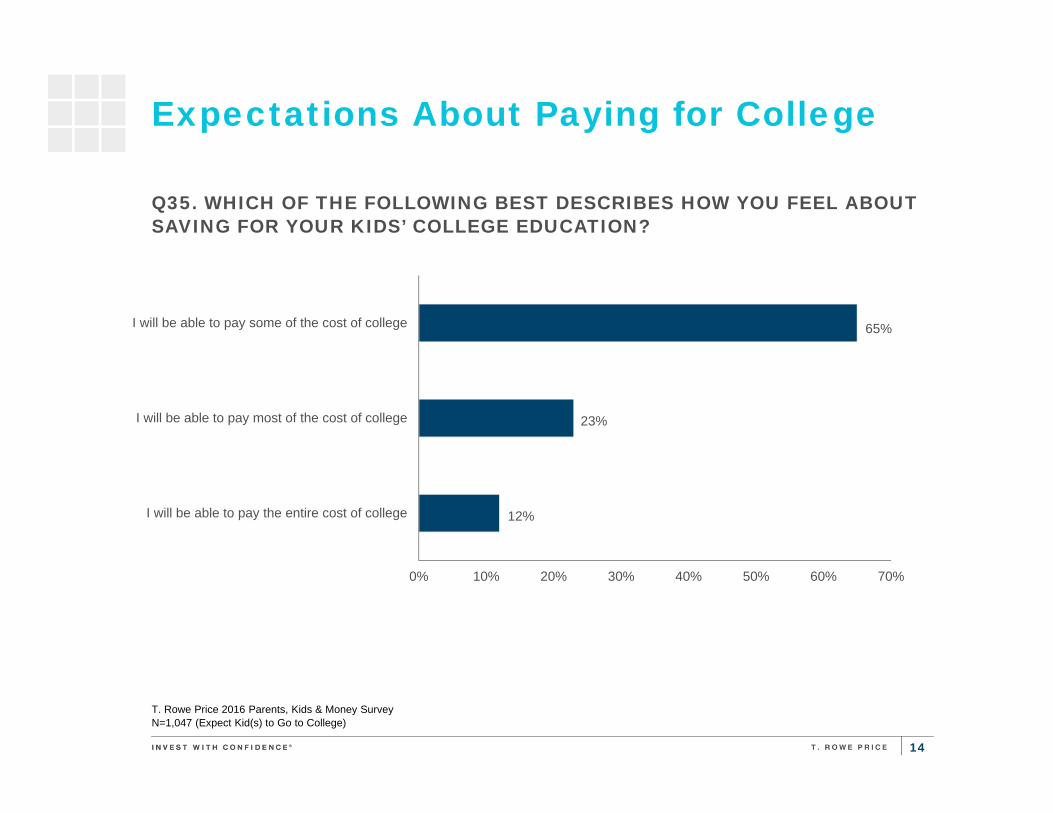
Expectations About Paying for College
T. Rowe Price 2016 Parents, Kids & Money Survey N=1,047 (Expect Kid(s) to Go to College)
12%
23%
65%
0% 10% 20% 30% 40% 50% 60% 70%
I will be able to pay the entire cost of college
I will be able to pay most of the cost of college
I will be able to pay some of the cost of college
Q35. WHICH OF THE FOLLOWING BEST DESCRIBES HOW YOU FEEL ABOUT SAVING FOR YOUR KIDS’ COLLEGE EDUCATION?
15
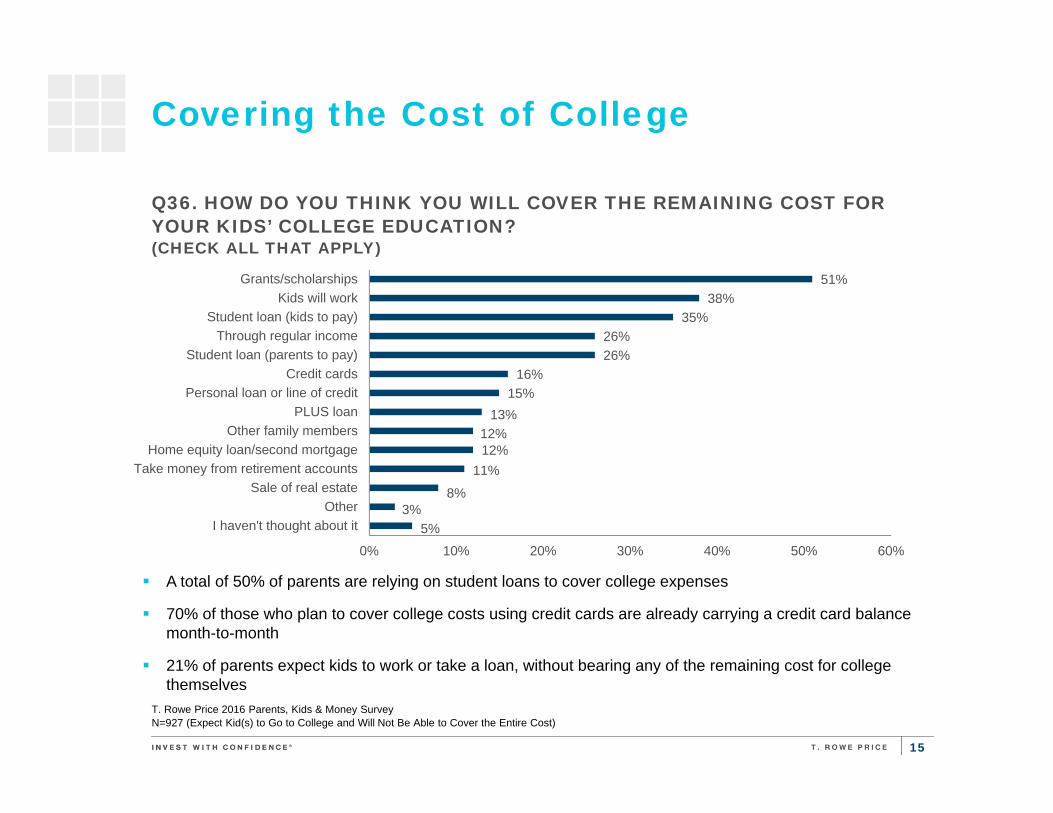
Covering the Cost of College
T. Rowe Price 2016 Parents, Kids & Money Survey N=927 (Expect Kid(s) to Go to College and Will Not Be Able to Cover the Entire Cost)
5%3%
8%
11%12%12%
13%15%
16%26%26%
35%38%
51%
0% 10% 20% 30% 40% 50% 60%
I haven't thought about itOther
Sale of real estateTake money from retirement accounts
Home equity loan/second mortgageOther family members
PLUS loanPersonal loan or line of credit
Credit cardsStudent loan (parents to pay)
Through regular incomeStudent loan (kids to pay)
Kids will workGrants/scholarships
Q36. HOW DO YOU THINK YOU WILL COVER THE REMAINING COST FOR YOUR KIDS’ COLLEGE EDUCATION?(CHECK ALL THAT APPLY)
A total of 50% of parents are relying on student loans to cover college expenses
70% of those who plan to cover college costs using credit cards are already carrying a credit card balance month-to-month
21% of parents expect kids to work or take a loan, without bearing any of the remaining cost for college themselves

16
Using Money From College Savings Accounts
T. Rowe Price 2016 Parents, Kids & Money Survey N=628 (Have College Savings)
Q37. WHICH OF THE FOLLOWING THINGS HAVE YOU PAID FOR WITH MONEY TAKEN FROM YOUR KIDS’ COLLEGE SAVINGS IN THE PAST TWO YEARS? (CHECK ALL THAT APPLY)
8%8%
10%
10%10%
11%12%
12%12%12%12%
13%13%
18%
0% 2% 4% 6% 8% 10% 12% 14% 16% 18% 20%
Down payment on a homeTo cover expenses while unemployed
WeddingReplenish emergency fund
Car purchase or repairHoliday spending
Childcare/daycareDay-to-day expenses
Home repair/renovationHealth care costs
Pay off debtTo pay taxes
VacationKids' education
Have taken money from college savings
45%
55%Yes
No(N=282)
3% of parents who have taken money out of college savings, have only done so to pay for their kids’ education
Parents who have a 529 are significantly less likely to spend college savings on other things (38% vs. 49%)

DEBT THRESHOLD

18
Paying for College—Parent Debt Threshold
T. Rowe Price 2016 Parents, Kids & Money Survey N=1,052 (Expect Kid(s) to Go to College)
8%
11%
9%
13%
16%
17%
14%
11%
0% 2% 4% 6% 8% 10% 12% 14% 16% 18%
More than $150,000
$100,000 to $150,000
$75,000 to $99,999
$50,000 to $74,999
$25,000 to $49,999
$10,000 to $24,999
Less than $10,000
None
Q38. HOW MUCH DEBT ARE YOU WILLING TO TAKE ON PERSONALLY TO PROVIDE YOUR KIDS WITH A COLLEGE EDUCATION?
Women are more likely than men to say never/less than $10,000 (21% vs. 7%), and less likely to say $50,000 to $99,999 (15% vs. 30%) and $100,000 or more (14% vs. 24%)
57% of parents are willing to take on $25,000 or more in debt to pay for the kids’ college education, with 19% willing to borrow $100,000 or more
19
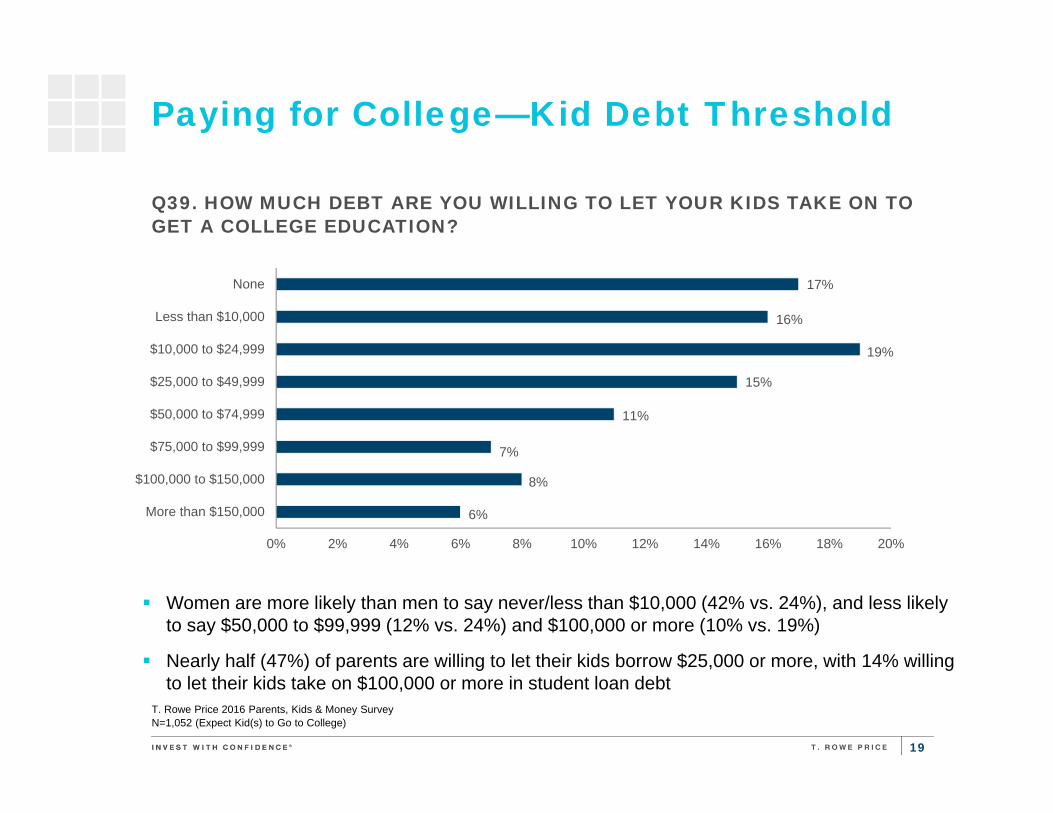
Paying for College—Kid Debt Threshold
T. Rowe Price 2016 Parents, Kids & Money Survey N=1,052 (Expect Kid(s) to Go to College)
6%
8%
7%
11%
15%
19%
16%
17%
0% 2% 4% 6% 8% 10% 12% 14% 16% 18% 20%
More than $150,000
$100,000 to $150,000
$75,000 to $99,999
$50,000 to $74,999
$25,000 to $49,999
$10,000 to $24,999
Less than $10,000
None
Q39. HOW MUCH DEBT ARE YOU WILLING TO LET YOUR KIDS TAKE ON TO GET A COLLEGE EDUCATION?
Women are more likely than men to say never/less than $10,000 (42% vs. 24%), and less likely to say $50,000 to $99,999 (12% vs. 24%) and $100,000 or more (10% vs. 19%)
Nearly half (47%) of parents are willing to let their kids borrow $25,000 or more, with 14% willing to let their kids take on $100,000 or more in student loan debt

20
Debt Threshold by Current Student Loan Debt for Parents’ Education
T. Rowe Price 2016 Parents, Kids & Money Survey N=1,052 (Expect Kid(s) to Go to College)
18%
22%
33%
27%
24%
22%
35%
19%
0% 10% 20% 30% 40%
$100,000 or more
$50,000 to $99,999
$10,000 to $49,999
Less than $10,000
Yes No
Q39. HOW MUCH DEBT ARE YOU WILLING TO LET YOURKIDS TAKE ON TO GET A COLLEGE EDUCATION?
Q38. HOW MUCH DEBT ARE YOU WILLING TO TAKE ONTO PROVIDE YOUR KIDS WITH A COLLEGE EDUCATION?
13%
19%
33%
35%
22%
15%
36%
27%
0% 10% 20% 30% 40%
$100,000 or more
$50,000 to $99,999
$10,000 to $49,999
Less than $10,000
Have Parental Student Loans
= Statistically significant - .05 level
Parents who currently have student loan debt (for their education or their spouse’s) are willing to take on higher levels of debt to pay for their kids’ college education

21
Debt Threshold by Current Student Loan Debt for Kids’ Education
T. Rowe Price 2016 Parents, Kids & Money Survey N=1,052 (Expect Kid(s) to Go to College)
16%
20%
36%
28%
38%
37%
21%
4%
0% 10% 20% 30% 40%
$100,000 or more
$50,000 to $99,999
$10,000 to $49,999
Less than $10,000
Yes No
Q39. HOW MUCH DEBT ARE YOU WILLING TO LET YOURKIDS TAKE ON TO GET A COLLEGE EDUCATION?
Q38. HOW MUCH DEBT ARE YOU WILLING TO TAKE ONTO PROVIDE YOUR KIDS WITH A COLLEGE EDUCATION?
12%
16%
35%
37%
31%
37%
27%
6%
0% 10% 20% 30% 40%
$100,000 or more
$50,000 to $99,999
$10,000 to $49,999
Less than $10,000
Have Kid Student Loans
= Statistically significant - .05 level
Parents who currently have student loan debt (for their kids’ education) are willing to take on higher levels of debt to pay for their kids’ college education
ATTITUDES & PERCEPTIONS ABOUT SAVING FOR COLLEGE

23
Attitudes About College
T. Rowe Price 2016 Parents, Kids & Money Survey N=1,052 (Expect Kid(s) to Go to College)
35%
40%
42%
50%
63%
68%
69%
71%
76%
81%
0% 20% 40% 60% 80% 100%
College isn’t worth the expense
I don’t use a 529 for college savings because then I won’t be eligible for financial aid
I lose sleep worrying about college costs
If I pay for my kids’ college, I expect them to help me in retirement
I feel guilty that I won’t be able to pay more for their college
I’d be willing to get a second or part time job to pay for my kids’ college education
Because my kids will go to college before I retire, I feel like I should put moneytowards that first and save for retirement after
I would consider sending my kids to a less expensive college to avoid taking onstudent loans
I’d be willing to delay my retirement to pay for my kids’ college education
I think nearly all students graduate from college with student loans
Q41. HOW MUCH DO YOU AGREE OR DISAGREE WITH THE FOLLOWING STATEMENTS?(DISPLAYING PERCENT THAT AGREE)
42% of parents lose sleep worrying about college costs, which is up from 28% when the same question was asked in 2014
24
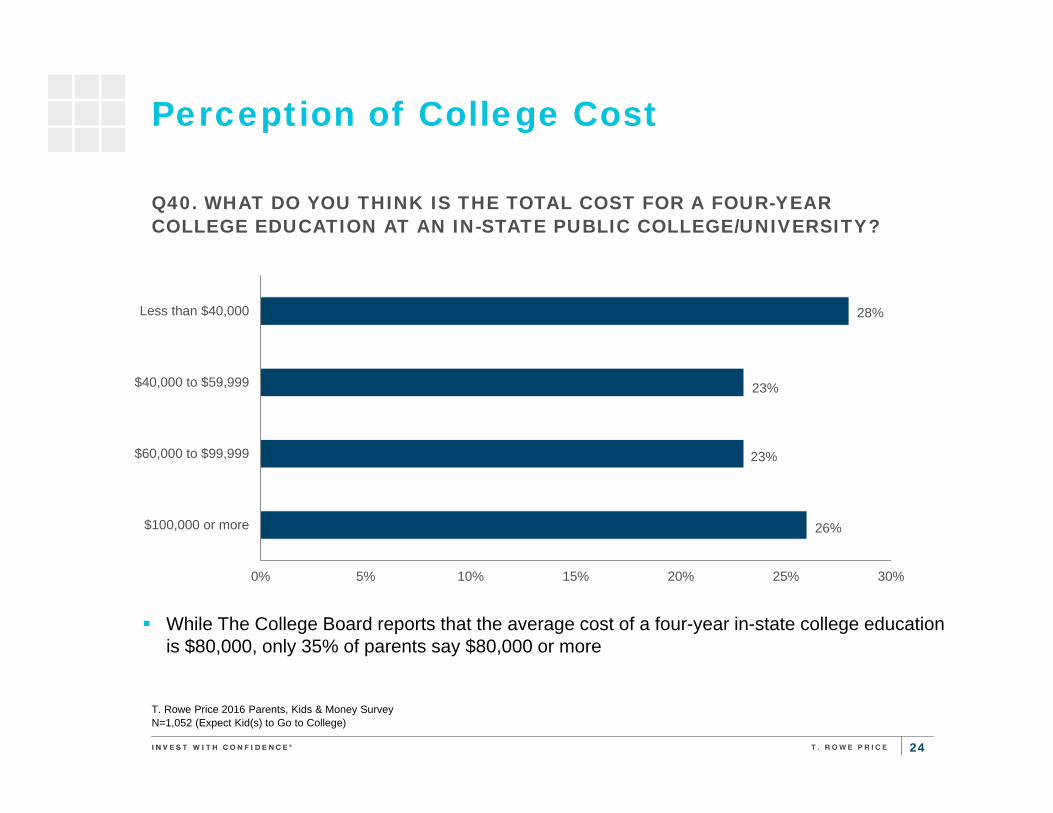
Perception of College Cost
T. Rowe Price 2016 Parents, Kids & Money Survey N=1,052 (Expect Kid(s) to Go to College)
26%
23%
23%
28%
0% 5% 10% 15% 20% 25% 30%
$100,000 or more
$60,000 to $99,999
$40,000 to $59,999
Less than $40,000
Q40. WHAT DO YOU THINK IS THE TOTAL COST FOR A FOUR-YEAR COLLEGE EDUCATION AT AN IN-STATE PUBLIC COLLEGE/UNIVERSITY?
While The College Board reports that the average cost of a four-year in-state college education is $80,000, only 35% of parents say $80,000 or more

25
Understanding of College Saving
T. Rowe Price 2016 Parents, Kids & Money Survey N=1,086 (Total Respondents)
21%
30%
38%
42%
45%
48%
53%
70%
0% 20% 40% 60% 80%
There are no penalties to withdraw money from a 529 college savings plan when it willnot be used for education
You cannot save for multiple children within the same 529 college savings plan
Stocks are generally less risky investments than bonds
I lose any money left in a 529 college savings plan if my child doesn’t go to college or if there’s money left over when they finish
A 50-year-old shouldn’t put any of their retirement money in stocks because stocks can lose money
Having an emergency fund to cover one or two months living expenses is sufficient
If I save 6% of my income towards retirement each year, I’ll have enough money to comfortably retire at age 65
What investments you choose (e.g., what stock, bond, or mutual fund) matters more thanhow much money you invest
Q62. PLEASE INDICATE WHETHER EACH OF THE FOLLOWING STATEMENTS IS TRUE OR FALSE
PERCENT OF PARENTS WHO INCORRECTLY BELIEVE:

26
Understanding of College Saving
T. Rowe Price 2016 Parents, Kids & Money Survey N=1,086 (Total Respondents)
43%
57%
0% 10% 20% 30% 40% 50% 60%
False
True
Q62. PLEASE INDICATE WHETHER EACH OF THE FOLLOWING STATEMENTS IS TRUE OR FALSE: CONTRIBUTING TO A 529 COLLEGE SAVINGS PLAN WILL DEFINITELY IMPACT YOUR ABILITY TO GET FINANCIAL AID FOR COLLEGE LATER
KIDS’ RESPONSES

28
24%
9%
67%
0% 10% 20% 30% 40% 50% 60% 70% 80%
I don't know
No
Yes
Knowledge of Parental College Savings
T. Rowe Price 2016 Parents, Kids & Money Survey N=1,086 (Total Respondents)
Q83. DO YOUR PARENTS SAVE MONEY SO YOU CAN GO TO COLLEGE?
Of the 67% of kids who think their parents are saving for college, 77% have parents who indicated they are saving, while 23% of kids have parents who indicated that they are not saving for college
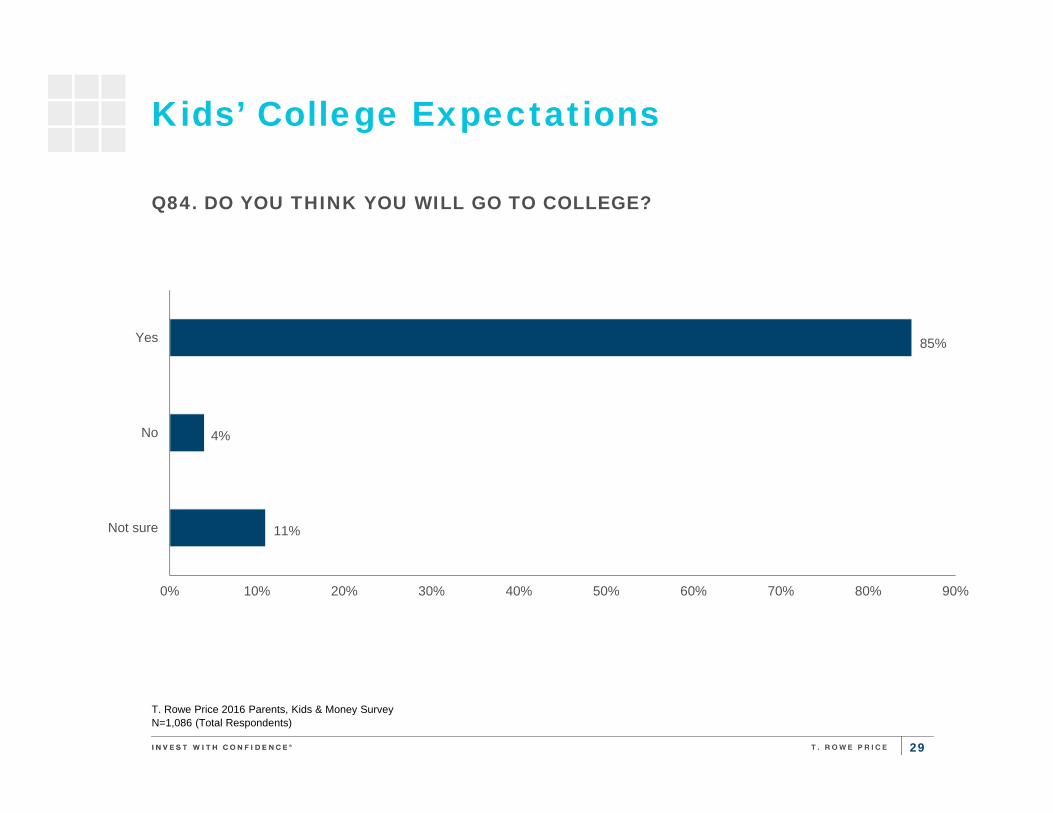
29
11%
4%
85%
0% 10% 20% 30% 40% 50% 60% 70% 80% 90%
Not sure
No
Yes
Kids’ College Expectations
T. Rowe Price 2016 Parents, Kids & Money Survey N=1,086 (Total Respondents)
Q84. DO YOU THINK YOU WILL GO TO COLLEGE?

30
Kid Agree Statements
T. Rowe Price 2016 Parents, Kids & Money Survey N=1,086 (Total Respondents)
41%
43%
57%
62%
78%
0% 20% 40% 60% 80% 100%
I’ve lied to my parents about what I’ve spent money on
I sometimes feel ashamed that I have less than most of the other kids
I expect my parents to buy me what I want
I expect my parents to cover the cost for whatever college I want to go to
I would consider going to a less expensive college to avoid taking on student loans
Q89. HOW MUCH DO YOU AGREE OR DISAGREE WITH THE FOLLOWING STATEMENTS?(DISPLAYING PERCENT THAT AGREE)
61% of kids whose parents say they will not be able to cover the entire cost of college say that they expect their parents to cover the cost for whatever college they want to attend

31
Knowledge-Based Kids Questions
T. Rowe Price 2016 Parents, Kids & Money Survey N=1,086 (Total Respondents)
80%
85%
0% 20% 40% 60% 80% 100%
My parents should save for college in a savings account
It costs more to go to college than it does to buy a car
Q95. PLEASE INDICATE WHETHER EACH OF THE FOLLOWING STATEMENTS IS TRUE OR FALSE.(DISPLAYING PERCENT SAYING TRUE)

RESPONDENT PROFILE

33
49%51%
Respondent Profile
26%
25%
25%
24%
South
Northeast
West
Midwest
Q2. REGIONQ1. AGE Q3. GENDER
MenWomen
Q5. HHI
76%
11%
9%
4%
1%
Married
Separated/divorced
Single
Married (same sex)
Widow/Widower
Q4. MARITAL STATUS
29%
58%
13%
< 35
35–50
51 +
30%
38%
32%
< $50K
$50K–$99,999
$100K +
74%
16%
9%
5%
2%
White/Caucasian
Hispanic/Latino
Black/AfricanAmerican
Asian
Native American
Q6. RACE/ETHNICITY
T. Rowe Price 2016 Parents, Kids & Money SurveyN=1,086 (Parents: Total respondents)
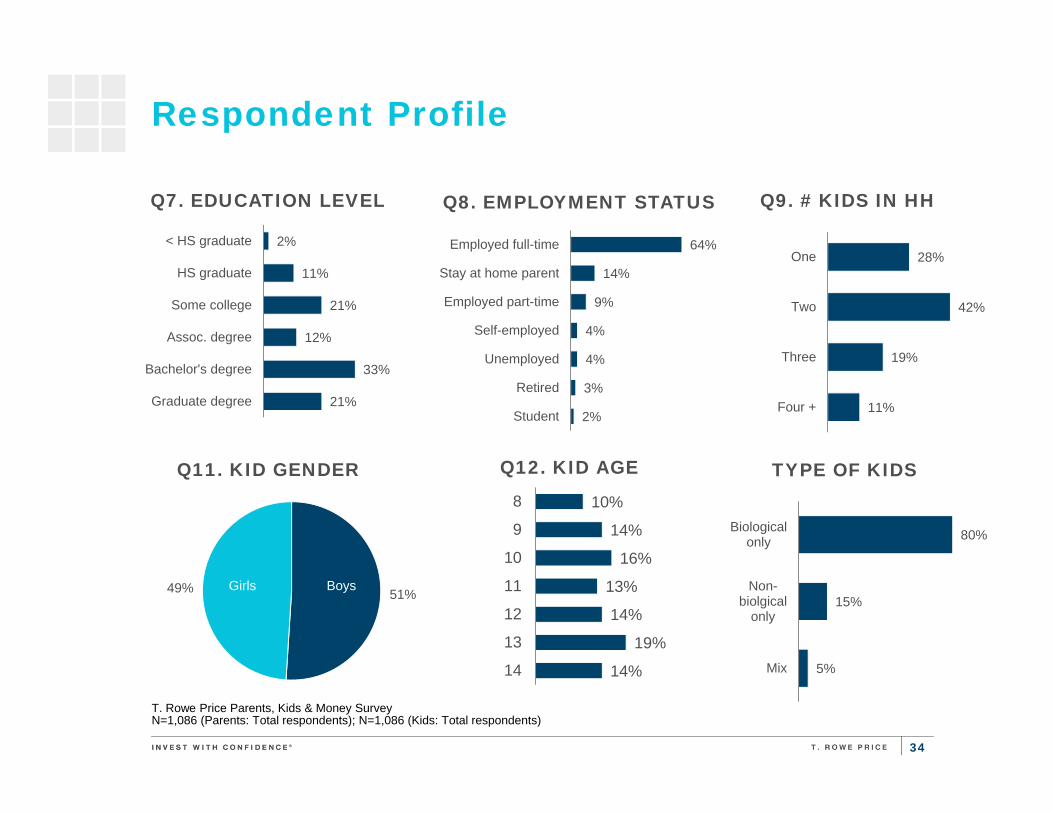
34
Respondent Profile
Q7. EDUCATION LEVEL
64%
14%
9%
4%
4%
3%
2%
Employed full-time
Stay at home parent
Employed part-time
Self-employed
Unemployed
Retired
Student
Q8. EMPLOYMENT STATUS
2%
11%
21%
12%
33%
21%
< HS graduate
HS graduate
Some college
Assoc. degree
Bachelor's degree
Graduate degree
28%
42%
19%
11%
One
Two
Three
Four +
Q9. # KIDS IN HH
51%49%
Q11. KID GENDER
BoysGirls
Q12. KID AGE
10%
14%
16%
13%
14%
19%
14%
8
9
10
11
12
13
14
T. Rowe Price Parents, Kids & Money SurveyN=1,086 (Parents: Total respondents); N=1,086 (Kids: Total respondents)
80%
15%
5%
Biologicalonly
Non-biolgical
only
Mix
TYPE OF KIDS
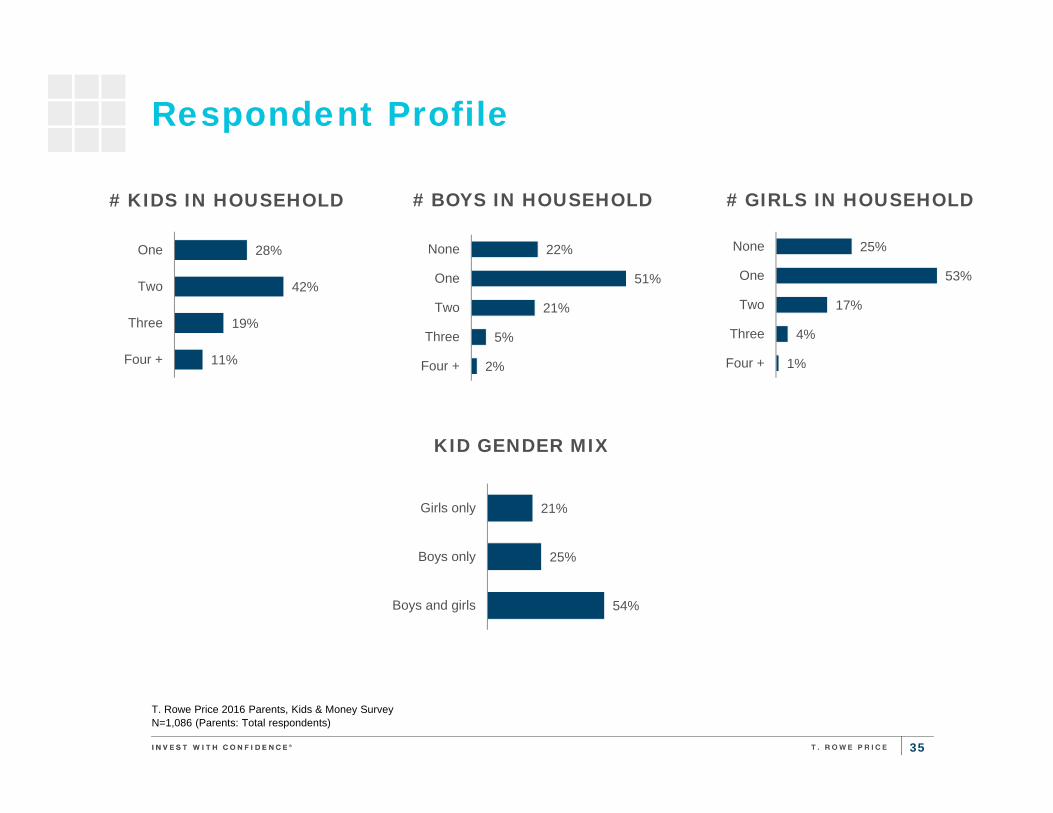
35
Respondent Profile
25%
53%
17%
4%
1%
None
One
Two
Three
Four +
# BOYS IN HOUSEHOLD# KIDS IN HOUSEHOLD
KID GENDER MIX
28%
42%
19%
11%
One
Two
Three
Four +
21%
25%
54%
Girls only
Boys only
Boys and girls
T. Rowe Price 2016 Parents, Kids & Money SurveyN=1,086 (Parents: Total respondents)
# GIRLS IN HOUSEHOLD
22%
51%
21%
5%
2%
None
One
Two
Three
Four +

36
Respondent Profile
75%
22%
3%
None
One
Two +
# KIDS 8-14 IN HH# KIDS < 8 IN HH
KID AGE MIX
25%
53%
42%
19%
11%
None
One
Two
Three
Four +
29%
52%
3%
16%
8-14 only
8-14 and younger
8-14 and older
8-14 and both
T. Rowe Price 2016 Parents, Kids & Money SurveyN=1,086 (Parents: Total respondents)
# KIDS > 14 IN HH
63%
30%
6%
1%
One
Two
Three
Four +

OBJECTIVE & METHODOLOGY
38
Objective and Methodology
Objective
To understand the basic financial knowledge, attitudes, and behaviors of both parents of children ages 8-14 and their children ages 8-14.
Methodology
T. Rowe Price commissioned an online survey of parents of children ages 8-14 and their children ages 8-14.
The survey was fielded from 2/4/16 to 2/11/16, with parent quotas of approximately 50% men and 50% women.
A total of 1,086 parents and children ages 8-14 in the U.S. participated; the sampling error for a sample of 1,086 is +/- 3% at the 95% confidence interval.
The survey was fielded through MetrixLab, Inc.
T. Rowe Price 2016 Parents, Kids & Money Survey

THANK YOU.
CQPDJEJ5E