Embed Size (px)
Citation preview

WORLD WHEAT Source: US Wheat Associates monthly supply and demand report, found on
their website: http://www.uswheat.org/
The World Wheat Market
Year
Production
Consumption
Surplus (shortfall)
10/11 11/12 12/13
652 696 653
655 695 678*
-3 1 -25
0 1
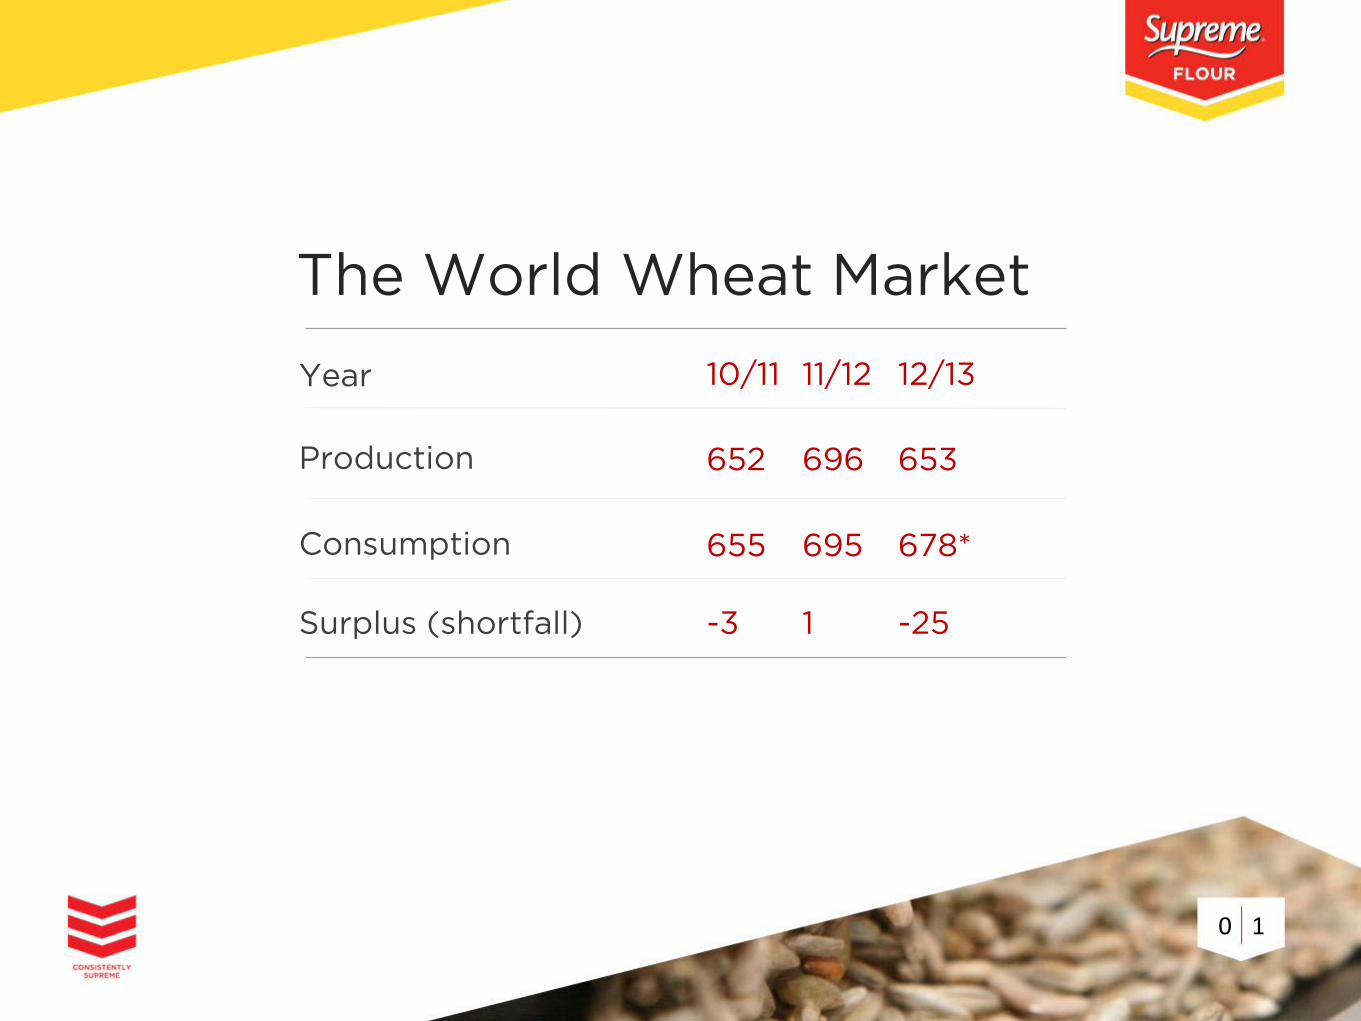
Major Users of Wheat
China 117 million tons per annum
India 90 million tons per annum
South Africa
0 2
3,20 million tons per annum,
including exports to our
African neighbors - not really a factor
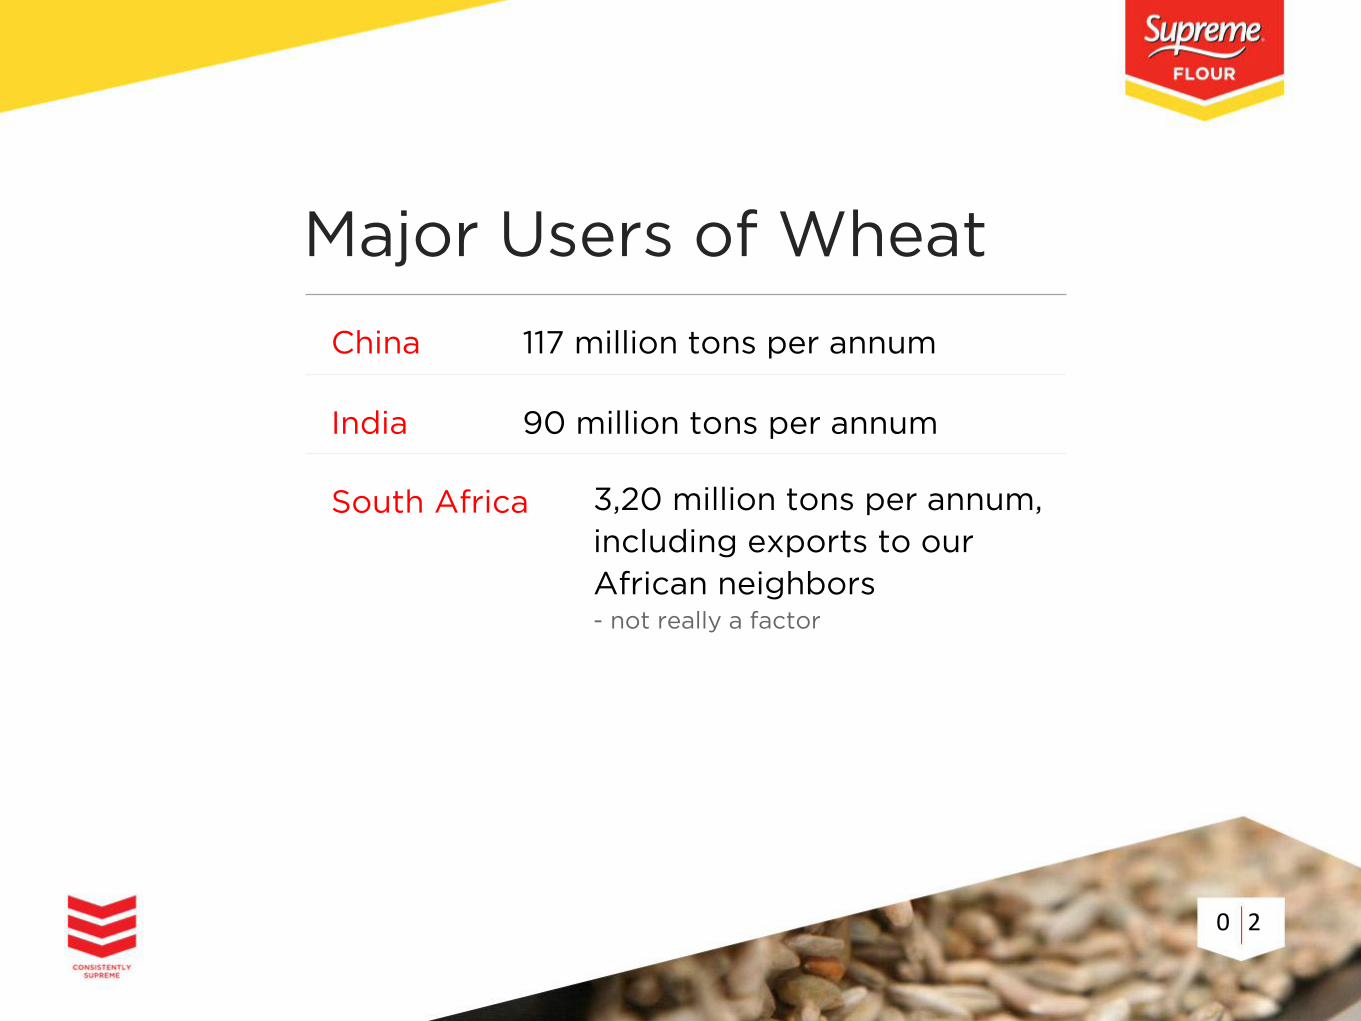
World Production and Use
0 3
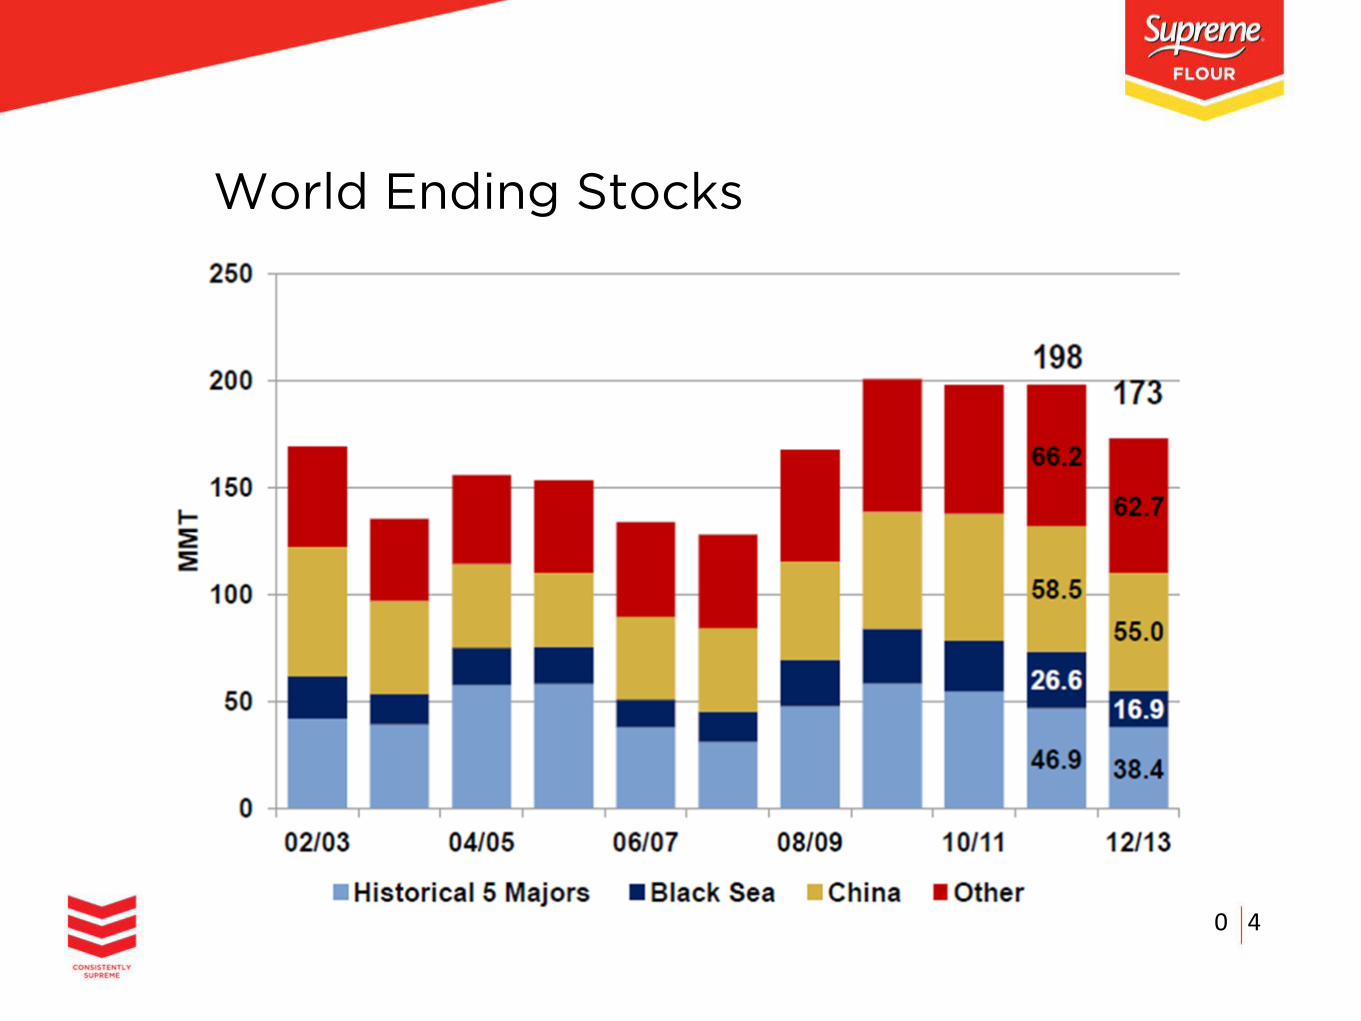
World Ending Stocks
0 4
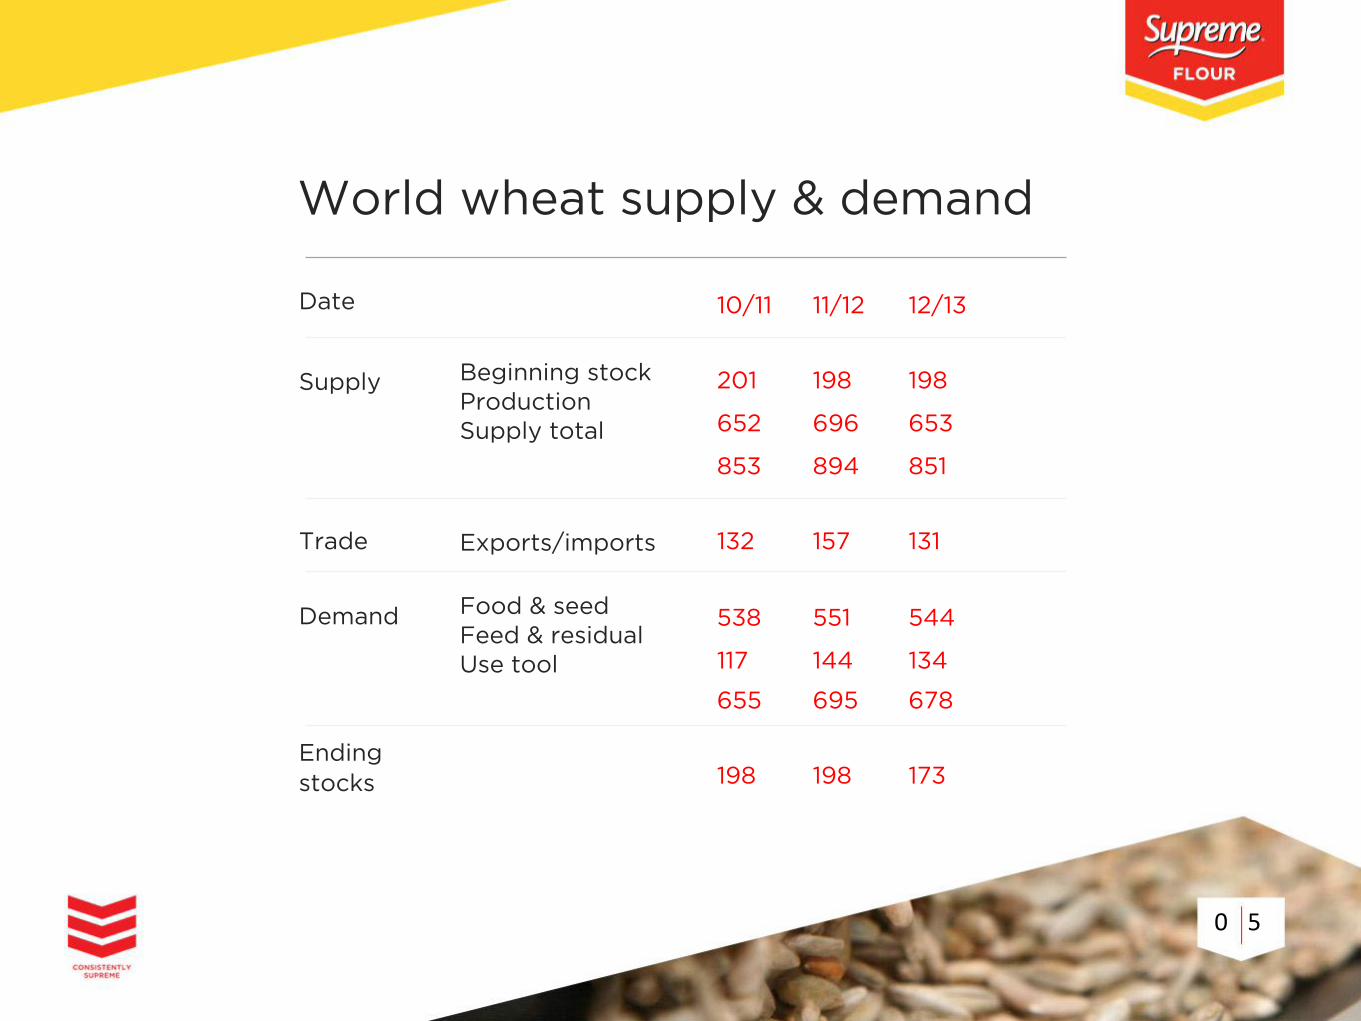
World wheat supply & demand
Date 10/11 11/12 12/13
Supply
Trade
Demand
Ending
stocks
201 198 198
652 696 653
853 894 851
132 157 131
538 551 544
117 144 134
655 695 678
198 198 173
Exports/imports
Beginning stock Production Supply total
Food & seed Feed & residual Use tool
0 5
Wheat Expectations
World wheat ending stocks for 2012/13 are forecast to decline by 12,6% to 173
million tons. China’s ending stock is 55 million tons accounting for 31,8% of
total world stocks.
Total world wheat consumption is expected to decrease by (-2,4%) and by a
large 7% in the feed market due to the high prices and smaller availability (-10
million tons).
Black Sea wheat production has declined to an estimated 78 million tons
from 114 million tons in 2011/12 due to adverse growing weather.
World wheat production is forecast to decrease to 653 million tons in
2012/13, down significantly from the record 696 million tons in 2011/12 but
still above the 652 million tons of 2010/11.
Global stocks to usage ratio expected to fall to 26%.
0 6
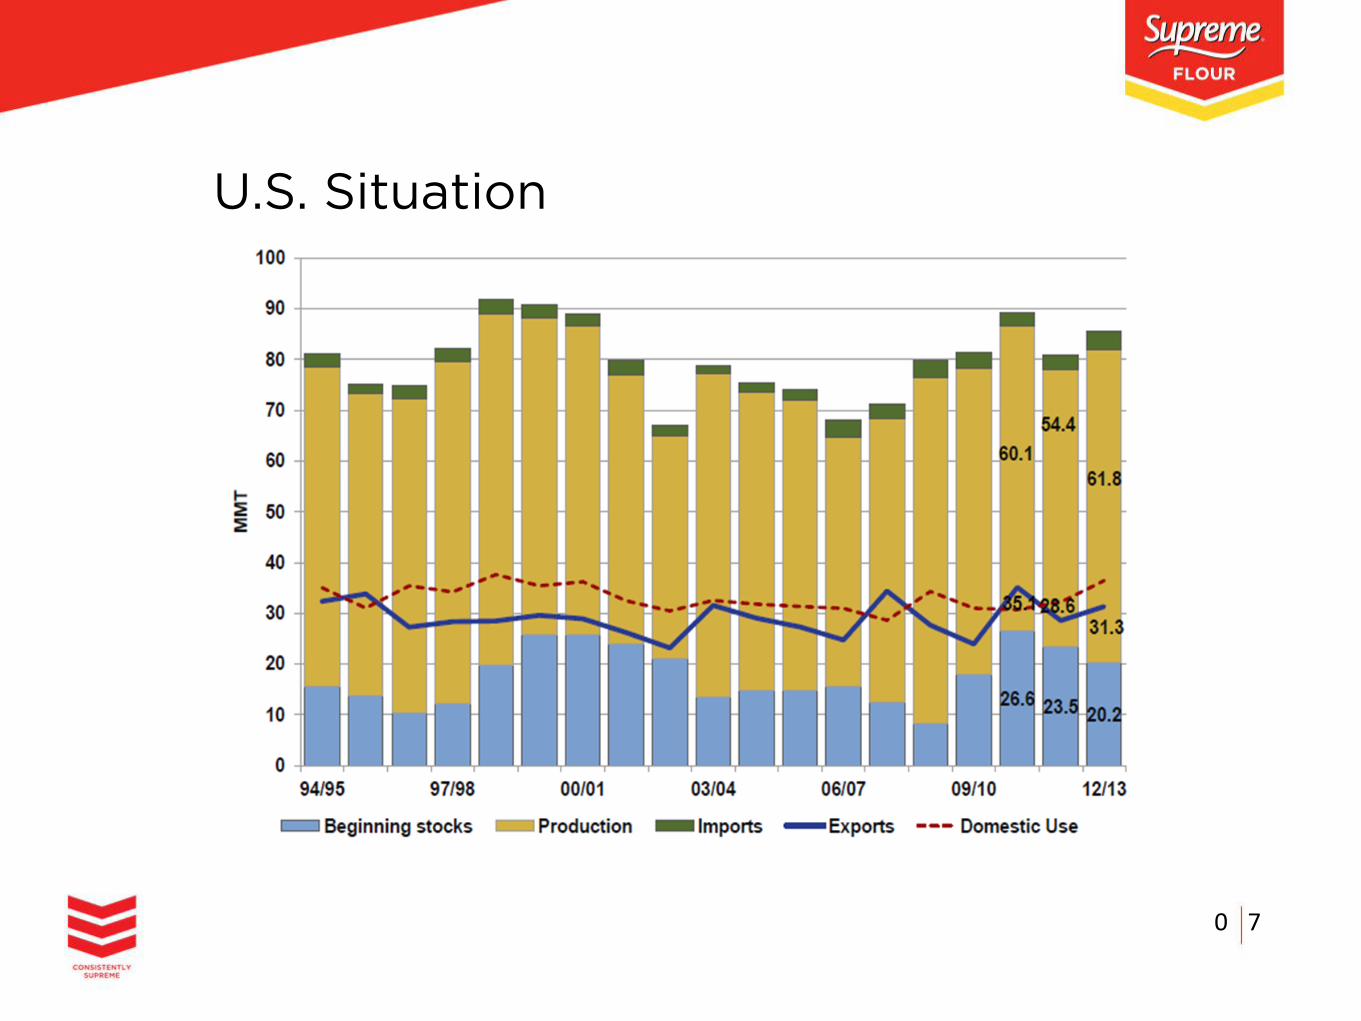
U.S. Situation
0 7
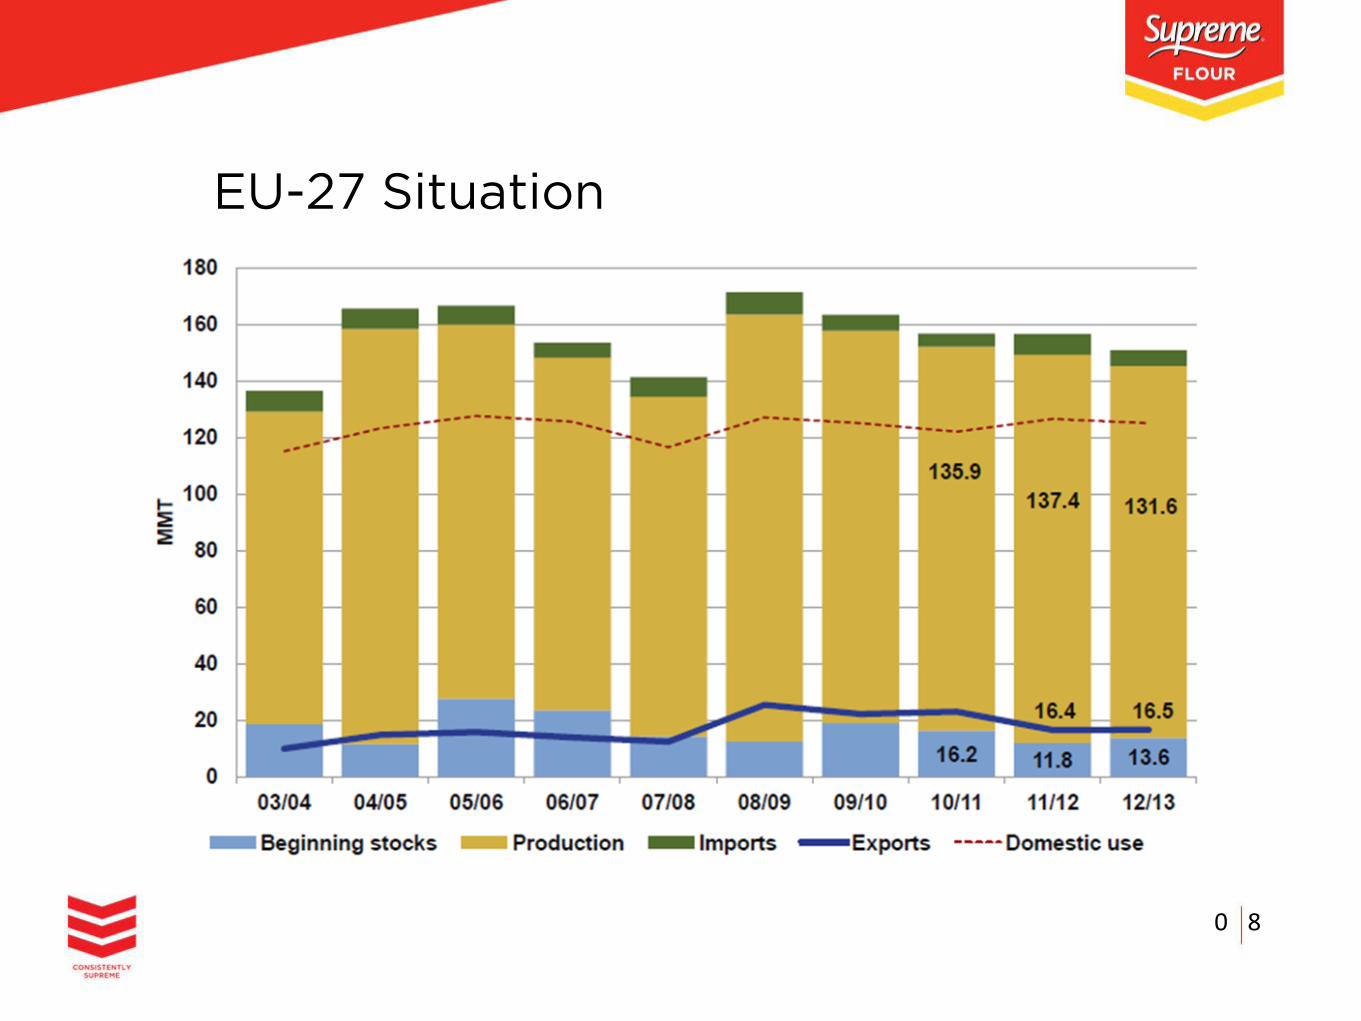
EU-27 Situation
0 8
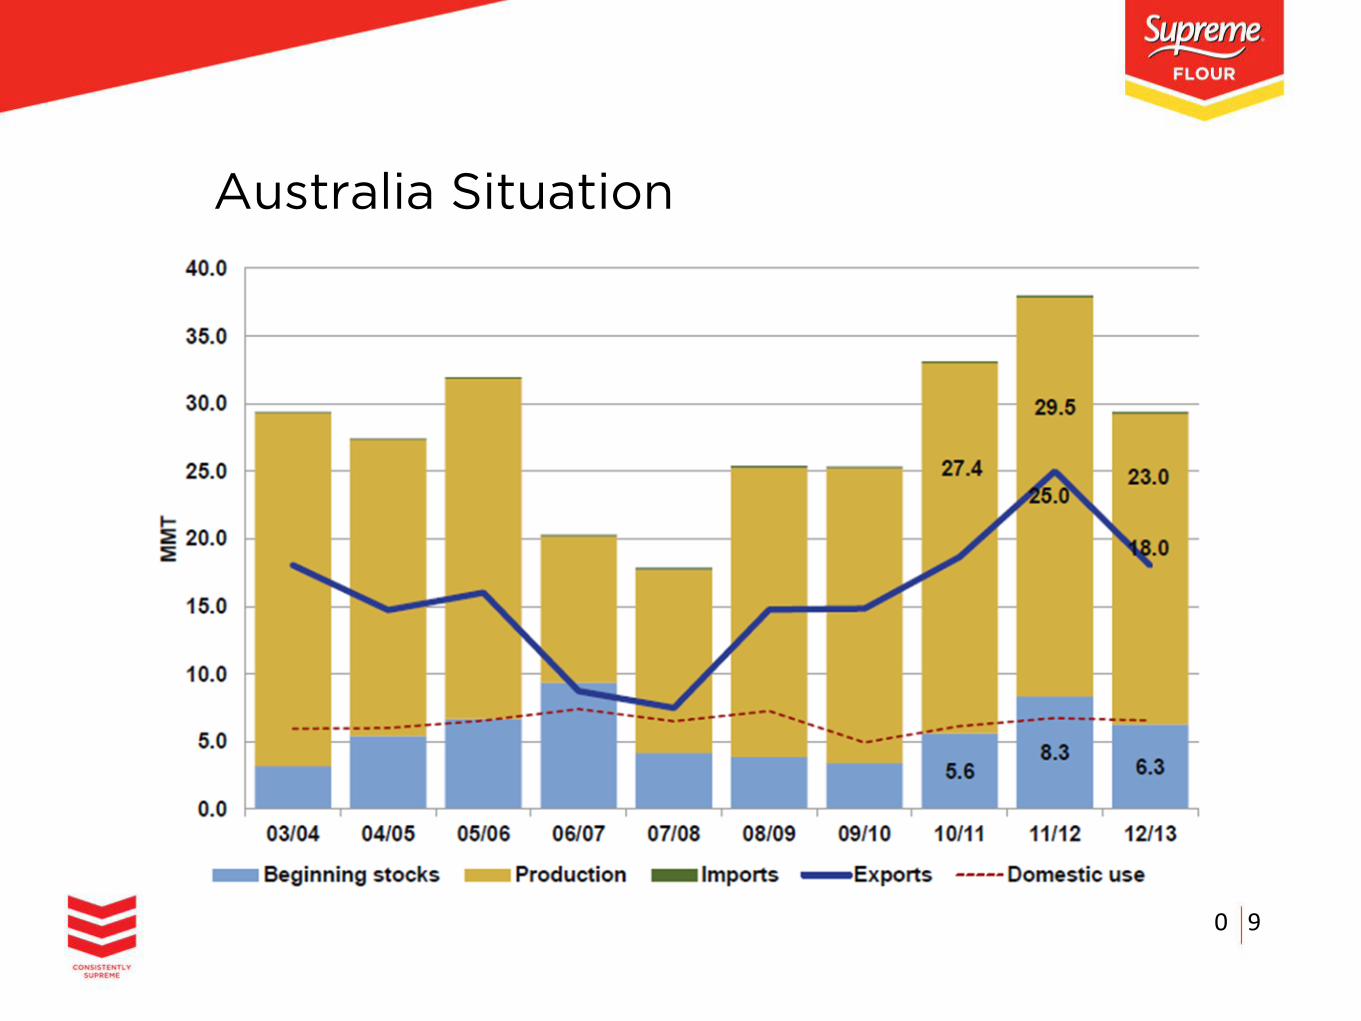
Australia Situation
0 9
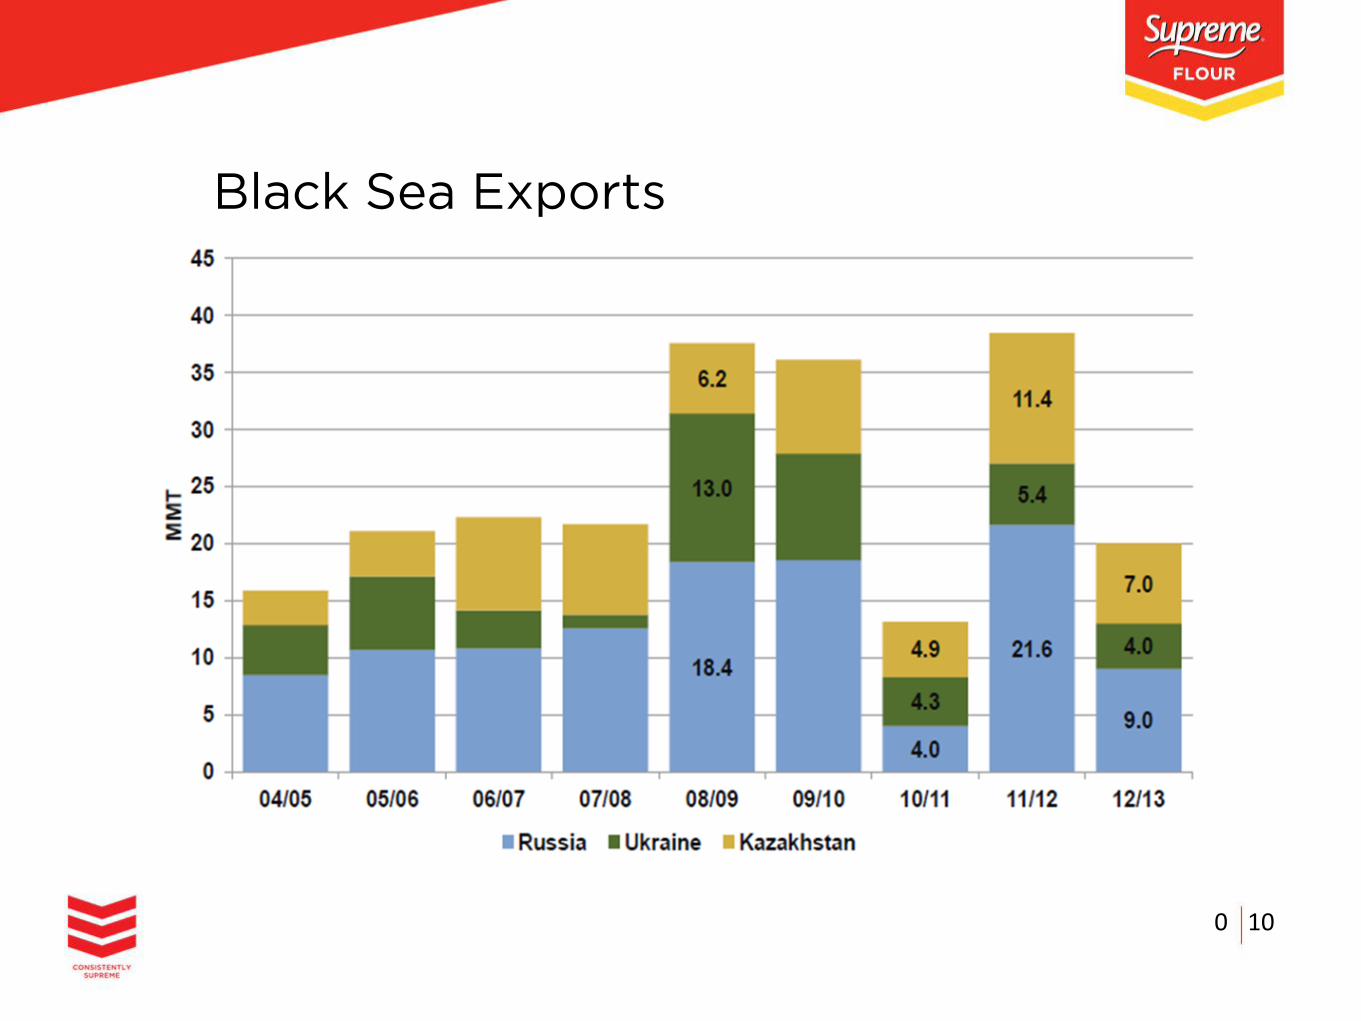
Black Sea Exports
0 10
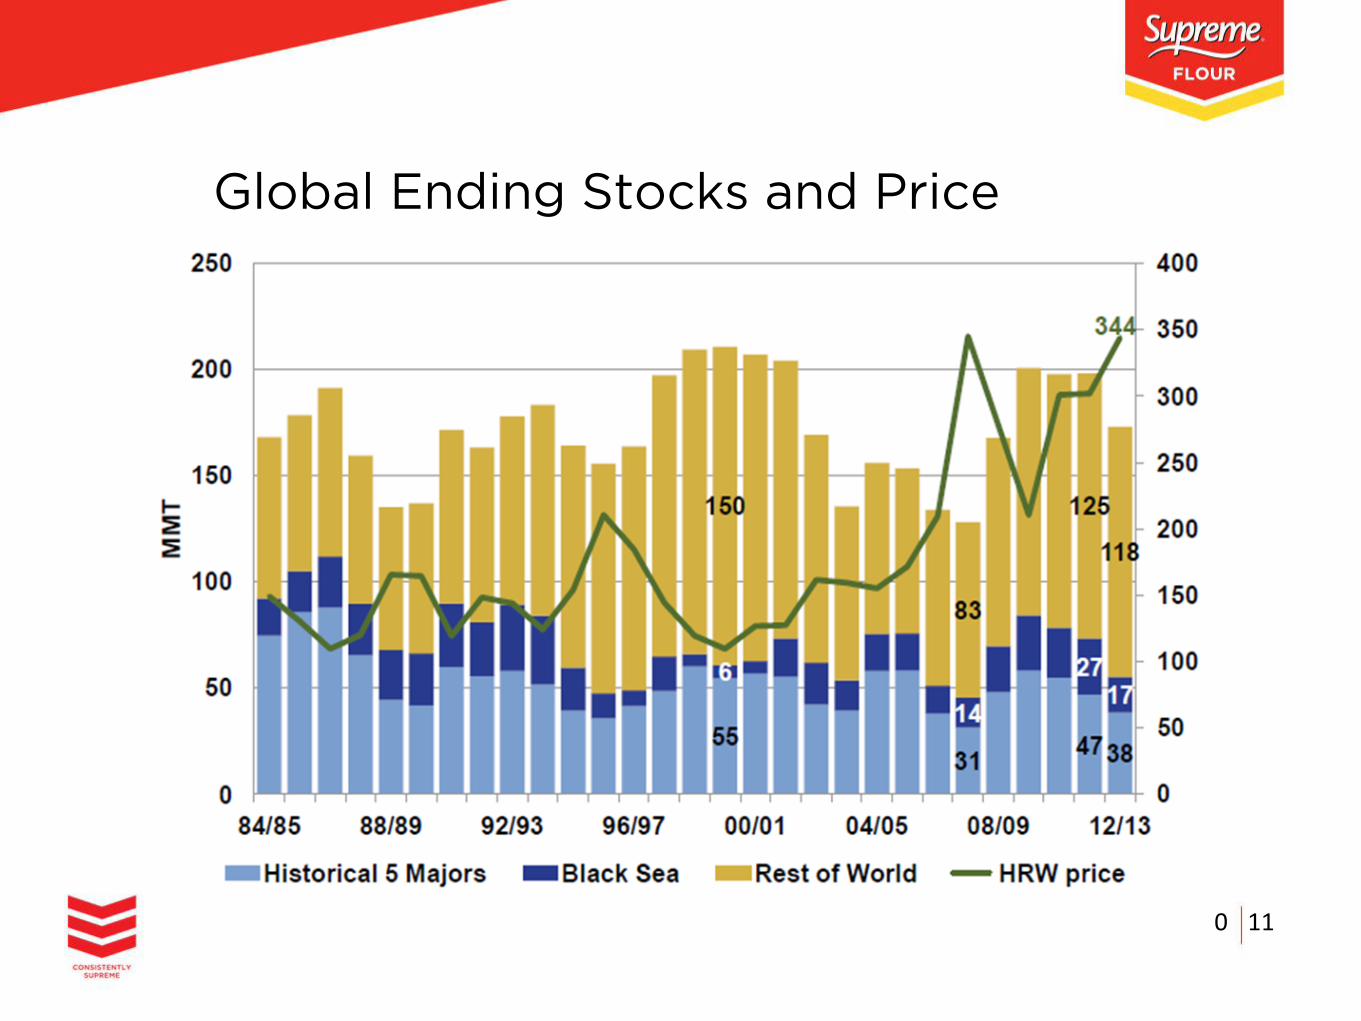
Global Ending Stocks and Price
0 11
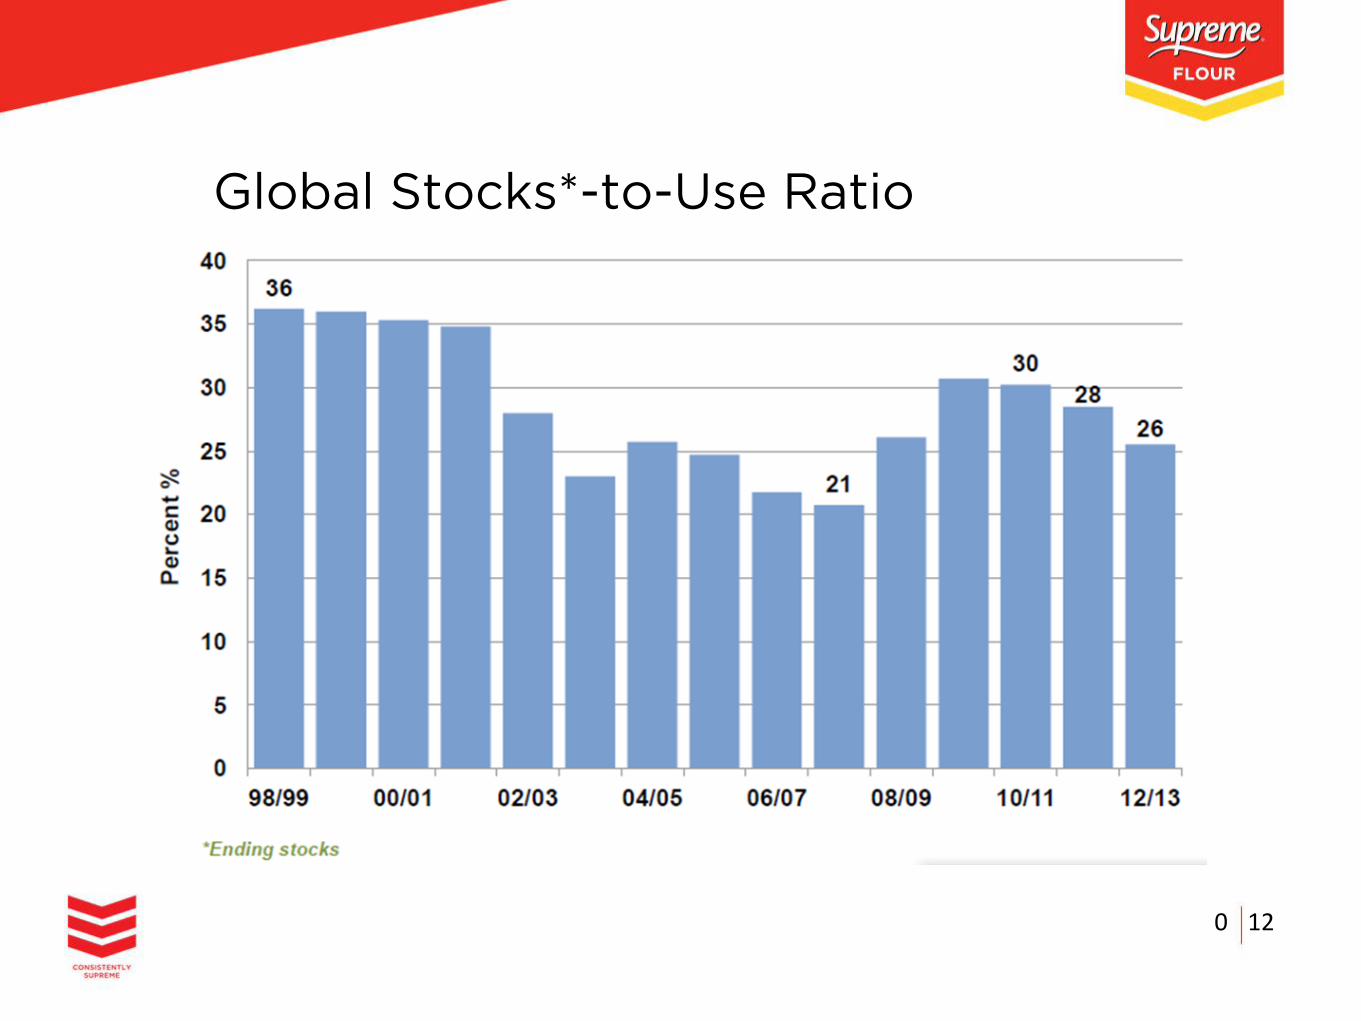
Global Stocks*-to-Use Ratio
0 12
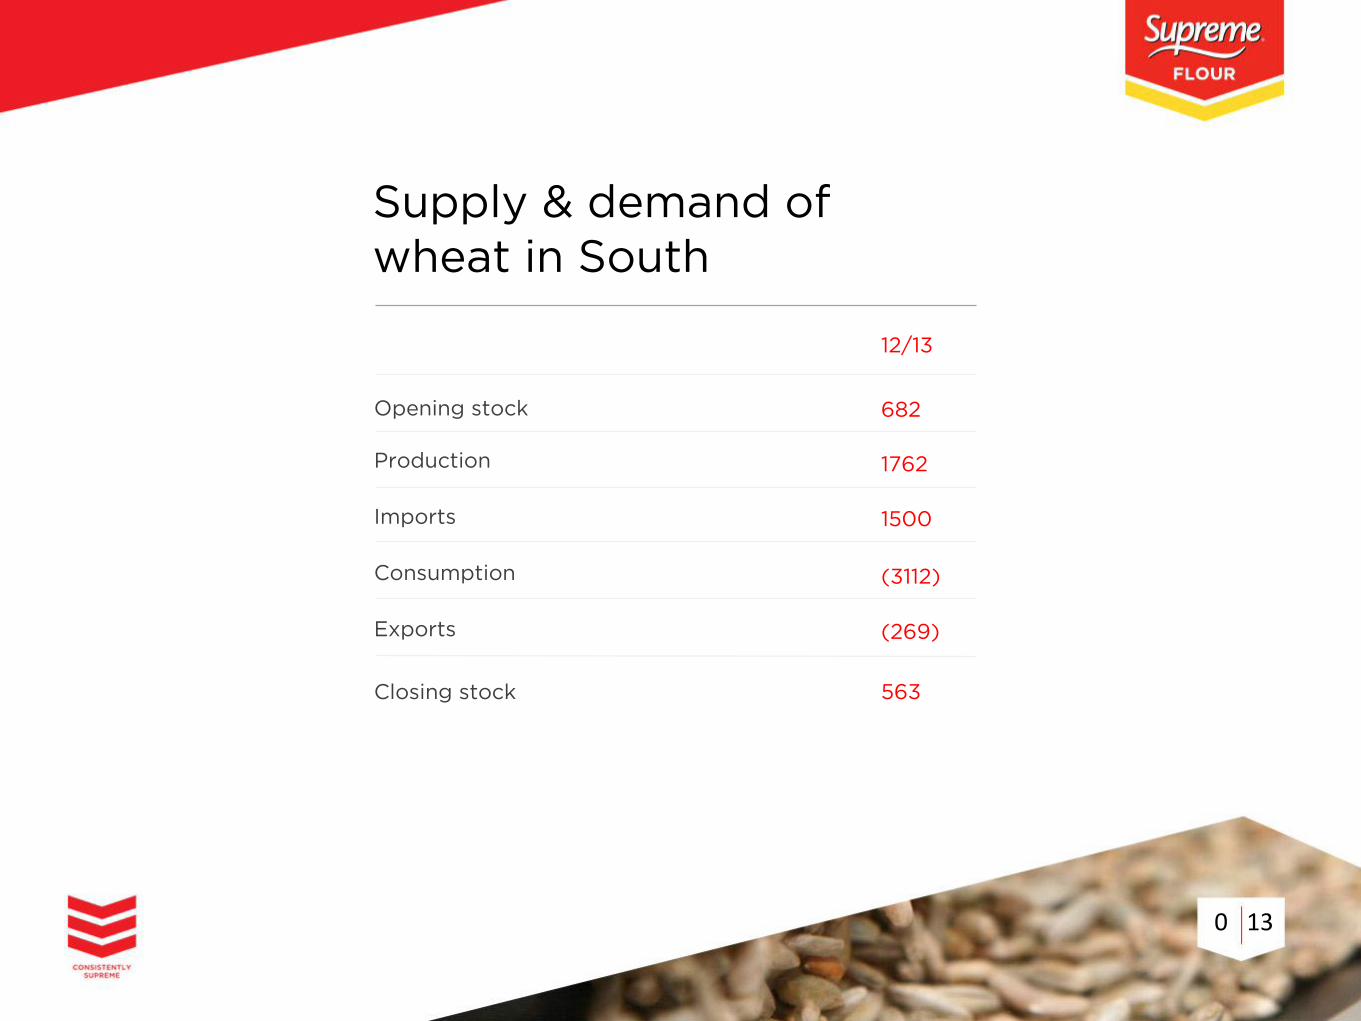
Opening stock
Production
Imports
682
Consumption
Exports
Closing stock
1762
1500
(3112)
(269)
563
12/13
Supply & demand of wheat in South
0 13
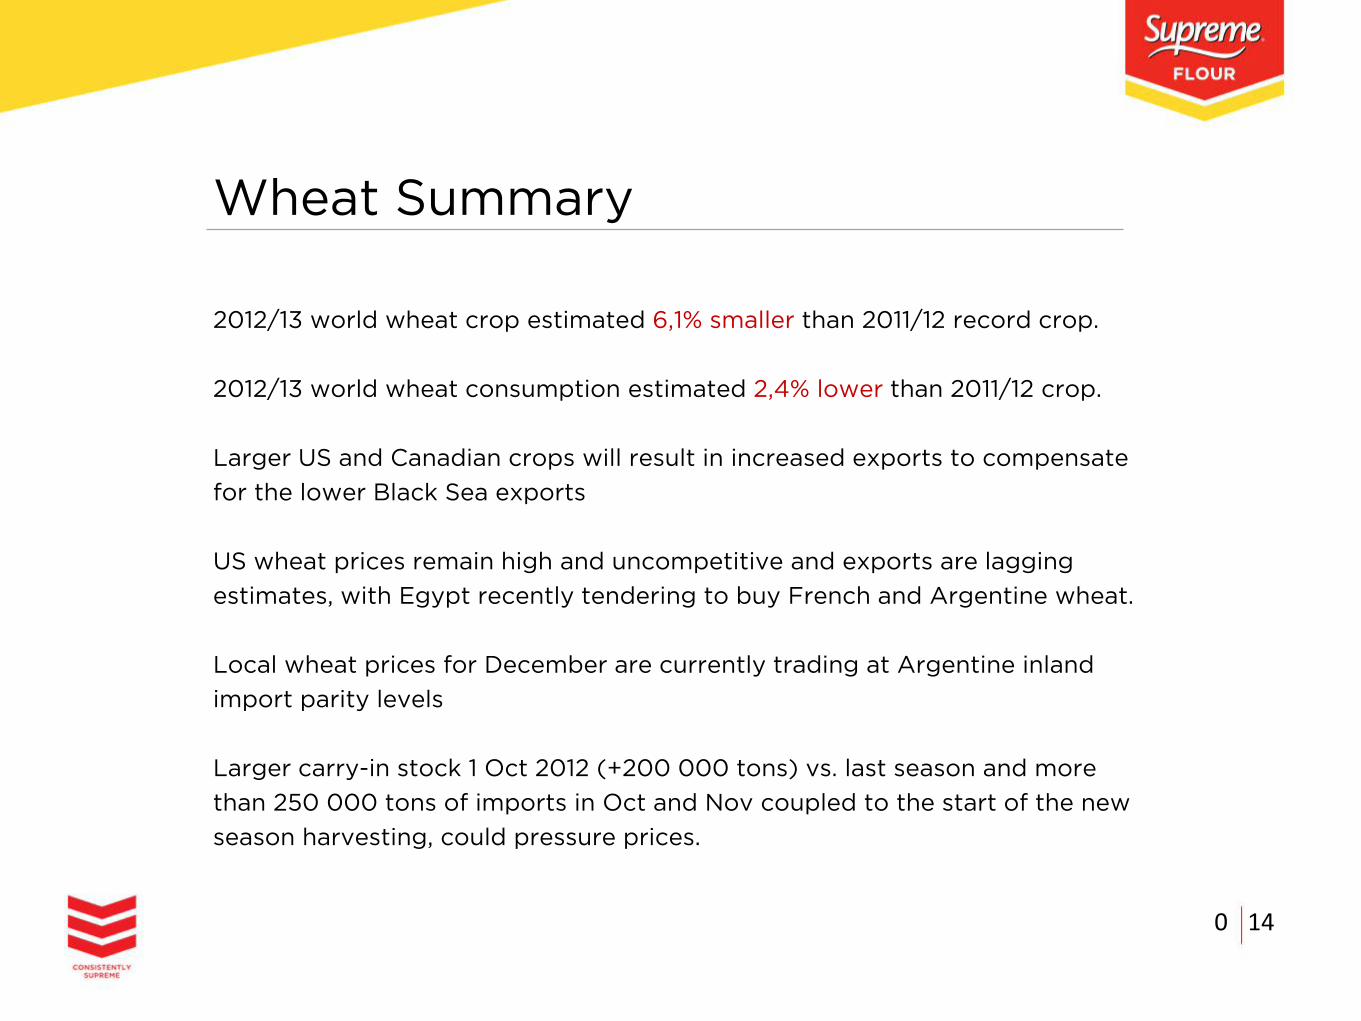
Wheat Summary
2012/13 world wheat crop estimated 6,1% smaller than 2011/12 record crop.
2012/13 world wheat consumption estimated 2,4% lower than 2011/12 crop.
Larger US and Canadian crops will result in increased exports to compensate
for the lower Black Sea exports
US wheat prices remain high and uncompetitive and exports are lagging
estimates, with Egypt recently tendering to buy French and Argentine wheat.
Local wheat prices for December are currently trading at Argentine inland
import parity levels
Larger carry-in stock 1 Oct 2012 (+200 000 tons) vs. last season and more
than 250 000 tons of imports in Oct and Nov coupled to the start of the new
season harvesting, could pressure prices.
0 14
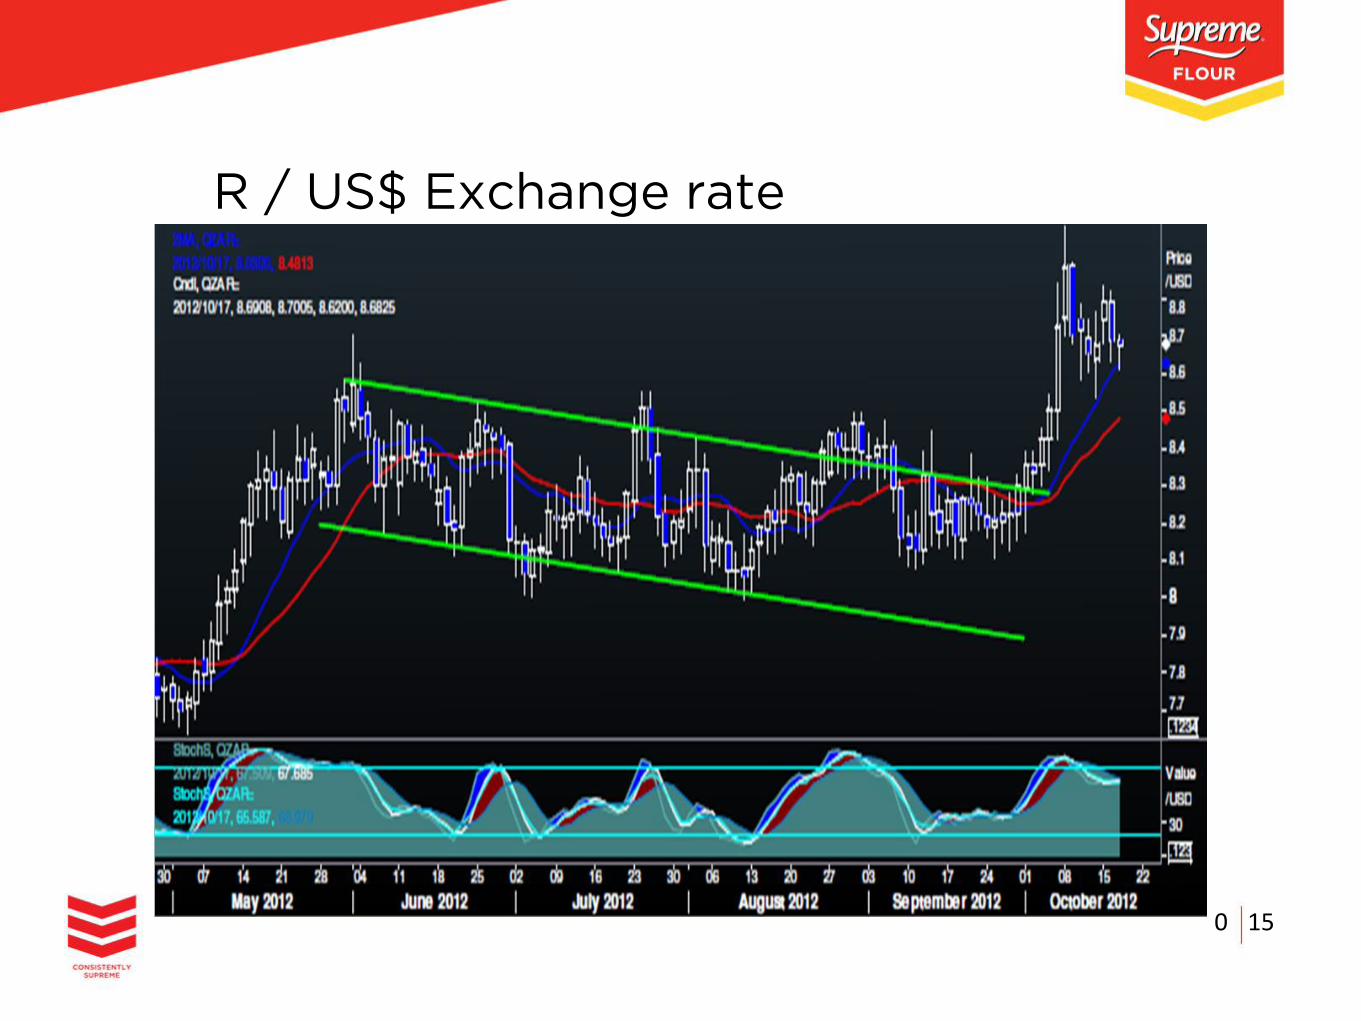
R / US$ Exchange rate
0 15
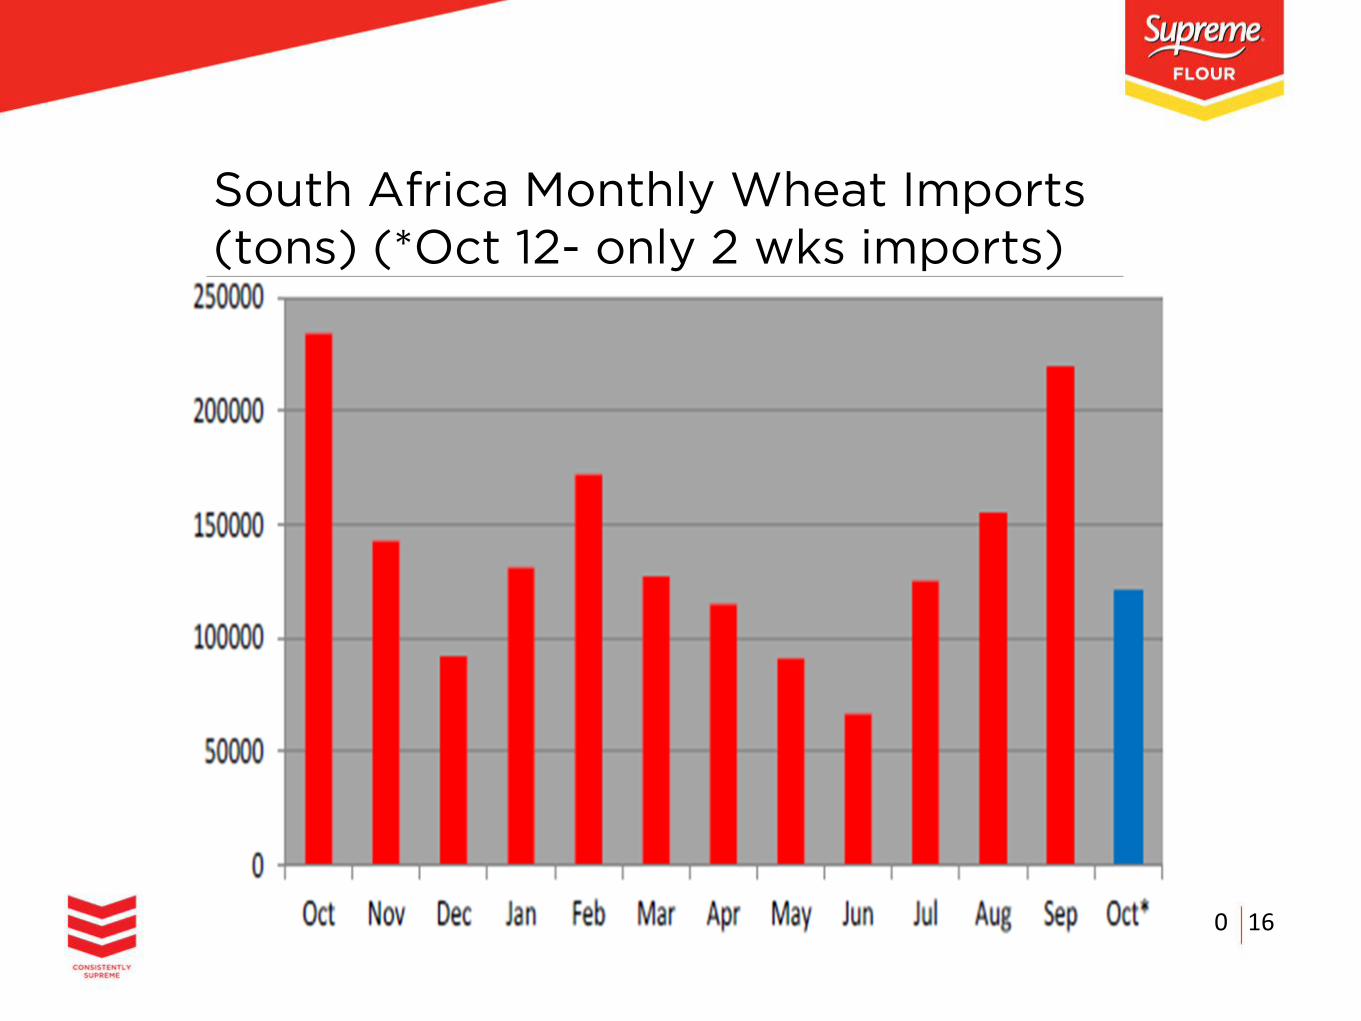
South Africa Monthly Wheat Imports
(tons) (*Oct 12- only 2 wks imports)
0 16
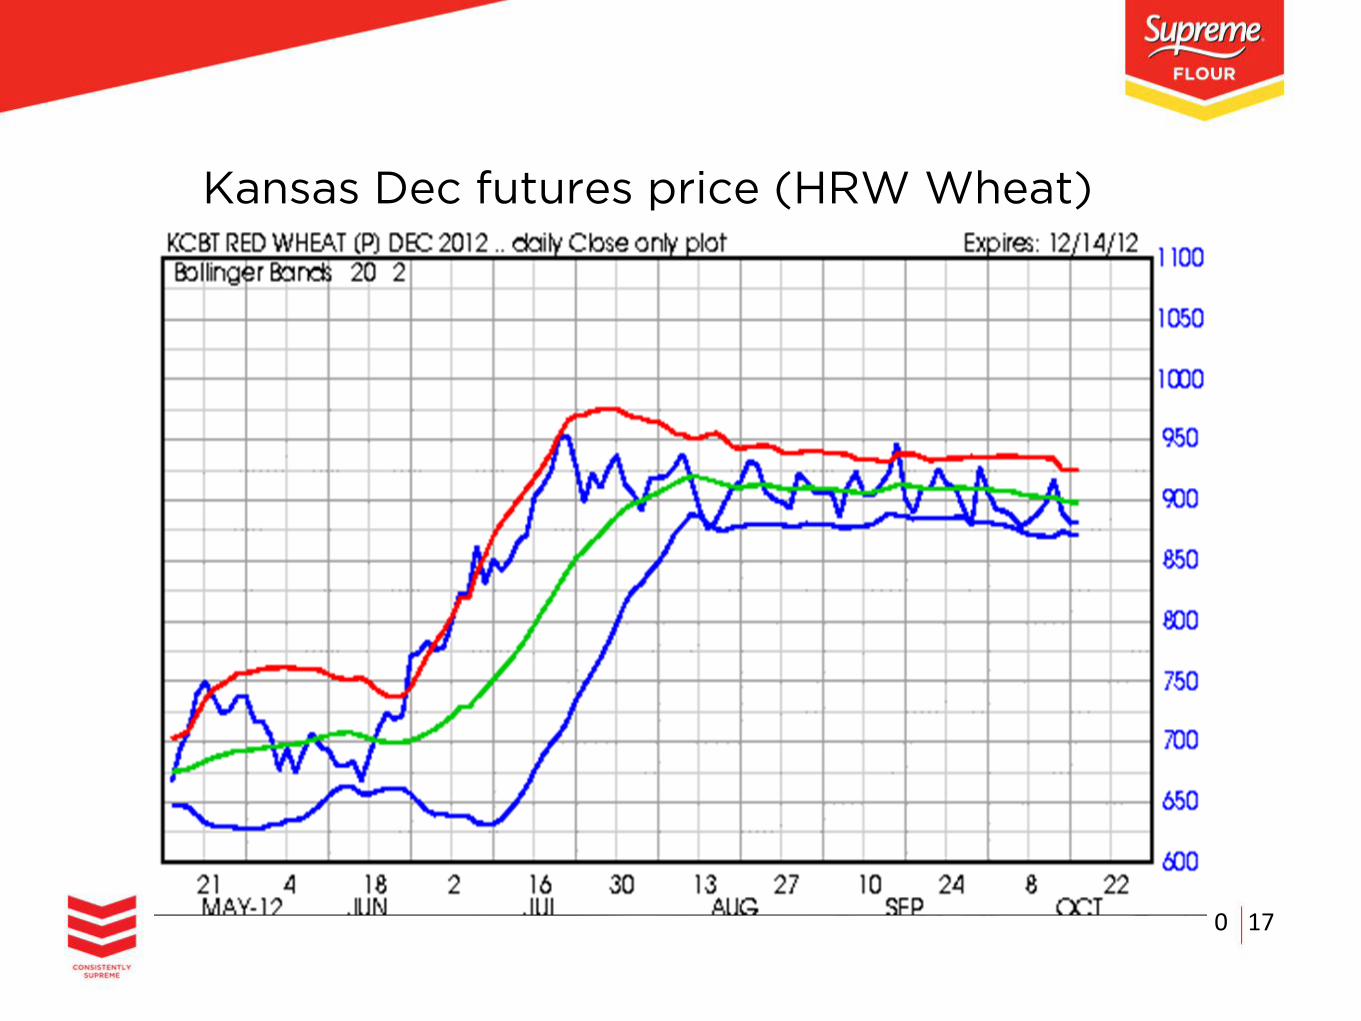
Kansas Dec futures price (HRW Wheat)
0 17
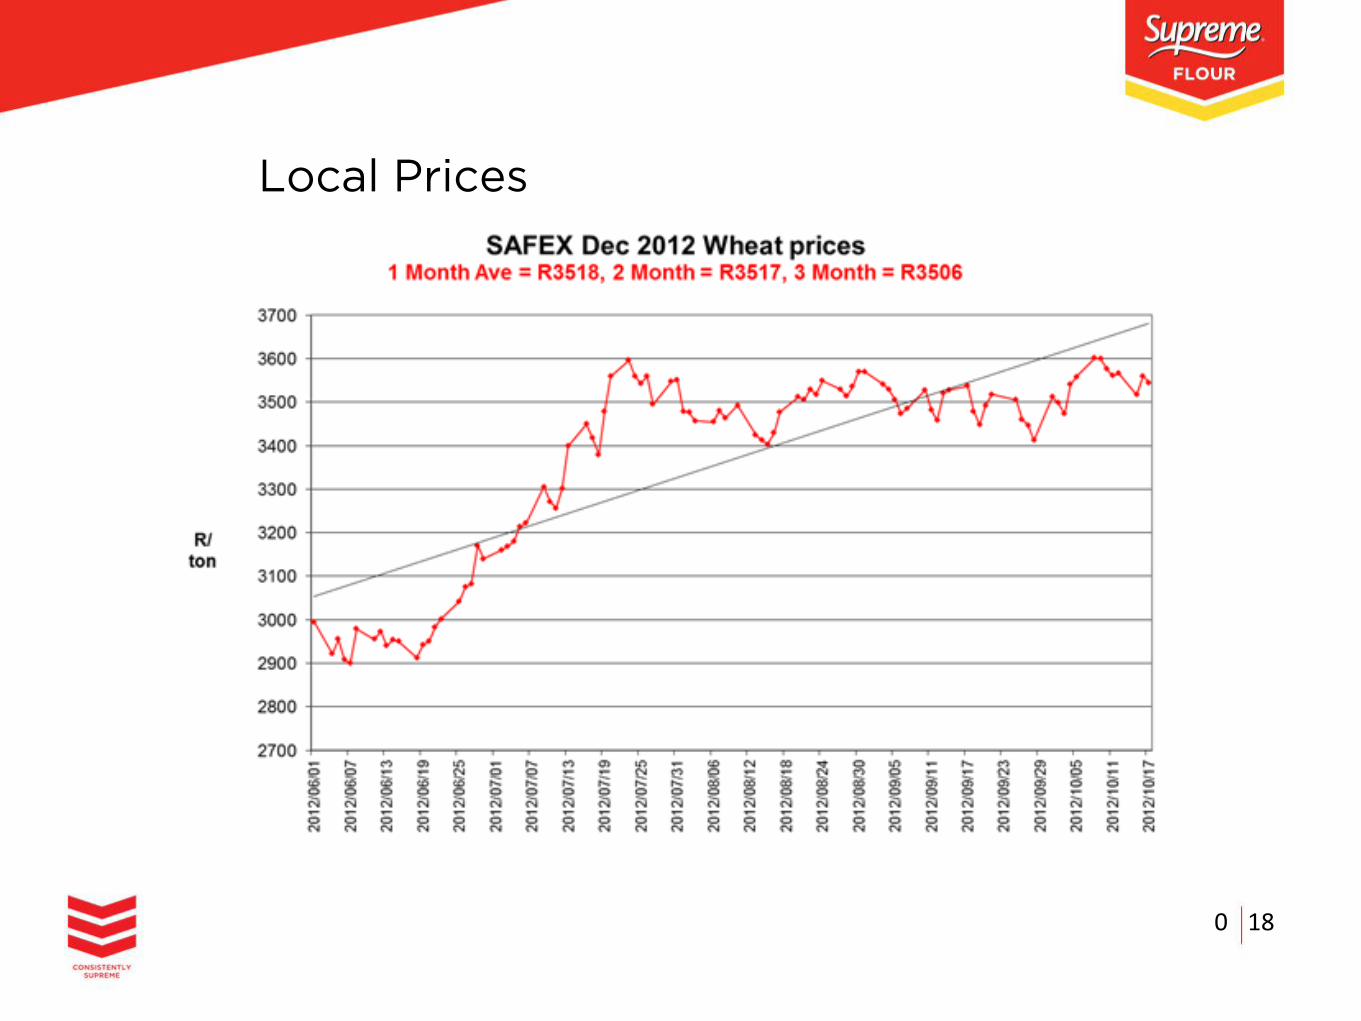
Local Prices
0 18
2900
2850
2800
2750
2700
2650

Thank you