Embed Size (px)
Citation preview
SOLVENCY RATIO – APOLLO TYRES LTD.
Presented by-
Dipanway Bhabuk
INTRODUCTION
Apollo Tyres Ltd is the world's 17th biggest tyre manufacturer.
It was founded in 1976.
GDP Contribution of 21.50 %.
Annual revenues of Rs 121.5 billion (US$2.5 billion) in 2011.
The company now has four manufacturing units, one in South Africa, two in Zimbabwe and 1 in Netherlands.
It has a network of over 4,000 dealerships in India, of which over 2,500 are exclusive outlets.
It gets 62.6% of its revenues from India, 27.9% from Europe and 9.5% from Africa.
It is planning to become the 10th biggest tyre manufacturer in the world.
WHAT IS SOLVENCY RATIO ?
A key metric used to measure an enterprise’s ability to meet its debt and other obligations. The solvency ratio indicates whether a company’s cash flow is sufficient to meet its short-term and long-term liabilities. The lower a company's solvency ratio, the greater the probability that it will default on its debt obligations.
MAJOR SOLVENCY RATIOS
• Current Ratio
• Quick Ratio
• Total Debt Ratio
• Debt equity Ratio
• Interest coverage ratio
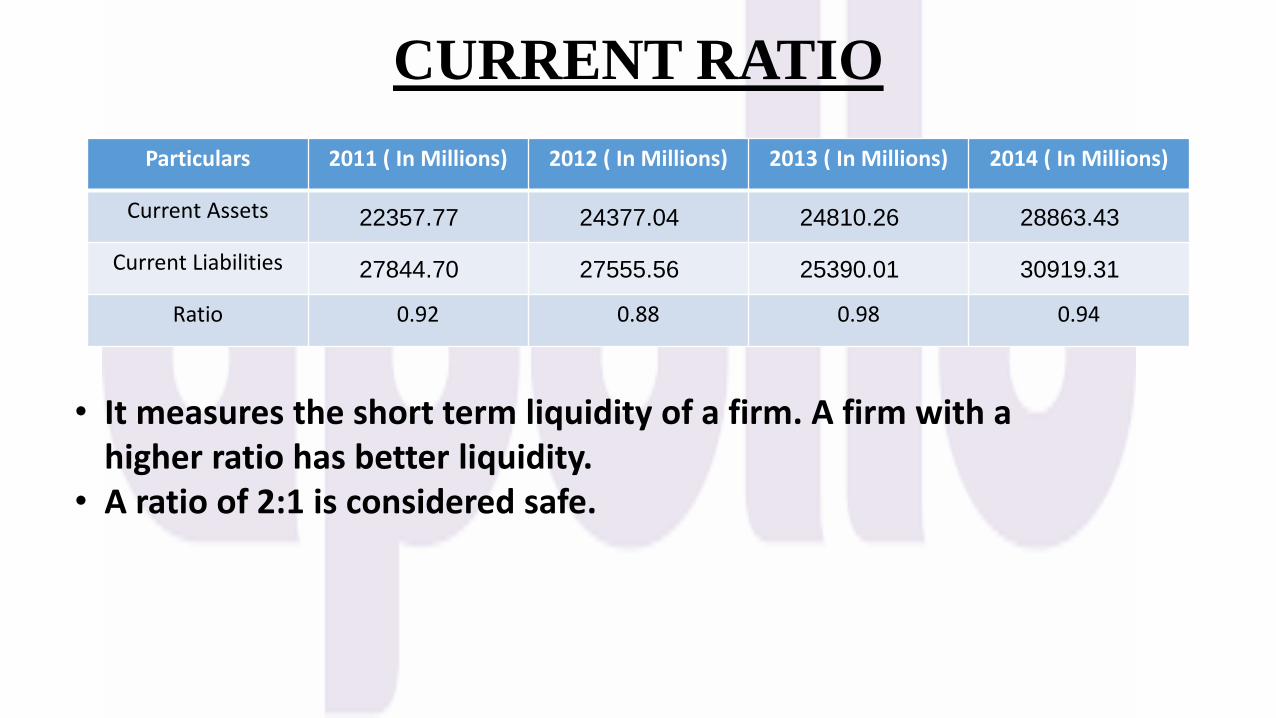
CURRENT RATIO
Particulars 2011 ( In Millions) 2012 ( In Millions) 2013 ( In Millions) 2014 ( In Millions)
Current Assets 22357.77 24377.04 24810.26 28863.43
Current Liabilities 27844.70 27555.56 25390.01 30919.31
Ratio 0.92 0.88 0.98 0.94
• It measures the short term liquidity of a firm. A firm with a higher ratio has better liquidity.
• A ratio of 2:1 is considered safe.
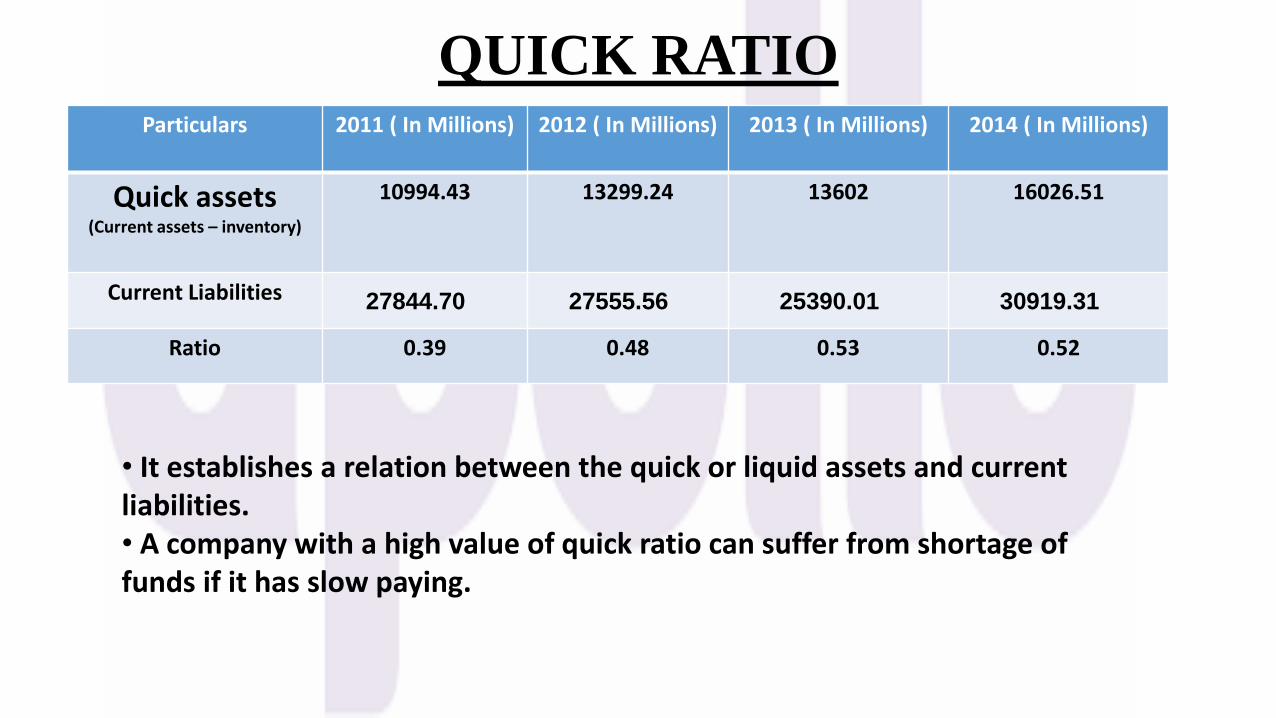
QUICK RATIOParticulars 2011 ( In Millions) 2012 ( In Millions) 2013 ( In Millions) 2014 ( In Millions)
Quick assets (Current assets – inventory)
10994.43 13299.24 13602 16026.51
Current Liabilities 27844.70 27555.56 25390.01 30919.31
Ratio 0.39 0.48 0.53 0.52
• It establishes a relation between the quick or liquid assets and current liabilities.• A company with a high value of quick ratio can suffer from shortage of funds if it has slow paying.
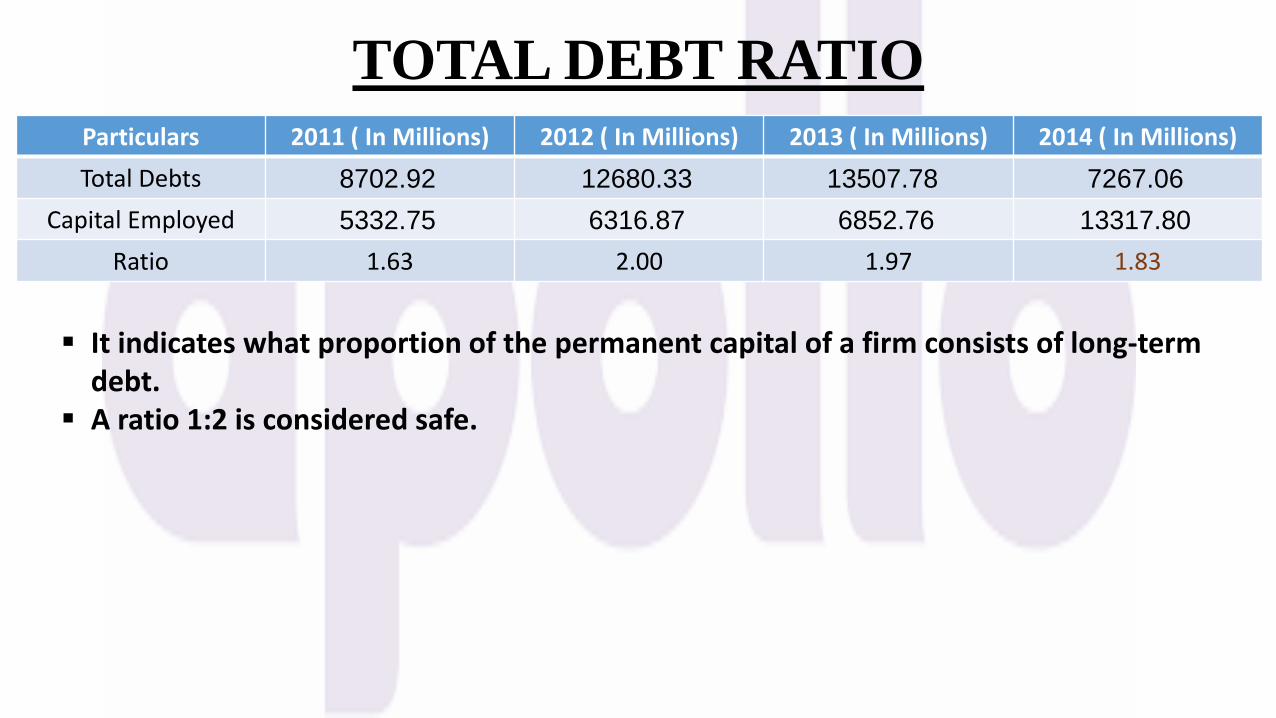
TOTAL DEBT RATIO
Particulars 2011 ( In Millions) 2012 ( In Millions) 2013 ( In Millions) 2014 ( In Millions)
Total Debts 8702.92 12680.33 13507.78 7267.06
Capital Employed 5332.75 6316.87 6852.76 13317.80
Ratio 1.63 2.00 1.97 1.83
It indicates what proportion of the permanent capital of a firm consists of long-termdebt.
A ratio 1:2 is considered safe.
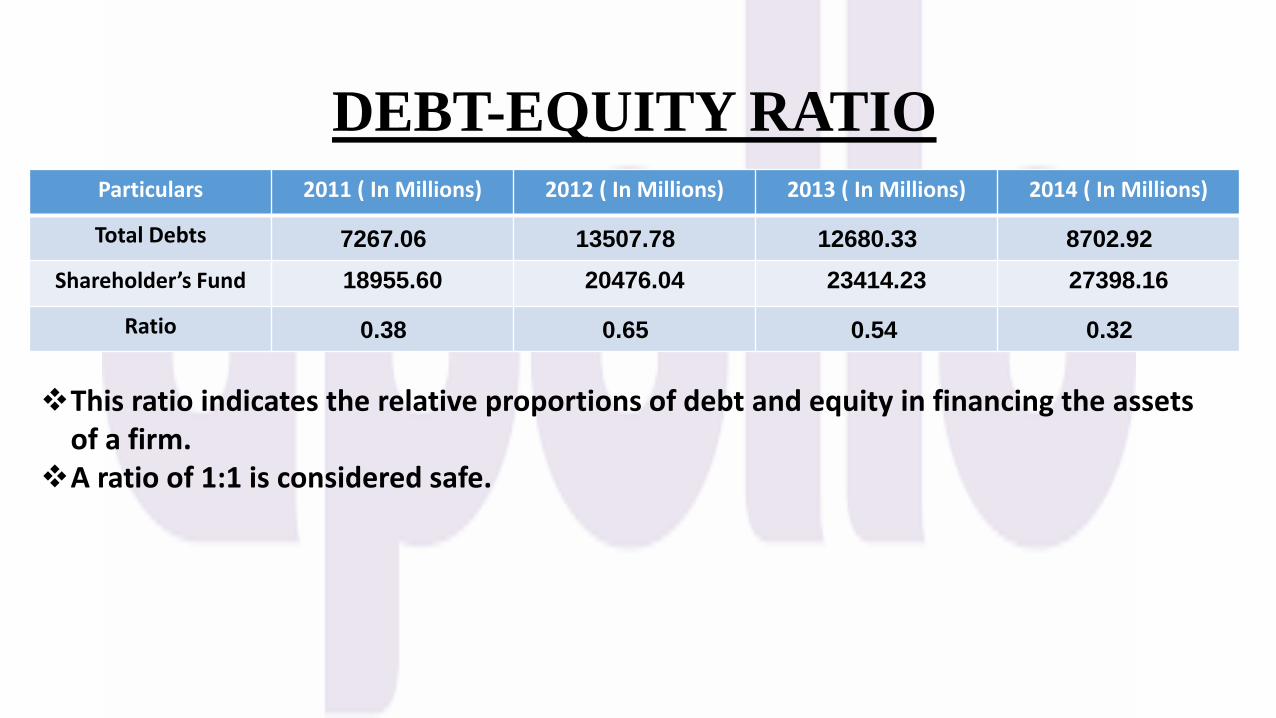
DEBT-EQUITY RATIO
Particulars 2011 ( In Millions) 2012 ( In Millions) 2013 ( In Millions) 2014 ( In Millions)
Total Debts 7267.06 13507.78 12680.33 8702.92
Shareholder’s Fund 18955.60 20476.04 23414.23 27398.16
Ratio 0.38 0.65 0.54 0.32
This ratio indicates the relative proportions of debt and equity in financing the assets of a firm.
A ratio of 1:1 is considered safe.
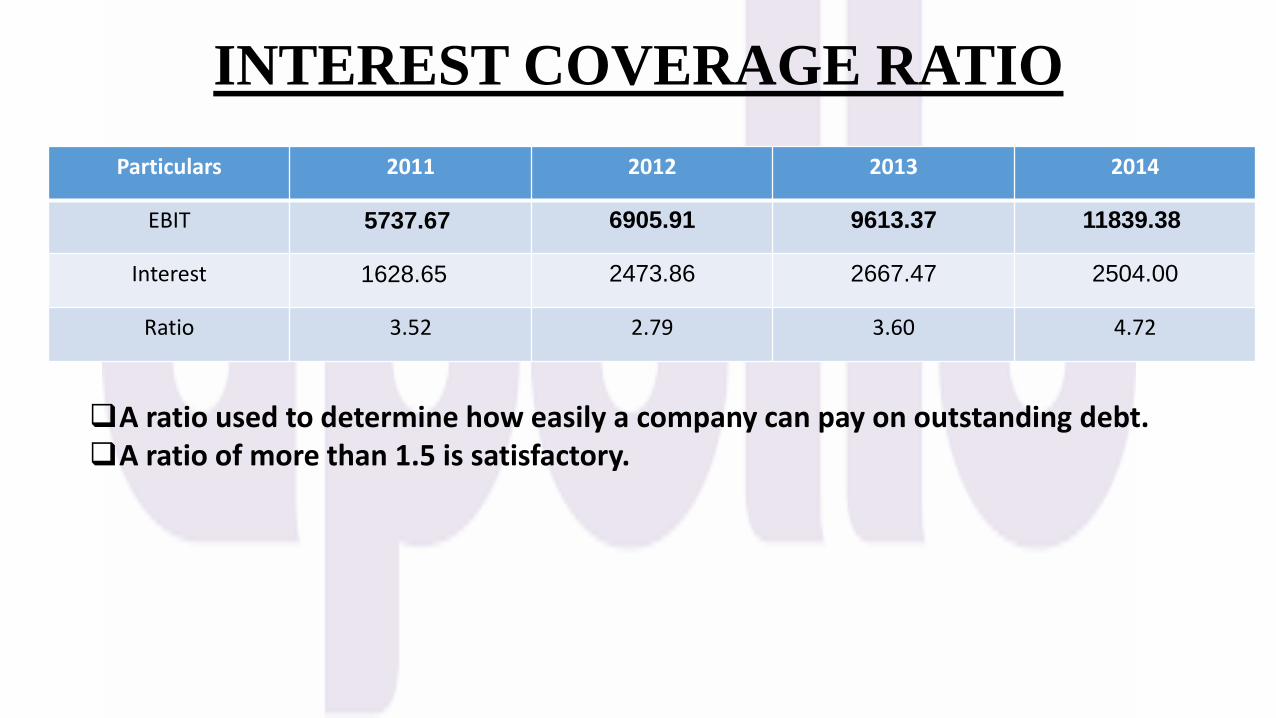
INTEREST COVERAGE RATIO
Particulars 2011 2012 2013 2014
EBIT 5737.67 6905.91 9613.37 11839.38
Interest 1628.65 2473.86 2667.47 2504.00
Ratio 3.52 2.79 3.60 4.72
A ratio used to determine how easily a company can pay on outstanding debt.A ratio of more than 1.5 is satisfactory.
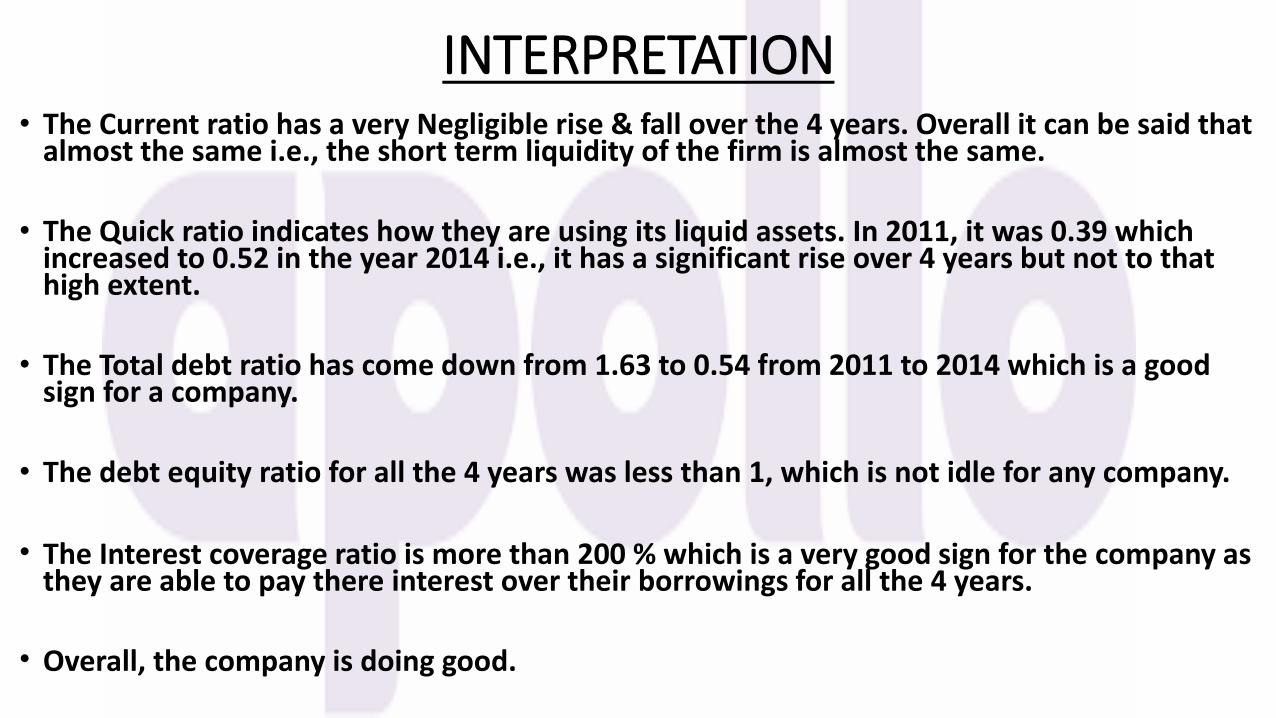
INTERPRETATION• The Current ratio has a very Negligible rise & fall over the 4 years. Overall it can be said that
almost the same i.e., the short term liquidity of the firm is almost the same.
• The Quick ratio indicates how they are using its liquid assets. In 2011, it was 0.39 which increased to 0.52 in the year 2014 i.e., it has a significant rise over 4 years but not to that high extent.
• The Total debt ratio has come down from 1.63 to 0.54 from 2011 to 2014 which is a good sign for a company.
• The debt equity ratio for all the 4 years was less than 1, which is not idle for any company.
• The Interest coverage ratio is more than 200 % which is a very good sign for the company as they are able to pay there interest over their borrowings for all the 4 years.
• Overall, the company is doing good.


![Apollo Tyres 1[1].pptx](https://img.pdfslide.us/doc/110x75/577cddc31a28ab9e78adacc6/apollo-tyres-11pptx.jpg)