Embed Size (px)
Citation preview
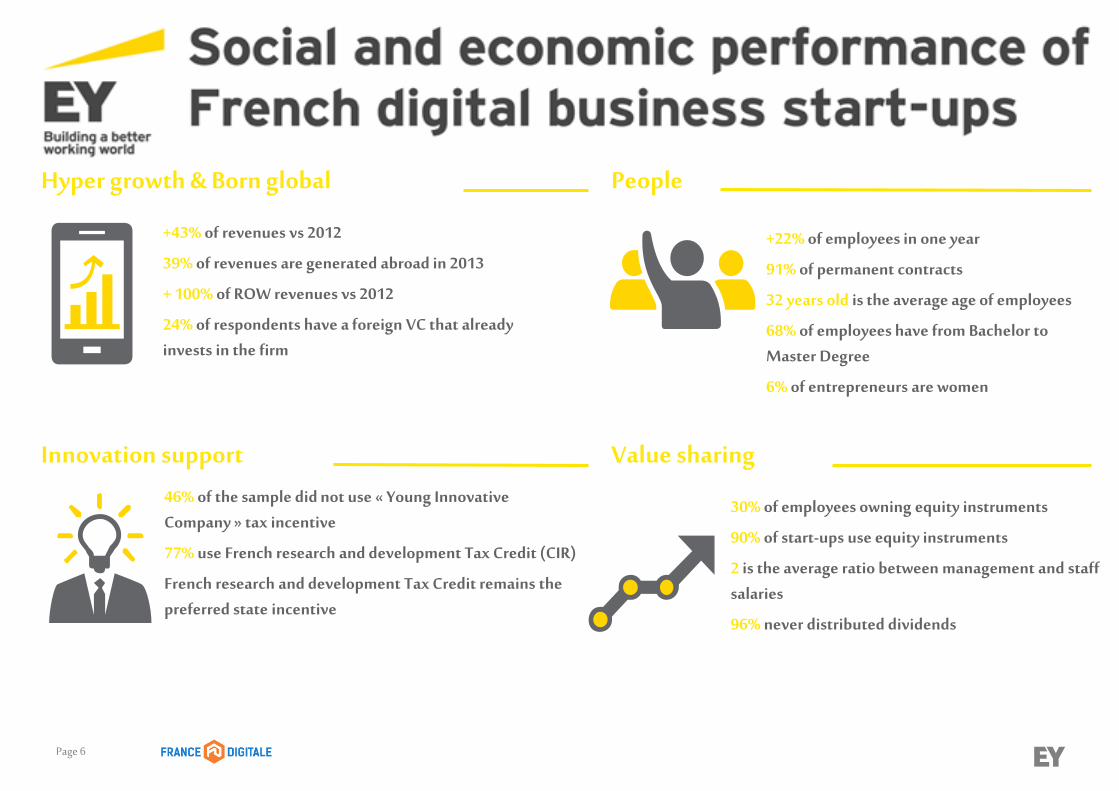
Social and economic performance of French digital business start-ups
Barometer 2014
Page 2
1. Methodology
2. Executive summary
3. Key figures
3.1 Revenues
3.2 Fund-raising
3.3 Innovation support
3.4 People
3.5 Value-sharing
3.6 Entrepreneur’s profile
4. Contacts

Page 3
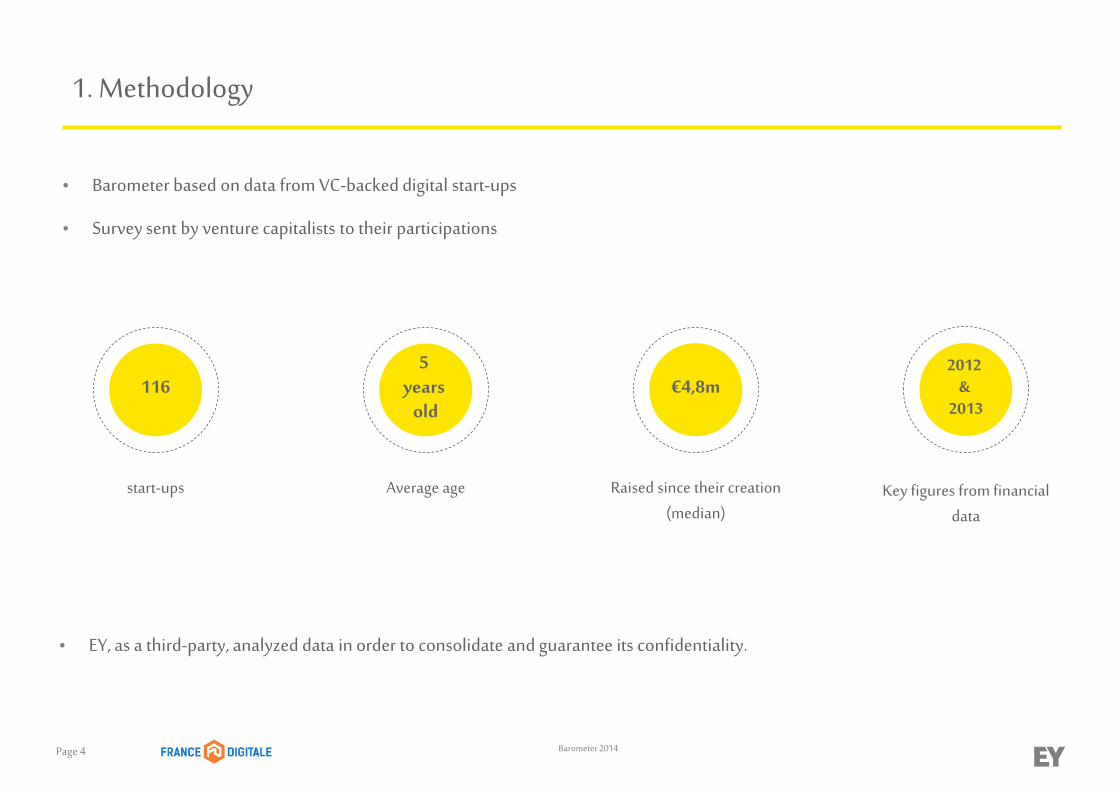
1. Methodology
Page 4 Barometer 2014
1. Methodology
• Barometer based on data from VC-backed digital start-ups
• Survey sent by venture capitalists to their participations
• EY, as a third-party, analyzed data in order to consolidate and guarantee its confidentiality.
1165
years old
€4,8m2012
& 2013
start-ups Average age Raised since their creation (median)
Key figures from financial data
Page 5
2. Executive summary
Page 6
Hyper growth & Born global
+43% of revenues vs 2012
39% of revenues are generated abroad in 2013
+ 100% of ROW revenues vs 2012
24% of respondents have a foreign VC that already invests in the firm
People
+22% of employees in one year
91% of permanent contracts
32 years old is the average age of employees
68% of employees have from Bachelor to Master Degree
6% of entrepreneurs are women
Innovation support Value sharing46% of the sample did not use « Young Innovative Company » tax incentive
77% use French research and development Tax Credit (CIR)
French research and development Tax Credit remains the preferred state incentive
30% of employees owning equity instruments
90% of start-ups use equity instruments
2 is the average ratio between management and staff salaries
96% never distributed dividends

Page 7
3. Key figures
Page 8 Barometer 2014
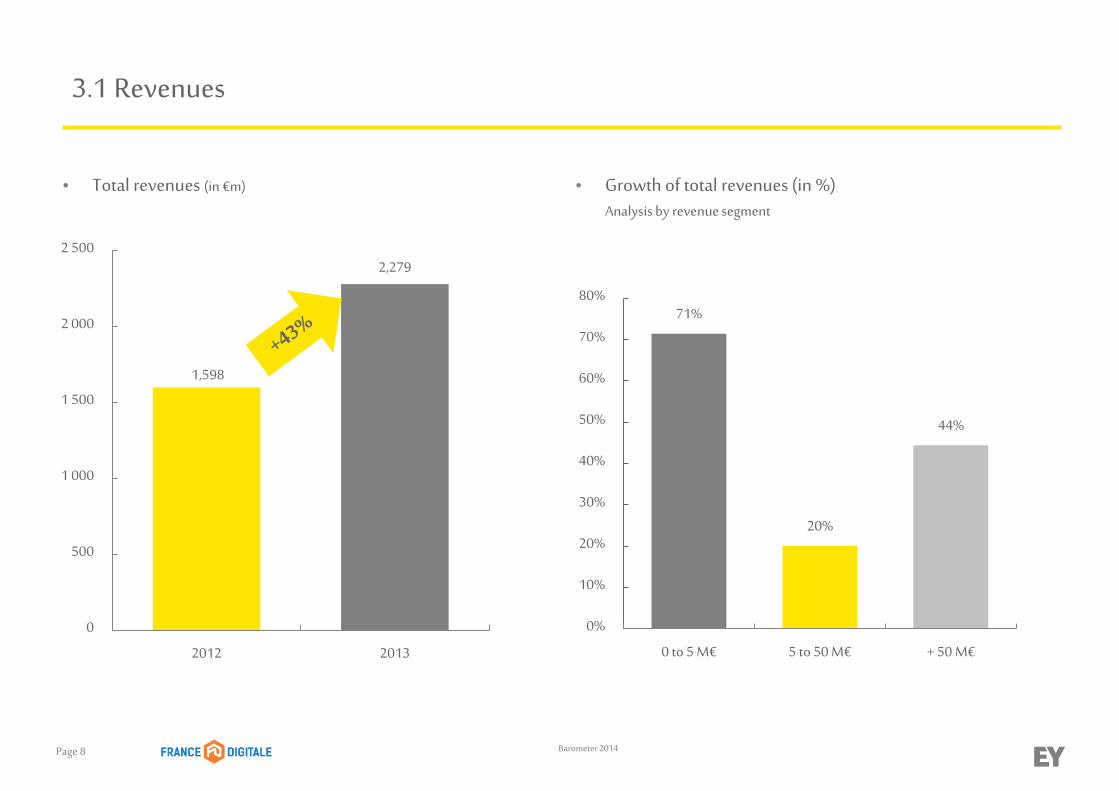
3.1 Revenues
• Total revenues (in €m) • Growth of total revenues (in %)Analysis by revenue segment
1,598
2,279
0
500
1 000
1 500
2 000
2 500
2012 2013
71%
20%
44%
0%
10%
20%
30%
40%
50%
60%
70%
80%
0 to 5 M€ 5 to 50 M€ + 50 M€
Page 9 Barometer 2014
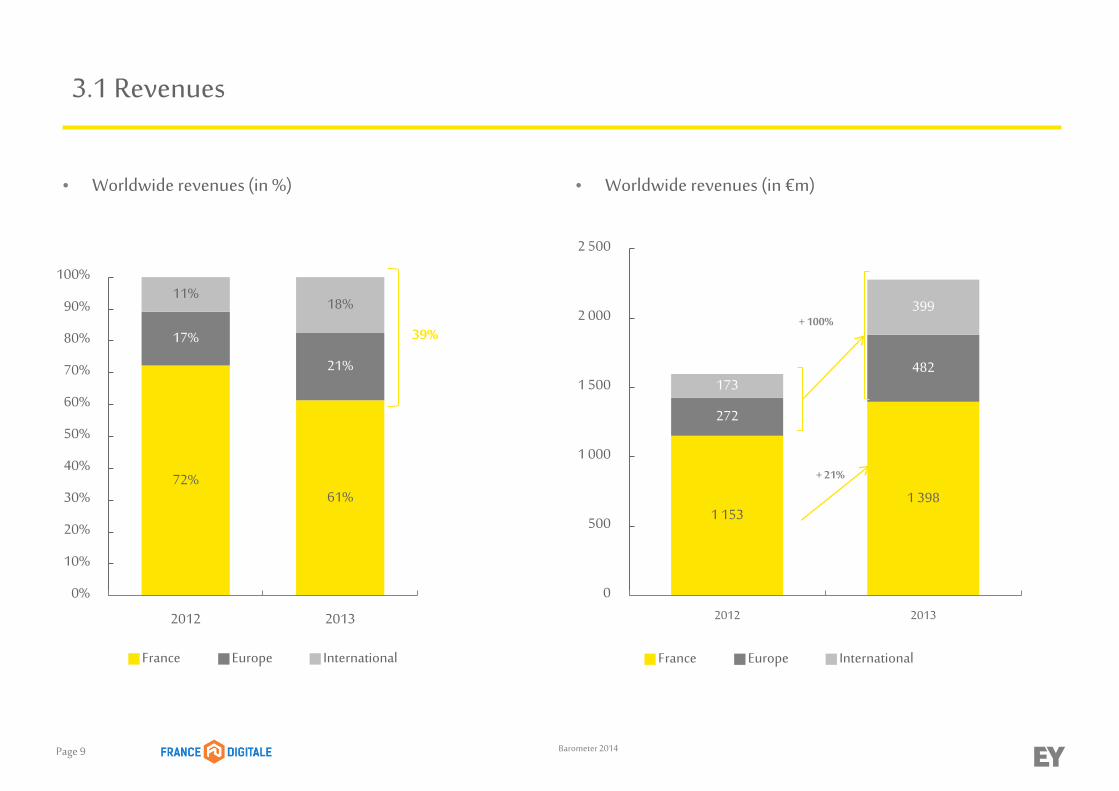
3.1 Revenues
• Worldwide revenues (in %) • Worldwide revenues (in €m)
72%61%
17%
21%
11%18%
0%
10%
20%
30%
40%
50%
60%
70%
80%
90%
100%
2012 2013
1 1531 398
272
482173
399
0
500
1 000
1 500
2 000
2 500
2012 2013
France Europe International France Europe International
+ 21%
+ 100%39%
Page 10 Barometer 2014
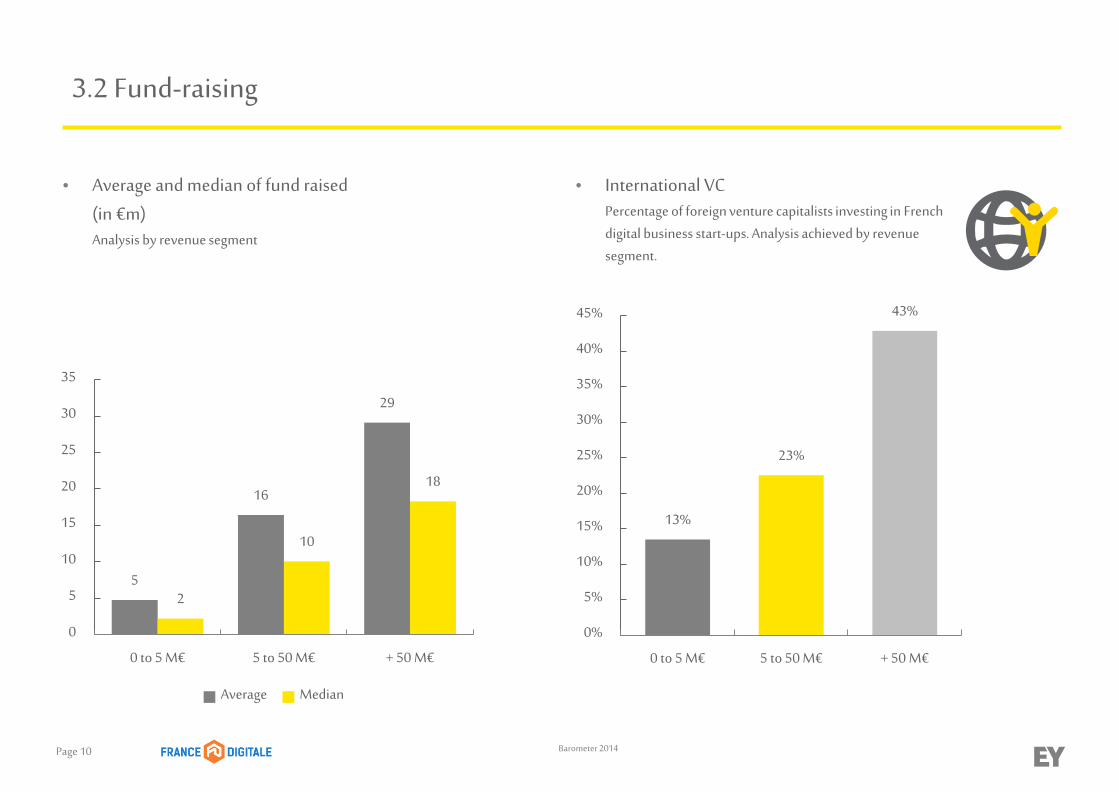
3.2 Fund-raising
• Average and median of fund raised (in €m)Analysis by revenue segment
• International VCPercentage of foreign venture capitalists investing in French digital business start-ups. Analysis achieved by revenue segment.
5
16
29
2
10
18
0
5
10
15
20
25
30
35
0 to 5 M€ 5 to 50 M€ + 50 M€
Average Median
13%
23%
43%
0%
5%
10%
15%
20%
25%
30%
35%
40%
45%
0 to 5 M€ 5 to 50 M€ + 50 M€
Page 11 Barometer 2014
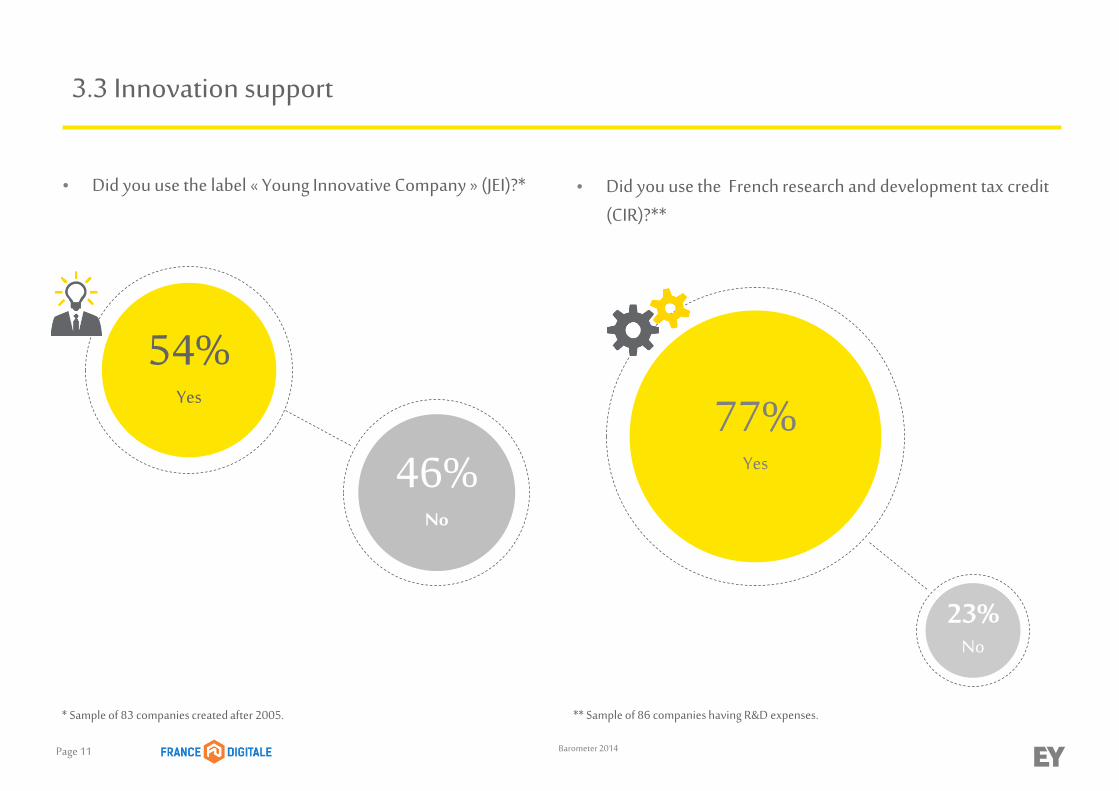
3.3 Innovation support
* Sample of 83 companies created after 2005.
46%No
54%Yes
• Did you use the label « Young Innovative Company » (JEI)?*
23%No
77%Yes
• Did you use the French research and development tax credit (CIR)?**
** Sample of 86 companies having R&D expenses.
Page 12 Barometer 2014
3.3 Innovation support
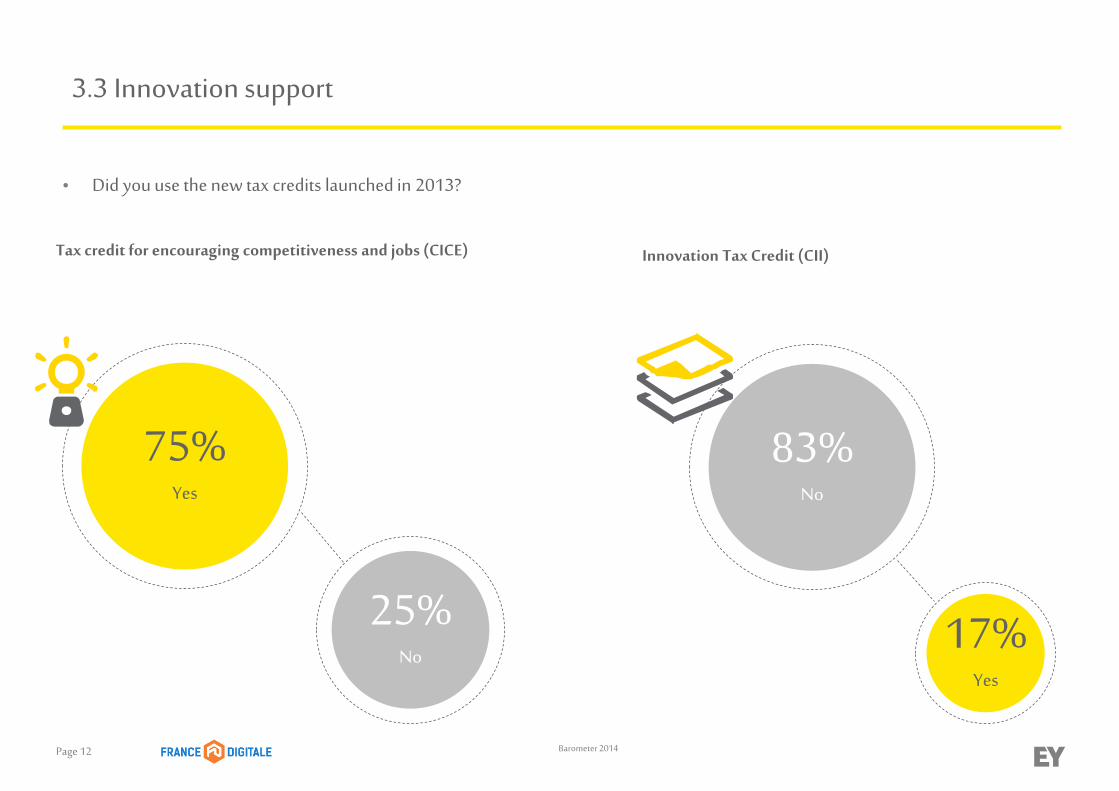
25%No
75%Yes
83%No
17%Yes
Tax credit for encouraging competitiveness and jobs (CICE) Innovation Tax Credit (CII)
• Did you use the new tax credits launched in 2013?
Page 13 Barometer 2014
3.3 Innovation support
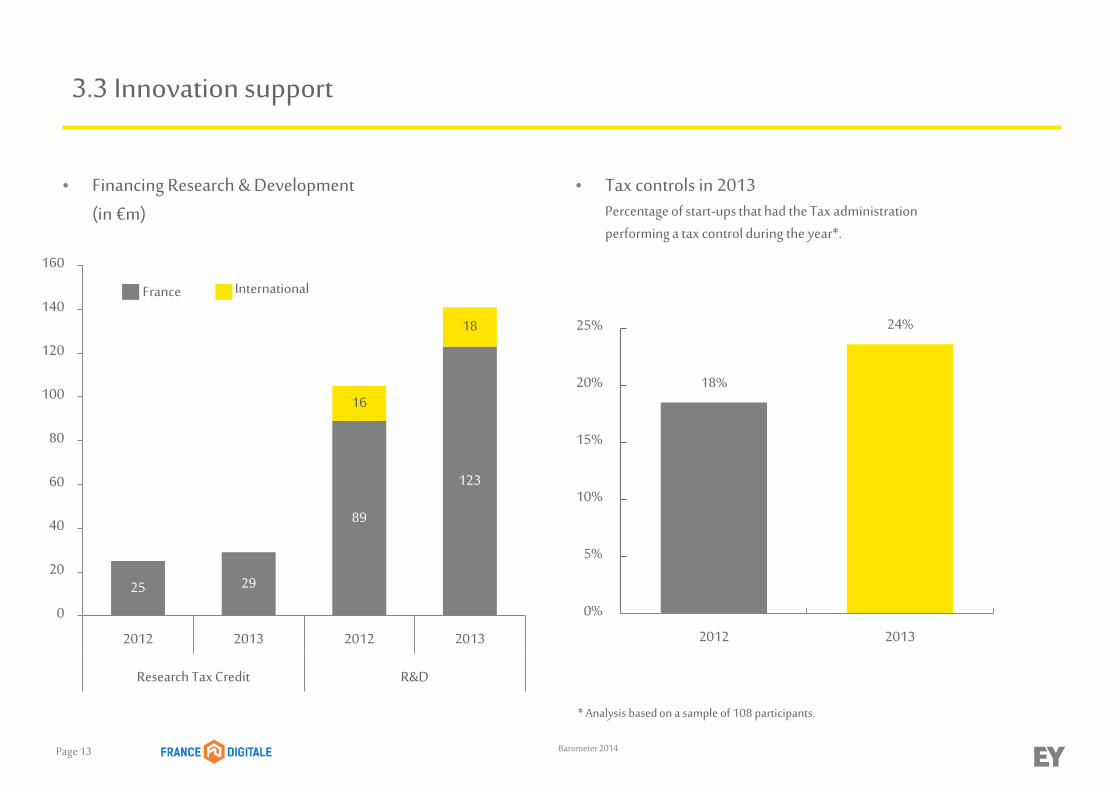
• Financing Research & Development (in €m)
• Tax controls in 2013Percentage of start-ups that had the Tax administration performing a tax control during the year*.
18%
24%
0%
5%
10%
15%
20%
25%
2012 2013
* Analysis based on a sample of 108 participants.
25 29
89
123
16
18
0
20
40
60
80
100
120
140
160
2012 2013 2012 2013
Research Tax Credit R&D
InternationalFrance
Page 14 Barometer 2014
3.4 People
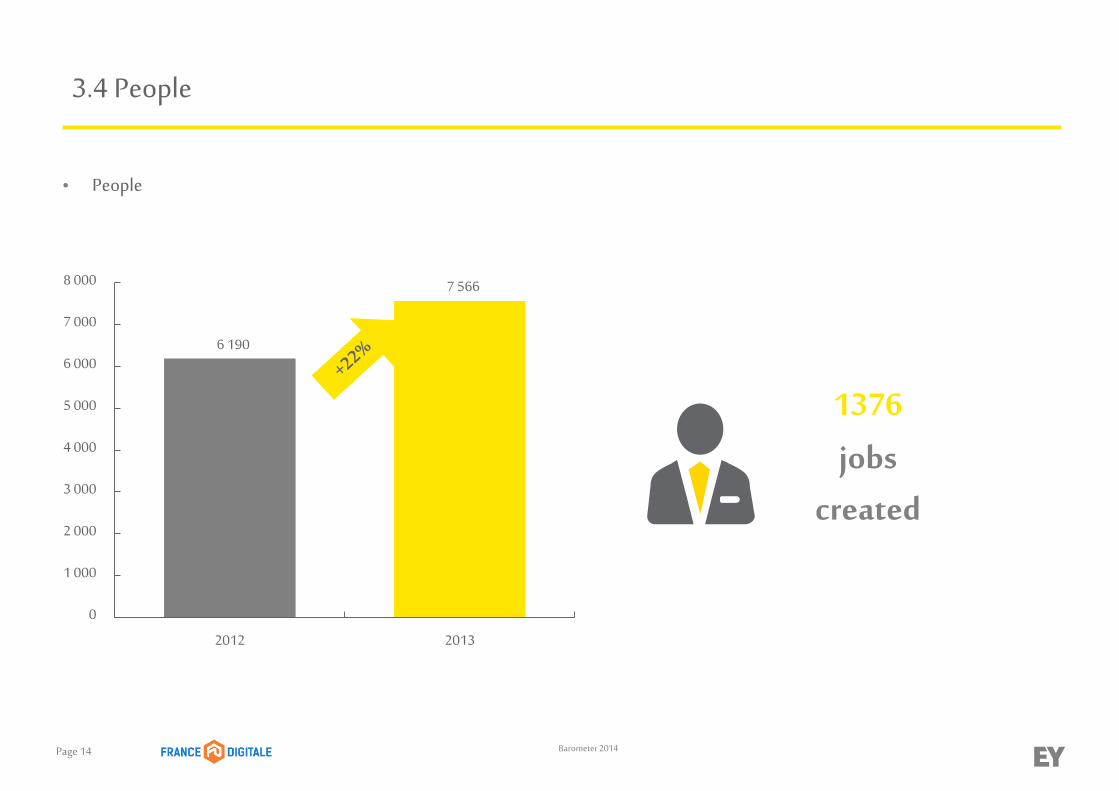
• People
6 190
7 566
0
1 000
2 000
3 000
4 000
5 000
6 000
7 000
8 000
2012 2013
1376
jobscreated
Page 15 Barometer 2014
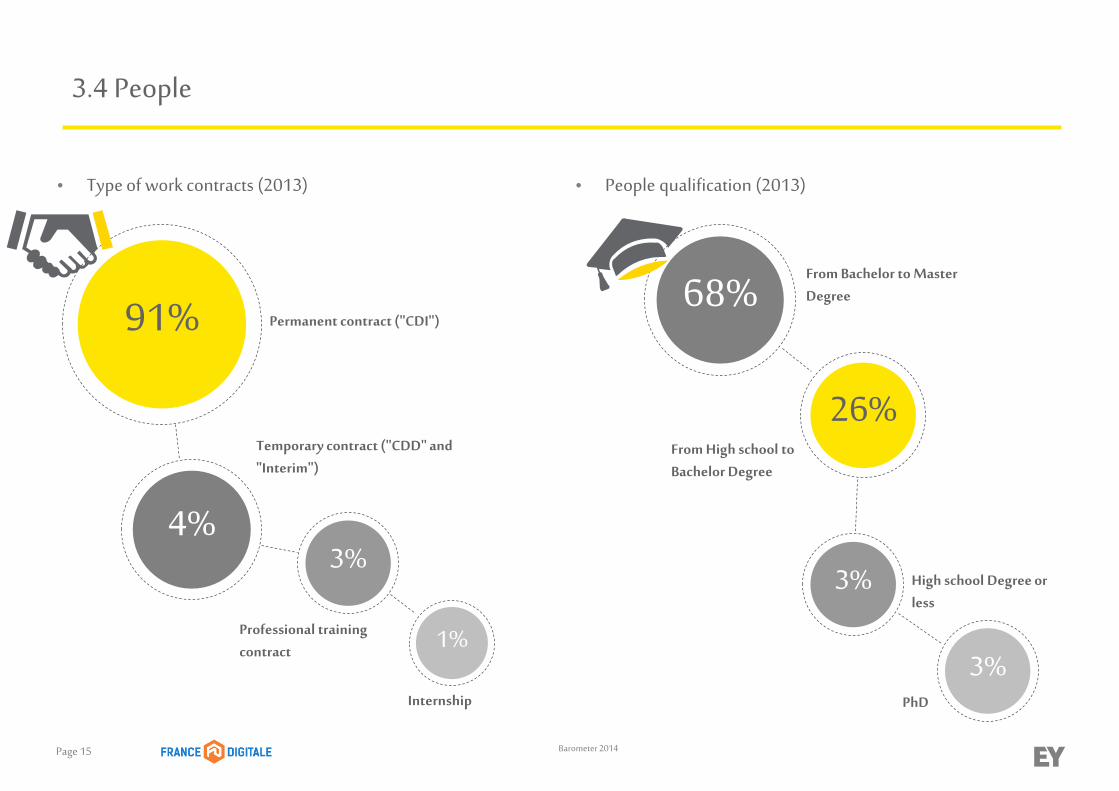
91%
3.4 People
4%3%
1%
Permanent contract ("CDI")
Temporary contract ("CDD" and "Interim")
Professional training contract
Internship
68%
26%
3%
3%
From Bachelor to Master Degree
From High school to Bachelor Degree
High school Degree or less
PhD
• Type of work contracts (2013) • People qualification (2013)
Page 16 Barometer 2014
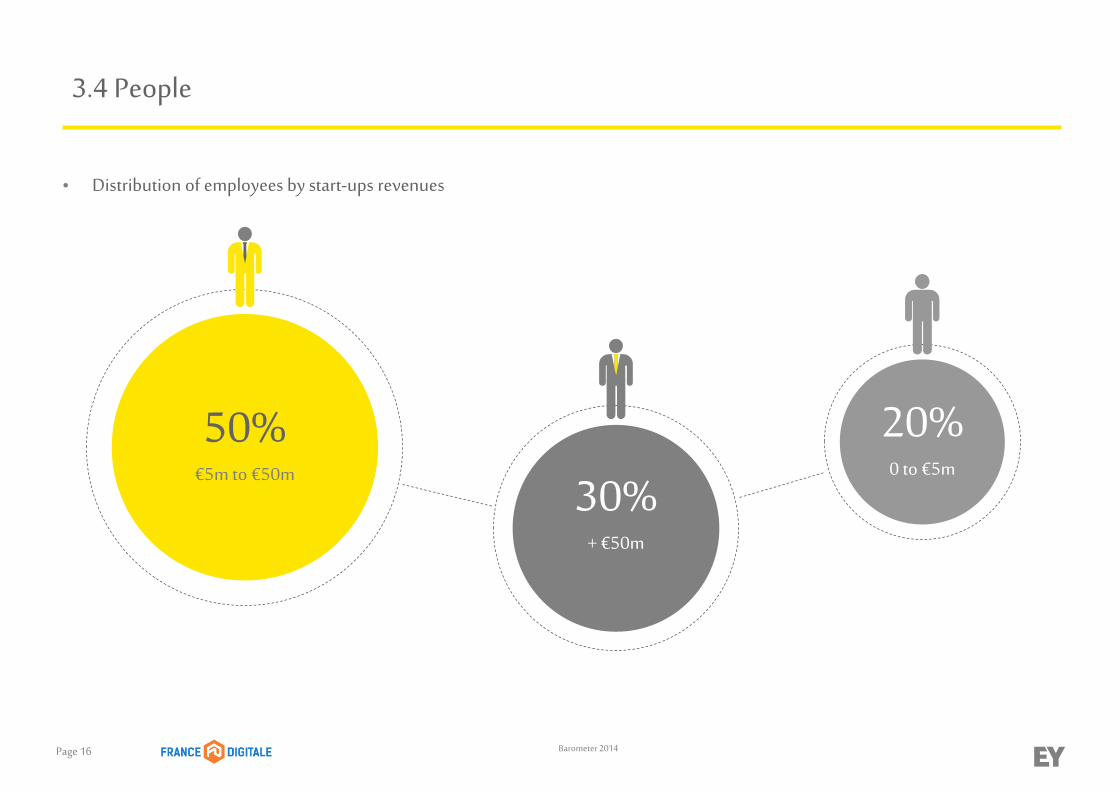
3.4 People
30%+ €50m
50%€5m to €50m
20%0 to €5m
• Distribution of employees by start-ups revenues
Page 17 Barometer 2014
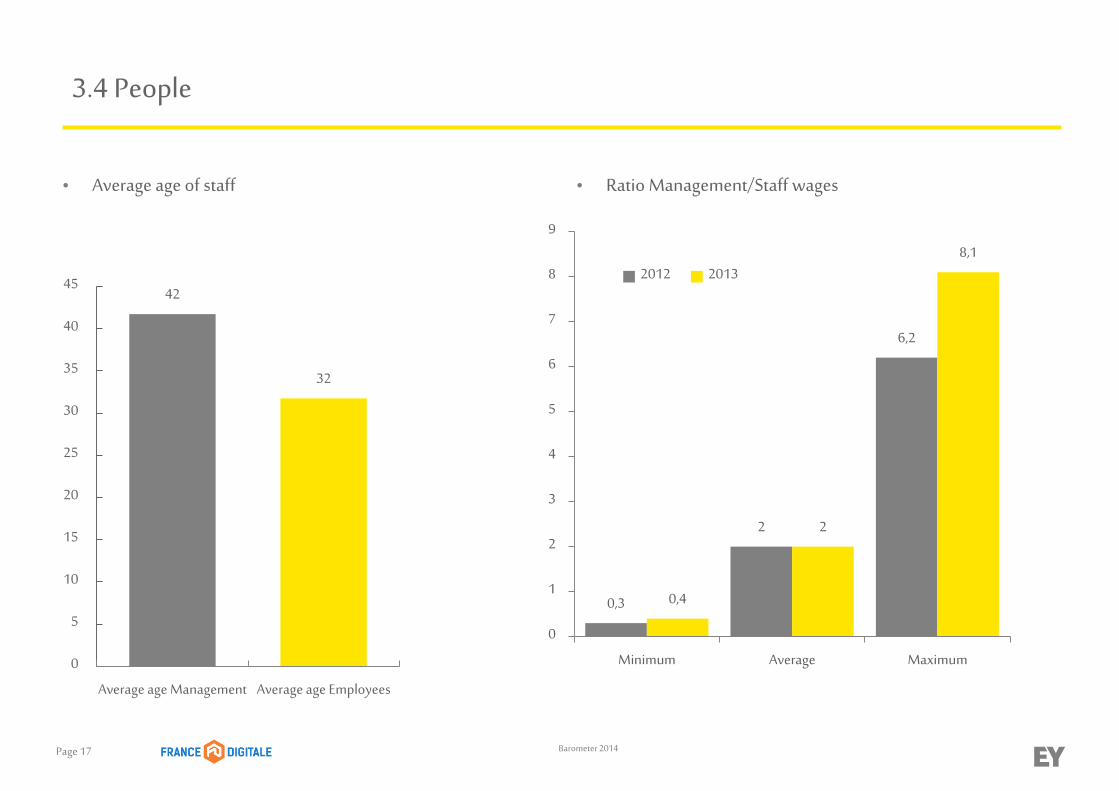
3.4 People
• Average age of staff • Ratio Management/Staff wages
42
32
0
5
10
15
20
25
30
35
40
45
Average age Management Average age Employees
0,3
2
6,2
0,4
2
8,1
0
1
2
3
4
5
6
7
8
9
Minimum Average Maximum
2012 2013
Page 18 Barometer 2014
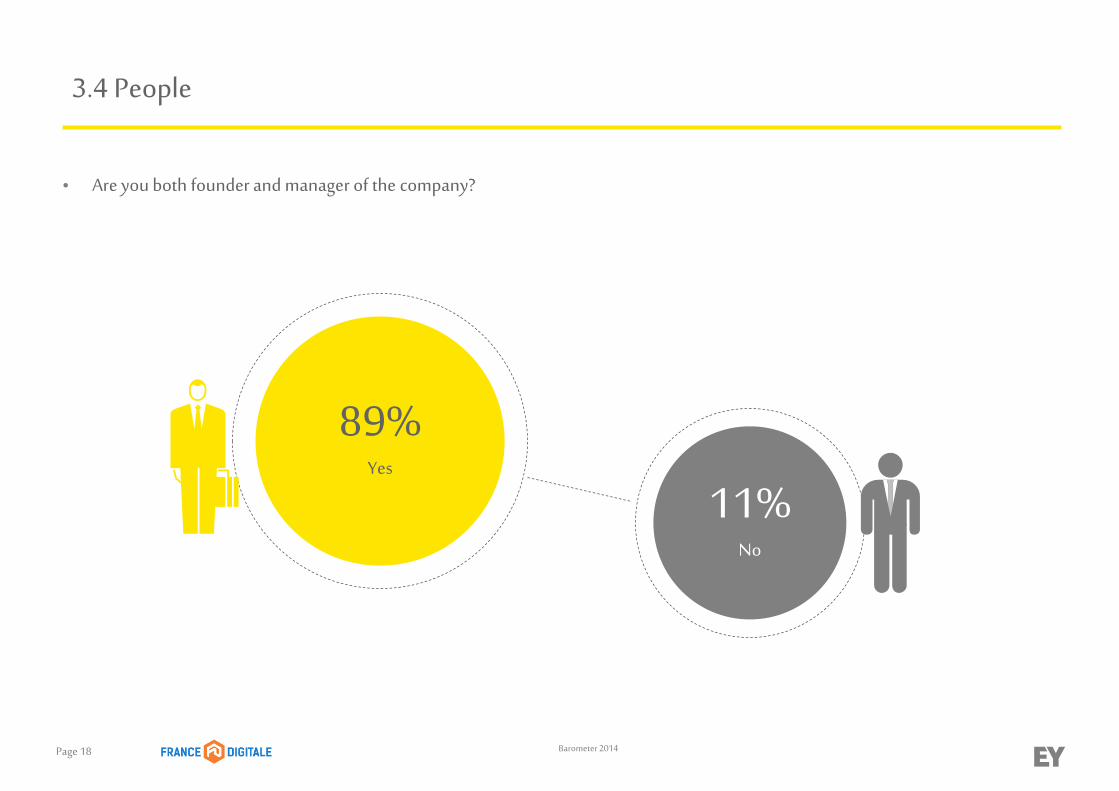
3.4 People
89%Yes
11%No
• Are you both founder and manager of the company?
Page 19 Barometer 2014
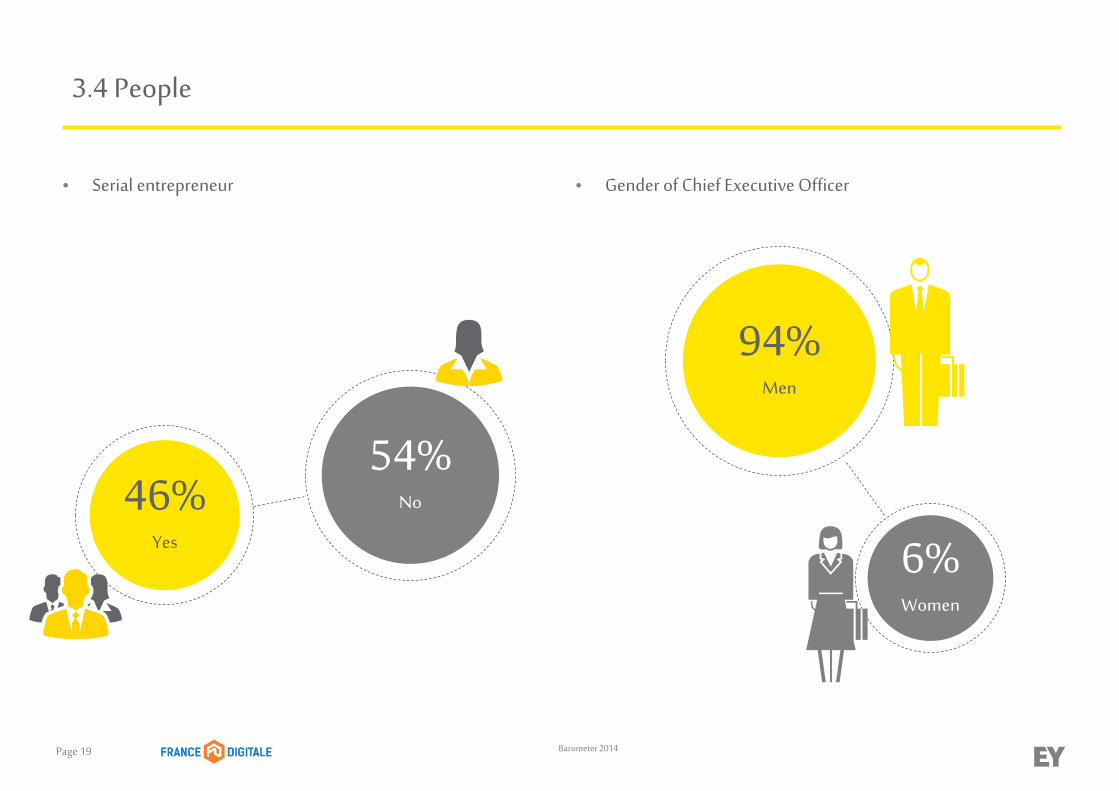
3.4 People
54%No
94%Men
46%Yes 6%
Women
• Serial entrepreneur • Gender of Chief Executive Officer
Page 20 Barometer 2014
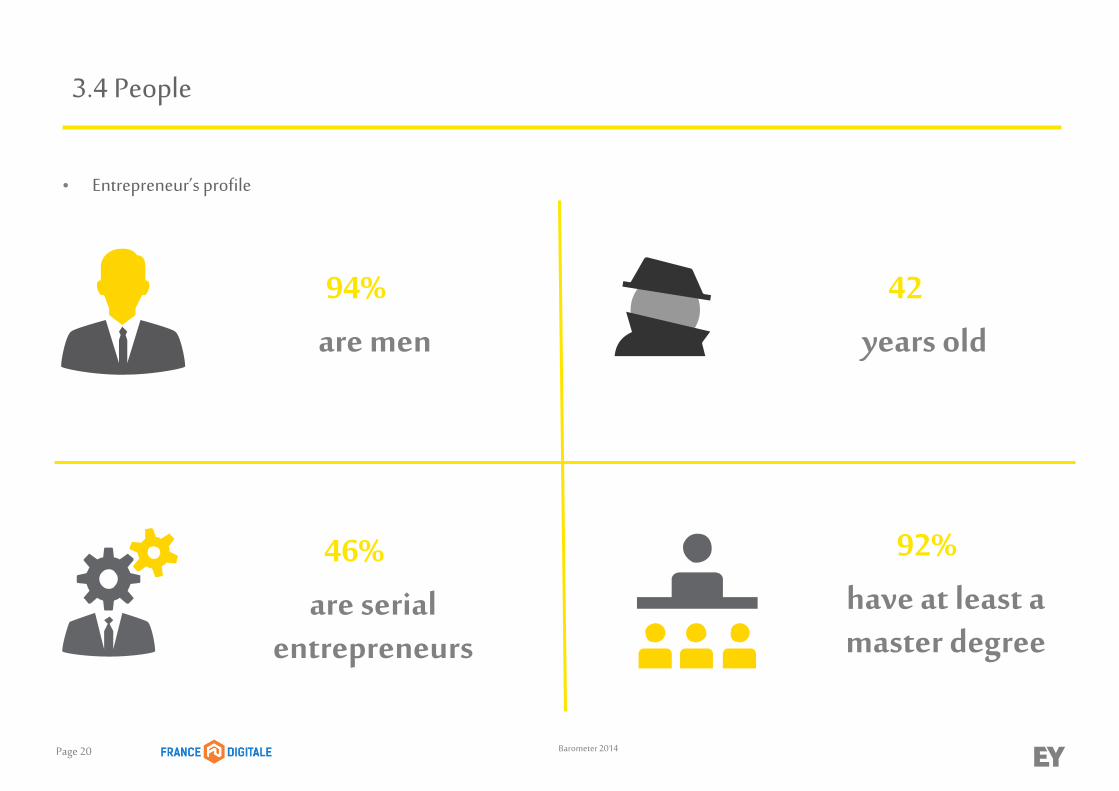
94%
are men
42
years old
46%
are serial entrepreneurs
92%
have at least a master degree
3.4 People
• Entrepreneur’s profile

Page 21 Barometer 2014
3.5 Value sharing
70%Loss
30%Gain
* Sample of 94 start-ups.
• « Earnings before interests and taxes » or EBIT*
• Percentage of positive « EBIT » by revenue segment*
12%
45%
71%
0%
10%
20%
30%
40%
50%
60%
70%
80%
0 to 5 M€ 5 to 50 M€ + 50 M€
€
Page 22 Barometer 2014
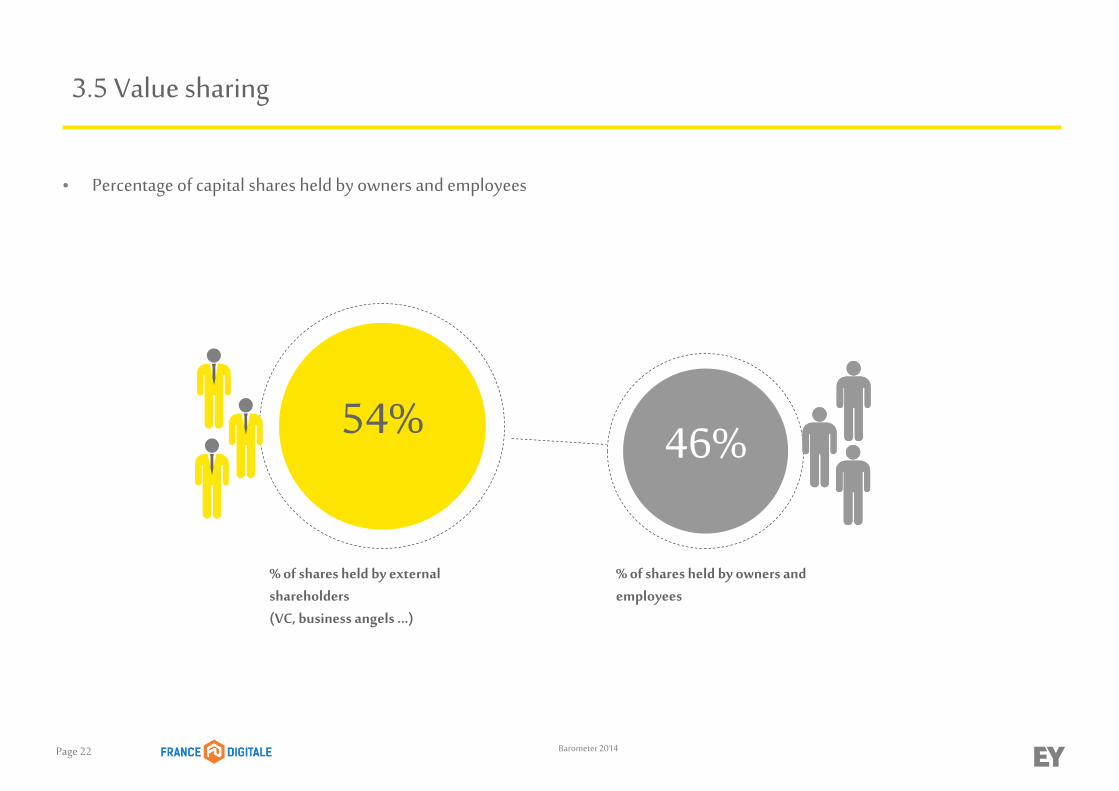
3.5 Value sharing
54% 46%
% of shares held by owners and employees
% of shares held by external shareholders (VC, business angels …)
• Percentage of capital shares held by owners and employees
Page 23 Barometer 2014
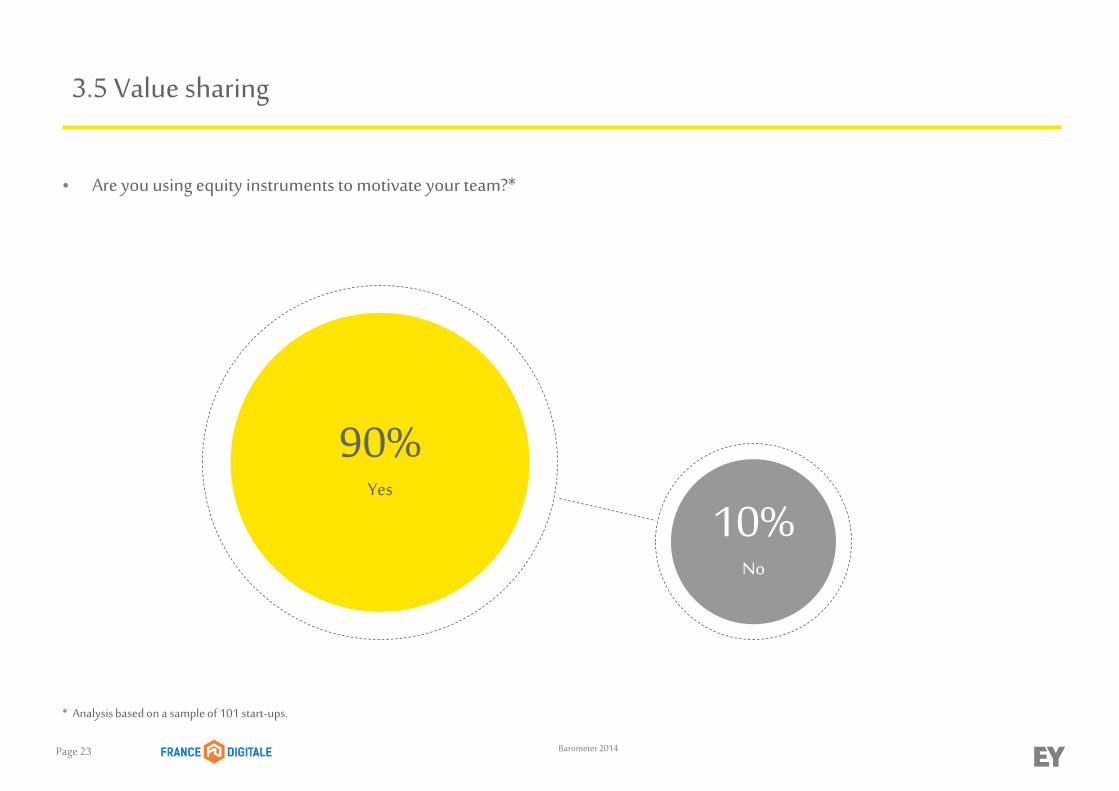
3.5 Value sharing
90%Yes
10%No
* Analysis based on a sample of 101 start-ups.
• Are you using equity instruments to motivate your team?*
Page 24 Barometer 2014
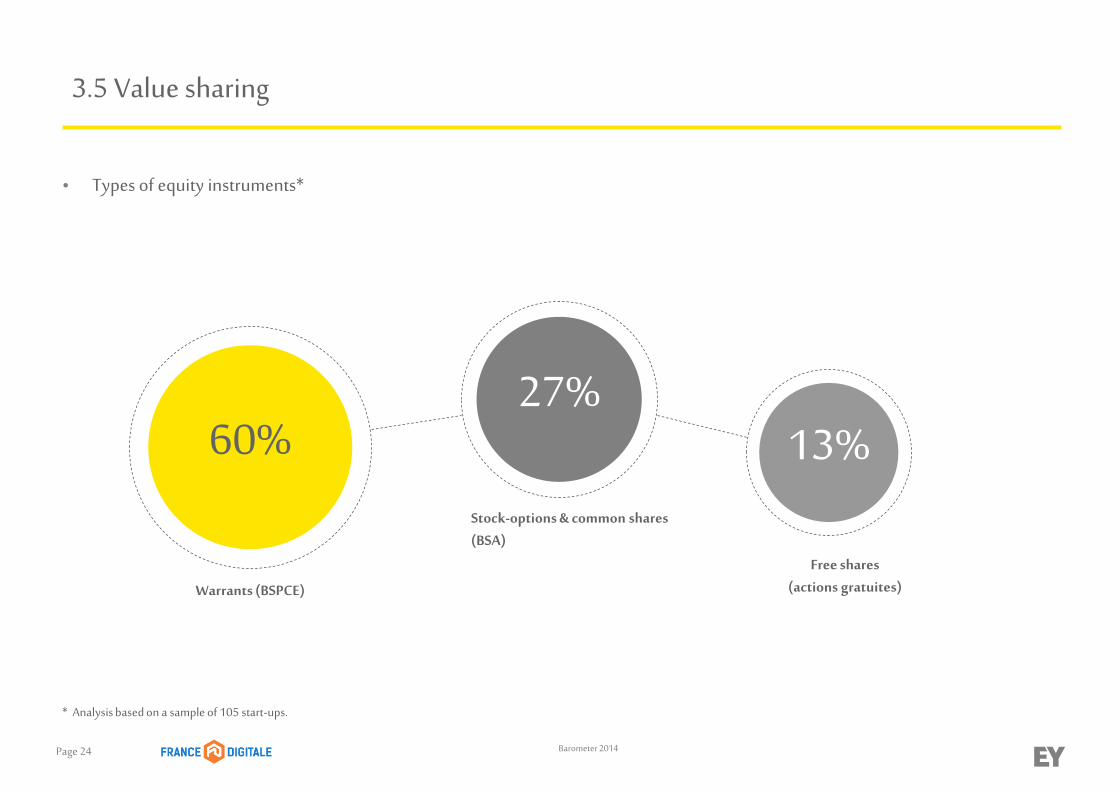
3.5 Value sharing
60%27%
13%
* Analysis based on a sample of 105 start-ups.
Warrants (BSPCE)
Free shares (actions gratuites)
Stock-options & common shares (BSA)
• Types of equity instruments*
Page 25 Barometer 2014
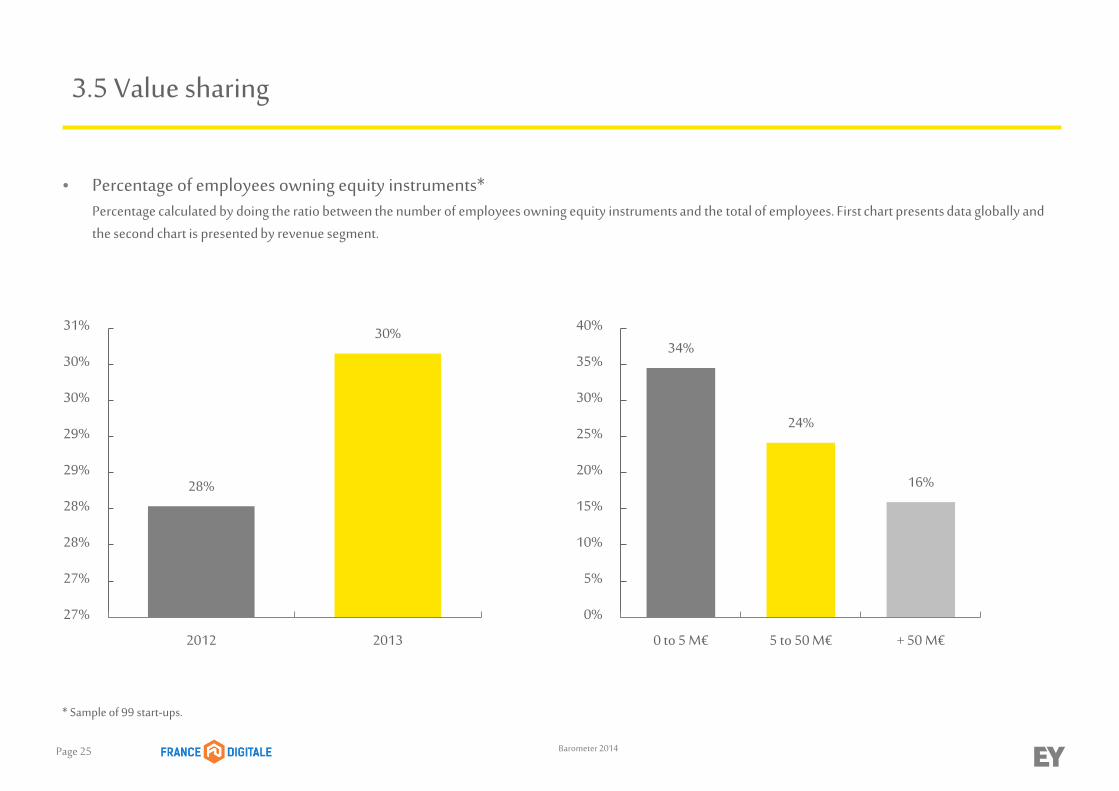
3.5 Value sharing
* Sample of 99 start-ups.
• Percentage of employees owning equity instruments*Percentage calculated by doing the ratio between the number of employees owning equity instruments and the total of employees. First chart presents data globally and the second chart is presented by revenue segment.
28%
30%
27%
27%
28%
28%
29%
29%
30%
30%
31%
2012 2013
34%
24%
16%
0%
5%
10%
15%
20%
25%
30%
35%
40%
0 to 5 M€ 5 to 50 M€ + 50 M€
Page 26 Barometer 2014
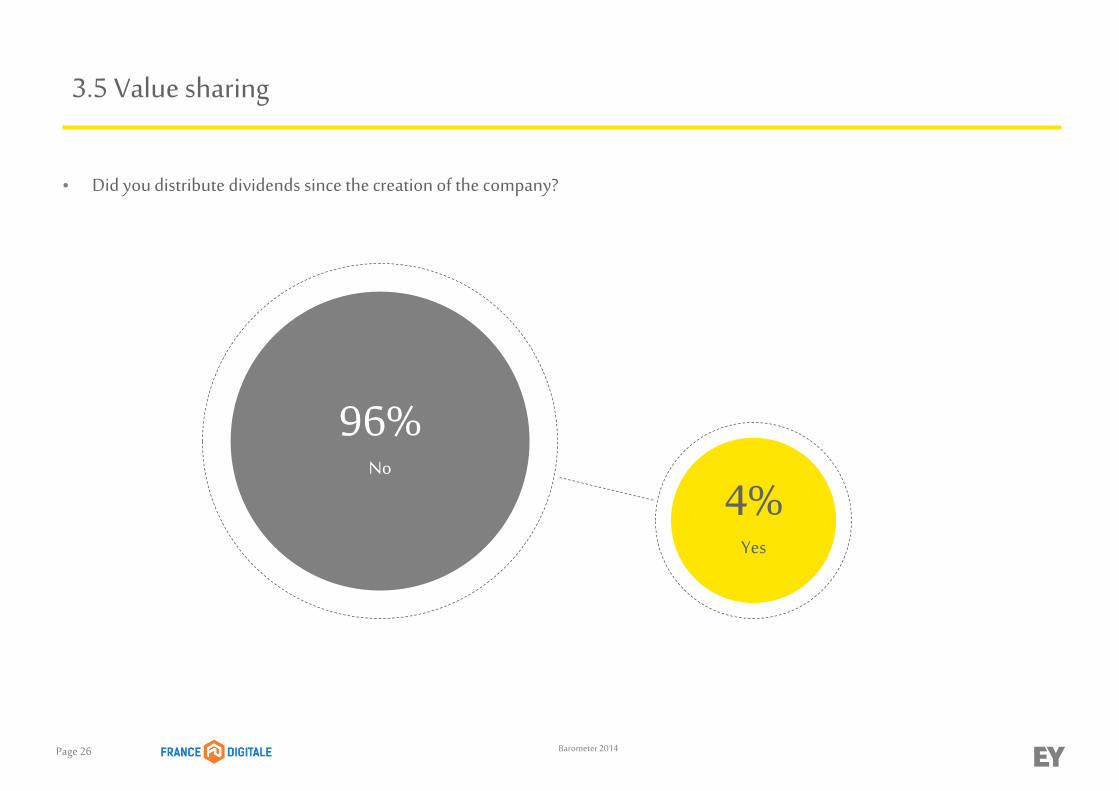
3.5 Value sharing
96%No
4%Yes
• Did you distribute dividends since the creation of the company?
Page 27
4. Contacts
Page 28
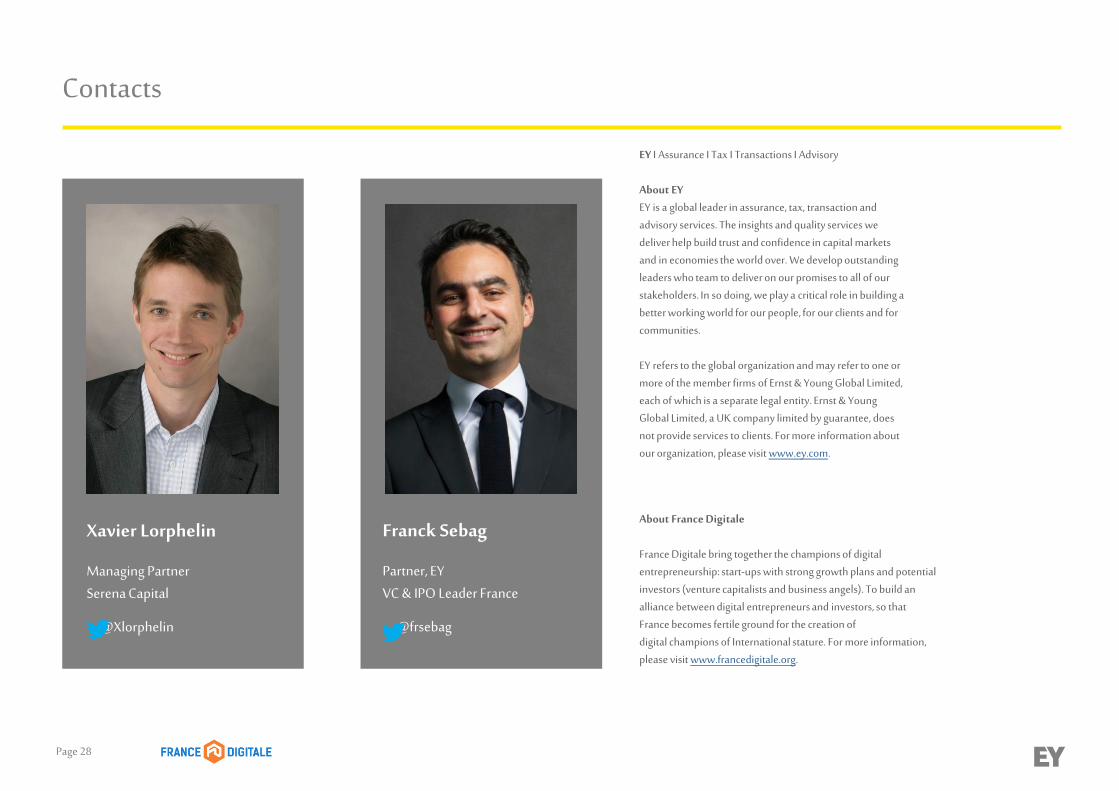
Contacts
Franck Sebag
Partner, EYVC & IPO Leader France
@frsebag
Xavier Lorphelin
Managing Partner Serena Capital
@Xlorphelin
About France Digitale
France Digitale bring together the champions of digitalentrepreneurship: start-ups with strong growth plans and potentialinvestors (venture capitalists and business angels). To build analliance between digital entrepreneurs and investors, so thatFrance becomes fertile ground for the creation ofdigital champions of International stature. For more information,please visit www.francedigitale.org.
EY I Assurance I Tax I Transactions I Advisory
About EYEY is a global leader in assurance, tax, transaction andadvisory services. The insights and quality services wedeliver help build trust and confidence in capital marketsand in economies the world over. We develop outstandingleaders who team to deliver on our promises to all of ourstakeholders. In so doing, we play a critical role in building abetter working world for our people, for our clients and forcommunities.
EY refers to the global organization and may refer to one ormore of the member firms of Ernst & Young Global Limited,each of which is a separate legal entity. Ernst & YoungGlobal Limited, a UK company limited by guarantee, doesnot provide services to clients. For more information aboutour organization, please visit www.ey.com.