Embed Size (px)
Citation preview

Trevor FetterPresident & Chief Executive Officer
Barclays Capital Global Healthcare ConferenceMiami, Florida
March 10, 2009
2
Forward-looking statementsCertain statements contained in this presentation constitute forward-looking statements. Such forward-looking statements are based on management's current expectations and involve known and unknown risks, uncertainties and other factors that may cause the Company’s actual results to be materially different from those expressed or implied by such forward-looking statements. Such factors include, among others, the following: general economic and business conditions, both nationally and regionally; industry capacity; demographic changes; changes in, or the failure to comply with, laws and governmental regulations; the ability to enter into managed care provider arrangements on acceptable terms; changes in Medicare and Medicaid payments or reimbursement, including those resulting from a shift from traditional reimbursement to managed care plans; liability and other claims asserted against the Company; competition, including the Company’s failure to attract patients to its hospitals; the loss of any significant customers; technological and pharmaceutical improvements that increase the cost of providing, or reduce the demand for, health care; a shortage of raw materials, a breakdown in the distribution process or other factors that may increase the Company’s cost of supplies; changes in business strategy or development plans; the ability to attract and retain qualified personnel, including physicians, nurses and other health care professionals, including the impact on the Company’s labor expenses resulting from a shortage of nurses or other health care professionals; the significant indebtedness of the Company; the availability of suitable acquisition opportunities and the length of time it takes to accomplish acquisitions; the Company's ability to integrate new businesses with its existing operations; and the availability and terms of capital to fund the expansion of the Company's business, including the acquisition of additional facilities. Certain additional risks and uncertainties are discussed in the Company’s filings with the Securities and Exchange Commission, including the Company’s annual report on Form 10-K and quarterly reports on Form 10-Q. Do not rely on any forward-looking statement, as we cannot predict or control many of the factors that ultimately may affect our ability to achieve the results estimated. We make no promise to update any forward-looking statement, whether as a result of changes in underlying factors, new information, future events or otherwise.
This document includes certain financial measures including such as adjusted EBITDA which are not calculated in accordance with Generally Accepted Accounting Principles (GAAP). Management recommends that you focus on the GAAP numbers as the best indicator of financial performance. These alternative measures are provided only as a supplement to aid in analysis of the Company.
Reconciliation between non-GAAP measures and related GAAP measures can be found in our Q4’08 quarterly earnings release issued on February 24, 2009.
Non-GAAP information
Forward-looking statements in this document were a part of Tenet’s Q4’08 disclosures of February 24, 2009.
This reprint is not intended as and should not be interpreted as a current reconfirmation of thoseforward-looking statements.

Revenue(2) $8.7 billion
Equity Market Value(3) $0.5 billion
Enterprise Value(4) $4.8 billion
Credit Line(5) $800 million
Corporate Governance Rankings(6)
S&P 500 Top 5%
Healthcare Industry Top 1%
Tenet at a glance
Acute Care Hospitals(1) 50
Beds(1) 13,562
Employees 60,000
US Coverage 12 states
Inpatient Admissions(2) 530,000
Outpatient Visits(2) 3.8 million
(1) Continuing operations as of December, 2008 – 50 hospitals. (2) LTM continuing operations as of December, 2008 – 50 hospitals. (3) Based on THC share price of $1.10.(4) $0.5 billion equity value plus $4.8 billion in debt less $0.5 billion in cash.(5) Borrowing availability under our revolving credit facility was $444 million at December 31, 2008.(6) Source: Risk Metrics Group (formerly ISS) as of February, 2009.
3
4
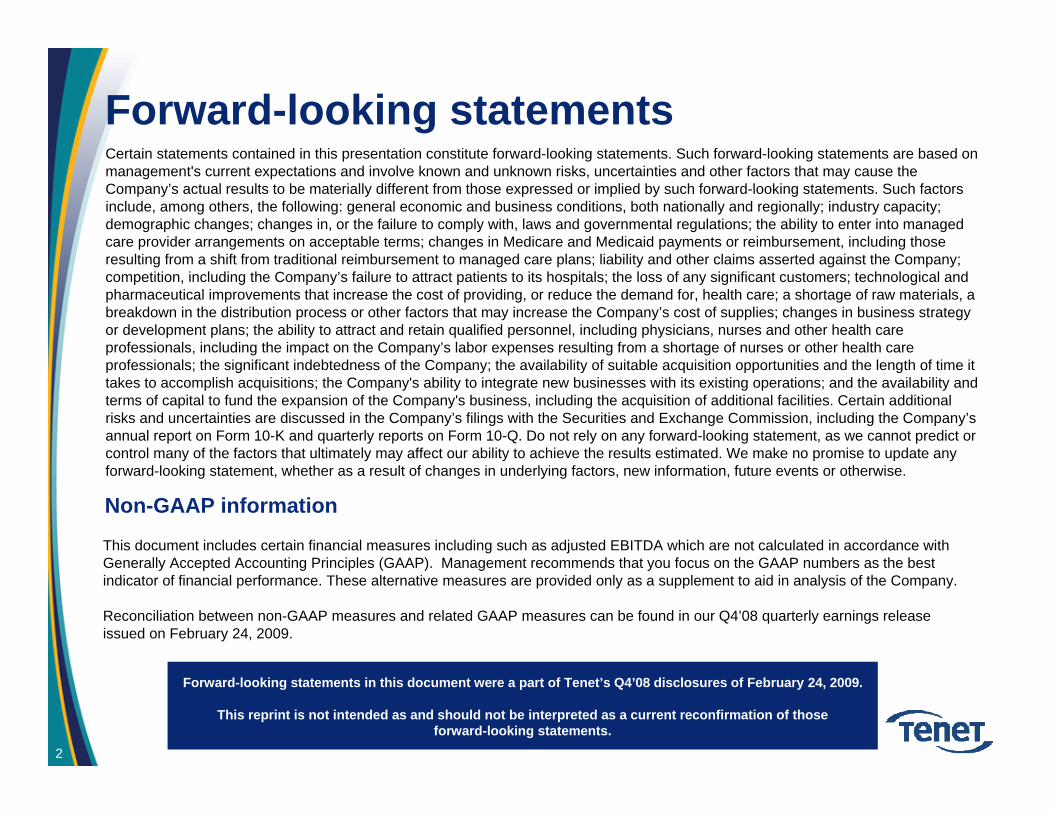
Tenet hospitals are in states with fastest growing populations
1.2%–2.8%
0.7%–1.2%
0%–0.3%
0.3%–0.7%
Population CAGR 2000-2020
• On average, States with Tenet hospitals grow twice as fast (1.4%) as the U.S. median (0.6%)
• 90% of Tenet hospitals are in states growing faster than the median
#1 or 2 in Market
Other Tenet Hospitals
Tenet States

Favorable operating trends
Volumes 1st year of positive admissions growth in 5 years 1st year of paying outpatient visit growth in 5 years
Strong commercial pricing increases
11.4% increase in adjusted EBITDA (2008 versus 2007)
20% normalized for Medicaid reductions
Cash consumption reduced by 55% (2008 versus 2007)
0.8% growth in controllable operating costs PAPD (Q408 same-hospital)
Pricing
Costs
Adjusted EBITDA
Free Cash Flow
5
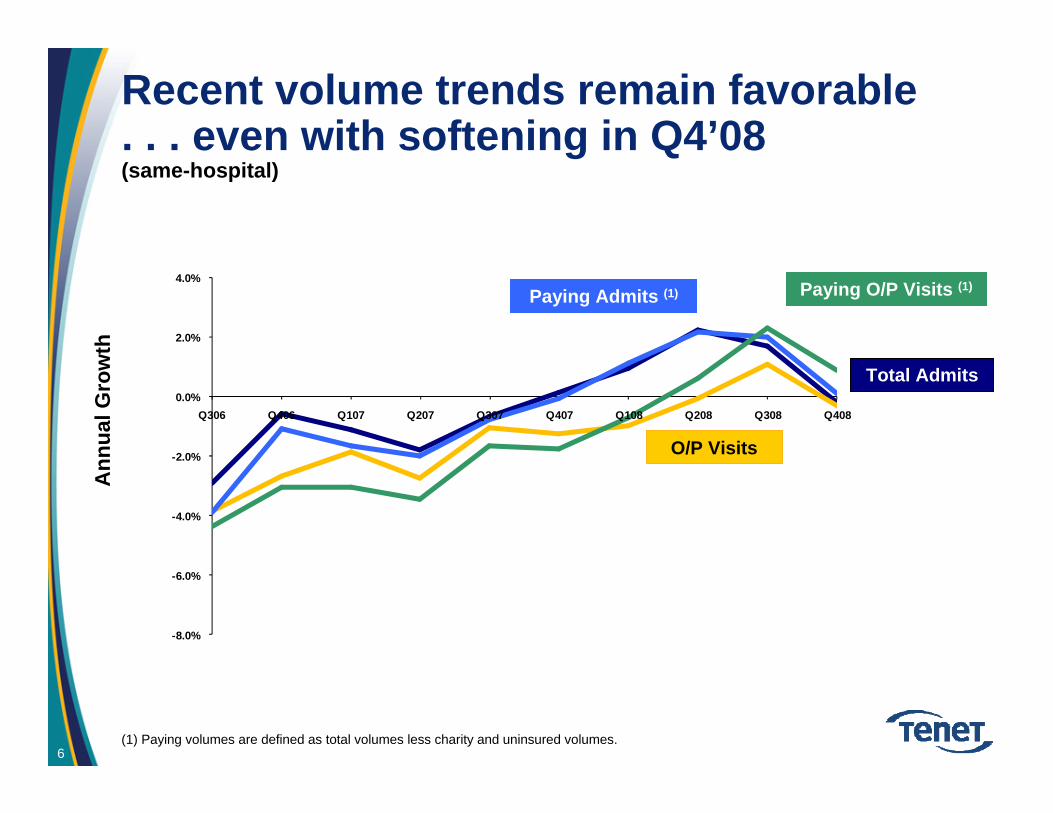
Recent volume trends remain favorable . . . even with softening in Q4’08(same-hospital)
-8.0%
-6.0%
-4.0%
-2.0%
0.0%
2.0%
4.0%
Q306 Q406 Q107 Q207 Q307 Q407 Q108 Q208 Q308 Q408
Ann
ual G
row
th
O/P Visits
Total Admits
Paying Admits (1) Paying O/P Visits (1)
(1) Paying volumes are defined as total volumes less charity and uninsured volumes. 6

Favorable operating trends
Volumes 1st year of positive admissions growth in 5 years 1st year of paying outpatient visit growth in 5 years
Strong commercial pricing increases
11.4% increase in adjusted EBITDA (2008 versus 2007)
20% normalized for Medicaid reductions
Cash consumption reduced by 55% (2008 versus 2007)
0.8% growth in controllable operating costs PAPD (Q408 same-hospital)
Pricing
Costs
Adjusted EBITDA
Free Cash Flow
7

$10,286 $10,260
$10,512
$10,685 $10,665$10,792 $10,742
$10,851
$11,052
$9,000
$9,500
$10,000
$10,500
$11,000
$11,500
Q4 Q1 Q2 Q3 Q4 Q1 Q2 Q3 Q4
Pricing continues to strengthen(same-hospital)
$582
$601
$643 $646$653
$687$692 $691
$627
$500
$600
$700
Q4 Q1 Q2 Q3 Q4 Q1 Q2 Q3 Q4
Net Inpatient Revenue per Admission Net Outpatient Revenue per Visit
2006 2007 2006 20072008 2008
3.7% CAGR 9.0% CAGR
8

Favorable operating trends
Volumes 1st year of positive admissions growth in 5 years 1st year of paying outpatient visit growth in 5 years
Strong commercial pricing increases
11.4% increase in adjusted EBITDA (2008 versus 2007)
20% normalized for Medicaid reductions
Cash consumption reduced by 55% (2008 versus 2007)
0.8% growth in controllable operating costs PAPD (Q408 same-hospital)
Pricing
Costs
Adjusted EBITDA
Free Cash Flow
9

Cost control has been excellent
Controllable Expenses(1) per Adjusted Patient Day
(1) Same-hospital controllable expenses defined as SWB, supplies, and other operating expenses.
0.8
4.1
2.6
1.8
4.03.9
5.1
6.66.3
3.53.9
4.8
0%
2%
4%
6%
8%
Q1 Q2 Q3 Q4 Q1 Q2 Q3 Q4 Q1 Q2 Q3 Q4
Y-o-
Y G
row
th
Average = 4.0%
2006 2007 2008
10

Favorable operating trends
Volumes 1st year of positive admissions growth in 5 years 1st year of paying outpatient visit growth in 5 years
Strong commercial pricing increases
11.4% increase in adjusted EBITDA (2008 versus 2007)
20% increase normalized for Medicaid reductions
Cash consumption reduced by 55% (2008 versus 2007)
0.8% growth in controllable operating costs PAPD (Q408 same-hospital)
Pricing
Costs
Adjusted EBITDA
Free Cash Flow
11

Same hospital EBITDA has been expanding
$491
$606$659
$752
$0$100$200$300$400$500$600$700$800
2005 2006 2007 2008
12
$ millions

Favorable operating trends
Volumes 1st year of positive admissions growth in 5 years1st year of paying outpatient visit growth in 5 years
Strong commercial pricing increases
11.4% increase in adjusted EBITDA (2008 versus 2007)
20% normalized for Medicaid reductions
Cash consumption reduced by 55% (2008 versus 2007)
Pricing
Costs
Adjusted EBITDA
Free Cash Flow
13
0.8% growth in controllable operating costs PAPD (Q408 same-hospital)
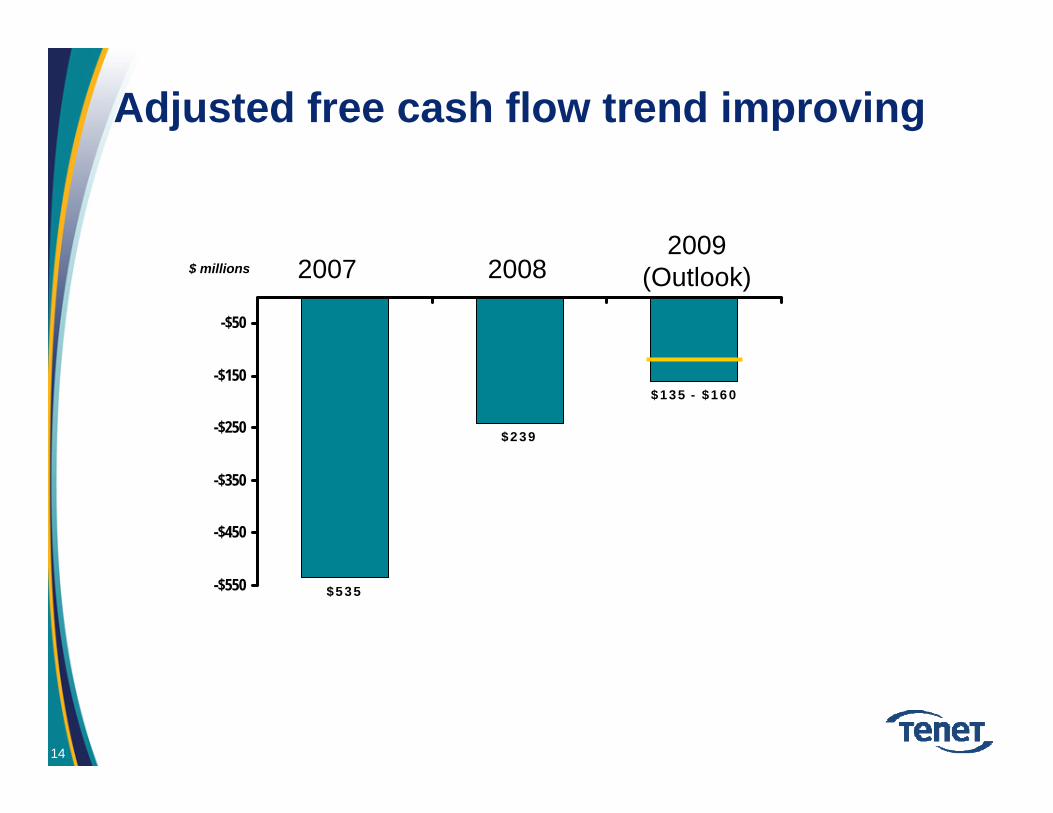
Adjusted free cash flow trend improving
$135 - $160
$239
$535-$550
-$450
-$350
-$250
-$150
-$50
$ millions 2007 20082009
(Outlook)
14

Near-term debt maturities extended
(millions)
$0
$200
$400
$600
$800
$1,000
$1,200
2008 2009 2010 2011 2012 2013 2014 2015 2018 ––– 2031
Dec 1 Feb 1
July 1
Feb 1Nov 15
June 1Maturity Date:
6.375 %
6.5 %
7.375 % 9.875 %
9.25 %
6.875 %
May 1 May 1
10 %9 %
15

Addressing volume growth through multiple, interrelated initiatives
C2Q – (Commitment To Quality)• Superior quality enhances Tenet’s value proposition to:
• Physicians• Patients• Payers
PRP – (Physician Relationship Program)• Physician – recruitment, redirection and hiring
TGI – (Targeted Growth Initiative)• Target service lines with attractive:
• Profitability• Growth prospects• Under-served by competitors
16

C2Q – Quality differentiates Tenet’s value proposition CMS Core Measures (Overall- AMI,HF,PN,SCIP)
Notes: CMS Hospital Compare website. SCIP measures added beginning Q106-Q406. SCIP-4 and SCIP-6 added beginning Q207-Q108. Tenet results include current core hospital profile as of Dec 2008. Coastal Carolina not included prior to Q307-Q208 data point.
TenetNational Average
17

Addressing volume growth through multiple, interrelated initiatives
C2Q – (Commitment To Quality)• Superior quality enhances Tenet’s value proposition to:
• Physicians• Patients• Payers
PRP – (Physician Relationship Program)• Physician – recruitment, redirection and hiring
TGI – (Targeted Growth Initiative)• Target service lines with attractive:
• Profitability• Growth prospects• Under-served by competitors
18

PRP – 17.0% net growth in active physicians since January 2007
(1) Includes 166 physicians with existing privileges at other Tenet hospitals, primarily in El Paso.(2) Includes 103 physicians with existing privileges at other Tenet hospitals, primarily in El Paso.
2007 2008
11,603Active(1/1/07)
1,744(1)(898)
12,449Active(12/31/07)
2,068 (2)(946)
Net Growth of 846 or 7.3%
13,571Active(12/31/08)
Class of 2007
Class of 2008
Net Growth of 1,122 or 9.0%
Act
ive
phys
icia
ns
19

Addressing volume growth through multiple, interrelated initiatives
C2Q – (Commitment To Quality)•Superior quality enhances Tenet’s value proposition to:
• Physicians• Patients• Payers
PRP – (Physician Relationship Program)•Physician – recruitment, redirection and hiring
TGI – (Targeted Growth Initiative)•Target service lines with attractive:
• Profitability• Growth prospects• Under-served by competitors
20
-6%
-4%
-2%
0%
2%
4%
6%
8%
10%
12%
14%
Q1 Q2 Q3 Q4 Q1 Q2 Q3 Q4 Q1 Q2 Q3 Q4
Y-o-
Y C
hang
e
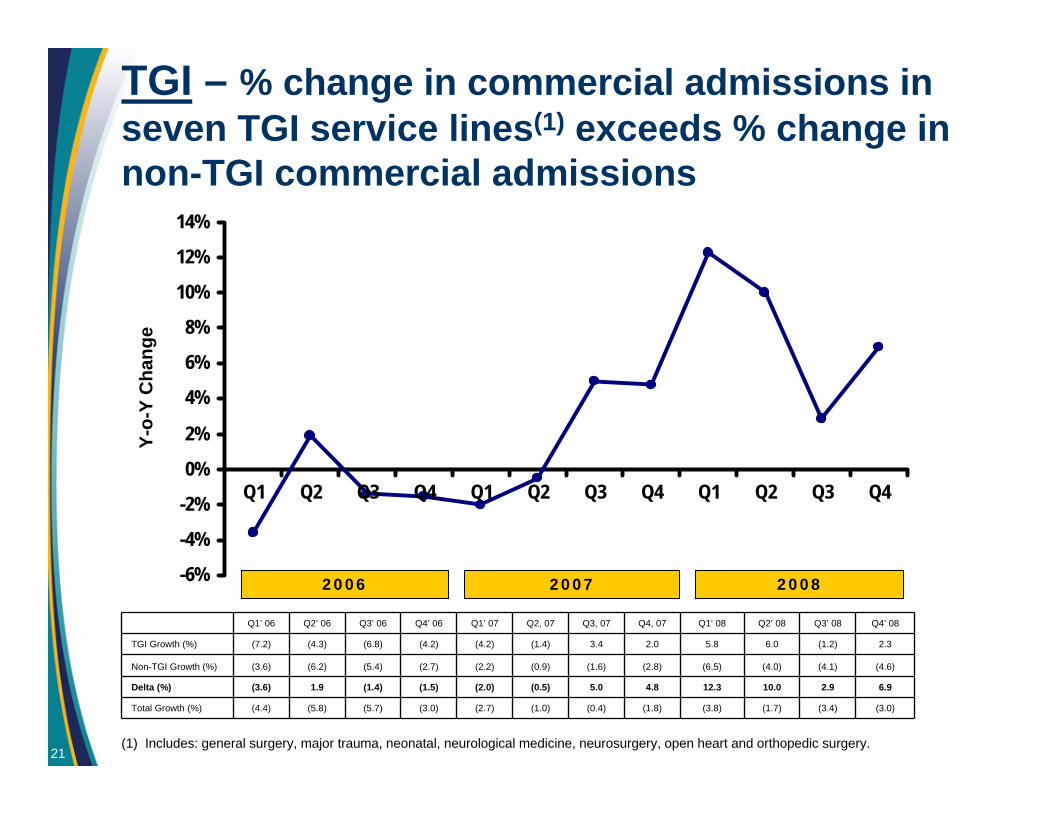
(1) Includes: general surgery, major trauma, neonatal, neurological medicine, neurosurgery, open heart and orthopedic surgery.
Q1’ 06 Q2’ 06 Q3’ 06 Q4’ 06 Q1’ 07 Q2, 07 Q3, 07 Q4, 07 Q1’ 08 Q2’ 08 Q3’ 08 Q4’ 08
TGI Growth (%) (7.2) (4.3) (6.8) (4.2) (4.2) (1.4) 3.4 2.0 5.8 6.0 (1.2) 2.3
Non-TGI Growth (%) (3.6) (6.2) (5.4) (2.7) (2.2) (0.9) (1.6) (2.8) (6.5) (4.0) (4.1) (4.6)
Delta (%) (3.6) 1.9 (1.4) (1.5) (2.0) (0.5) 5.0 4.8 12.3 10.0 2.9 6.9
Total Growth (%) (4.4) (5.8) (5.7) (3.0) (2.7) (1.0) (0.4) (1.8) (3.8) (1.7) (3.4) (3.0)
2006 2007 2008
TGI – % change in commercial admissions in seven TGI service lines(1) exceeds % change in non-TGI commercial admissions
21

Biggs PorterChief Financial Officer

23
2009 adjusted EBITDA walk-forward(Continuing operations)
Line#
($mm)Revenue Cost Adjusted
EBITDA1 2008 8,663 (7,931) 732
2 Volume – assuming constant mix (a) 61 (37) 24
3 – impact from adverse mix shift (37) (6) (43)
4 Pricing – Base Line Increase (b) 303 (28) 275
5 - Managed Care (c) 43 - 43
6 Costs – Base Line Inflation (d) - (298) (298)
7 - Cost Reduction Initiatives (e) - 150 150
8 Bad Debt – impact of rate differential only (f) - (110) (110)
9 Other (g) 57 (30) 27
10 Total – Upper End of Adjusted EBITDA Range 9,090 (8,290) 800
11 Allowance for Risk (h) (65)
12 Total – Lower End of Adjusted EBITDA Range 735
(a) Assumes admissions growth of 0.8% and outpatient visit growth of 0.5%, using 2008 average pricing. Margin assumption on incremental revenues 40%.(b) Base line pricing increases of 3.5%. This assumption is before discrete initiatives valued in this analysis.(c) Rate parity price increases in existing contracts and anticipated future increases plus $7mm from P4P payments.(d) Inflation rate of 4.0% reflects normal merit increases, union contract adjustments, supply cost increases and other items before discrete initiatives valued
in this analysis.(e) Full year impact of cost initiatives initiated in late 2008; malpractice reductions; plus original $29mm in 2008’s estimates as previously disclosed(f) Assumes 2009 bad debt ratio of approximately 8.5%, a 90 basis point increase over our Q4’07 bad debt ratio of 7.6%. Bad debt ratio was 7.3% in 2008.(g) Includes impact of Sierra Providence East Medical Center (El Paso) and Coastal Carolina Hospital.(h) Various risks including volume growth, volume mix, and bad debt create at least $65 million in uncertainties for 2009 performance.
This schedule is not intended to provide a series of spot estimates or line item guidance. Other combinations of line item performance could produce the same or higher or lower results.
2009 outlook – cost efficiencies
• Total cost efficiencies of $150mm(1)
– $75mm in Salaries, Wages & Benefits
– $25mm in non-SW&B overhead
– $50mm in other controllable costs and supplies
(1) $150mm in incremental cost efficiencies are projected to be partially offset by merit increases, supply cost increases, and other forms of inflation.
24

25
Summary
• Significant momentum in key initiatives:– 17% growth in active medical staff
– $150 million in incremental cost efficiencies
– Continued pricing growth
– Quality differentiation
– Strengthened balance sheet with improved liquidity