Embed Size (px)
Citation preview

1

Presentation By:-
o Lubna Shehzadi (S2F13MCOM0031)
o Humaira Shamshad (S2F13MCOM0006)
o Saira Azam (S2F13MCOM0034)
o Asma Tahir (S2F13MCOM0064)
University of Central Punjab
2
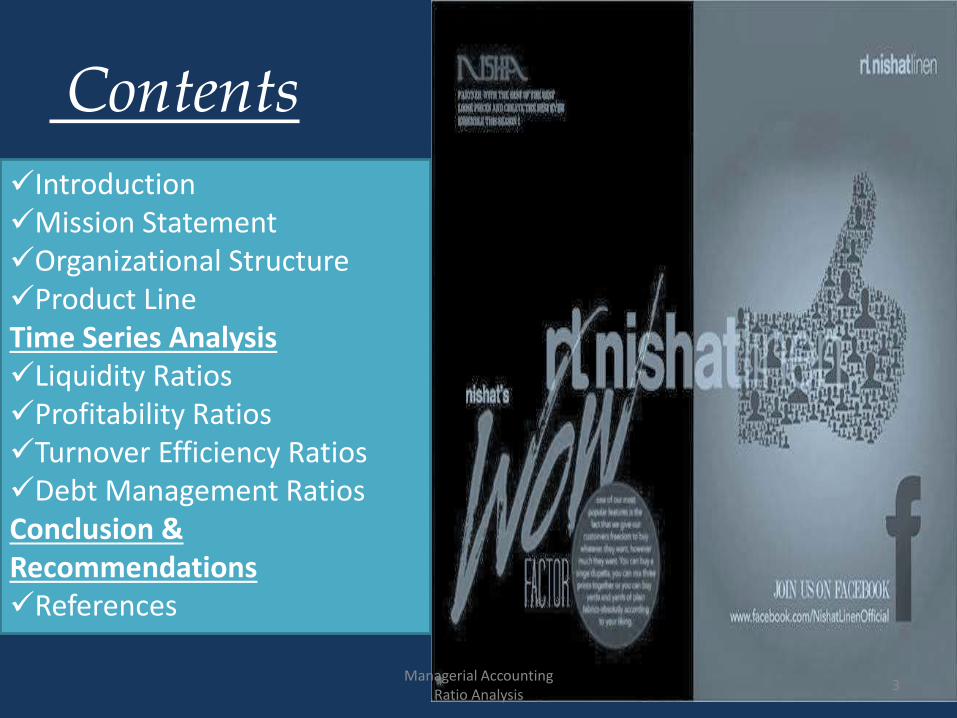
IntroductionMission StatementOrganizational StructureProduct LineTime Series AnalysisLiquidity RatiosProfitability RatiosTurnover Efficiency RatiosDebt Management RatiosConclusion & RecommendationsReferences
Contents
3Managerial Accounting
Ratio Analysis

Introduction
Nishat Mills Limited is the flagship company of Nishat Group.
It was established in 1951.
It is one of the most modern, largest vertically integrated
textile company in Pakistan with annual turnover of $575
million.
Due to the application of prudent management policies,
consolidation of operations, a strong balance sheet and an
effective marketing strategy, the growth trend is expected to
continue in the years to come.
4Managerial Accounting
Ratio Analysis

Mission Statement
To provide quality products to customers and explore new
markets to promote/expand sales of the Company through good
governance and foster a sound and dynamic team, so as to
achieve optimum prices of products of the Company for
sustainable and equitable growth and prosperity of the Company.
Managerial Accounting Ratio Analysis
5

Organizational Structure
6
CEO
Executive director Home Textile Division
Marketing Manager
GM Marketing
Technical Director
Processing
Sales
Deputy Manager
Stitching

Board of Directors
1 Mian Umer Mansha
Chief
Executive
Officer
2 Mian Hassan Mansha Chairmn
3 Mr. Khalid Qadeer Qureshi Director
4 Mr. Saeed Ahmed Alvi Director
5 Syed Zahid Hussain
Director
(Nomine
e NIT)
6 Ms. Nabiha Shahnawaz Cheema Director
7 Mr. Maqsood Ahmad Director
7

Product Line
8
The Company also has the most modern textile dyeing and processing units, 2
stitching units for home textile, one stitching unit for garments and Power
Generation facilities.
The Company's production facilities comprise of :
• Spinning
• Weaving
• Processing
• Stitching and
• Power generation.

Product Line
Managerial Accounting Ratio Analysis
9
Weavin
g
Stitching
Power generation
Spinning & Processing

Presented by:
Humaira Shamshad (S2F13MCOM0006)
10Managerial Accounting
Ratio Analysis

Ratio analysis is used to evaluate relationships among financial statement items. The ratios are used to identify trends over time for one company or to compare two or more companies at one point in time. Financial statement ratio analysis focuses on four key aspects of a business:
• Liquidity Ratios
• Profitability Ratios
• Debt Management Ratios
• Activity Ratios11
Managerial Accounting Ratio Analysis

Ratios 2012 2013
Current Ratio 1.3 1.5
Quick Ratio 0.67 0.89
Inventory turnover ratio 3.9 4.20
Average Collection Period 28.3 days 33.8 days
Average Payment Period 32.5 days 30.2 days
Total Asset turnover Ratio 79.3% 65%
Debt Ratio 33.3% 27%
Time Interest earned ratio 3.31 4.93
Gross Profit Ratio 15.11% 17.3%
Operating Profit Ratio 13% 15.2%
Net Profit Ratio 7.8% 11.2%
Return On Equity 9.34% 9.9%
Return On Asset 6.23% 7.3%
Earnings Per Share 10.04 16.63
Basic earning Power 10.3% 9.89%
Trend Analysis Nishat Mills LTD.
12Managerial Accounting
Ratio Analysis

Current Ratio Current Ratio = Current Assets/ Current Liabilities
It measures whether or not a company has enough cash or liquid assets to pay its current liability over the next fiscal year. Nishat mills Ltd.’s current ratio has slightly improved in 2013 as compared to 2012 .
2012= 1.3:1 , 2013=1.5 :1
Liquid Ratio Liquid Ratio = Quick Assets/ Current Liabilities
The true liquidity refers to the ability of a firm to pay its short term obligations as and when they become due.A standard of 1:1 absolute liquidity ratio is considered an acceptable norm.Nishat Mills Ltd.’s liquid ratio has slightly improved in 2013 as compared to 2012.2012= 0.67:1 , 2013=0.89 :1
Liquidity Ratios
13Managerial Accounting
Ratio Analysis
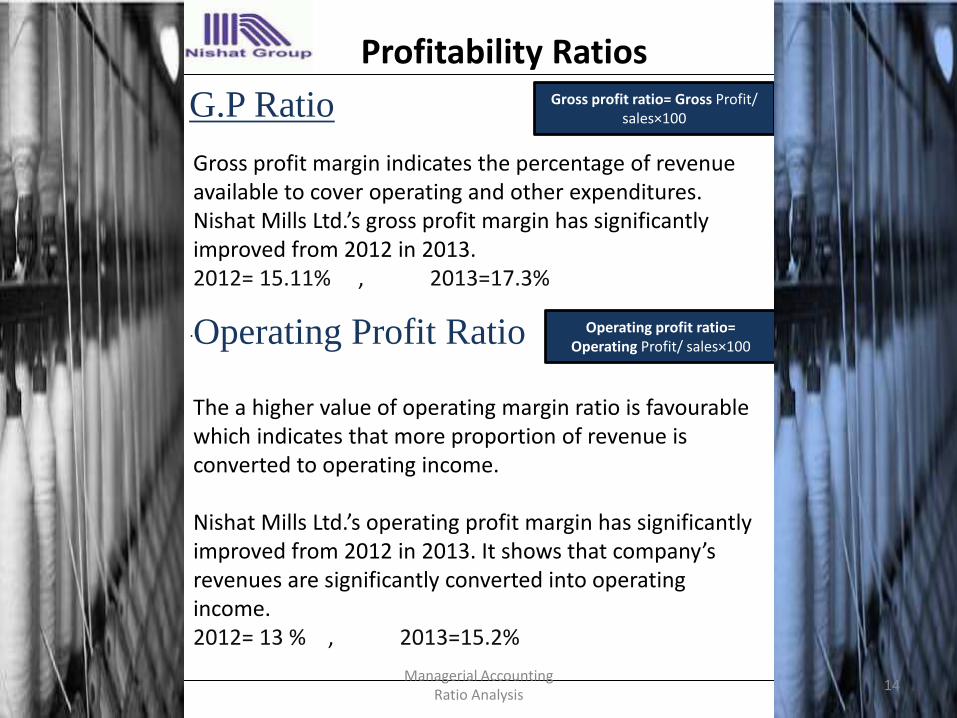
G.P Ratio Gross profit ratio= Gross Profit/ sales×100
Operating Profit Ratio
Gross profit margin indicates the percentage of revenue available to cover operating and other expenditures. Nishat Mills Ltd.’s gross profit margin has significantly improved from 2012 in 2013.2012= 15.11% , 2013=17.3%
. Operating profit ratio= Operating Profit/ sales×100
The a higher value of operating margin ratio is favourable which indicates that more proportion of revenue is converted to operating income.
Nishat Mills Ltd.’s operating profit margin has significantly improved from 2012 in 2013. It shows that company’s revenues are significantly converted into operating income.2012= 13 % , 2013=15.2%
Profitability Ratios
14Managerial Accounting
Ratio Analysis

Net profit Ratio Net profit Ratio= Net Income / sales×100
An indicator of profitability, calculated as net income divided by revenue. Company’s net profit improved from 2012. It shows that company has generated more profit as compare to previous year.2012= 7.8% , 2013=11.2%
Return on AssetsROA= Net Income / Total Assets×100
ROE indicates the profit generated by the total assets employed. A higher ratio reflects a more effective employment of company assets.
Nishat Mills Ltd.’s return on Asset has improved from 2012 in 2013. Company’s assets are more efficient in generating profits.2012= 6.23% , 2013=7.3%
15Managerial Accounting
Ratio Analysis

Presented by:
Saira Azam (S2F13MCOM0034)
16Business Finance
Ratio Analysis

Return on Equity Return on Equity = Net Income / Shareholder's Equity
Return on equity reveals how much profit a company earned in comparison to the total amount of shareholder equity found on the balance sheet.The normal benchmark for ROE figure is 12% and above. Companies that could generate ROE of 15% or more are considered as very good investment. Nishat Mills Ltd.’s return on equity has improved from 2012 in 2013. But it is not so good because it is below 12%.2012= 9.34% , 2013=9.9%
Earning Per Share Return on Equity = E.A.C.S / No.ofoutstanding shares
Earnings per share calculate that how much a share earns. It is calculated by dividing E.A.C.S to No. of outstanding shares. Company’s shares are generating more profit than they were in 2012. So earnings per share have improved in 2013.2012= 10.04 , 2013=16.63
17Business Finance
Ratio Analysis

Basic Earning Power BEP = EBIT/ Total Assets×100
BEP is calculated by dividing EBIT to Total Assets.This Ratio shows the raw earning power of the firm’s assets, before the influence of taxes and leverage, and it is useful when comparing firms with different degree of financial leverage and tax situations.Company’s BEP has deteriorated in 2013 than it was in 2012.2012= 10.3% , 2013=9.89%
18Managerial accounting
Ratio Analysis

Debt Ratio
Debt Ratio = Total Debts/ Total Assets×100
Debt Management Ratios
The debt ratio calculates the percent of assets provided by creditors. It is calculated by dividing total debt by total assets. Total debt is the same as total liabilities. Nishat mills Ltd.'s debt ratio is better in 2013. Now outside claims over equity are less than in 2012.2012= 33.3% , 2013=27%
Time Interest Earned Ratio
TIE= EBIT/ Interest Expense
The TIE is an indicator of the company's ability to pay interest as it comes due. It is calculated by dividing earnings before interest and taxes (EBIT) by interest expense. In 2013 company’s ability to pay interest has improved than it was in 2012.2012= 3.31 times , 2013=4.93 times
19Managerial Accounting
Ratio Analysis

Presented by
Asma Tahir (S2F13MCOM0064)
20Business Finance
Ratio Analysis

Inventory Turnover Ratio
Inventory Turnover Ratio =CGS/Avg.Inventory
Activity Ratios
Avg. Collection Period
Avg. Collection period= avg. Acc. Receviables/ Sales
per day
An activity ratio calculated as cost of goods sold divided by inventory. Nishat mills Ltd.'s inventory turnover ratio has significantly improved in 2013 as compared to 2012.2012= 3.9 times , 2013=4.20 times
An activity ratio equal to the number of days in the period divided by receivables turnover. Nishat mills Ltd.'s average collection period was better in 2012 than in 2013.2012= 28.3 days , 2013= 33.8 days
21Managerial Accounting
Ratio Analysis
Avg.Collection Period

Avg. Payment Period
Total Asset Turnover Ratio Total Asset Turnover Ratio=
sales/ Total Assets×100
Avg. payment period= avg.Acc.payables/ purchases per day
An estimate of the average number of days it takes a company to pay its suppliers; equal to the number of days in the period divided by payables turnover ratio for the period. Nishat mills Ltd.'s average payment period is better in 2013 than in 2012. Now company is in a strong position to pay off its debt in minimum time period.2012= 32.5 days , 2013=30.2 days
The asset turnover ratio measures how efficiently a company is using its assets. The turnover value varies by industry. It is calculated by dividing net sales by total assets. Nishat mills Ltd.'s assets were generating more sales in 2012 than 2013. So efficiency has deteriorated in 2013.2012= 79.3% , 2013= 65%
22Managerial AccountingRatio Analysis

23Managerial Accounting
Ratio Analysis
Conclusion & Recommendations
From above discussion, we may conclude that liquidity ratios are improved in 2013 as
compared
to 2012.Activity ratios has also been improved in 2013 except avg. collection period
and total
asset turnover. And if we talk about debt management ratios, these are also improved in
2013.Profitibility ratios are better in 2013 as compared to 2012 except basic earning
power.
Here are some recommendations which company may follow to improve its current
situation:
• Company needs to improve its avg. collection period and it can be done by changing
its credit terms and policies to collect money.
• Company can improve its asset-turnover ratio by increasing sales and by finding
ways to use its assets more efficiently.
• It needs to improve its BEP.

22
References
Annual Report Of
Nishat Mills Ltd.
24Managerial Accounting
Ratio Analysis

Thanks
For
LISTENING
US
25Managerial accounting
Ratio Analysis

26Managerial Accounting
Ratio Analysis


![{Slides} Job+ Presentation Slides [MKS-40]](https://img.pdfslide.us/doc/110x75/58f058861a28ab96248b45f5/slides-job-presentation-slides-mks-40.jpg)
