Embed Size (px)
Citation preview

The Silver InvestmentMarket
Prepared by GFMS Ltd
for the Silver Institute
April 2009
© Copyright April 2009. The Silver Institute and GFMS Limited.
All rights reserved. No part of this publication may be reproduced, stored in a retrieval system or transmitted in any
form or by any means without the prior written permission of the copyright owner. Brief extracts (excluding tables
or graphs) may be reproduced only for the purpose of criticism or review and provided that they are accompanied by
a clear acknowledgement as to their source and the name of the copyright owner.
The data on which this report is based has been obtained by The Silver Institute and GFMS Limited from sources
which are generally believed to be reliable. However, this does not guarantee complete accuracy in the information
presented here. It is in the nature of the precious metals markets that estimates for a number of components
must be made on the basis of incomplete information. The opinions expressed here represent those of the authors
of the report at the time of writing.
Disclaimer
While every effort has been made to ensure the accuracy of the information in this document, The Silver Institute
and GFMS Ltd cannot guarantee such accuracy. Furthermore, the material contained herewith has no regard to the
specific investment objectives, financial situation or particular needs of any specific recipient or organization. It is
published solely for informational purposes and is not to be construed as a solicitation or an offer to buy or sell any
commodities, securities or related financial instruments. No representation or warranty, either express or implied,
is provided in relation to the accuracy, completeness or reliability of the information contained herein. The Silver
Institute and GFMS Ltd do not accept responsibility for any losses or damages arising directly, or indirectly, from
the use of this document.

Independent • Informed • International
About GFMS
www.gfms.co.uk
GFMS Ltd is the world’s foremost precious metals consultancy, specialising in research into the global gold, silver, platinum and palladium markets. GFMS is based in London, UK, but has representation in Australia, France, India, Russia and Spain, and a vast range of contacts and associates across the world.
GFMS is credited with producing the most authoritative surveys of the gold and silver markets, the annual Gold Survey and World Silver Survey, and produces a range of other publications dealing with all aspects of the precious metals markets. GFMS also provides consultancy services in the form of tailor-made research into selected areas of the precious metals markets. GFMS’ research team of twenty two full-time analysts comprise experienced economists and three geologists.
For more information on GFMS’ products and services please contact the company’s sales director at:[email protected]
GFMS Limited
Hedges House
153-155 Regent Street
London
W1B 4JE
United Kingdom
Tel: +44 (0)20 7478 1777
Fax: +44 (0)20 7478 1779
Table of Contents
1. Executive Summary 5
2. Introduction 8
3. Who is Investing in Silver and Why 12
4. Investing in Paper Instruments Linked to Silver
i. Investment through Commodity Exchanges 15
ii. The Over-the-Counter and Metal Account Markets 19
iii. Silver ETFs 20
iv. Exchange Listed Structured Products 24
5. Physical Investment in Western and Developing Markets 25
6. Silver Mining Stocks 29
7. Analysis of Privately Held Silver Bullion Stocks 32
8. Conclusions
i. The Current State of Silver Investment 36
ii. The Future of Silver Investment 37
iii. Scope for Introduction of Silver ETFs in Other Markets 39
Focus Boxes
Silver Coins 28
Deficits and Surpluses in the Silver Market 34
Silver Borrowing 35
5Independent - Informed - International
The Silver Investment Market
1. Executive Summary
This Silver Investment Market report sets out to
describe and, where feasible, measure the contribution
made by investors to the silver market. Since the start
of the bull market in 2003 the importance of investment
demand has grown, with the spectacular success of
Exchange Traded Funds (ETFs) the most visible sign
of silver’s growing appeal. In the sections below we
summarize the key findings of this report.
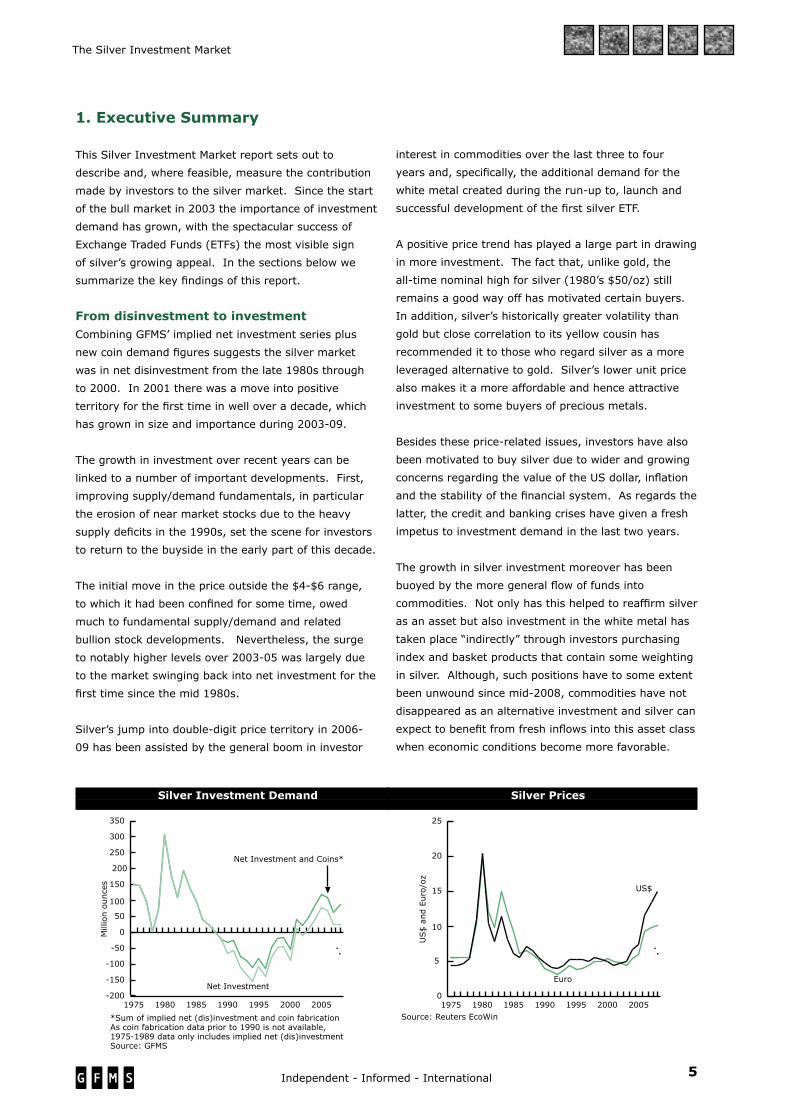
From disinvestment to investment Combining GFMS’ implied net investment series plus
new coin demand figures suggests the silver market
was in net disinvestment from the late 1980s through
to 2000. In 2001 there was a move into positive
territory for the first time in well over a decade, which
has grown in size and importance during 2003-09.
The growth in investment over recent years can be
linked to a number of important developments. First,
improving supply/demand fundamentals, in particular
the erosion of near market stocks due to the heavy
supply deficits in the 1990s, set the scene for investors
to return to the buyside in the early part of this decade.
The initial move in the price outside the $4-$6 range,
to which it had been confined for some time, owed
much to fundamental supply/demand and related
bullion stock developments. Nevertheless, the surge
to notably higher levels over 2003-05 was largely due
to the market swinging back into net investment for the
first time since the mid 1980s.
Silver’s jump into double-digit price territory in 2006-
09 has been assisted by the general boom in investor
interest in commodities over the last three to four
years and, specifically, the additional demand for the
white metal created during the run-up to, launch and
successful development of the first silver ETF.
A positive price trend has played a large part in drawing
in more investment. The fact that, unlike gold, the
all-time nominal high for silver (1980’s $50/oz) still
remains a good way off has motivated certain buyers.
In addition, silver’s historically greater volatility than
gold but close correlation to its yellow cousin has
recommended it to those who regard silver as a more
leveraged alternative to gold. Silver’s lower unit price
also makes it a more affordable and hence attractive
investment to some buyers of precious metals.
Besides these price-related issues, investors have also
been motivated to buy silver due to wider and growing
concerns regarding the value of the US dollar, inflation
and the stability of the financial system. As regards the
latter, the credit and banking crises have given a fresh
impetus to investment demand in the last two years.
The growth in silver investment moreover has been
buoyed by the more general flow of funds into
commodities. Not only has this helped to reaffirm silver
as an asset but also investment in the white metal has
taken place “indirectly” through investors purchasing
index and basket products that contain some weighting
in silver. Although, such positions have to some extent
been unwound since mid-2008, commodities have not
disappeared as an alternative investment and silver can
expect to benefit from fresh inflows into this asset class
when economic conditions become more favorable.
-200
-150
-100
-50
0
50
100
150
200
250
300
350
2005200019951990198519801975
Net invesment vs net investment plus coins
Net Investment and Coins*
Net Investment
Millionounces
1980 Average: $52.80
*Sum of implied net (dis)investment and coin fabricationAs coin fabrication data prior to 1990 is not available,1975-1989 data only includes implied net (dis)investmentSource: GFMS
Silver Investment Demand Silver Prices
0
5
10
15
20
25
2005200019951990198519801975
Dollar and Euro Price - Historic
US$
US$andEuro/oz
1980 Average: $52.80
Euro
Source: Reuters EcoWin
6 Independent - Informed - International
The Silver Investment Market
Who invests in silver, why and howInvestors in silver can usefully be divided into three
broad groups: retail, institutional and high net worth.
As we explain in Chapter 3, although these groups have
similar motives for investing in silver, there are some
subtle differences that can be identifi ed. Furthermore,
although there is a fair amount of commonality, retail,
institutional and high net worth investors typically favor
somewhat different investment vehicles. For instance,
small players’ penchant for silver coins only appeals to
a limited number of very wealthy investors and is not at
all shared by funds. The opposite would hold true for
investment via over-the-counter (OTC) products.
The report comments in detail on the type of
investment products available and the trends in
demand for these. In Chapter 4, we discuss “paper”
products including futures, OTC instruments, allocated
accounts, ETFs and exchange-listed structured
products. In Chapter 5, the analysis switches to
investment in physical bullion bars and coins in the
western and developing worlds.
Demand for paper products has traditionally been
concentrated in the futures and OTC markets. As
regards the former, of the six exchanges where silver
futures are traded the dominant market is the Comex
division of Nymex. In 2008, for instance, basis the
number of ounces traded, Comex accounted for roughly
69% of global turnover in silver futures. As explained,
however, in detail in the relevant section of this report,
investors’ open positions on the New York exchange
appear to have fallen in volume (though not in value)
terms since peaking in December 2004.
To some extent in recent years investor business has
migrated away from futures to the OTC market. This
probably refl ects the larger participation of funds that
would be natural users of the more fl exible and less
transparent loco-London market. Trading over-the-
counter may also in some cases give such players
greater ability to leverage their positions and put in
place more complex strategies.
We believe, though, that a more signifi cant challenge
in the last few years to the pre-eminence of the futures
exchanges has come from the development of silver
ETFs as an alternative. First, for some investors who
are proscribed from investing in futures, ETFs have
provided an acceptable form of holding silver. Second,
others appear to have switched out of futures into ETFs
once the latter became available.
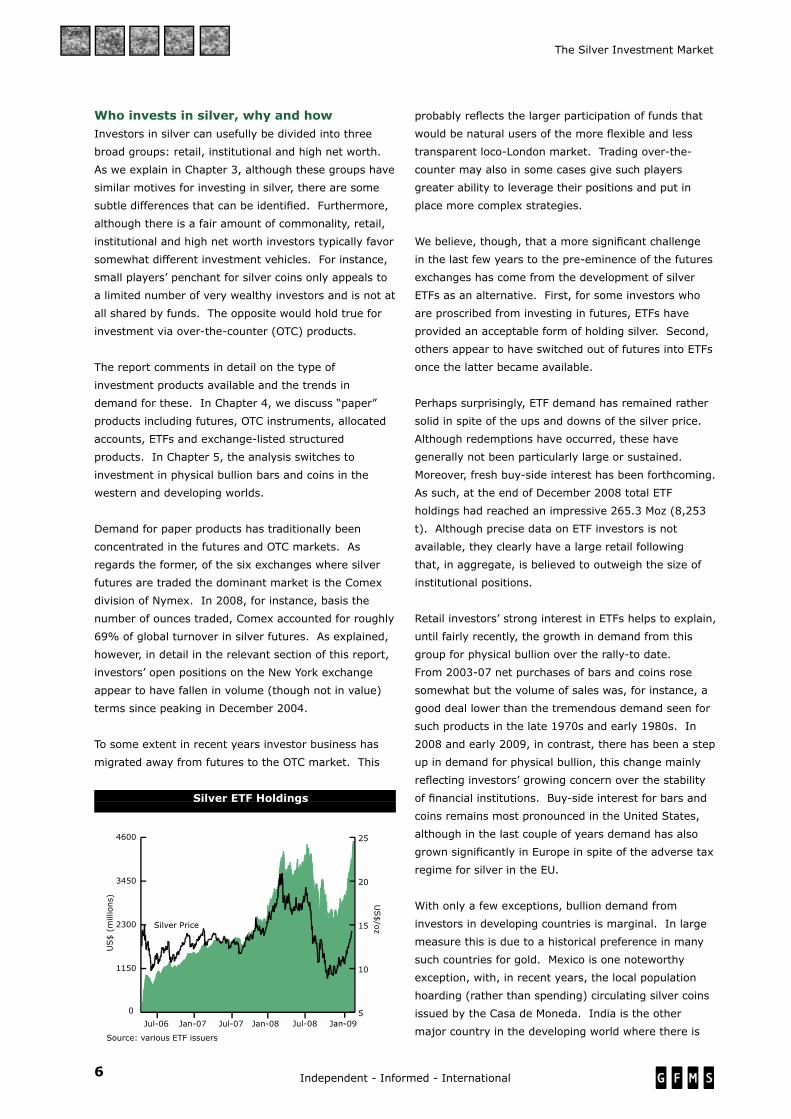
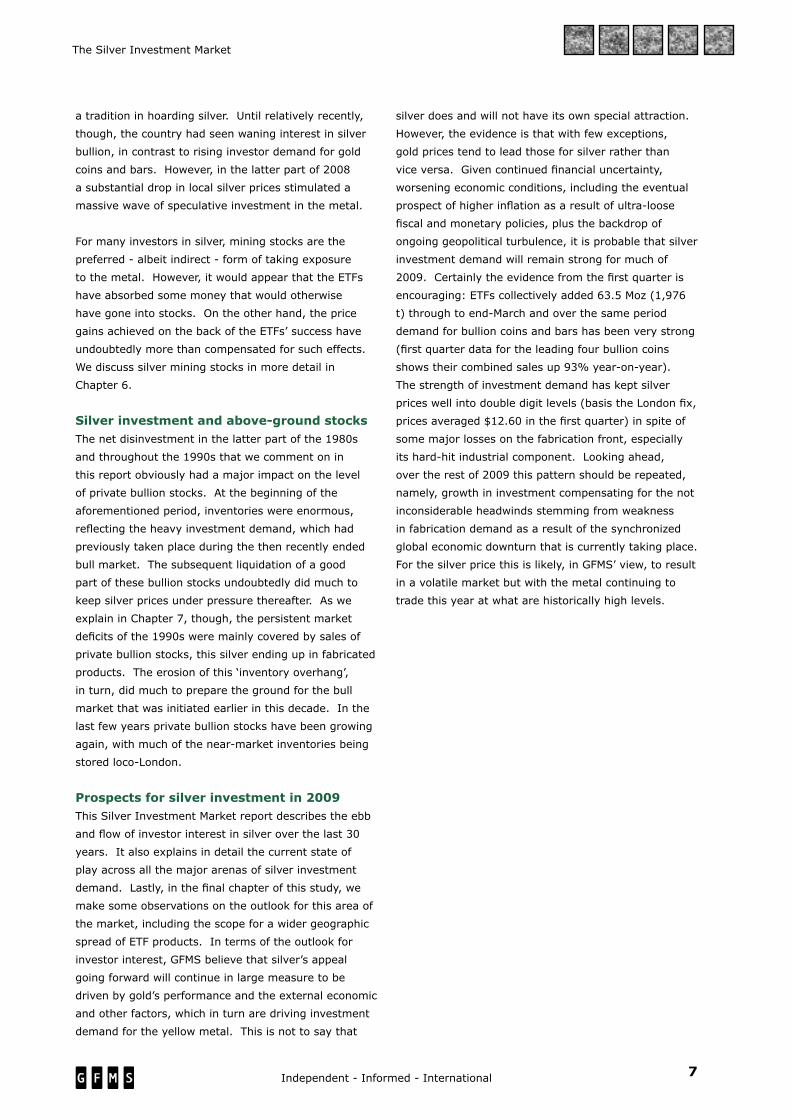
Perhaps surprisingly, ETF demand has remained rather
solid in spite of the ups and downs of the silver price.
Although redemptions have occurred, these have
generally not been particularly large or sustained.
Moreover, fresh buy-side interest has been forthcoming.
As such, at the end of December 2008 total ETF
holdings had reached an impressive 265.3 Moz (8,253
t). Although precise data on ETF investors is not
available, they clearly have a large retail following
that, in aggregate, is believed to outweigh the size of
institutional positions.
Retail investors’ strong interest in ETFs helps to explain,
until fairly recently, the growth in demand from this
group for physical bullion over the rally-to date.
From 2003-07 net purchases of bars and coins rose
somewhat but the volume of sales was, for instance, a
good deal lower than the tremendous demand seen for
such products in the late 1970s and early 1980s. In
2008 and early 2009, in contrast, there has been a step
up in demand for physical bullion, this change mainly
refl ecting investors’ growing concern over the stability
of fi nancial institutions. Buy-side interest for bars and
coins remains most pronounced in the United States,
although in the last couple of years demand has also
grown signifi cantly in Europe in spite of the adverse tax
regime for silver in the EU.
With only a few exceptions, bullion demand from
investors in developing countries is marginal. In large
measure this is due to a historical preference in many
such countries for gold. Mexico is one noteworthy
exception, with, in recent years, the local population
hoarding (rather than spending) circulating silver coins
issued by the Casa de Moneda. India is the other
major country in the developing world where there is
Silver ETF Holdings
0
1150
2300
3450
4600
Jan-09JulJlJ-a-a0a0an0n8n8n-8-Jan-08Jul-07Jan-07Jul-06
Silver Price
US$(millions)
Silver ETF value terms
Source: various ETF issuers
Jul-085
10
15
20
25
US$/oz
7Independent - Informed - International
The Silver Investment Market
a tradition in hoarding silver. Until relatively recently,
though, the country had seen waning interest in silver
bullion, in contrast to rising investor demand for gold
coins and bars. However, in the latter part of 2008
a substantial drop in local silver prices stimulated a
massive wave of speculative investment in the metal.
For many investors in silver, mining stocks are the
preferred - albeit indirect - form of taking exposure
to the metal. However, it would appear that the ETFs
have absorbed some money that would otherwise
have gone into stocks. On the other hand, the price
gains achieved on the back of the ETFs’ success have
undoubtedly more than compensated for such effects.
We discuss silver mining stocks in more detail in
Chapter 6.
Silver investment and above-ground stocksThe net disinvestment in the latter part of the 1980s
and throughout the 1990s that we comment on in
this report obviously had a major impact on the level
of private bullion stocks. At the beginning of the
aforementioned period, inventories were enormous,
reflecting the heavy investment demand, which had
previously taken place during the then recently ended
bull market. The subsequent liquidation of a good
part of these bullion stocks undoubtedly did much to
keep silver prices under pressure thereafter. As we
explain in Chapter 7, though, the persistent market
deficits of the 1990s were mainly covered by sales of
private bullion stocks, this silver ending up in fabricated
products. The erosion of this ‘inventory overhang’,
in turn, did much to prepare the ground for the bull
market that was initiated earlier in this decade. In the
last few years private bullion stocks have been growing
again, with much of the near-market inventories being
stored loco-London.
Prospects for silver investment in 2009 This Silver Investment Market report describes the ebb
and flow of investor interest in silver over the last 30
years. It also explains in detail the current state of
play across all the major arenas of silver investment
demand. Lastly, in the final chapter of this study, we
make some observations on the outlook for this area of
the market, including the scope for a wider geographic
spread of ETF products. In terms of the outlook for
investor interest, GFMS believe that silver’s appeal
going forward will continue in large measure to be
driven by gold’s performance and the external economic
and other factors, which in turn are driving investment
demand for the yellow metal. This is not to say that
silver does and will not have its own special attraction.
However, the evidence is that with few exceptions,
gold prices tend to lead those for silver rather than
vice versa. Given continued financial uncertainty,
worsening economic conditions, including the eventual
prospect of higher inflation as a result of ultra-loose
fiscal and monetary policies, plus the backdrop of
ongoing geopolitical turbulence, it is probable that silver
investment demand will remain strong for much of
2009. Certainly the evidence from the first quarter is
encouraging: ETFs collectively added 63.5 Moz (1,976
t) through to end-March and over the same period
demand for bullion coins and bars has been very strong
(first quarter data for the leading four bullion coins
shows their combined sales up 93% year-on-year).
The strength of investment demand has kept silver
prices well into double digit levels (basis the London fix,
prices averaged $12.60 in the first quarter) in spite of
some major losses on the fabrication front, especially
its hard-hit industrial component. Looking ahead,
over the rest of 2009 this pattern should be repeated,
namely, growth in investment compensating for the not
inconsiderable headwinds stemming from weakness
in fabrication demand as a result of the synchronized
global economic downturn that is currently taking place.
For the silver price this is likely, in GFMS’ view, to result
in a volatile market but with the metal continuing to
trade this year at what are historically high levels.

8 Independent - Informed - International
The Silver Investment Market
2. Introduction
Throughout the recent history of the silver market,
investment has played an important role in the fate
of the price of the metal. The late 1970s and early
1980s price rallies, as well as that experienced since
2003, were largely fueled by a rise in investment
demand. In contrast, investors’ disenchantment with
silver over much of the years in between these two
great bull markets was in large part responsible for
the price first falling and then remaining constrained
within a low range, in spite of the market slipping into a
fundamental deficit over most of this period.
The importance of investor activity to the silver price is
a hardly surprising fact. Given that silver, like gold, is a
commodity with abundant above-ground bullion stocks,
the propensity of individuals or institutions to hold or
release these stocks into the market (which is largely
synonymous with investor activity) is as important,
if not more so, than the state of the underlying
fundamental market for determining the price of the
commodity.
The graph below features annual implied net
(dis)investment as well as coin fabrication demand
going back to 1990. Implied net (dis)investment is
the balancing item that brings all other independently
calculated elements of silver supply and demand
into equilibrium. As it represents all metal that was
added to or released from privately held stocks, it is
essentially equivalent to the net impact of investor
activity on the physical market over the course of the
year, excluding demand for coins and allowing for a
certain margin of error related to unidentified flows that
fall out of the definition of investment.
Focusing on the implied net (dis)investment figures,
a number of general observations can immediately be
made. First of all, it is interesting to note the move
from a net positive market impact of investors’ activity
in the late 1970s and the first half of the 1980s, to a
broadly neutral picture over the rest of that decade,
followed by what could be described as “structural”
disinvestment in the 1990s and, finally, a swing back to
net investment in the last few years.
The second graph below features annual observations
of the broader definition of silver investment, which in
addition to implied net (dis)investment also includes
coin fabrication. It should be noted here that this
measure is only available for data from 1990 onwards,
as a series for coin fabrication demand consistent with
GFMS’ methodology was not available prior to that.
The 1975-1989 data in the graph below therefore only
includes implied net disinvestment. Nevertheless,
given the small relative magnitude of coin demand, the
trends are broadly unaffected.
The data presented in the graph provides some
empirical evidence that supports our earlier contention
that investment demand has a strong influence on the
price performance of silver. Over the last 33 years, the
annual average silver price has followed a trajectory
very similar to that of silver investment.
It is also worth examining how these figures compare
to the relevant ones in the gold market, namely
World Investment (defined as the sum of implied net
investment, bar hoarding and official coin fabrication
demand). The graph on page 8 features investment
figures for both metals since 1980. (1980 was the year
when GFMS’ database on gold began to account for
Implied Net Investment & Coin Fabrication Silver Investment Demand*
-150
-100
-50
0
50
100
150
200
250
300
350
2005200019951990198519801975
Millionounces
Implied Net Investment
0
5
10
15
20
25
Silver Investment - Coin Fabrication + Net Implied
Real SilverPrice
*Sum of implied net (dis)investment and coin fabricationAs coin fabrication data prior to 1990 is not available,1975-1989 data only includes implied net (dis)investmentSource: GFMS
Net Investment*
Net Dis-Investment*
Constan
t2008US$/oz
-200
-150
-100
-50
0
50
100
150
-600
-400
-200
0
200
400
600
800
1000
Tonnes
Net (Dis)investment
Coins
200
300
400
500
RealGold Price
Constan
t2003US$/oz
World Investment
-200
-150
-100
-50
0
50
100
150
20082005200219991996199319900
3
6
9
12
15
MillionOunces
Constan
t2008US$/oz
RealSilver Price
Source: GFMS

9Independent - Informed - International
The Silver Investment Market
global rather than exclusively western world figures,
from which time onwards a comparison between the
two metals’ figures is meaningful.) Interestingly,
although the net impact of investors’ activities in silver
was negative for a prolonged period of time, the gold
market has consistently been in net investment mode,
only approaching neutrality in 2000.
An alternative approach to assessing silver
(dis)investment, both in its own right and in comparison
with the relevant figures for gold, is to consider the
portion of overall demand or supply it accounted for
annually. The annual data is presented in the relevant
graph below. One can immediately notice the dramatic
contrast between the structure of the market over the
first 10 years and the rest of the period examined.
During the former, net investment accounted for more
than a fifth of total annual demand on average, peaking
at 40% of demand in 1980. Over the course of the
latter period, (dis)investment has accounted for an
average 7% of annual supply or demand. Comparing
the figures with those available for gold one can
also see that, as a general rule, net investment has
accounted for a larger portion of the gold market than it
has of the silver market over the last 33 years.
It is now worth examining what the drivers were that
led the trends in silver (dis)investment described
above. During the second half of the 1970s,
investment demand for precious metals was supported
by a very favorable set of economic circumstances,
that in some measure are present again today. These
include: rising inflation, strong commodity prices,
negative real interest rates, a weak US dollar, a bear
market in stocks and heightened geopolitical tensions.
Particularly at the end of the period regarding Iran and
Afghanistan. This environment was highly positive for
investment in silver and, particularly in the historically
silver-friendly US market, private investor demand
grew strongly. However, towards the end of the decade
the peak in prices owed much to the Hunt brothers’ and
other speculators’ aggressive purchases of silver. This
climaxed with the attempted cornering of the market in
1979, which resulted in prices rising more than four-
fold within the course of a few months, peaking a little
short of $50 in January 1980.
Faced with such dramatic market distortions, regulatory
authorities imposed certain restrictions on speculative
activity. This triggered a reversal of the price trend
and later proved to be the beginning of a new era
for silver investment. With the exception of a short-
lived recovery in 1983 (largely fueled by speculators),
investor interest declined over the rest of the 1980s,
with the market falling into net disinvestment in 1989.
Investors continued to supply the market with bullion
throughout the 1990s, only returning to (initially very
modest) positive net investment in 2001.
By the 1990s, investors’ attitudes towards precious
metals and commodities in general had become
rather negative, only partly due to the disappointing
price performance since their early-1980s peaks. In
addition, the zero or, at best, very low yield on silver
and gold contrasted with the positive interest rates
available on major currencies and the bull market in
stocks. Moreover, the collapse of the Soviet Union led
to a considerable easing of political tensions, reducing
the safe haven appeal of precious metals. In the
case of silver, the negative price trend combined with
these economic and political developments not only
undermined the case for fresh investment but also
Annual Gold and Silver Investment Contribution of Investment to Demand/Supply
Tonnes
Implied Net Investment
-600
-400
-200
0
200
400
600
800
1000
1200
200520001995199019851980
Silver & Gold Investment
Silver Price
Gold Investment
-200
-100
0
100
200
300
400
200520001995199019851980
Millionounces
Silver Investment
Source: GFMS
-20
-10
0
10
20
30
40
50
2005200019951990198519801975
%oftotaldemand/supply
Implied Net Investment
0
5
10
15
20
25
Investment as % of Supply-Demand
Source: GFMS
Demand
Supply
Constan
t2008US$/oz
RealSilver Price
10 Independent - Informed - International
The Silver Investment Market
prompted a sustained period of dishoarding of bullion
stocks that had been built up to considerable levels
during the preceding bull market.
A couple of years into the new millennium and the
first signs that the tables were about to change
emerged. Led by a weakening US dollar, a rising gold
price and a perceived improvement in silver’s market
fundamentals, investment demand for the metal
eventually revived and started growing, providing much
of the fuel for a rise in the price, initially to beyond the
$5 and $6 levels. Thereafter, investment demand was
further stimulated in 2005 and 2006 by rumors, news
and eventually the actual launch of the silver ETF in late
April 2006. It should also be mentioned that during
this time the economic backdrop became increasingly
supportive for silver. The white metal also benefited
from the strong performance of the wider commodities
complex and, importantly, the remarkable gold price
rally last year when the metal comfortably breached its
previous all time high of $850/oz.
Related to the last point, it is worth briefly discussing
here the link the silver price tends to maintain with that
of gold over time. Historically, this link was related
to the two metals’ similar uses, both monetary and
ornamental. Given the demonetization of gold and
silver and the increasingly different fundamentals
underpinning the two (the bulk of silver fabrication
demand has, for the past two years, been accounted for
by industrial uses while jewelry continues to comprise
the majority of gold fabrication), such a link is difficult
to argue to have been in place over the last few
decades.
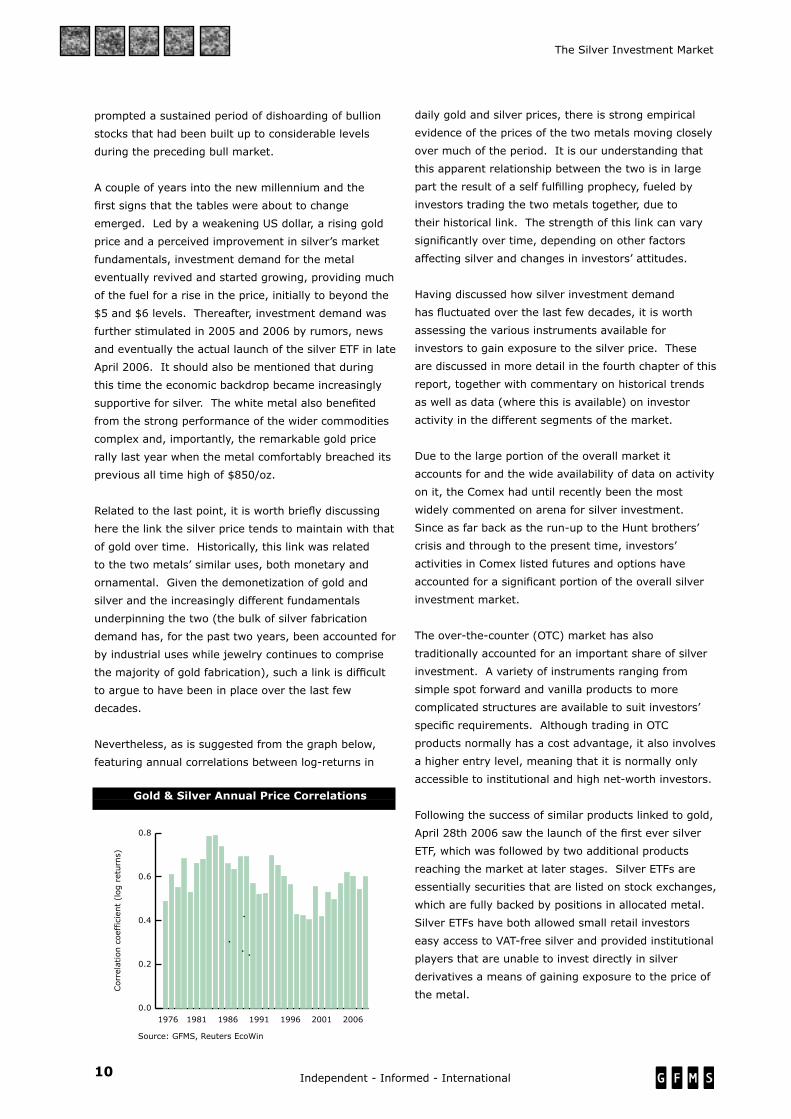
Nevertheless, as is suggested from the graph below,
featuring annual correlations between log-returns in
daily gold and silver prices, there is strong empirical
evidence of the prices of the two metals moving closely
over much of the period. It is our understanding that
this apparent relationship between the two is in large
part the result of a self fulfilling prophecy, fueled by
investors trading the two metals together, due to
their historical link. The strength of this link can vary
significantly over time, depending on other factors
affecting silver and changes in investors’ attitudes.
Having discussed how silver investment demand
has fluctuated over the last few decades, it is worth
assessing the various instruments available for
investors to gain exposure to the silver price. These
are discussed in more detail in the fourth chapter of this
report, together with commentary on historical trends
as well as data (where this is available) on investor
activity in the different segments of the market.
Due to the large portion of the overall market it
accounts for and the wide availability of data on activity
on it, the Comex had until recently been the most
widely commented on arena for silver investment.
Since as far back as the run-up to the Hunt brothers’
crisis and through to the present time, investors’
activities in Comex listed futures and options have
accounted for a significant portion of the overall silver
investment market.
The over-the-counter (OTC) market has also
traditionally accounted for an important share of silver
investment. A variety of instruments ranging from
simple spot forward and vanilla products to more
complicated structures are available to suit investors’
specific requirements. Although trading in OTC
products normally has a cost advantage, it also involves
a higher entry level, meaning that it is normally only
accessible to institutional and high net-worth investors.
Following the success of similar products linked to gold,
April 28th 2006 saw the launch of the first ever silver
ETF, which was followed by two additional products
reaching the market at later stages. Silver ETFs are
essentially securities that are listed on stock exchanges,
which are fully backed by positions in allocated metal.
Silver ETFs have both allowed small retail investors
easy access to VAT-free silver and provided institutional
players that are unable to invest directly in silver
derivatives a means of gaining exposure to the price of
the metal.
Gold & Silver Annual Price Correlations
0.0
0.2
0.4
0.6
0.8
2006200119961991198619811976
Correlationcoefficient(logreturns)
Source: GFMS, Reuters EcoWin
Annual Correlations Gold Silver

11Independent - Informed - International
The Silver Investment Market
Silver warrants and certificates are available on a
number of European stock exchanges. These are
essentially standardized silver derivatives, which
tend to be strictly cash settled. Although a variety of
products to suit a range of strategies exist, activity
within this segment of silver investment is low
compared to both that in gold and, importantly, other
parts of the overall silver market.
The last segment of the silver investment market,
namely the direct purchase and sale of silver bullion
products, varies considerably across different regions.
This is largely due to the varying tax regimes that are
in place in different countries. In much of Europe,
for instance, high rates of value added tax have
traditionally tended to deter investment in silver bullion.
It is worth mentioning that many investors choose to
gain indirect exposure to silver through purchasing
silver mining stocks. The advantage of this approach
is the potential for a leveraged return on capital,
the existence of dividends as well as, in the case of
companies are in part hedged or producing other
metals besides silver, some level of protection, should
prices retreat. Its main drawback is the exposure to
company and sector risk, which can be linked to a
range of drivers unrelated to the silver market, such
as energy costs or geopolitical risk. Finally, although,
as mentioned above, investing in companies that do
not exclusively produce silver can provide protection
against falling silver prices, it also introduces exposure
to other metals’ prices.
12 Independent - Informed - International
The Silver Investment Market
3. Who is Investing in Silver and Why
Having provided a general overview of silver investment
during the last three decades and the various segments
of the current investor market, in this chapter we
analyze who are the investors, as well as what
drives their decisions to be long or short the metal.
Understanding this is of paramount importance not only
when assessing past developments in silver investment
and how these affected the silver price, but also the
ability to make meaningful projections as to future
trends.
The silver investment community can be broadly
divided into three groups of investors: retail, high net-
worth or family office and institutional. The lines that
divide these categories are often blurred, and assessing
where certain players belong can frequently be difficult.
For instance, the threshold above which a retail investor
becomes a high net-worth one is by no means clear
cut. Elsewhere, although private wealth management
companies and private banks strictly speaking belong
to the institutional category, their investment objectives
and actions are more likely to resemble those of their
high net-worth clients.
Likewise, when it comes to the motives for investing
in silver it is not always easy to segregate these.
An investor, for example, may purchase silver both
‘defensively’ as a store of value and ‘offensively’ in
expectation of capital gains. Similarly, while some
investors’ time horizon may only extend out a few
weeks or even days, others have more of a ‘buy and
hold’ mentality, albeit in some cases, and to confuse
matters further, for only a core part of their position.
Notwithstanding these caveats applying to investors’
motives and those explained above regarding the three
broad groups of investors, in the sections below we
assess ‘who is investing in silver and why’.
Starting with retail investors, part of this group,
primarily investors based in North America, continue
to consider silver to be a quasi-monetary commodity.
After all, silver only ceased to be part of the United
States’ monetary system in the 1960s. Some players
consider silver (as well as gold) to be a superior store
of value to fiat money, due to the latter arguably
not bearing any intrinsic value. These investors are
understood to have “kept the faith”, to varying extents,
throughout the bear market of the 1990s, while some
seem to ascribe to various theories of silver price-
suppression.
A significant portion of retail investor activity in silver
is related to its being part of the wider precious metals
complex. Such investors’ portfolios would normally
include varying amounts of gold and silver and, in some
cases, palladium and (even less frequently) platinum.
Related to the above, a number of retail investors trade
silver on the back of its link to gold. For instance,
those with a somewhat shorter term outlook may often
choose silver over gold during a bull run, due to the
white metal’s greater volatility and therefore higher
expected returns. Meanwhile, for others, perhaps
investing with more of a medium to longer term
outlook, silver is the metal of choice due to it arguably
being undervalued compared to gold, on the basis
of historical precedents (specifically the early 1980s
peak), such buyers expecting a “catching up” to take
place. Finally, there are also some smaller investors
who are attracted to silver’s much lower unit price.
Finally, a smaller minority are specifically interested in
silver on the basis of its fundamentals. Such investors
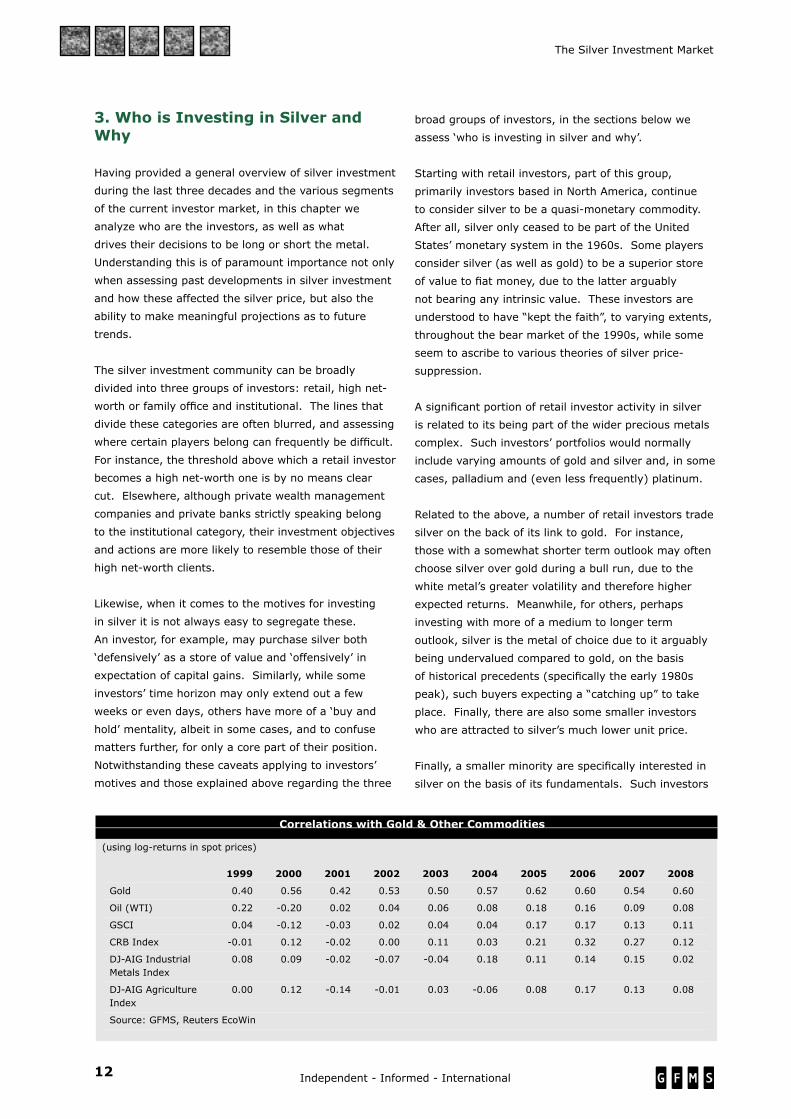
Correlations with Gold & Other Commodities
(using log-returns in spot prices) 1999 2000 2001 2002 2003 2004 2005 2006 2007 2008
Gold 0.40 0.56 0.42 0.53 0.50 0.57 0.62 0.60 0.54 0.60
Oil (WTI) 0.22 -0.20 0.02 0.04 0.06 0.08 0.18 0.16 0.09 0.08
GSCI 0.04 -0.12 -0.03 0.02 0.04 0.04 0.17 0.17 0.13 0.11
CRB Index -0.01 0.12 -0.02 0.00 0.11 0.03 0.21 0.32 0.27 0.12
DJ-AIG Industrial 0.08 0.09 -0.02 -0.07 -0.04 0.18 0.11 0.14 0.15 0.02 Metals Index
DJ-AIG Agriculture 0.00 0.12 -0.14 -0.01 0.03 -0.06 0.08 0.17 0.13 0.08 Index
Source: GFMS, Reuters EcoWin
13Independent - Informed - International
The Silver Investment Market
are buying into expectations of silver industrial
fabrication continuing to grow healthily, outweighing
further attrition in photographic demand, and mine
production failing to increase adequately to match the
aforementioned increase in fabrication demand, against
the backdrop of arguably low-field above-ground, near
market stocks.
Moving to the sphere of institutional investors, namely
hedge funds, pension funds and other such entities,
there are a number of different considerations that one
can identify behind their decisions to invest in silver.
First of all, because silver belongs to the wider precious
metals and indeed the even broader commodities
complex, immediately suggests that many funds that
seek exposure to either of the two sectors would tend
also to add silver to their portfolio. (Regarding the
reasons why such players are interested in commodities
in the first place, the apparent fundamentally fueled
supercycle, weakness in the US dollar, rising inflationary
expectations and a general hunger for alternative
investments are the principal drivers of their desire to
invest in this asset class.)
This motivation can apply to both longer-term (such as
pension funds) and shorter-term (such as hedge funds)
investors. While the former would normally maintain
a more or less fixed strategy, the latter are likely to
engage in active management of their silver holdings as
well as the products used.
The link between the silver price to that of gold is also
an important driver of institutional investor activity
in the metal. The strategy deployed is often similar
to that of shorter-term retail speculators, which was
discussed earlier in this chapter. Specifically, silver
is used as a means of enhanced returns due to the
market being less liquid and its price consequently
more volatile. Moreover, GFMS are aware of numerous
funds that very actively trade the gold:silver ratio,
despite it arguably having little fundamental basis.
There is also significant interest in silver from the more
straightforward technically driven funds. Such players
tend to speculate on short term price movements and
use both long and short instruments to gain exposure
to the silver price. Their involvement peaks during
times of dramatic price changes. Such players have
often provided the fuel for “self fulfilling prophecies”,
both on the upside and downside, to materialize.
This involves investors expecting a certain move in
the market, trading aggressively on the back of their
expectation and therefore actually moving the market
in line with it.
Looking, finally, at the high net-worth, wealth
management and family office type investors, their
investment approach tends to be somewhere in-
between that of the two groups discussed above.
Motivations mentioned previously, such as silver
being part of the precious metals or wider commodity
complex, linked to the gold price although more
volatile, the gold:silver ratio and, more rarely and
usually in the case of older investors, the thesis for
a return towards past all time highs are all present
within the high net-worth group. Overall, investors
belonging to this group tend generally to follow
medium to longer term strategies. Although short term
speculative activity is by no means insignificant, wealth
preservation is a key consideration.
Of particular interest (and applying to investors
belonging to all three groups discussed above) is the
difference between the investor base of silver and
that of gold and how this changes over time. As
mentioned in the previous chapter, the fate of silver
investment demand is linked to the performance of the
gold price as well as investors’ activities in the yellow
metal. Nevertheless, as was also mentioned in the
introduction, this relationship can vary greatly over
time and the difference in the investor base for the two
metals provides part of the reason why this is the case.
The principal reason why most investors view gold and
silver differently is the established quasi-monetary
properties that the former has and the latter lacks. On
the one hand this is the result of gold having formed
the basis for global monetary systems, until more
recently than silver. In addition to this, arguably
psychological consideration, there is also a very real
factor that makes gold a far superior commodity to
serve quasi-monetary purposes. Specifically, when
measured in value terms, the above-ground stocks
of gold are considerably larger than those of silver,
providing a far deeper and more liquid market. As a
result, there is a general tendency for investors looking
for a store of value or safe haven vehicle to prefer
gold. Conversely, portfolios geared towards accelerated
returns at the expense of higher risk tend to have a
greater weighting in silver. This is the likely explanation
of the fact that, since the eruption of the sub-prime
market crisis in August 2007, silver has generally failed
to outperform gold, despite both metals enjoying a
bull-run. During these turbulent times, the rise in risk
14 Independent - Informed - International
The Silver Investment Market
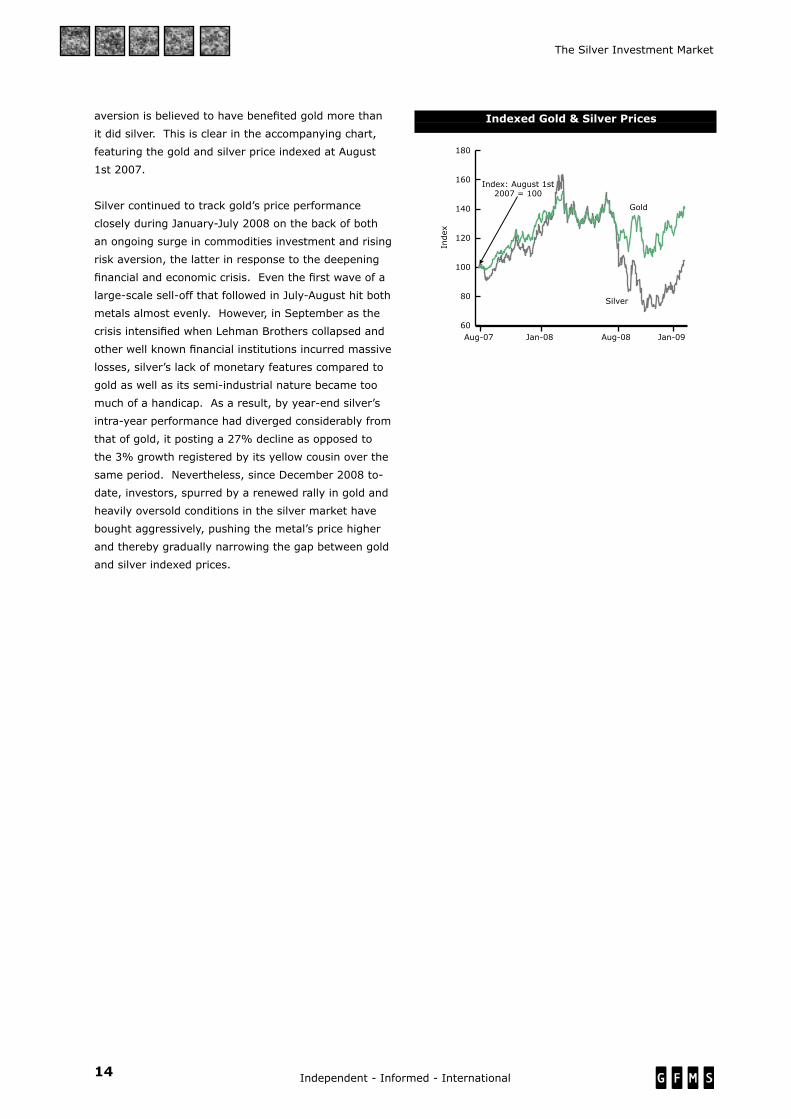
aversion is believed to have benefited gold more than
it did silver. This is clear in the accompanying chart,
featuring the gold and silver price indexed at August
1st 2007.
Silver continued to track gold’s price performance
closely during January-July 2008 on the back of both
an ongoing surge in commodities investment and rising
risk aversion, the latter in response to the deepening
financial and economic crisis. Even the first wave of a
large-scale sell-off that followed in July-August hit both
metals almost evenly. However, in September as the
crisis intensified when Lehman Brothers collapsed and
other well known financial institutions incurred massive
losses, silver’s lack of monetary features compared to
gold as well as its semi-industrial nature became too
much of a handicap. As a result, by year-end silver’s
intra-year performance had diverged considerably from
that of gold, it posting a 27% decline as opposed to
the 3% growth registered by its yellow cousin over the
same period. Nevertheless, since December 2008 to-
date, investors, spurred by a renewed rally in gold and
heavily oversold conditions in the silver market have
bought aggressively, pushing the metal’s price higher
and thereby gradually narrowing the gap between gold
and silver indexed prices.
Indexed Gold & Silver Prices
60
80
100
120
140
160
180
Jan-09Aug-08Jan-08Aug-07
Index
Indexed Silver & Other Commodities
Gold
Index: August 1st2007 = 100
Silver

15Independent - Informed - International
The Silver Investment Market
4. Investing in Paper Instruments Linked to Silver
i. Investment Through Commodity ExchangesOne popular way in which various institutional and
more sophisticated investors typically access the silver
market is through derivatives on commodities traded
on futures exchanges. There are now six exchanges
offering silver derivatives which play a key role in
providing commercial hedgers as well as investors with
a way in which to manage underlying price risks and to
speculate on the future price movements of silver.
The most popular tool is that of futures, which are
standardized contracts to buy or sell an asset at a
predetermined price in the future. Options are also
extensively used by hedgers and speculators, but unlike
futures, differ in that they give the right, rather than
obligation, to buy or sell the underlying asset.
While silver futures contracts can be exercised for the
actual physical metal, the vast majority of contracts
are offset prior to maturity; as most commercial
participants favor buying and selling physical silver
through their regular distribution channels. Similarly,
investors too will enter into these contracts with little
intention of ever owning the underlying, but will rather
have the objective of simply placing a bet on future
price changes.
Interest in silver and commodity futures has grown
in recent years due to a number of factors. Firstly,
research has shown that historically, commodity futures
have delivered similar returns to those of equities,
while maintaining a somewhat equivalent level of risk.
As such, commodities are no longer being viewed as
too risky for the average portfolio, and are now actually
increasingly utilized to minimize portfolio variance.
This is due to silver’s and, in general, the asset class’
negative correlation with the returns of traditional
assets, such as equities and bonds.
Comex The Comex division of the Nymex offers a 5,000
ounces silver futures contract and options contract
based on one COMEX Division silver futures contract.
The exchange is the world’s foremost arena for silver
derivatives with the greatest level of activity in terms
of volume and open interest. It is worth noting that in
August last year, the Nymex was taken over by the CME
Group. However, no changes were made to the silver
products’ nomenclature and their specifications.
One initial key point that merits attention regarding
the Comex (as well as all commodity exchanges) is
that there is a great deal of commercial activity on the
exchange, which is usually in practice the counterpart
of speculative activity by private investors and funds.
A critical way in which it is possible to differentiate
between the two when it comes to the major US
commodities exchanges are the regular CFTC reports on
futures and options activity that attempt to distinguish
positions held by commercial and non-commercial
players. In principle, this allows the analyst to focus
on non-commercial (and non-reportable) gross and
net positions as a measure of investor activity in
commodity futures and options. It should be noted,
however, that CFTC reports are a somewhat imperfect
gauge of investor or speculative activity, as there can
actually be a degree of investment ‘hidden’ on the
commercial side.
In reviewing the weekly CFTC data over the last twenty
years, investors’ total net positions in silver futures
tended to move in a somewhat directionally similar
trend to silver prices while also displaying a significantly
higher level of volatility.
When it comes to annual averages, investors’ net
positions, although they have fluctuated in size,
have remained on the long side over the past two
decades. This is particularly curious given the large
scale and sustained disinvestment of physical silver we
have noted that took place in the 1990s. It is also in
stark contrast to gold where CFTC shows that non-
commercials were firmly on the short side for much of
the past decade.
From end-1988 to end-2008, the net ‘investor’ long
in silver on the Comex rose from 26,587 contracts
(equivalent to a nominal 132.9 Moz or 4,134 t) to
Comex: Net “Investor” Positions
0
20
40
60
80
100
Jan-08Jan-06Jan-04Jan-02Jan-00
Netpositions(contracts,thousands)
US$/oz
2
6
10
14
18
22
Source: CFTC
SettlementPrice
Comex: Silver Non-commercial Net PositionsWeekly Net Positions and Settlement Price
16 Independent - Informed - International
The Silver Investment Market
30,244 contracts (equivalent to a nominal 151.2 Moz or
4,703 t), a gain of 14%. A historic high was achieved
in more recent times, near end-2004, of 91,212
contracts (equivalent to a nominal 456.1 Moz or 14,185
t). This came after the net long, with a great deal of
volatility, had soared for several years, after the trough
and relative low point in the price of silver in 2001.
The net long declined however from the end-2004
spike, despite a continued surge in the price of silver,
implying that investment flows from other arenas of
silver investment, namely the OTC market (and later,
ETFs), acted as the chief drivers of the price.
Finally, in contrast with a relatively stable first half of
2008, the second half saw the net long dramatically
plummet, hitting a low of 22,268 contracts at the
end of October. This was primarily the result of the
deepening global financial and economic crisis and
subsequent liquidations in financial and commodity
markets (particularly associated with a bout of hedge
fund redemptions and other investors raising cash to
cover losses elsewhere). Heavily undercut net longs
were sluggish to recover through the remaining two
months of 2008. However, the recovery accelerated
at the beginning of 2009 on the back of renewed risk
aversion and the rally in gold. By mid-February the net
long stood at 35,037 contracts, up 57% (equivalent
to 175.2 Moz or 5,448 t) from the low seen in October
2008.
Average daily turnover in Comex futures has been
steadily increasing since 1999, rising from over 16,630
contracts to over 35,000 contracts in 2008, a rise
equivalent to 93.1 Moz or 2,895 t.
Total annual volumes have climbed from near some
4.2 million contracts in 1999 to 8.9 million contracts
in 2008, up 114%. Apart from 2006, growth in total
annual volumes has remained strong over the past
several years, with 2008 recording a rise of 31% to
approximately 44,586 Moz or 1.39 Mt.
Overall open interest on the New York exchange has
visibly trended in line with the spot price of silver
over the past decade, rising from 76,387 contracts
at end-1999 to 85,923 contracts at end-2008 (a gain
equivalent to 47.7 Moz or 1,483 t). Looking at growth
in end-year levels from 1999 to 2008, the gain in open
interest has averaged roughly 5% over the period, with
an impressive year-on-year rise of 51% recorded in
2007 followed by a similar in scale decline of 44% the
year after. Prior to this in 2008, though, a historic high
of 189,151 contracts was set on February 19th, roughly
one month before silver’s multi-decade high of $20.92
on March 17th. By the end of last year, open interest
had more than halved and totalled 85,923 contracts
equivalent to a nominal 429.6 Moz or 13,362 t.
CME Group/NYSE EuronextThe CME Group (formerly known as the Chicago Board
of Trade (CBOT) prior to the 2007 merger between
the Chicago Mercantile Exchange and the CBOT) offers
a standard silver futures contract of 5,000 ounces in
addition to a “mini-sized” 1,000 ounces contract. On
March 14th 2008, the NYSE Euronext announced it
would purchase the CME Group’s Metals Complex.
Moreover, as mentioned earlier in this section, an
acquisition of the Nymex by the CME Group was
completed in August of 2008.
In 2007, total open positions in CME Group silver
futures were at such low levels over the majority of
the year that only 12 observations were reported
by the CFTC. Furthermore, even at the times when
open interest was sufficiently large to be reported, the
data show that the CBOT accounted for but a small
fraction of the total open interest on US-based futures
exchanges. In reviewing the years prior, 2006 also
-100
-50
0
50
100
150
200
250
Jan-07Jan-05Jan-03Jan-01
Netpositions(contracts,thousands)
Silver
Comex: Non-Commercial Net Open Interest
Gold
Short
Long
Weekly Net Position
Source: CFTC
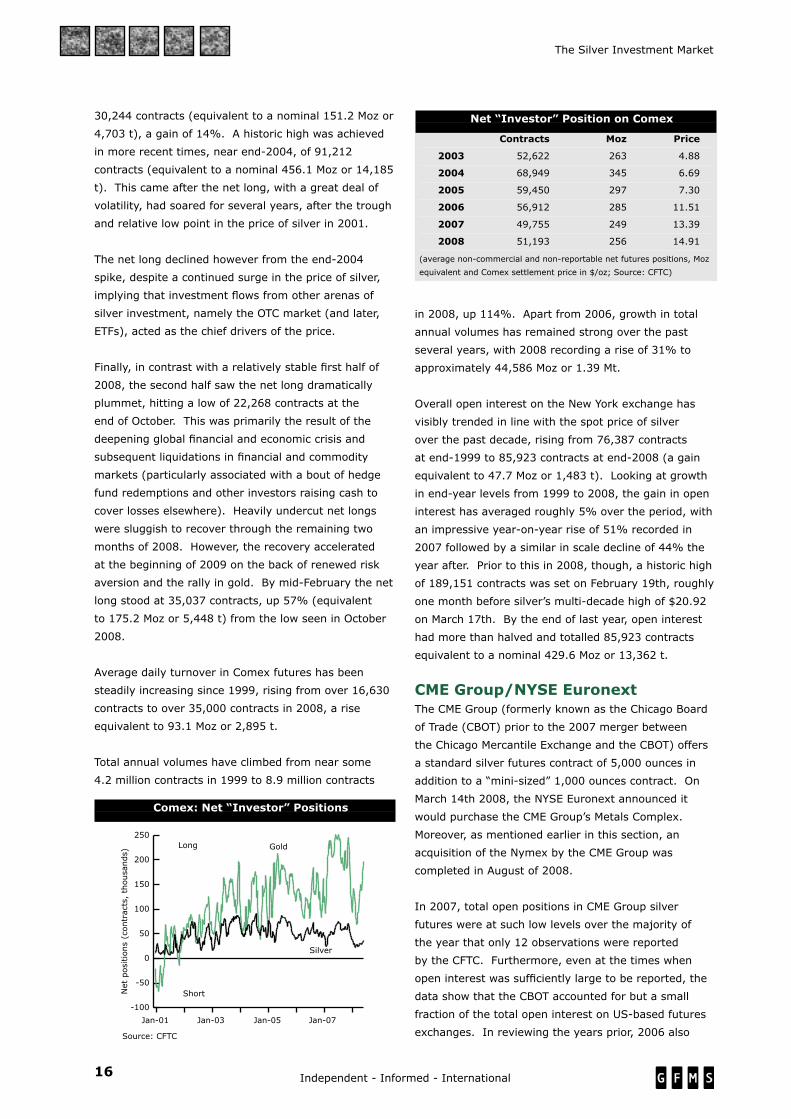
Comex: Net “Investor” Positions
Net “Investor” Position on Comex
Contracts Moz Price
2003 52,622 263 4.88
2004 68,949 345 6.69
2005 59,450 297 7.30
2006 56,912 285 11.51
2007 49,755 249 13.39
2008 51,193 256 14.91
(average non-commercial and non-reportable net futures positions, Moz
equivalent and Comex settlement price in $/oz; Source: CFTC)
17Independent - Informed - International
The Silver Investment Market
saw trivial levels in data reported by the CFTC on non-
commercial and non-reportable positions on the CBOT.
In 2006 the combined net long for these averaged
5,000 contracts, less than 10% of the relevant figure
for the Comex.
When looking at total volumes in CBOT 5,000 oz silver
futures, turnover levels saw a notable rise in 2006 to
1.2 million contracts up from a total volume in 2005
of 86,218 contracts. It is important to note here,
however, that the gain was partly due to levels having
risen from a very low base as the contract was only
launched in the third quarter of 2004. In 2007, after
the impressive run up the year prior, daily volumes on
the exchange rose less strongly, by 25% to 1.5 million
contracts, equivalent to around 22% of the annual
turnover on the Comex the same year. Volume on
the CBOT in 2008 fell away sharply to just 0.5 million
contracts.
After the gains seen in end-year levels in overall open
interest in 2005 and 2006 in the 5,000 ounce contract
(where positions went from 514, to 1,633 to 9,970
contracts from 2004, 2005 and 2006 respectively),
gaining by 218% and 511% respectively, the 2007
end-year level fell to half that of the previous year’s,
at 4,860 contracts. It is important to note that, in
contrast to gold, where activity on the CBOT has had
a significant impact on the market at various points
in time over recent years, the CBOT’s influence on
the silver market has been minimal due to it never
achieving a sufficiently high share of global silver
futures trading. Trading activity continued to diminish
further in 2008 until in September last year the
contract was transferred to Liffe, the global derivatives
business of the NYSE Euronext group. From that point
through to the end of 2008 turnover in 5,000 ounce
silver futures totalled over 72,000 contracts, a level
close to the entire year’s turnover on the CBOT in 2005.
Overall end-2008 open interest for the contract totalled
2,174 contracts or 55% less compared to end-2007,
when it was still trading on the CBOT.
Tocom The Tocom is another important exchange for trading
in silver derivatives, and offers a 30 kg contract quoted
in yen, which began trading on January 26th 1984.
The fact that the contracts are priced in the Japanese
currency makes for a market in which demand for silver
futures traded on the exchange is influenced by the
yen’s exchange rate movements against the dollar;
where yen appreciation against the dollar diminishes
the returns in the yen-denominated silver price and
typically drives net speculative positions down.
GFMS have data back to 2004 on non-reportable net
positions on the Tocom, which are a fair proxy for
investors’ positions on the Japanese exchange (this
data has been kindly provided to us by Sumitomo
Corporation), Prior to 2004 and through to April of that
year we understand that in aggregate these positions
were net short silver. The move to the long side
occurred soon after the non-reportable net position had
risen from a trough of -16,270 contracts (equivalent to
15.7 Moz or 488 t) on February 13th 2004. Since April
2004, the net position has remained on the long side
during a majority of the time, while often fluctuating in
an inverse pattern to the yen-denominated silver price.
The most recent spike in investors’ net long positions
occurred near the end of 2005, when these achieved a
level of well over 15,500 contracts (equivalent to over
a nominal 15 Moz or nearly 473 t). Since then, the net
speculative long has gradually trended downwards.
Net speculative positions, since the second quarter
of 2007, have diverged noticeably from the yen-
denominated silver price, with the reason for this likely
attributable to a trend reversal in the yen versus the
dollar; as the former recently rallied to a high of 96, a
level not seen since the third quarter of 1995. Again,
this is illustrative of how strength in the yen against
the dollar typically acts to mitigate the dollar hedging
appeal of silver futures on the Tocom. In 2008, in spite
of dollar prices reaching fresh highs, the net speculative
long remained subdued, again, most likely due to the
continued surge in the yen over much of the period.
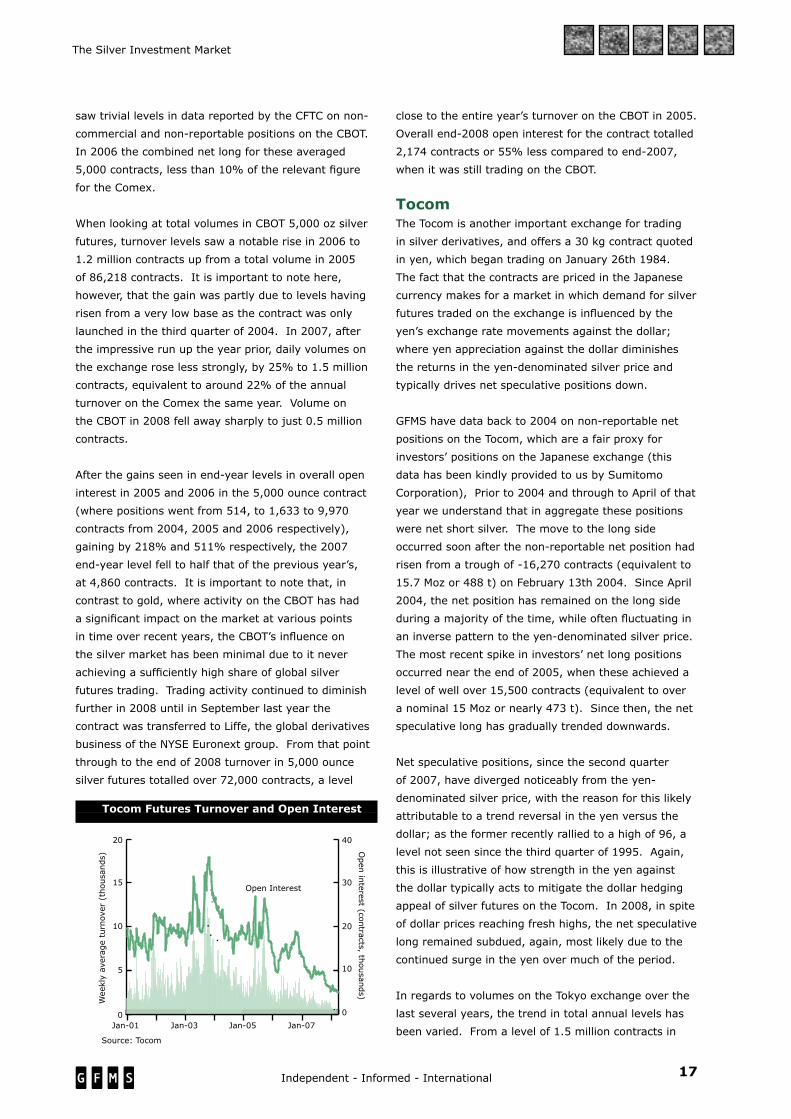
In regards to volumes on the Tokyo exchange over the
last several years, the trend in total annual levels has
been varied. From a level of 1.5 million contracts in
Tocom Futures Turnover and Open Interest
0
5
10
15
20
Jan-07Jan-05Jan-03Jan-01
Weeklyaverageturnover(thousands)
Openinterest
(contracts,
thousan
ds)
0
10
20
30
40
Source: Tocom
Open Interest
Tocom Silver Futures
18 Independent - Informed - International
The Silver Investment Market
2004, total turnover slid in 2005 and 2006 to 817,624
and 858,153 contracts, respectively (equivalent in
each case to a nominal 24,529 t and 25,745 t). Total
volumes fell again in 2007, dropping by 37% to
536,583 contracts (equivalent to a nominal 517.5
Moz or 16,098 t). The fall accelerated in 2008, with
total turnover collapsing 45% to 297,764 contracts
(equivalent to a nominal 8,934 t). Overall open interest
in silver futures on the exchange at the end of 2005
reached a level of slightly under 17,000 contracts,
dipping 11% to record an end-2006 level of just over
15,000 contracts. However, this decline increased by
over three times the following year as the end-2007
level sank to a little over 9,500 contracts. 2008 saw
the number dropping further, down by nearly 42% to
5,464 contracts. To put this in perspective, the nominal
silver equivalent of these open positions amounted to
just 5.3 Moz (164 t) compared to an equivalent end-
2008 figure on the Comex of 429.6 Moz (13,362 t)
which was about 81 times higher.
Other ExchangesIn recent years, financial liberalization in various
developing countries, combined with notable growth
in investment demand for commodities has resulted in
the launch of several new global commodity exchanges,
with many of these experiencing a gradual expansion
in activity. In relation to overall market share however,
these platforms have exhibited relatively low trading
volumes and thus far had an insignificant impact on the
silver market.
Shanghai Futures ExchangeAt present, the Shanghai Futures Exchange only lists
contracts on gold, copper, aluminium, fuel oil and
natural rubber. Yet, with consumer prices at elevated
levels in China, demand for silver and precious metals
as an inflation hedge may continue to grow. To note,
evidence of rising investor interest in exposure to gold
was evidenced by the impressive launch of a gold
futures contract on the exchange on January 9th 2008.
The robust activity that the contract saw on its first
trading day (where large volumes were recorded as the
contract traded at a hefty premium of nearly $100 over
world gold prices) was highly indicative of the potential
for the new contract to prove key in channelling
substantial inflows from Chinese investors. Basis
this, the launching of other commodity futures on the
exchange, namely silver, seems conceivable as Chinese
investors seek to diversify their pool of savings.
Indian Exchanges In India, silver futures contracts are traded on the Multi
Commodity Exchange of India (MCX), with a 30 kg
contract and a mini contract (5 kg), and on the National
Commodity and Derivatives Exchange (NCDEX), which
also offers a 30 kg and 5 kg contract. Both exchanges
have been active since the last few months of 2003 but
represent only a small share of the global silver futures
market. The MCX is India’s dominant commodity
exchange, and, after reaching a level of 300,000 t in
2006, total volumes gained a further 9% in 2007 to
over 328,000 t. In 2008 total volumes on the exchange
continued to grow with a rise by nearly 20% to slightly
over 393,000 t. Looking at open interest, end-year
levels have trended lower over the past few years,
sliding from a level of 613 t in 2005, to 351 t at end
2007. However, the trend changed direction in 2008
with an open interest climbing to a level of close to 399
tonnes by the year-end.
Activity on the NCDEX is a fraction of the size of that
on the MCX. Nevertheless, the NCDEX saw remarkable
volume growth of 281% in 2005, with annual turnover
that year reaching just under 70 million contracts,
up impressively from 18.3 million contracts in 2004.
However, this was not to last, total volumes falling
by 18% the following year to slightly under 60
million contracts. Thereafter, activity on the NCDEX
plummeted, as annual turnover dropped to just 15.5
million contracts in 2007. The fall continued in 2008
with the total number of contracts traded in the year
collapsing to 4.6 million (approximately 138,000 t), a
fraction of its peak reached in 2005.
Dubai Gold and Commodities ExchangeThe Dubai Gold and Commodities Exchange (DGCX)
commenced trading in late 2005, and offers a 1,000
ounce silver futures contract, which launched on March
28th 2006.
The contract’s trading volumes in its early stages were
at decent levels, however, activity eventually slumped
and has since remained at low levels. For example, in
the first half of 2008, total volume stood at just under
2,000 contracts (equivalent to a nominal 62 t or 2
Moz). The second half of the year was even weaker
with only 640 contracts traded (19.9 t or 0.64 Moz).
Open interest data is not available for this exchange.
19Independent - Informed - International
The Silver Investment Market
ii. The Over-the-Counter and Metal Account MarketsA substantial portion of investor activity in silver takes
place in spot and derivative products issued by a
variety of institutions over-the-counter (OTC), rather
than through a marketplace such as a commodity or
stock exchange. Depending on their size, nature as
well as their relationship with the respective issuers,
investors can access such products either directly from
the issuing institution or through a brokerage or trading
platform.
The main advantages of using OTC products are related
to costs, flexibility and confidentiality. Starting with the
cost argument, the lack of a formalized marketplace,
the limited requirement for reporting by implication
and the economies of scale related to higher ticket
sizes result in the overall costs of operating on the OTC
market being lower. Part of this decline is certainly
passed to the investor. Regarding flexibility, depending
on the respective issuers, the OTC market allows for
tailor-made products to be created in order to satisfy
the specific needs of various investors as well as
provide scope for higher unmargined leverage than that
offered on a futures exchange.
Finally, the opacity that is inherent in trading OTC
products (related to the aforementioned relaxed
reporting requirements, at least compared to the
various futures exchanges), is another factor that
pushes certain players, towards OTC products. This
property of the OTC market is particularly attractive to
investors of substantial size, whose actions could distort
the market in a counter-productive manner,
In the case of silver, the OTC market offers an
additional advantage to investors. Specifically it
provides them with an avenue to tax free silver, in
countries where physical purchases are taxable. For
instance, in Europe investors can accumulate silver
free from Value Added Tax, as long as the metal is
in the form of unallocated as opposed to allocated
metal accounts. As a result, many players who, were
it not for the tax considerations, would normally
purchase physical silver, are drawn into this segment
of the market to avoid paying tax, at the expense of
somewhat higher counterparty risk.
The cost for all the above-mentioned benefits of
operating in the OTC market comes in the form of a
notably higher minimum investment threshold. This is
more pronounced when dealing directly with product
issuers. (When trading through a broker of course the
threshold is notably reduced, at the expense of higher
costs and lower flexibility.) As a result of all the above,
the OTC market tends to be the stomping ground of
institutional investors, high net-worth individuals and
family offices as well as the private wealth management
community. In contrast, the presence of smaller retail
players is minimal.
As far as the types of silver-linked products found in
the OTC market are concerned, a wealth of instruments
ranging from simple spot, forward and vanilla option
products to more complex structured products is
available to suit different investors’ needs. Overall
though, activity tends to be centered around the
simpler rather than the more complicated products’
end of the spectrum. Unallocated metal account, in
particular, seems to be the segment of the OTC market
that attracts the largest pool of liquidity.
On the back of long positions in metal account, GFMS
are aware of investors often writing out-of-the-money
call options. On the one hand these can serve as an
automatic profit-taking trigger, for those players that
wish to follow the relevant strategy. On the other, the
option fee essentially comprises a return to investment,
regardless of whether the option is exercised or not.
Depending on the option, return can often match or
exceed the yield available in the money markets (and
in recent years has almost certainly been significantly
higher than any yield gained through leasing the
metal). Players who are only interested in the fee
rather than the profit taking, when called out of their
position will often immediately re-purchase silver to
replenish their stock.
Similarly, investors that are interested to acquire or
expand a long position in silver will often do so by
selling puts. Regardless of whether these are exercised
or not, this generates an income from the option fee.
If the put is then exercised, the issuing investor simply
buys the metal they wanted to purchase anyway.
(Opposite strategies to the two described above using
vanilla options are of course also utilized by investors,
depending on their view and objective.)
Investor activity in allocated metal accounts is normally
limited in silver’s case and notably lower than that
in gold. This has generally continued to be the case
recently, despite mounting concerns over counterparty
risk, in the aftermath of the sub-prime crisis. When
it comes to gold, such concerns have prompted a
20 Independent - Informed - International
The Silver Investment Market
London Bullion Market Volume
good deal of switching from unallocated to allocated
positions, something that has been less noteworthy
in silver’s case. In large measure, this is due to the
far higher storage costs allocated positions in silver
suffer from compared to gold, particularly in terms of
percentage of value. (This is due to a given amount
invested in silver being far larger in volume that if it
were invested in gold.) One additional consideration
when looking at allocated metal accounts outside
London or the United States is tax that is often
applicable (as such positions are treated similarly to
holdings in physical metal, discussed in detail in the
next chapter).
Moving to the drivers that push investors into acquiring
positions linked to silver in the OTC market, the fact
that silver belongs to the precious metals’ as well
as the wider commodity complex once again stands
out. (Players specifically interested in the white metal
rather than either of the two wider asset classes
mentioned above tend to be a minority, particularly
outside the United States.) It is therefore the norm
that investors’ portfolios will include a range of
commodities (sometimes specifically belonging to one
or another sub-sector) whose weights are varied over
time depending on investment objectives and views
of the markets. For instance, in Europe and Asia, it is
infrequent for investors only to hold silver through OTC
positions. Usually they will also hold gold or perhaps a
basket of commodities. On the other hand, it is fairly
common for investors in these regions to hold gold and
have no other commodity exposure.
In addition to the above, through to at least the middle
of 2008, a significant portion of the OTC market in
silver reflected purchases related to OTC commodity
basket products of one form or another. Since then
these positions have fallen in size as a result of the
major sell off in commodities that took place in the
second half of 2008. Nevertheless, we understand that
a fair amount of silver would still be invested in via
commodity indices and the like.
Regarding the precise nature of these commodity-linked
investments, these can range from a passive basket
with fixed weightings, issued by an investment bank,
fund or other financial services institution all the way
to actively managed hedge funds or mutual funds that
specialize in commodities.
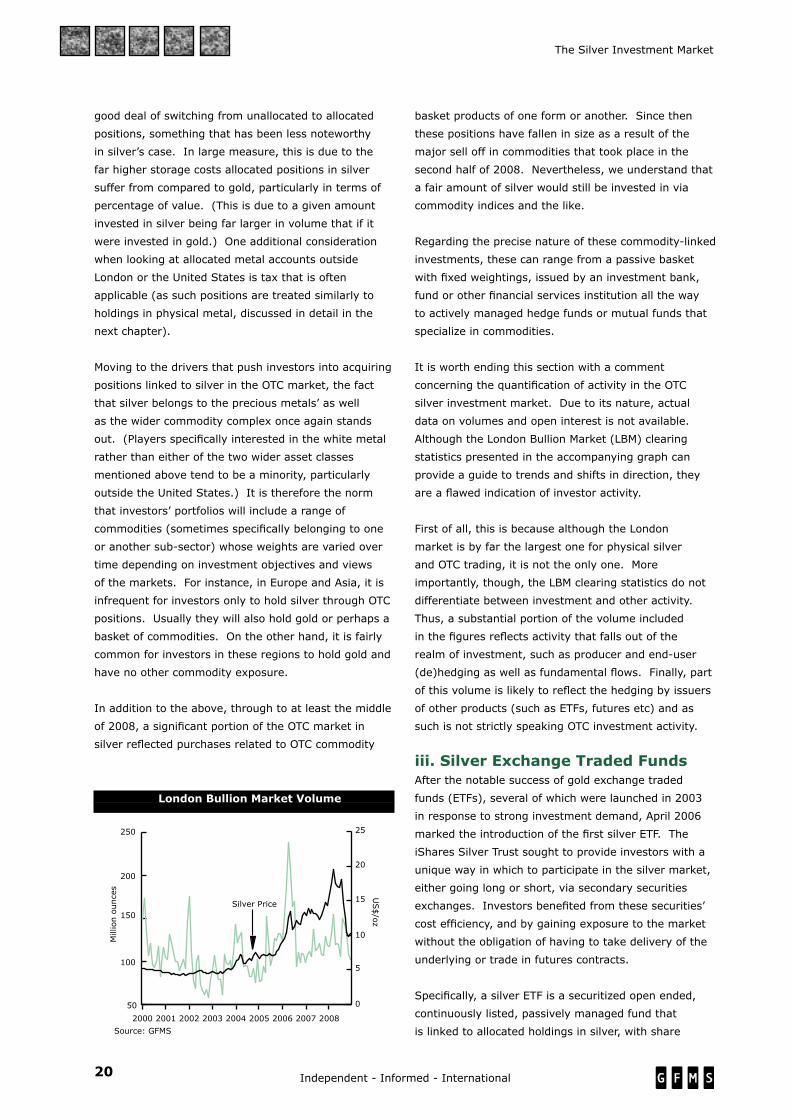
It is worth ending this section with a comment
concerning the quantification of activity in the OTC
silver investment market. Due to its nature, actual
data on volumes and open interest is not available.
Although the London Bullion Market (LBM) clearing
statistics presented in the accompanying graph can
provide a guide to trends and shifts in direction, they
are a flawed indication of investor activity.
First of all, this is because although the London
market is by far the largest one for physical silver
and OTC trading, it is not the only one. More
importantly, though, the LBM clearing statistics do not
differentiate between investment and other activity.
Thus, a substantial portion of the volume included
in the figures reflects activity that falls out of the
realm of investment, such as producer and end-user
(de)hedging as well as fundamental flows. Finally, part
of this volume is likely to reflect the hedging by issuers
of other products (such as ETFs, futures etc) and as
such is not strictly speaking OTC investment activity.
iii. Silver Exchange Traded FundsAfter the notable success of gold exchange traded
funds (ETFs), several of which were launched in 2003
in response to strong investment demand, April 2006
marked the introduction of the first silver ETF. The
iShares Silver Trust sought to provide investors with a
unique way in which to participate in the silver market,
either going long or short, via secondary securities
exchanges. Investors benefited from these securities’
cost efficiency, and by gaining exposure to the market
without the obligation of having to take delivery of the
underlying or trade in futures contracts.
Specifically, a silver ETF is a securitized open ended,
continuously listed, passively managed fund that
is linked to allocated holdings in silver, with share
50
100
150
200
250
200820072006200520042003200220012000
Millionounces
US$/oz
Implied Net Investment
0
5
10
15
20
25
LBMA Monthly Turnover
Silver Price
Source: GFMS

21Independent - Informed - International
The Silver Investment Market
Historical Silver Prices
Silver ETFs (million ounces)
(end-period) 2006 2007* 2008
iShares Silver Trust 121.1 148.8 218.4
ETF Securities - 12.4 14.2
ZKB Silver ETF - 9.1 32.7
Total 121.1 170.3 265.4
Silver Price (US$/oz) $12.90 $14.76 $10.79
Source: GFMS, collated from respective ETF issuers’ data
*end-2007 data refers to December 28th
prices that reflect the spot price of silver held by the
fund. There also exists an ETF (ETFS Silver), which is
designed to follow the DJ-AIG Silver Total Return Sub-
IndexSM; and a leveraged ETF that offers an exposure
to the same index (200% times the daily percentage
change).
Perhaps one of the more crucial aspects of these
products is that they have provided large institutional
players, such as insurance companies and pension
funds (which are typically precluded from purchasing
commodities and futures) with a highly liquid tool with
which to access the silver market, gaining for the first
time a near direct, price exposure to the underlying
physical commodity.
Demand for and inflows into these vehicles have been
fueled by a host of investment drivers also present
in the gold market. Namely, these are noted to be
historically low short term US interest rates (with real
rates now negative), a need to hedge against the
falling dollar, ongoing geopolitical tensions and a trend
towards diversification into commodities and alternative
assets. For much of 2008, interest in silver ETFs was
spurred by the sub-prime and credit crises, a downturn
in the US economy, greater uncertainty regarding global
growth and, during the first half, soaring inflationary
pressures created by surging energy and food prices.
Historical BackgroundBeyond creating a new form of investment and
widening the investor base for silver, ETFs have had
a substantial impact on the price. While a spill-over
effect from the bull market in gold has undoubtedly
been beneficial to silver, GFMS believe the price levels
which have prevailed in recent years would have been
difficult to achieve had it not been for the introduction
of a silver ETF.
To understand why, and in gaining some perspective
over the impact these products have had on the
market, a review of historical prices is warranted.
Firstly, prior to 2004, silver had been in a bear market
for the better part of two decades. From 1985 to
2004, annual average prices (during all but one year)
remained below the $7-level, and averaged just over $5
for the period. Yet, when looking at the market prior
to and then after the launch of the first ETF product in
April 2006, it is clearly apparent that a structural shift
in the equilibrium price level occurred during 2005. For
example, the average price from 2005 through to 2007
was up impressively at $10.75. Growing investment
demand, much of it via ETFs, lifted the silver price even
higher in 2008 when the metal averaged $14.99.
It is further worth noting that the introduction of the
first silver ETF, when compared to the gold one, had
a far stronger effect on investor sentiment. This was
basis expectations that the iShares product would
have an impact which far exceeded that of the similar
product on gold, due to the potential for the silver
ETF to absorb a much larger portion of the available
above-ground stocks of the metal (and therefore act
as a drain on the available pool of liquidity). As such,
market participants looked to a near term spike in
prices and surge in lease rates; a view which began
to gather momentum as far back as May 2005 when
0
5
10
15
20
25
2005200019951990198519801975
Annual Prices
1985-2004Average: $5.23U
S$/oz
1980 Average: $52.80
2008 Average:$14.99
Source: GFMS
Silver ETFs Trading Information
Ticker Currency Exchange
iShares Silver Trust SLV USD AMEX
ETF Securities PHAG USD LSE
PHSP GBX LSE
VZLC EUR Xetra
PHAG EUR Euronext Amsterdam
PHAG EUR Borsa Italiana
PHAGP EUR Euronext Paris
ETF Securities (leveraged) LSIL USD LSE
ZKB Silver ETF ZSIL CHF SWX
Source: GFMS, collated from respective ETF issuers’ data

22 Independent - Informed - International
The Silver Investment Market
Silver ETFs
rumors of a silver ETF fi rst began circulating. These
growing expectations resulted in investors aggressively
expanding their long positions in silver in the futures
and OTC markets, and at the same time, there is
evidence that precautionary borrowing was also taking
place; as market participants looked to avoid the
infl ated lease rates that were expected to occur after
the product’s introduction. The result was a rise in the
silver price and the cost of borrowing the metal, as
expectations of higher prices created exactly that, in a
classic example of what turned out to be a self-fulfi lling
prophecy (all occurring well before the product had
even launched).
Subsequent to the iShares product launch, however,
the market’s fears proved largely exaggerated. Price
rises following the product’s debut were much lower
than some had anticipated and it soon became evident
that the silver ETF’s drain on the market’s liquidity was
less dramatic than initially feared. What is more, lease
rates began to ease as the precautionary borrowing
that had taken place in early 2006 began gradually
to unwind. Rates continued to trend downwards until
they bottomed in late November, with borrowing costs
having remained low to negative until fairly recently.
Such overall results were not due to any lack of interest
in the product. Indeed, the iShares product initially
recorded robust infl ows, yet such growth was largely
offset by an unwinding of positions in other arenas of
the silver market, namely the OTC and futures markets.
In part this refl ected some investors in the latter two
markets switching a portion of their funds into the ETF
product. Probably of greater importance, however,
was the liquidation of long positions by those who
had successfully front run the ETF’s launch, allowing
them to take profi ts at multi-decade highs. Further
restraining the possibility of a liquidity squeeze and
(additional) price spike, was the broad correction in
base and precious metals in late May through to mid-
June 2006. During this time, silver prices tumbled
from their 25-year highs of near $15 to a trough of
under $10 by mid-June. After a period of consolidation
and range-bound trading through the rest of 2006
and 2007, silver resumed its move higher in the fi rst
half of 2008, jumping to a 28-year high of near $21.
However, a steep correction followed in July-October
2008, driving the price below $9. As the sell-off ran
out of steam however, the white metal rebounded and
at the time of writing is fi rmly trading in a $12-$14
range. It is interesting to note that since July and
through to February 2009 that investment in silver ETFs
has remained very robust. For instance, during the
initial drop in the price in August and September last
year combined ETF holdings actually increased by over
30 Moz or nearly 1,000 t. Thereafter they remained
reasonably stable in the fourth quarter before resuming
growth again in the fi rst two months of 2009. In our
view, the resilience of silver ETFs during the heavy sell-
offs across the commodities complex in the second half
of last year did much to limit the damage to the silver
price, which in the absence of this support would most
likely have fallen further and, most importantly, failed
to have recovered as strongly as has turned out to be
the case.
Comparisons with Other Commodity ETFsThere are now numerous ETF products that are based
on commodities, many of which have seen healthy
growth and have proved popular with both retail and
institutional investors. The performance of these
ETFs are of course closely linked to the underlying
commodities that they track, and of the fi ve listed
products in the table above, the price of the Power
Shares DB Agricultural Fund saw the most notable
gains in 2008, up by 377%. The United States Oil Fund
Average Daily Volumes of Commodity ETFs
(shares ‘000s) 2007 2008
iShares Silver Trust 4,409.7 7,022.8
SPDR Gold Trust* 6,062.9 15,980.5
US Oil Fund 3,310.4 15,389.0
Market Vectors Steel Fund 100.0 403.6
PowerShares DB Agricultural Fund** 326.9 1,559.3
*Formerly: StreetTRACKS Gold
**From 05 Jan 2007
Source: Commodity Systems, Inc. (CSI)
Millionounces
US$/oz
Settlement Price0
50
100
150
200
250
300
JulJan-08JulJan-07JulMay-06J6J6
10
14
18
22
ETF
Source: various ETF issuers
Silver Price
ETF Securities
Zürcher Kantonalbank
iShares Silver Trust
23Independent - Informed - International
The Silver Investment Market
exhibited a similar gain, with a return of 365%, while
the iShares Silver Trust recorded a gain of 59% over
the relative period. Rather impressively, in terms of
total value, at end-2008, the SPDR Gold Trust was the
largest among gold and silver ETFs, at $21.8 billion,
with the iShares Silver Trust the third biggest, at nearly
$2.4 billion.
The notable jump in the share prices and volumes
of these vehicles, which tend to be purchased by
investors with longer term investment horizons, is
illustrative of the trend of greater asset allocations
towards commodities, which we believe remains intact
over the longer run in spite of the massive sell off in
commodities during the second half of 2008. At least
some large institutional investors, such as pension
funds and insurance companies, have utilized these
instruments for various investment objectives, most
obviously for portfolio diversification.
Growth in Silver ETFsThe growth in total ETF holdings of silver has been
impressive over the past two years. Moreover, as
indicated above, these positions have proved to be
highly resilient during corrective phases in the precious
metals markets such as those that occurred during the
second and third quarters of 2008. The buoyancy of
these holdings is largely attributable to the fact that
(in contrast to the short term speculative flows that
often are a defining feature of futures exchanges)
the investors in silver ETFs are typically pursuing a
buy and hold strategy and seeking long term capital
appreciation. To illustrate, when prices markedly eased
from the 25-year highs recorded in mid-March 2008,
silver’s three physically-backed ETFs actually saw an
acceleration in growth, holdings rising by 10% over the
second quarter, up from a gain of 7% recorded over the
first quarter of the year. Despite the silver price sinking
by 58% to $8.88/oz in October 2008 from its mid-
March high the combined holdings of silver ETFs proved
to be resilient, with only minor redemptions occurring
during the October-November period. Such gains
noticeably contrasted with the trend on the Comex in
2008, where the non-commercial and non-reportable
net long position declined by 53%.
In 2009 to-date, silver has been increasingly favored
by investors due to generally increased risk aversion, a
positive spill-over effect caused by the rally in gold and
the belief in some quarters that silver was ‘cheap’ on a
ratio basis relative to its more expensive yellow cousin.
Indicative of the renewed surge in investor interest
was that combined silver ETF holdings surpassed a
new milestone of 290 Moz or over 9,000 tonnes at the
end of January and that these have also showed solid
growth of 13% since the beginning of 2009 through to
mid-February. This suggests that those investing in
ETFs were at times buying on price weakness, using
dips as an opportunity to increase positions.
Looking specifically at the growth of silver’s ETFs in
2008 alone, total bullion holdings across the three
investment vehicles experienced substantial gains,
rising by 56% or 94.8 Moz (equal to roughly 2,949 t) to
265.1 Moz (8,245 t) and a nominal value of $2.9 billion
by end-year.
In regards to individual products, the iShares
Silver Trust is the ultimate leader in terms of metal
accumulated since the ETF was launched in April
2006. Stocks of the fund grew markedly during 2007,
increasing by close to 23% or 28 Moz (a little under
900 t) to 148.82 Moz (4,629 t) by end-year. During
2008, the fund’s holdings surged by nearly 47% to a
level of 218.40 Moz (6,793 t) at year-end. (Note that
end-2007 data used for this analysis is basis the fund’s
holdings reported for December 28th, 2007 as the
figure for 31st December is a ‘rogue’ one.)
Following on the marked success of the iShares
product, two additional silver funds were launched
in the first half of 2007 by ETF Securities and the
Swiss Zürcher Kantonalbank. By end-2007, the
ETF Securities fund had seen healthy inflows as
accumulated holdings rose to over 12 Moz (384 t)
since the fund’s launch on the London Stock Exchange
on April 24th. Further growth in volumes took place
in 2008, with silver stocks held in the ETF Securities
product reaching 14.28 Moz (444 t) by the year-end.
The Zürcher Kantonalbank issued ETF (ZKB Silver),
which trades on the Swiss Stock Exchange and was
launched on May 11th 2007, reached a level of 9.14
Moz (284 t) by the end of that year. Over its first
seven months the vehicle experienced good demand,
which was partly driven by the decision by Novartis,
the Swiss-based pension fund, to allocate 4% of its
CHF 14 billion portfolio into precious metals. Growth in
holdings over 2008 was also strong, with total volumes
gaining by an impressive 255% to end the year at
32.44 Moz (1,009 t).

24 Independent - Informed - International
The Silver Investment Market
In terms of value, silver’s three physically-backed
ETFs rose to a level of just under $4 billion by the end
of June 2008. However, over $1.1 billion evaporated
in the second half of 2008 on the back of the sinking
silver price that was severely hit by a heavy sell-off in
the July-October period. A total value of nearly $2.9
billion as of end-2008 falls well short compared to the
collective value of gold ETFs, at over $34 billion at the
same date.
Finally, it is worth adding a word of caution. It is
important to note that while the surge in volumes of
silver ETFs continues, these holdings also represent a
overhang in the market, and could therefore potentially
be a source of downside risk to the price over the
longer term. Despite the resilience to liquidation that
holdings in silver ETFs have thus far shown, any new
significant retracement in the price could see this
reverse some time in the future, particularly if the
underlying conditions currently favoring investment
demand in precious metals were to change materially.
iv. Stock Exchange Listed Structured ProductsAs the name suggests, stock exchange listed structured
products on silver are standardized derivatives listed
on a number of stock exchanges. They are issued by
financial services providers such as investment banks
and are in their overwhelming majority cash settled.
Indeed, investors in these products do not normally
have the option to take physical delivery.
Stock exchange listed structured products comprise
warrants, knock-out warrants and certificates. The
former are standardized vanilla options, set at various
strike levels and expiries. The majority of silver
warrants are American style options (in other words
they can be exercised at any point prior to their
expiry), with the balance being European style (they
cannot be exercised until their expiry). If a warrant is
“in-the-money” (meaning that the silver price is at a
level higher than its strike price) and is exercised, the
investor is remunerated with the difference between the
strike and the silver price at the time of exercise.
Knock-out warrants on silver are also standardized
silver options, with the addition of a knock-out barrier.
If the silver price reaches that barrier, the security
becomes worthless (regardless of whether the price
returns to levels above or below the aforementioned
barrier). Due to the higher risk inherent in knock-out
warrants compared to simple vanilla warrants, they
are, ceteris paribus, relatively cheaper. Although in
theory the barrier for a silver warrant can be set to a
level higher, equal or lower than the strike price, to
our knowledge there are no products belonging to the
latter category available on the exchanges monitored.
By implication, knock-out warrants are “in-the-money”
when they are issued.
The last remaining group, namely certificates, includes
all other exchange listed structured products. Simple
and quanto (which includes an automatic currency
hedge) price trackers, mini futures, discount, bonus and
a range of other more complex products are available,
to suit various investment objectives.
Trading in warrants and certificates provides small
to medium sized retail investors with a number of
advantages. The most important of these are low entry
level and ease of access, due to their essentially being
traded as shares. In addition, unleveraged products
such as price trackers offer investors the ability to gain
a similar exposure to the silver price as physical metal
purchases, without the need for them to pay tax (at the
cost, of course, of counterparty risk).
Despite the above-mentioned benefits, exchange listed
structured products suffer from relatively high costs
and a lack of flexibility compared to other arenas of
silver investment such as the OTC and futures markets.
Moreover, in contrast to ETFs and allocated metal
account, investing in warrants and certificates involves
exposure to counterparty risk.
As mentioned earlier, warrants and certificates are
normally cash settled products. Nevertheless, activity
in silver exchange listed structured products can and
does have an impact on the underlying physical market,
through product issuers’ hedging against any open
positions. It is unfortunately not possible to provide
a sufficiently accurate estimate of the magnitude
of this impact, due to the diversity and opacity of
the different issuers’ hedging policies. Based on
information collected through field research, we are
nevertheless confident that, overall, this segment of
silver investment activity accounts for only a very small
portion of the total.

25Independent - Informed - International
The Silver Investment Market
5. Physical Investment in Western and Developing Markets
Throughout the world, investor attitudes regarding
purchasing silver in physical form are greatly varied.
On the one hand, this is driven by fundamental
differences in the types of players and their objectives,
as well as the legacy silver has as an investment
vehicle within the respective areas. Moreover, as
was mentioned in the second chapter of this report,
such differences are augmented by the varying tax
regimes concerning purchases of physical metal, as this
clearly affects expected returns. This chapter begins
by examining one of the most important, historically,
markets for investment in silver coins and bars, that
of the United States and North America. Europe is
then discussed in some detail, along with silver bullion
investment in India.
It is worth commenting here on the lack of any
discussion on physical investment demand in the bulk
of the developing world. This might seem strange,
particularly considering the notable volumes of gold
bar hoarding demand GFMS record in many East Asian
and Middle Eastern countries. For example, in 2008
demand in Vietnam and Iran stood at 3.1 Moz (96 t)
and 2.7 Moz (85 t) respectively. This is due to the fact
that, in contrast with gold, the majority of developing
countries do not have a tradition of investing in silver.
lnvesting in precious metals in physical form is in
general a somewhat costly option due to the markups
charged to cover fabrication costs. This obviously
becomes more acute the smaller the size of the
individual bullion product. In addition to such costs,
investors also need to consider the issue of storage. If
held privately, investors need to consider the risk of
Primary Sales of Silver Eagle Bullion Coins
loss through theft or alternatively, the cost of insurance
at any facilities purchased to store the metal (for
instance, privately owned safes). If stored in a safety
deposit box or in the vaults of one of the counterparties
that offer such facilities, the storage fees (as well as,
at the margin, some counterparty risk) are the obvious
additional costs.
In regards to the world coin market, it is revealing
to note the importance of commemorative coins, in
comparison to bullion coin products. For example, data
for 2007 points to a little over half of the global total
being accounted for by these products, although there
would still be a degree of notional investor demand
for some of these pieces. That said, the product split
by country does vary enormously. For example, the
United States, as consistently the largest fabricator
of silver coins (in the past 18 years only once, in
1998, did it briefly cede the top spot to Germany) has
seen its bullion products account for around two-
thirds of its annual outturn. In contrast, Germany,
which had comfortably retained second place in the
global rankings until overcome by Canada in 2008,
is almost entirely dominated by the production of
commemorative coins.
i. North AmericaGiven its population and wealth, it should come as no
surprise that the United States dominates physical
investment in North America. Moreover, silver has a
long pedigree as a store of value in the country, helped
in part by the United States’ record as a leading silver
producer for well over a century. In addition, silver’s
importance to private investors was enhanced during
the period from 1933-75 when investment in gold
bullion was illegal. Silver was the logical precious
metals alternative. Even after gold was freed from
Coin Fabrication & Value
Source: US Mint
0
1
2
3
4
5
6
7
8
Q1-08Q1-05Q1-02Q1-99Q1-96Q1-93Q1-90Q1-87
Millionounces
Silver Eagle Coin SalesSilver Eagle Coin Sales
0
10
20
30
40
50
60
70
20062002199819941990
Millionounces U
S$millio
ns
Coin FabricationValue (Nominal)
0
200
400
600
800
1000
World Coin Fabrication
Europe
N. America
Others
Source: GFMS
26 Independent - Informed - International
The Silver Investment Market
its shackles, however, popular demand for the white
metal remained solid. This was particularly noticeable
during the latter part of the 1970s and the early 1980s
when investors were active buyers of physical metal
in the form of 40% and 90% coin bags (consisting of
demonetized US circulating coins) and bullion bars,
mainly in 100 ounce size. For instance, such was the
appetite for silver during the great rally a generation
ago that, according to GFMS’ estimates, over 350 Moz
(10,900 t) of 100 ounce bars were produced, most of
these, in first instance, ending up in investors’ hands.
The massive increase in bullion stocks prompted by
this wave of investment was later to come back into
play as silver moved from bull to bear market in the
second half of the 1980s. Indeed, by the following
decade dealers were reporting a steady flow back
into the US market of coin bags and 100 ounce bars.
Such disinvestment was particularly noticeable on
the occasional rallies in the price, most importantly
during the spike from late 1997 through to early
1998, which was fuelled by Warren Buffett’s move
into silver. At that time, the price rally to a peak of
$7.81 in February 1998 triggered a massive wave of
dishoarding from what could be described as “stale
longs”. Net disinvestment of physical metal died down
once prices moderated but did not altogether disappear.
And, although the approach of “Y2K” prompted some
nervous buying of silver US Eagle coins, dealers
continued to report net selling back of 100 ounce bars
and, especially, coin bags. Furthermore, once the turn
of the millennium had occurred with no major adverse
impacts, the pace of dishoarding picked up again, with
net disinvestment characterizing the bullion product
market through until at least 2003.
Since then demand for physical metal from investors
has staged a comeback that, in spite of the occasional
hiccups, has been gathering marked momentum from
2004 into 2009. This is particularly clear from two
segments of the bullion product market: modern bullion
coins and 100 ounce bars. As regards to the former,
figures released by the major mints show a strong
growth in the last four years in sales of US Eagle and
Canadian Maple Leaf silver bullion coins. Indeed,
recently, demand has at times been so strong that the
mints concerned have been unable to produce sufficient
coins. In the second half of 2008, for instance, US
Eagle sales reached 10.5 Moz (327 t) compared to 6.4
Moz (200 t) over the same period in 2007 (indeed, full
year 2008 sales marked a new record for the coin).
And, when it comes to 100 ounce bars, the market in
the United States has moved from net selling, prior
to 2004, to equilibrium between buyers and sellers,
to growing net purchases in the last couple of years.
This has required new 100 ounce (and other smaller
size) investment bars to be manufactured for the first
time since the early 1980s. On the other hand, to-
date there is still a partially offsetting net flow into the
market of dishoarded coin bags. Although by no means
as abundant as formerly, this material is still being sold
back to the market on a net basis by investors, with
most of the surplus silver finding its way into certain
industrial end-uses.
It is worth making a few comments about physical
investment demand in Mexico, traditionally the world’s
largest producer of silver. As might be expected given
its historical importance to the country, Mexicans have
an affinity for silver that is reflected in the use of the
metal in recent years for circulating coins, details of
which are included in the focus box overleaf.
Investment demand for silver bullion in Canada has
traditionally been overshadowed by that for gold. Also,
given the country’s small population, it is no surprise
that the level of demand is a fraction of that seen in its
far more populous neighbors to the south. However,
the Royal Canadian Mint has since 1988 manufactured
one of the world’s premier silver bullion coins, namely
the Maple Leaf (further information can be found in the
focus box on the global coin market).
ii. EuropeIn addition to the added storage and markup
costs discussed in the introduction to this section,
investments in physical silver in Europe, are normally
also liable to Value Added Tax (VAT) charges. These
vary from one country to another and across different
forms of bullion (for instance, coin and bar form).
The implication of these charges is that in order for
investors to achieve positive returns on their physical
silver purchases, the price needs to appreciate by
more than the relevant VAT rate. This regime, as well
as silver’s legacy as a monetary asset being weaker
than, say, in the United States, are the principal
reasons behind the lower interest in physical silver from
European investors, in contrast to their peers across
the Atlantic.
Nevertheless, there remains a minority of investors
that do opt to buy silver in physical form, despite
its inherent drawbacks. These players are generally
small to medium sized investors (who therefore have
27Independent - Informed - International
The Silver Investment Market
limited access to loco-London, VAT free, allocated metal
accounts), concerned with counterparty risk, who often
expect silver will appreciate by far more than the VAT
rate. (The highest rates in Europe reach 25%, while
the majority of countries’ VAT ranges from 16% to
22%, although in some cases VAT rates on coins can
drop to as ‘low’ as 7%.) Investors discussed in the
third chapter of this report, who expect a rally to the
historical all-time highs certainly comprise part of this
market, as they often overlap with the risk-conscious
group.
Moving to the form preferred by investors purchasing
physical metal, VAT considerations remain of the
essence. Specifically, in the majority of European
markets, purchasing silver in bar form bears a
significantly higher VAT charge than buying silver
bullion coins issued by state mints.
Markups on silver coins, which are generally limited
to a maximum of one ounce sizes, on the other hand
are normally higher than those on, say, kilobars.
Nevertheless, the aforementioned difference between
the VAT rates applicable to the two forms of silver
would normally exceed any differences in markups,
making the expected returns on silver coin purchases
higher than those for silver bars. It is therefore not
surprising that coins are the generally preferred form of
physical silver investment in Europe, although in 2008
there was also a notable surge in demand for silver
kilobars, especially in Germany.
iii. India In an important change in trend in recent years, Indian
physical investment has shifted away from jewelry and
silverware to bars and coins. Even though the former
categories of demand have traditionally been the main
vehicle for silver investment in India, demand for them
has generally been on a downward spiral. Taking
both jewelry and silverware and bullion demand into
account, during the current decade overall investment
in silver has tended to fall rather heavily until, as
outlined below, the tremendous surge in buying that
took place last year.
Although demand for jewelry and silverware appears to
have stabilized and possibly even rebounded somewhat
in 2008, this form of ‘investment’ has over recent years
been undermined by the dual issues of poor quality
(above-all, underkarating) and ever higher local prices.
This is well illustrated by GFMS’ Indian statistics, which
show that by 2007 combined jewelry and silverware
consumption had fallen by over 70% from its 2001
peak. The migration over this period of demand to
‘purer’ forms of investment can be illustrated by the
fact that from its peak, combined offtake of bars and
coins “only” fell by 34% through to 2007. Demand
for bars and coins has been supported by this form
of silver being far less prone to underkarating. In
addition, coin sales have also been maintained by non-
investment related demand in the form of gifting, both
by individuals as well as by corporations.
As indicated above, in 2008 the Indian market
experienced a major reversal in trend, with
unprecedented local demand emerging for silver bars
and coins. The explosion of investor interest in silver
bullion, that mostly occurred during the latter part of
the year, saw this category of demand comfortably
exceed the quantity of silver purchased in the form of
jewelry and silverware. Indeed, investment demand
was so strong that total supply of silver to the Indian
market in 2008 jumped to over 6,000 tonnes or 190
Moz of which more than 5,000 tonnes or 160 Moz was
imported. There is no doubt that the largest share
of this metal was destined for bullion investors. Last
year’s dramatic change in direction and the associated
surge in local purchases of silver bullion has two
main explanations. First, a good part of the growth
in demand stemmed from investors placing a much
greater emphasis on ‘wealth preservation’, especially
in the absence of other promising, safe investment
avenues. Secondly, the explosion in investor interest
in silver bullion was stimulated by the opportunity to
purchase at very low local prices, even below Rupees
17,000/kg, this coming after a period earlier in 2008
when the rupee price had exceeded 26,000/kg.
Much of this buying was also speculative in nature,
on expectations of future price gains, hence locals’
willingness to pay high premia on silver bullion, these
hitting 50 cents per ounce at one stage.
28 Independent - Informed - International
The Silver Investment Market
Silver CoinsA cursory glance at the global totals might suggest
little change in world coin fabrication over the majority
of the past two decades, save for 2008. In 1990, total
coin output stood at 34.0 Moz (1,058 t) and world
minting staged a near uninterrupted period of growth
through to 2004, drifting lower over the following
three years before sharply recovering in 2008. From
a world production level of just 37.8 Moz (1,176 t)
in 2007, initial estimates for 2008 show the global
figure gaining by over 25 Moz to 63.0 Moz (1,959 t),
predominately due to strains in the global financial
system sparking a tremendous wave of investment.
One point worth making, is namely the division
between bullion and commemorative silver products.
Although a little under half of the global total
is accounted for by bullion products it would be
misleading to only focus on this segment as many so-
called special issues, which might be labelled collector
pieces are in fact purchased by investors. And, given
that this study is concerned with global investment
the following discussion looks at certain key coin
products, some of which are not defined as bullion
coins, but which nevertheless would be the focus of
the investor community.
In Europe, the coin market has been dominated by
the production of commemorative and collector coins,
of which the largest producer has been Germany.
Originally designated in 1987 as circulating or legal
tender pieces, the coins were minted in silver with a
purity of 625/1000. In spite of being circulating coins,
each year the entire production consisted of limited
issues to mark a given event, and so the number of
pieces struck in any twelve month period could vary
considerably. This characteristic meant that collectors,
rather than investors, proved to be the main target
market and so in 1998 the coins’ purity was raised to
925/1000, although investors have also participated in
this market. In addition, there has been a broad trend
over the past two decades towards raising the number
of issues, which, by definition, has lifted Germany’s
consumption of silver. For example, during the 1990s,
the country’s outturn of coins averaged 4.7 Moz (146
t), compared with 8.2 Moz (254 t) per annum for the
current decade to-date (2000-08).
Elsewhere in Europe, there has been a general drift
towards lower coin production, Spain being the
most notable example. Although the country leapt
to prominence in 1994, when the 2,000 peseta legal
tender sterling silver coin was launched (4.7 Moz, 146
t, were minted that year), it subsequently faded and
in 2008, just 0.9 Moz (28 t) of silver was consumed.
The notable exception has been Austria, which saw
unprecedented demand in 2008, as fabrication of coins
skyrocketed from a 2007 figure of 0.5 Moz (16.5 t) to
7.8 Moz (242 t) in 2008, in line with the overall rise
in physical investment demand in Europe last year (a
trend which particularly benefited the newly launched
Austrian Philharmonic one ounce bullion coin).
In North America, the United States has enjoyed a
pre-eminent role as the largest global coin fabricator.
Stripping out commemorative, and other related pieces,
the country would still retain its foremost position. For
example, in 2008, output of one ounce Eagle bullion
coins totaled 19.6 Moz (609 t), an all time high. Since
its introduction in 1986, the US Mint has in total minted
178 Moz (5,526 t) of the Silver Eagle coins.
Turning to Canada, minting of the one ounce Maple
Leaf bullion coin from 1988-2008 used around an
estimated 31 Moz (964 t) of silver. Historically, the bulk
of production has been exported to the United States
and Europe (especially Germany). Demand for this
one ounce coin has grown in recent years as investors
have dramatically returned to the silver market. For
instance, in 2007 some 3.8 Moz (over 118 t) of Maple
Leaf coins were sold by the Royal Canadian Mint, while
2008 saw this figure more than double to an estimated
9.7 Moz (over 300 t).
Finally, turning to Mexico, as noted earlier, the
country’s coin production is principally accounted for by
circulating coins. Specifically, from 1992-94 Mexico’s
Casa de Moneda produced around 39 Moz (1,206 t) of
10, 20 and 50 peso coins that were mainly hoarded
by the local population. The peak year of output,
1993, saw minting of such coins reach 17.1 Moz (532
t). After a hiatus, a new series of circulating coins
was produced from 2004 to 2006, although minting
was on a smaller scale. These coins have also tended
to be hoarded by the general public rather than used
in everyday commerce. Finally, it is worth noting
that not only does Mexico have an active ongoing
commemorative coin program but also since 1949 has
produced a bullion coin, the Libertad, which is mainly
sold to local investors. At its height in the 1980s and
early 1990s minting of this coin absorbed between 0.5
to 2.5 million ounces per annum. It is significant that
demand in 2008 jumped back to above the 1.4 Moz
(43.5 t) level on the back of a surge in investment.
29Independent - Informed - International
The Silver Investment Market
6. Silver Mining Stocks
Investing in silver mining equities is another way in
which to gain exposure to the silver market. Silver
stocks, which are a return on value (as the investor
gains from growth and dividend payments) can, at
times, yield returns that act as a form of leverage
upon the metal’s spot price. These securities have
been widely utilized by institutional investors that
are ordinarily precluded from purchasing the physical
metal or buying derivatives based on silver. Investors
in stocks also benefit from the absence of storage
costs that are associated with holding physical bullion.
Furthermore, like the underlying commodity, some of
these securities can be low to negatively correlated
with other broad-based equities and can be an effective
tool for portfolio diversification and hedging against
inflation and US dollar depreciation. On the other hand,
as explained below, holders of stocks are exposed
to company and management risks that are largely
avoided by making investments directly in the metal.
It should also be pointed out that in many cases silver
stock shareholders have a far from direct exposure to
silver, as many ‘silver mining companies’ also produce
significant amounts of gold and other metals.
It is worth stressing that mining equities have an
altogether different risk-reward profile when compared
to investing in the metal, and typically display an even
greater level of volatility. To list the set of higher risks
and potential disadvantages faced by shareholders,
there are those pertaining to: management of the firm,
the overall stock market, foreign exchange, political and
environmental to name a few. Furthermore, investors
will need to be aware of a company’s individual risk
management strategies, as well as the degree to which
the underlying price risks faced by the firm have been
hedged, if at all. Another element that has become an
increasingly important consideration in the last year has
been companies’ credit risk and their ability to continue
to raise finance and service existing debts.
There exists a broad suite of mining companies that
investors can choose from, ranging from the more
established, major producers, to the higher risk
development companies. Typically it will be, in part,
the investor’s individual risk appetite that governs the
investment decision, with the juniors (which usually
display a much higher volatility in their share price
movements) representing the more speculative plays in
the sector.
In looking at silver production, it is perhaps slightly
counter intuitive that many of the leading miners of the
metal are not the primary producers (whose income
is primarily derived from silver) but rather the large,
diversified resource companies (such as BHP Billiton)
that are involved in the extraction of a range of varying
key commodities, such as coal, petroleum, iron ore and
base metals. In many of these instances substantial
quantities of silver may be yielded as a relatively
incidental by-product of gold or base metal production
that in some cases is not even a reported component of
their sales revenue. In 2007, 71% of silver mined on
Silver Output by Source Metal
(million ounces)
2006 % of 2007 % of Change Output Total Output Total y-o-y
Primary 177.9 28% 192.3 29% 8%
Gold 62.3 10% 60.5 9% -3%
Lead/Zinc 217.2 34% 226.3 34% 4%
Copper 174.9 27% 174.9 26% 0%
Other 14.1 2% 13.5 2% -4%
Source: GFMS
Market Cap and Volumes: Silver Mining Equities
Market Cap Avg volume* (end-2008) (US$ bn) (shares)
Cia. Minas Buenaventura 5.4 1,510,199
Industrias Peñoles* 3.7 1,405,311
Silver Wheaton Corp. 1.9 4,833,842
Pan American Silver 1.3 1,466,389
Silver Standard Resources 1.0 951,806
Coeur d’Alene Mines Corp. 0.4 11,656,123
Hecla Mining Co. 0.3 3,955,759
Silverstone Resources 0.1 299,306
First Majestic 0.1 221,798
Source: Reuters
*Average daily volume in 2008
(%) 2006 2007 2008
Silver 44.7 26.2 52.6
Industrias Peñoles* 53.0 54.5 94.9
Cia. Minas Buenaventura 44.4 42.6 114.3
Silver Wheaton Corp. 60.6 50.2 52.6
Source: EcoWin, Commodity Systems, Inc. (CSI)
Volatilities: Silver vs Equities
*The majority of silver projects previously operated by Industrias Peñoles are now owned by its Fresnillo subsidiary, the majority shareholder of which remains Industrias Peñoles.

30 Independent - Informed - International
The Silver Investment Market
Silver Cash Costs Gold World Cash and Total Costs
a global scale was a by-product of other metals mining
and it is estimated that this fi gure increased to around
73% in 2008. Since the diversifi ed mining stocks
provide exposure to various elements of the wider
commodities sector, they would be less appropriate
investment vehicles as a play specifi cally on movements
in the silver price.
Even primary producers are invariably involved in
the production of a number of metals, mining so-
called polymetallic deposits. As such, their revenues
may have signifi cant exposure to gold and/or base
metal prices, which may provide another element of
background ‘noise’ to an equity’s price performance.
This presented advantages for shareholders up to last
year as the advances in base metals prices (largely
fueled by growth in the BRICs and other emerging
markets) led to signifi cant increases in by-product
credits where applicable. These had a strongly positive
benefi t on earnings over the 2001-2007 period and,
consequently, greater share price appreciation versus
silver spot prices was the result for many silver mining
stocks.
Some silver equities, due to their partially diversifi ed
exposures, have also seen a notable outperformance
relative to gold equities, which have been pressured by
marked cost infl ation. Due to their concentration in one
metal, gold companies generally receive low or no by-
product credits. The above charts are illustrative of the
notable difference in the cash cost structure between
gold and silver producers.
In 2007, annual average total cash costs of gold
producers rose $78/oz, or 25%, to $395/oz,
representing well over half the price of gold’s annual
average. In stark contrast, respective cash costs for
silver producers, although they expanded by $0.46/oz,
or 43% during the same period, represented a level of
about one-tenth of the 2007 annual average spot price
of silver, at a weighted average of $1.52/oz.
Annual data is not yet fi nalised for 2008, but trends
are nevertheless evident and indicate marked changes:
gold miners’ average costs, using conventional by-
product accounting methods, continued to increase at a
consistent rate of around 20% last year. On the same
basis provisional information for silver miners’ costs
points to dramatically greater cost infl ation, where
examples of costs having doubled are by no means
exceptional. A major factor in these calculations has,
once again, been base metal prices which, following
a severe decline, have provided less substantial by-
product credits.
What proved attractive side-features for silver
producers’ valuations until last year, specifi cally
this exposure to the buoyant base metals space,
quickly evolved into a detracting feature for some
companies as the prices of industrial commodities (and
therefore earnings forecasts) collapsed. Nevertheless,
comparing the performance of silver stocks with many
undiversifi ed base metals companies shows that the
loss of value by many silver mining companies has
been modest in relative terms, as evidenced in the
chart on the next page. These trends effectively
illustrate the leveraged nature of silver stocks, which
clearly outperformed silver, gold and, for that matter,
gold equities in the 2001 to 2007 period. Silver
stocks have, however, subsequently unwound much
more aggressively than these other precious metals
investment vehicles in recent months.
22
44
d %
2007 Cash Costs
0 20 40 60 80 100
-200
0
400
1000
Gol
2007 Gold Cash Costs
Cum l ti d ti (%)
2006 Cash Costs
Source: GFMSCCCCCCCCCCCCCCCuuuuummmm
00000000000 20 40 60 80 100
-2222222222020020000000000000000000000
4444444444444040000000000000000000000000
11111110100000000000000000000000000000000000000
2007 Average Price($695.39/oz)
SSSSSSSooooooouuuuuuurrrrrrrccccccceeeeeee::::::: GGGGGGGFFFFFFFMMMMMMMSSSSSSS
0 20 40 60 80 100
-10
-5
0
5
10
15
Cumulative production (%)
2007 Cash Costs
0 20 40 60 80 100
-10
-5
0
5
10
15
Silvercashcosts(US$/oz)
2007 Silver Cash Costs
Cumulative production (%)
2006 Cash Costs
Source: GFMS
SSSSSSSiiiiiiilllllllvvvvvvveeeeeeerrrrrrrcccccccaaaaaaassssssshhhhhhhcccccccooooooossssssstttttttsssssss(((((((UUUUUUUSSSSSSS$$$$$$$///////ooooooozzzzzzz)))))))
2007 Silver Cash Costs
CCCCCCCCuuuuuuuummmmmmmmuuuuuuuullllllllaaaaaaaattttttttiiiiiiiivvvvvvvveeeeeeee pppppppprrrrrrrroooooooodddddddduuuuuuuuccccccccttttttttiiiiiiiioooooooonnnnnnnn ((((((((%%%%%%%%))))))))
-1015
2007 Average Price($13.38/oz)
SSSSSSSooooooouuuuuuurrrrrrrccccccceeeeeee::::::: GGGGGGGFFFFFFFMMMMMMMSSSSSSS

31Independent - Informed - International
The Silver Investment Market
2005 2006 2007
Cash costs $2.13 $1.06 $1.52
Average spot price $7.31 $11.55 $13.38
% sample with costs > spot price 2% 0% 0%
Sample size (million ounces) 86.6 87.4 104.7
Source: GFMS
Silver vs HUI
0
400
800
1200
1600
2009
2008
2007
2006
2005
2004
2003
2002
2001
Index(January2001=100)
Source: Reuters EcoWin
PanAmerican
HUI
silver versus HUI and stocks
Silver
Coeur
Gold
Aside from conventional mining stocks, for those
investors still seeking a purer play upon silver, there
are what are referred to as royalty companies, such as
Silver Wheaton Corporation and Silverstone Resources.
These fi rms derive 100% of their income from silver,
yet have no physical mining presence, and act rather as
fi nanciers for mining companies. Income is generated
through the purchase of silver at a low fi xed price via
long term contracts, which is agreed along with an
upfront cash payment. Shareholders then are able
to benefi t from exposure to upside risks in silver, yet
remain shielded from any mining cost pressures as
these royalty companies carry zero exposure to cost
infl ation within the mining industry.
Finally, it is worth noting the performance of silver
mining equities in relation to the launch of the fi rst
silver ETF on April 28th, 2006. As the silver ETF
provided investors with a more direct exposure to the
metal, a slight diversion effect (which was the case in
gold mining stocks) could explain why in the fi rst few
months after the iShares launch some of the major
silver mining stocks underperformed silver. However,
when looking at historical data, the impact appears to
have been marginal overall.
Silver Mine Production Costs

32 Independent - Informed - International
The Silver Investment Market
7. Analysis of Privately Held Silver Bullion Stocks
In contrast to the gold market, where the above-ground
stock of metal, that can be efficiently mobilized, could
satisfy a good few decades of annual demand, liquidity
for silver is in principle far tighter. In large measure
this is due to the bulk of fabricated products’ silver
content accounting for a much smaller portion of the
final product’s cost than is typically the case for gold,
the latter being dominated by jewelry. In contrast, the
largest share of silver fabrication these days (over half
the annual total) is accounted for by industrial uses,
where the value of the silver contained in most final
products is tiny relative to their price. Much of the
silver used in industrial products is also very difficult
and costly to recover and this has resulted in a good
deal of the silver contained ending up in landfill once
these products reach the end of their lives. (More
recently tighter environmental legislation is starting
to change this somewhat, although the increase in
recovery to-date remains modest.) Even considering
higher silver-content products such as jewelry and
silverware, the propensity for these to be recycled is
generally lower than gold jewelry, due to the much
higher markups over metal content on the former than
on the latter. Indeed, the only area of silver fabrication
demand where historically recovery rates have been
high is photography. Yet even here, actual recycling
levels have always been far lower than the theoretical
ones, in large measure due to insufficiently high silver
prices, inadequate recycling infrastructure and, in
many countries, a less than rigorous application of
environmental standards.
For all the above-discussed reasons, a far higher
percentage of historical silver mine production has
effectively been “lost” than is the case for gold. The
Identifiable Bullion Stocks
corollary of this is that above-ground stocks of silver,
particularly in the form of fabricated products, are far
less abundant than those for the yellow metal.
The bullion component of above-ground silver stocks
is by definition ‘nearer market’ than that of fabricated
products. Bullion stocks can be sub-divided into two
components: private and government. Only the first of
these is of particular relevance to this Report, although
it should be pointed out in passing that net sales out of
government stocks have been of some significance to
silver supply over the past decade.
The rise and fall, and more recently, rise again, in
private sector bullion stocks has been of paramount
importance to the market over the past 30 years.
Indeed, were it not for the supply from such stocks
to cover the fundamental deficit that existed in the
market throughout the 1990s (defined as the difference
between supply from mine production and scrap and
demand from fabrication), it is hard to picture where
the metal would have been sourced from, suggesting
a major rebalancing would have taken place (fueled,
perhaps, by rising prices resulting in a fall in demand).
The graph below features a historical overview
of identifiable bullion stocks of silver (including
government holdings). It is important to note that in
addition to the stocks captured by the data featured
in this graph, there exist notable additional hoards
of metal around the world (that cannot be accurately
quantified). By implication, therefore, changes in the
identifiable stocks of silver could be determined by both
‘real’ changes to global bullion stocks, or shifts between
identifiable and unidentifiable ones.
As one can see in the aforementioned graph, the
majority of the above-ground stock of silver bullion
Changes in Silver Stocks since 1990
-1
1
3
5
7
9
11
13
15
Fabricated ProductsGovernmentPrivate Sector
Billionounces
Changes in Above Ground Stocks 1990-2007
Source: GFMS
00
300
600
900
1200
1500
1800
20062002199819941990
Millionounces
Identifiable Bullion Stocks
Government
European Dealers
% heldprivatelyComex
Others
Source: GFMS
20
40
60
80
100
%oftotal
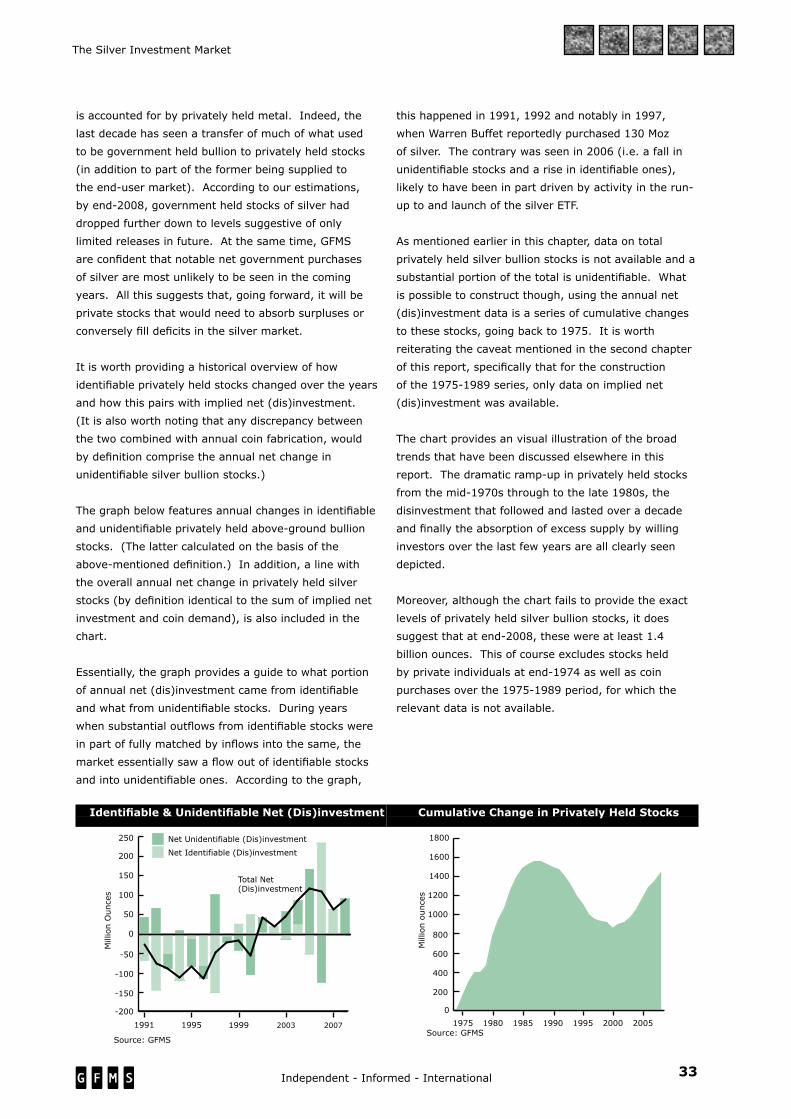
33Independent - Informed - International
The Silver Investment Market
Identifiable & Unidentifiable Net (Dis)investment
is accounted for by privately held metal. Indeed, the
last decade has seen a transfer of much of what used
to be government held bullion to privately held stocks
(in addition to part of the former being supplied to
the end-user market). According to our estimations,
by end-2008, government held stocks of silver had
dropped further down to levels suggestive of only
limited releases in future. At the same time, GFMS
are confident that notable net government purchases
of silver are most unlikely to be seen in the coming
years. All this suggests that, going forward, it will be
private stocks that would need to absorb surpluses or
conversely fill deficits in the silver market.
It is worth providing a historical overview of how
identifiable privately held stocks changed over the years
and how this pairs with implied net (dis)investment.
(It is also worth noting that any discrepancy between
the two combined with annual coin fabrication, would
by definition comprise the annual net change in
unidentifiable silver bullion stocks.)
The graph below features annual changes in identifiable
and unidentifiable privately held above-ground bullion
stocks. (The latter calculated on the basis of the
above-mentioned definition.) In addition, a line with
the overall annual net change in privately held silver
stocks (by definition identical to the sum of implied net
investment and coin demand), is also included in the
chart.
Essentially, the graph provides a guide to what portion
of annual net (dis)investment came from identifiable
and what from unidentifiable stocks. During years
when substantial outflows from identifiable stocks were
in part of fully matched by inflows into the same, the
market essentially saw a flow out of identifiable stocks
and into unidentifiable ones. According to the graph,
this happened in 1991, 1992 and notably in 1997,
when Warren Buffet reportedly purchased 130 Moz
of silver. The contrary was seen in 2006 (i.e. a fall in
unidentifiable stocks and a rise in identifiable ones),
likely to have been in part driven by activity in the run-
up to and launch of the silver ETF.
As mentioned earlier in this chapter, data on total
privately held silver bullion stocks is not available and a
substantial portion of the total is unidentifiable. What
is possible to construct though, using the annual net
(dis)investment data is a series of cumulative changes
to these stocks, going back to 1975. It is worth
reiterating the caveat mentioned in the second chapter
of this report, specifically that for the construction
of the 1975-1989 series, only data on implied net
(dis)investment was available.
The chart provides an visual illustration of the broad
trends that have been discussed elsewhere in this
report. The dramatic ramp-up in privately held stocks
from the mid-1970s through to the late 1980s, the
disinvestment that followed and lasted over a decade
and finally the absorption of excess supply by willing
investors over the last few years are all clearly seen
depicted.
Moreover, although the chart fails to provide the exact
levels of privately held silver bullion stocks, it does
suggest that at end-2008, these were at least 1.4
billion ounces. This of course excludes stocks held
by private individuals at end-1974 as well as coin
purchases over the 1975-1989 period, for which the
relevant data is not available.
Cumulative Change in Privately Held Stocks
0
200
400
600
800
1000
1200
1400
1600
1800
2005200019951990198519801975
Millionounces
Implied Net Investment
0
5
10
15
20
25
Cummulative change in privately held stocks
Silver Price
Source: GFMS
Net Investment
-600
-400
-200
0
200
400
600
800
1000
Tonnes
Net Identifiable (Dis)investment
Net Unidentifiable (Dis)investment
200
300
400
500
RealGold Price
Constan
t2003US$/oz
World Investment
-200
-150
-100
-50
0
50
100
150
200
250
20072003199919951991
MillionOunces
Constan
t2007US$/oz
Total Net(Dis)investment
Source: GFMS
-200
-150
-100
-50
0
50
100
150
200
250
-2
-1
-1
-5
0
5
10
1
20
2
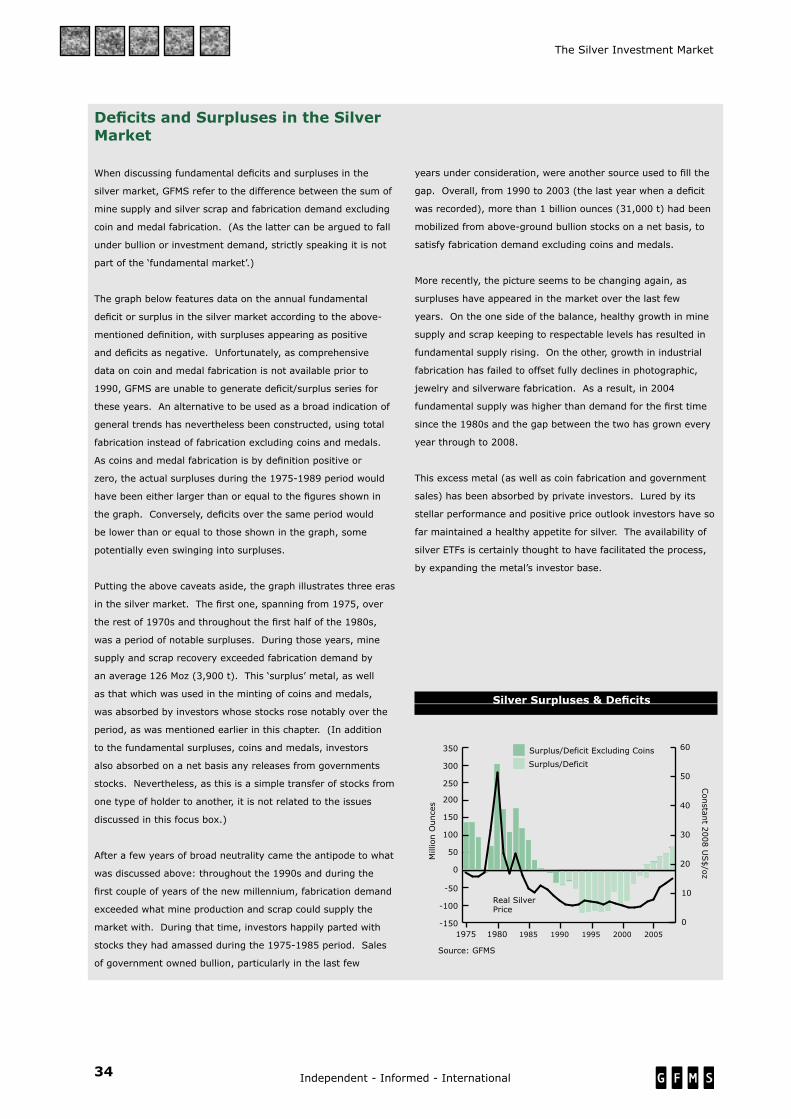
34 Independent - Informed - International
The Silver Investment Market
Silver Surpluses & Deficits
Deficits and Surpluses in the Silver Market
When discussing fundamental deficits and surpluses in the
silver market, GFMS refer to the difference between the sum of
mine supply and silver scrap and fabrication demand excluding
coin and medal fabrication. (As the latter can be argued to fall
under bullion or investment demand, strictly speaking it is not
part of the ‘fundamental market’.)
The graph below features data on the annual fundamental
deficit or surplus in the silver market according to the above-
mentioned definition, with surpluses appearing as positive
and deficits as negative. Unfortunately, as comprehensive
data on coin and medal fabrication is not available prior to
1990, GFMS are unable to generate deficit/surplus series for
these years. An alternative to be used as a broad indication of
general trends has nevertheless been constructed, using total
fabrication instead of fabrication excluding coins and medals.
As coins and medal fabrication is by definition positive or
zero, the actual surpluses during the 1975-1989 period would
have been either larger than or equal to the figures shown in
the graph. Conversely, deficits over the same period would
be lower than or equal to those shown in the graph, some
potentially even swinging into surpluses.
Putting the above caveats aside, the graph illustrates three eras
in the silver market. The first one, spanning from 1975, over
the rest of 1970s and throughout the first half of the 1980s,
was a period of notable surpluses. During those years, mine
supply and scrap recovery exceeded fabrication demand by
an average 126 Moz (3,900 t). This ‘surplus’ metal, as well
as that which was used in the minting of coins and medals,
was absorbed by investors whose stocks rose notably over the
period, as was mentioned earlier in this chapter. (In addition
to the fundamental surpluses, coins and medals, investors
also absorbed on a net basis any releases from governments
stocks. Nevertheless, as this is a simple transfer of stocks from
one type of holder to another, it is not related to the issues
discussed in this focus box.)
After a few years of broad neutrality came the antipode to what
was discussed above: throughout the 1990s and during the
first couple of years of the new millennium, fabrication demand
exceeded what mine production and scrap could supply the
market with. During that time, investors happily parted with
stocks they had amassed during the 1975-1985 period. Sales
of government owned bullion, particularly in the last few
years under consideration, were another source used to fill the
gap. Overall, from 1990 to 2003 (the last year when a deficit
was recorded), more than 1 billion ounces (31,000 t) had been
mobilized from above-ground bullion stocks on a net basis, to
satisfy fabrication demand excluding coins and medals.
More recently, the picture seems to be changing again, as
surpluses have appeared in the market over the last few
years. On the one side of the balance, healthy growth in mine
supply and scrap keeping to respectable levels has resulted in
fundamental supply rising. On the other, growth in industrial
fabrication has failed to offset fully declines in photographic,
jewelry and silverware fabrication. As a result, in 2004
fundamental supply was higher than demand for the first time
since the 1980s and the gap between the two has grown every
year through to 2008.
This excess metal (as well as coin fabrication and government
sales) has been absorbed by private investors. Lured by its
stellar performance and positive price outlook investors have so
far maintained a healthy appetite for silver. The availability of
silver ETFs is certainly thought to have facilitated the process,
by expanding the metal’s investor base.
-600
-400
-200
0
200
400
600
800
1000
Tonnes
Surplus/Deficit
Surplus/Deficit Excluding Coins
200
300
400
500
RealGold Price
Constan
t2003US$/oz
World Investment
-150
-100
-50
0
50
100
150
200
250
300
350
2005200019951990198519801975
MillionOunces
Constan
t2008US$/oz
Real SilverPrice
Source: GFMS
-150
-100
-50
0
50
100
150
200
250
300
350
0
10
20
30
40
50
60
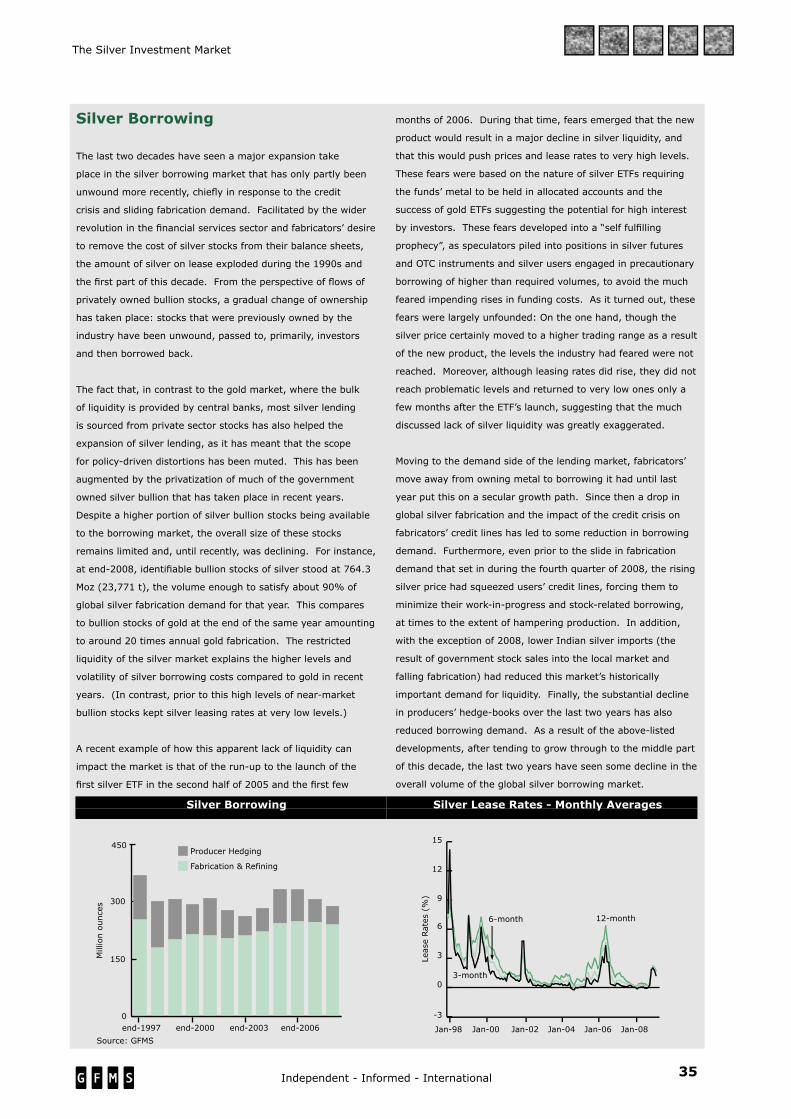
35Independent - Informed - International
The Silver Investment Market
Silver Borrowing
The last two decades have seen a major expansion take
place in the silver borrowing market that has only partly been
unwound more recently, chiefl y in response to the credit
crisis and sliding fabrication demand. Facilitated by the wider
revolution in the fi nancial services sector and fabricators’ desire
to remove the cost of silver stocks from their balance sheets,
the amount of silver on lease exploded during the 1990s and
the fi rst part of this decade. From the perspective of fl ows of
privately owned bullion stocks, a gradual change of ownership
has taken place: stocks that were previously owned by the
industry have been unwound, passed to, primarily, investors
and then borrowed back.
The fact that, in contrast to the gold market, where the bulk
of liquidity is provided by central banks, most silver lending
is sourced from private sector stocks has also helped the
expansion of silver lending, as it has meant that the scope
for policy-driven distortions has been muted. This has been
augmented by the privatization of much of the government
owned silver bullion that has taken place in recent years.
Despite a higher portion of silver bullion stocks being available
to the borrowing market, the overall size of these stocks
remains limited and, until recently, was declining. For instance,
at end-2008, identifi able bullion stocks of silver stood at 764.3
Moz (23,771 t), the volume enough to satisfy about 90% of
global silver fabrication demand for that year. This compares
to bullion stocks of gold at the end of the same year amounting
to around 20 times annual gold fabrication. The restricted
liquidity of the silver market explains the higher levels and
volatility of silver borrowing costs compared to gold in recent
years. (In contrast, prior to this high levels of near-market
bullion stocks kept silver leasing rates at very low levels.)
A recent example of how this apparent lack of liquidity can
impact the market is that of the run-up to the launch of the
fi rst silver ETF in the second half of 2005 and the fi rst few
months of 2006. During that time, fears emerged that the new
product would result in a major decline in silver liquidity, and
that this would push prices and lease rates to very high levels.
These fears were based on the nature of silver ETFs requiring
the funds’ metal to be held in allocated accounts and the
success of gold ETFs suggesting the potential for high interest
by investors. These fears developed into a “self fulfi lling
prophecy”, as speculators piled into positions in silver futures
and OTC instruments and silver users engaged in precautionary
borrowing of higher than required volumes, to avoid the much
feared impending rises in funding costs. As it turned out, these
fears were largely unfounded: On the one hand, though the
silver price certainly moved to a higher trading range as a result
of the new product, the levels the industry had feared were not
reached. Moreover, although leasing rates did rise, they did not
reach problematic levels and returned to very low ones only a
few months after the ETF’s launch, suggesting that the much
discussed lack of silver liquidity was greatly exaggerated.
Moving to the demand side of the lending market, fabricators’
move away from owning metal to borrowing it had until last
year put this on a secular growth path. Since then a drop in
global silver fabrication and the impact of the credit crisis on
fabricators’ credit lines has led to some reduction in borrowing
demand. Furthermore, even prior to the slide in fabrication
demand that set in during the fourth quarter of 2008, the rising
silver price had squeezed users’ credit lines, forcing them to
minimize their work-in-progress and stock-related borrowing,
at times to the extent of hampering production. In addition,
with the exception of 2008, lower Indian silver imports (the
result of government stock sales into the local market and
falling fabrication) had reduced this market’s historically
important demand for liquidity. Finally, the substantial decline
in producers’ hedge-books over the last two years has also
reduced borrowing demand. As a result of the above-listed
developments, after tending to grow through to the middle part
of this decade, the last two years have seen some decline in the
overall volume of the global silver borrowing market.
Silver Borrowing Silver Lease Rates - Monthly Averages
0
150
300
450
end-2006end-2003end-2000end-1997
Millionounces
Silver Borrowing
Producer Hedging
Fabrication & Refining
Source: GFMS
-3
0
3
6
9
12
15
Jan-08Jan-06Jan-04Jan-02Jan-00Jan-98
LeaseRates(%)
Silver Lease Rates
6-month
3-month
12-month
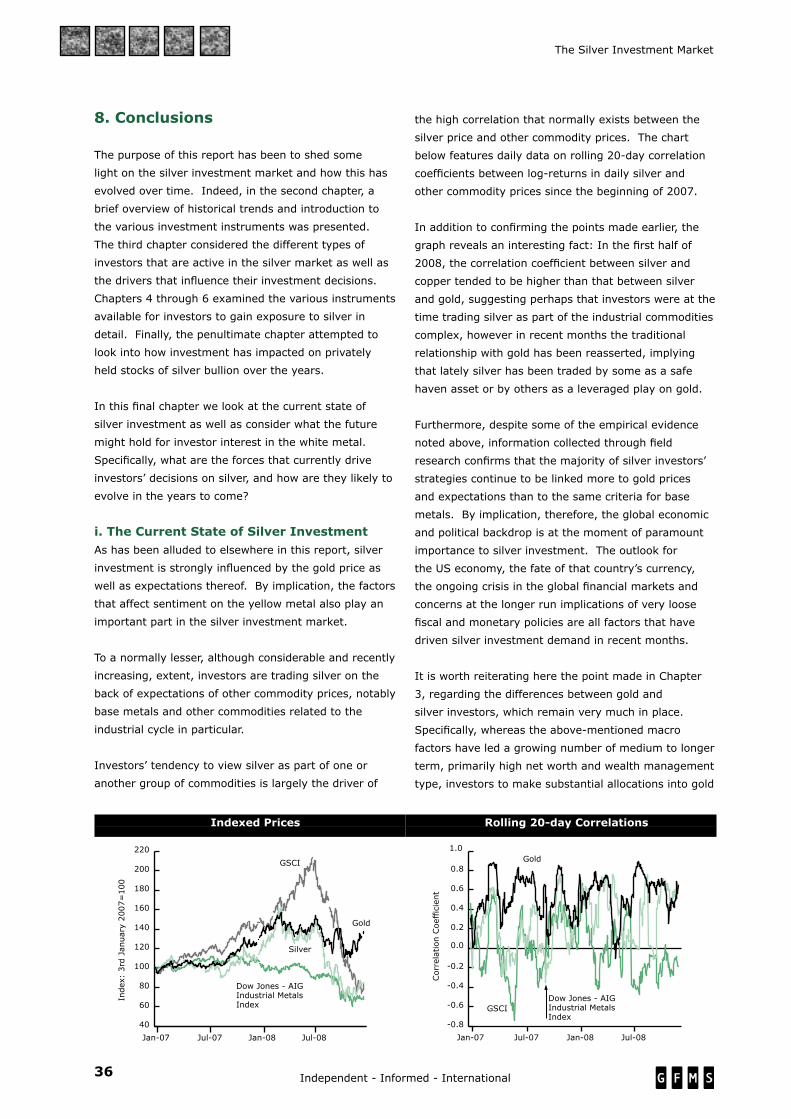
36 Independent - Informed - International
The Silver Investment Market
8. Conclusions
The purpose of this report has been to shed some
light on the silver investment market and how this has
evolved over time. Indeed, in the second chapter, a
brief overview of historical trends and introduction to
the various investment instruments was presented.
The third chapter considered the different types of
investors that are active in the silver market as well as
the drivers that influence their investment decisions.
Chapters 4 through 6 examined the various instruments
available for investors to gain exposure to silver in
detail. Finally, the penultimate chapter attempted to
look into how investment has impacted on privately
held stocks of silver bullion over the years.
In this final chapter we look at the current state of
silver investment as well as consider what the future
might hold for investor interest in the white metal.
Specifically, what are the forces that currently drive
investors’ decisions on silver, and how are they likely to
evolve in the years to come?
i. The Current State of Silver InvestmentAs has been alluded to elsewhere in this report, silver
investment is strongly influenced by the gold price as
well as expectations thereof. By implication, the factors
that affect sentiment on the yellow metal also play an
important part in the silver investment market.
To a normally lesser, although considerable and recently
increasing, extent, investors are trading silver on the
back of expectations of other commodity prices, notably
base metals and other commodities related to the
industrial cycle in particular.
Investors’ tendency to view silver as part of one or
another group of commodities is largely the driver of
the high correlation that normally exists between the
silver price and other commodity prices. The chart
below features daily data on rolling 20-day correlation
coefficients between log-returns in daily silver and
other commodity prices since the beginning of 2007.
In addition to confirming the points made earlier, the
graph reveals an interesting fact: In the first half of
2008, the correlation coefficient between silver and
copper tended to be higher than that between silver
and gold, suggesting perhaps that investors were at the
time trading silver as part of the industrial commodities
complex, however in recent months the traditional
relationship with gold has been reasserted, implying
that lately silver has been traded by some as a safe
haven asset or by others as a leveraged play on gold.
Furthermore, despite some of the empirical evidence
noted above, information collected through field
research confirms that the majority of silver investors’
strategies continue to be linked more to gold prices
and expectations than to the same criteria for base
metals. By implication, therefore, the global economic
and political backdrop is at the moment of paramount
importance to silver investment. The outlook for
the US economy, the fate of that country’s currency,
the ongoing crisis in the global financial markets and
concerns at the longer run implications of very loose
fiscal and monetary policies are all factors that have
driven silver investment demand in recent months.
It is worth reiterating here the point made in Chapter
3, regarding the differences between gold and
silver investors, which remain very much in place.
Specifically, whereas the above-mentioned macro
factors have led a growing number of medium to longer
term, primarily high net worth and wealth management
type, investors to make substantial allocations into gold
Indexed Prices Rolling 20-day Correlations
40
60
80
100
120
140
160
180
200
220
Jul-08Jan-08Jul-07Jan-07
Index:3rdJanuary2007=100
Inexed Silver & Other Commodities
Gold
Silver
GSCI
Dow Jones - AIGIndustrial MetalsIndex
-0.8
-0.6
-0.4
-0.2
0.0
0.2
0.4
0.6
0.8
1.0
Jul-08Jan-08Jul-07Jan-07
CorrelationCoefficient
Rolling 20-day correlation
Gold
GSCIDow Jones - AIGIndustrial MetalsIndex
37Independent - Informed - International
The Silver Investment Market
due to its quasi-monetary or safe haven attributes, the
same has not been noted to anything like the same
extent in the case of silver. Therefore, although the
economic and political backdrop is an important driver
for investor activity in both metals, the dynamics of this
differ notably across the two.
Moving to the impact of other commodity prices, until
well into 2008, silver had benefited handsomely from
the general boom in commodity prices and investors’
appreciation that industrial demand for the white metal
was making fresh highs. In contrast, the dramatic
global economic slow-down that became clear as the
year progressed and the associated drop, eventually,
in industrial production hammered industrial metals’
prices from the middle of last year onwards. Silver, due
to its ‘industrial exposure’ (industrial uses accounted for
over 50% of total demand in 2008) was equally hard
hit, mainly due to investors bailing out of the metal, as
our information is that industrial demand actually held
up well until the fourth quarter.
Considering the types of investors currently active in
the market, until last year institutional and, to a lesser
extent, high net worth players accounted for most
turnover. Since then there has been an important
growth in private investor participation. As such, the
dominance of futures, ETFs and OTC products in the
investment mix has been challenged by a surge in
physical bullion purchases. The growth in retail interest
is also thought to be behind a sizable share of the
increase in silver ETF holdings over the past year.
As far as the above-mentioned players’ investment
strategies and objectives are concerned, it is our
understanding that a large part of them invest in silver
with a short to medium term view, even though the
share of ‘buy and hold’ investors would lately seem to
have grown considerably. The substantial involvement
of speculators in the market is clear when looking at
non-commercial and non-reportable net positions over
the course of the first half of 2008, which in February
and July reached their highest levels since the launch of
the silver ETF (understood to have cannibalized a great
part of the less speculative non-commercial positions
previously held in futures). Since then such speculative
positions in Comex futures have suffered a sharp fall,
plummeting in mid-October to a low not seen since
April 2003. Since then they have recovered albeit to
levels considerably less than half the peaks recorded
last year. Likewise, information collected through field
research confirms that after growing during the first
half of 2008, institutional investors’ long positions in the
OTC market declined considerably during the second
half. The drop in speculative positions in futures and in
the OTC market over the last year combined with the
ongoing growth in ETF holdings and physical bullion
purchases has resulted, we believe, in some change in
the profile of silver investors. As of the first quarter
of 2009, the market appears to have shifted towards a
somewhat longer term and less institutional bias than
formerly, the role of private investors with a longer
term outlook having grown.
ii. The Future of Silver InvestmentThat the future of silver investment will to some degree
be intertwined with that for gold is almost certain. On
this assumption and on the basis of our expectation
that gold investment will continue to thrive in the
medium term, GFMS’ projections see investors remain
positive towards silver over the rest of 2009, providing
essential fuel for a continued rally in the price of the
white metal (in particular, taking as a starting point the
sub-$10 levels at which silver was trading during much
of the fourth quarter of 2008).
The basic assumption on which our expectations that
the rally in gold and silver prices will continue in the
medium term is that the turmoil in financial markets
and the global economy is far from nearing resolution.
Specifically, we expect that the global economic slow
down (recession in the case of the United States
and other advanced economies) that is currently in
place will result in fiscal and monetary policies that
should be favorable for investment in precious metals.
Government fiscal deficits are exploding and there are
doubts as to how these can possibly be funded without
recourse to the printing press, which will create the
risk of much higher inflation in future. Moreover, short
term interest rates have been reduced to extremely low
levels, such that the ‘cost of carry’ for precious metals
investments is close to zero. Given the scope for
further falls in stock prices and, at some point, a major
reversal in the government bond market, it is easy
to see how this is all adds up to a powerful cocktail
encouraging some portfolio allocations to precious
metals, including silver.
Based on the strong link between gold and silver, GFMS
are therefore confident that silver investment demand
will remain positive through most of 2009, although
there will be some swings in investors’ positions and in

38 Independent - Informed - International
The Silver Investment Market
silver prices. What might perhaps be of more interest
is how investor interest for silver might differ from that
of gold and what the drivers of any changes might be.
As was mentioned elsewhere in this report, investors
view silver as gold’s more volatile counterpart.
Inasmuch, speculators and other players that are
looking for shorter-term returns tend to prefer silver
during bull markets. At the same time, the higher
volatility of the silver price can sometimes deter more
risk averse players. These two countervailing forces
have been and will almost certainly remain instrumental
in determining how silver investor interest evolves in
comparison to gold. In addition, the performance of
the base metals and other industrial commodities sector
is another factor that we believe will continue to affect
silver investment and, by implication, also influence
how the latter fares compared to gold investment.
The current state of the world economy and financial
markets would, in theory, suggest that the case for
silver investment is weaker than for gold. One would
expect that credit market woes and their impact on
global markets would, if anything, push investors more
towards the safer haven of gold than to silver (and,
indeed, this has generally been the case). Elsewhere,
the unfavorable outlook for global economic growth
and the impact this is most likely to have on industrial
production, coupled with base metals prices at levels
still often higher than their marginal cost of production,
would likely result in a lackluster performance of the
industrial metals complex.
Nevertheless, the above-mentioned factors have
been largely in place since as early as August 2007.
Moreover, they have already at times (notably during
the liquidations of August 2008 and the period that
followed through to the time of this report’s publication)
resulted in silver investment being weaker than that
for gold. Occasionally, however, the ‘industrial burden’
on silver seems to have been largely ignored by the
investor community. This is illustrated in the two
graphs below, that feature gold and silver prices (which
can be used as a rough proxy for overall gold and silver
investment), indexed at different starting points in
time since August 2007. The graph on the left hand
side features prices indexed on August 1st 2007 and
January 2nd 2008. The one on the right hand side
features prices indexed on September 15th 2008, the
day Lehman Brothers went bankrupt.
The graphs confirm the higher vulnerability of silver to
such financial and economical shocks when compared
to gold. Straight after such an event takes place,
investors are forced to dump various assets to raise
cash to cover losses elsewhere. Due to silver lacking
gold’s safe haven appeal and its market being less
liquid, silver gives way first, with its price dropping to
much lower levels than gold in a highly volatile trading
environment. As seen in the graphs, silver behaved
in this fashion during the beginning of the sub-prime
Indexed Gold & Silver Prices Indexed Gold & Silver Prices
40
60
80
100
120
140
160
180
Aug-08Jan-08Aug-07
Index
Inexed Silver & Other Commodities
Gold
Gold
Index2: January 2nd2008 = 100
Index1: August 1st2007 = 100
Silver
Silver
Source: Reuters, EcoWin
80
90
100
110
120
130
140
FebJan-09NovSep,15
Index
Gold
Index: September 152008 = 100
Silver
Source: Reuters, EcoWin
Gold/Silver Ratio
20
40
60
80
100
20052000199519901985198019751970
Gold:Silver RatioRatio
1980 Average: $52.80
Source: GFMS
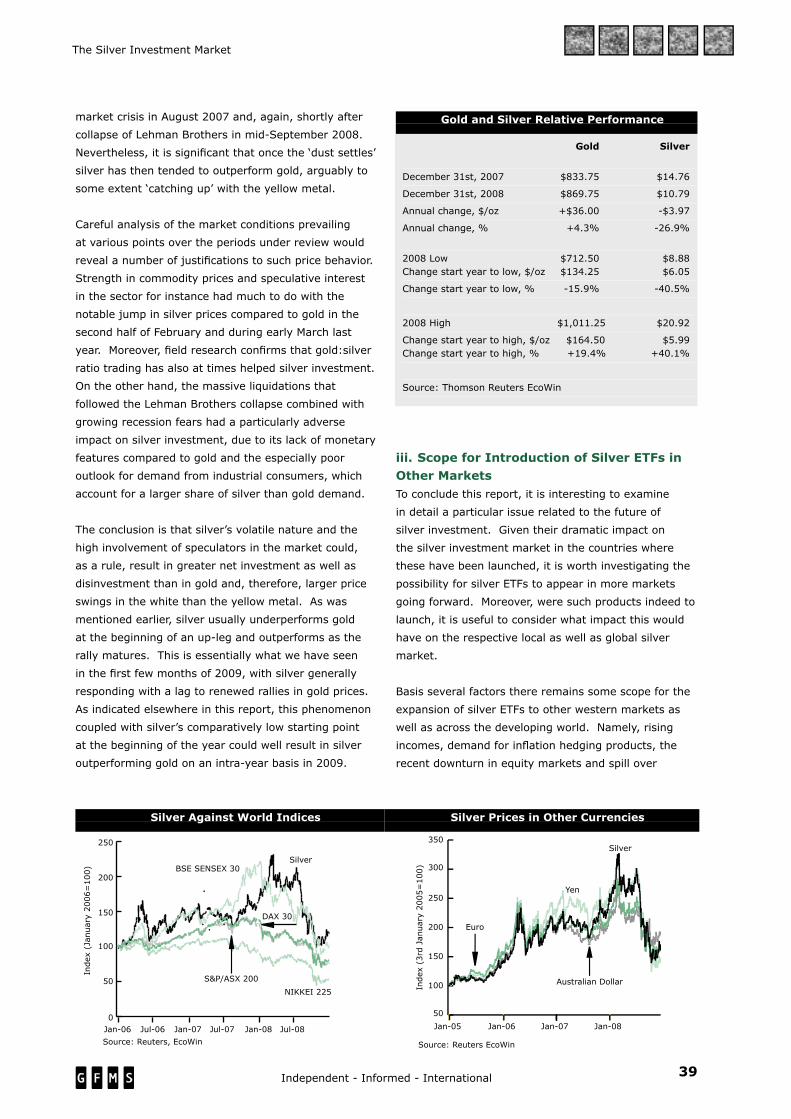
39Independent - Informed - International
The Silver Investment Market
Silver Against World Indices
0
50
100
150
200
250
Jul-08Jan-08Jul-07Jan-07Jul-06Jan-06
Index(January2006=100)
Source: Reuters, EcoWin
DAX 30
Silver
nav vs gold
NIKKEI 225
Gold
BSE SENSEX 30
BSE SENSEX 30
S&P/ASX 200
market crisis in August 2007 and, again, shortly after
collapse of Lehman Brothers in mid-September 2008.
Nevertheless, it is signifi cant that once the ‘dust settles’
silver has then tended to outperform gold, arguably to
some extent ‘catching up’ with the yellow metal.
Careful analysis of the market conditions prevailing
at various points over the periods under review would
reveal a number of justifi cations to such price behavior.
Strength in commodity prices and speculative interest
in the sector for instance had much to do with the
notable jump in silver prices compared to gold in the
second half of February and during early March last
year. Moreover, fi eld research confi rms that gold:silver
ratio trading has also at times helped silver investment.
On the other hand, the massive liquidations that
followed the Lehman Brothers collapse combined with
growing recession fears had a particularly adverse
impact on silver investment, due to its lack of monetary
features compared to gold and the especially poor
outlook for demand from industrial consumers, which
account for a larger share of silver than gold demand.
The conclusion is that silver’s volatile nature and the
high involvement of speculators in the market could,
as a rule, result in greater net investment as well as
disinvestment than in gold and, therefore, larger price
swings in the white than the yellow metal. As was
mentioned earlier, silver usually underperforms gold
at the beginning of an up-leg and outperforms as the
rally matures. This is essentially what we have seen
in the fi rst few months of 2009, with silver generally
responding with a lag to renewed rallies in gold prices.
As indicated elsewhere in this report, this phenomenon
coupled with silver’s comparatively low starting point
at the beginning of the year could well result in silver
outperforming gold on an intra-year basis in 2009.
iii. Scope for Introduction of Silver ETFs in Other MarketsTo conclude this report, it is interesting to examine
in detail a particular issue related to the future of
silver investment. Given their dramatic impact on
the silver investment market in the countries where
these have been launched, it is worth investigating the
possibility for silver ETFs to appear in more markets
going forward. Moreover, were such products indeed to
launch, it is useful to consider what impact this would
have on the respective local as well as global silver
market.
Basis several factors there remains some scope for the
expansion of silver ETFs to other western markets as
well as across the developing world. Namely, rising
incomes, demand for infl ation hedging products, the
recent downturn in equity markets and spill over
Gold Silver
December 31st, 2007 $833.75 $14.76
December 31st, 2008 $869.75 $10.79
Annual change, $/oz +$36.00 -$3.97
Annual change, % +4.3% -26.9%
2008 Low $712.50 $8.88 Change start year to low, $/oz $134.25 $6.05
Change start year to low, % -15.9% -40.5%
2008 High $1,011.25 $20.92
Change start year to high, $/oz $164.50 $5.99 Change start year to high, % +19.4% +40.1%
Source: Thomson Reuters EcoWin
Gold and Silver Relative Performance
Silver Prices in Other Currencies
50
100
150
200
250
300
350
Jan-08Jan-07Jan-06Jan-05
Index(3rdJanuary2005=100)
Silver and other Precious Metal Prices
Yen
Silver
Source: Reuters EcoWin
Euro
Australian Dollar

40 Independent - Informed - International
The Silver Investment Market
from the gold market and success of its ETF products
on global stock exchanges could make way for the
expansion of silver ETFs to other exchanges, such as,
for instance, ones based in India, where gold ETFs are
already available, or in China.
Due to the notable success of silver ETFs in the United
States, the United Kingdom and Switzerland, it is
likely that issuers will seek to expand trading of these
products to other regions. What is more, perhaps
forging the way for such silver investment vehicles,
gold ETFs have already seen such a proliferation,
and now trade in a host of countries, from the United
States, to across western Europe to South Africa and
Singapore. Last year, on June 30th, SPDR Gold Shares
also debuted a gold ETF on the Tokyo Stock Exchange,
and another on July 31st in Hong Kong. Demand for
such physically backed products in gold has driven total
holdings to rise by over 500% from the start of 2005 to
the end of 2008. If this growth represents any sort of a
gauge to go by, then the launch of silver ETFs on these
or similar exchanges would likely be marked by robust
inflows as well.
On a more cautionary note, one potentially limiting
factor, in terms of launching new silver ETFs might be
the relative lack of a local tradition in investing in silver,
compared with gold (East Asia being one example),
in some of the prospective markets that might be
considered for these products.
That said, the underperformance of traditional
investments may also fuel demand for the metal. In
looking at the left hand chart on page 39, one can
see silver’s recent relative outperformance of several
world equity benchmarks. Sustained poor returns
in equity markets often translate into an increase in
portfolio allocations into commodities, with silver and
other precious metals proving popular alternatives,
particularly in times of financial market turmoil. As
such, silver’s recent impressive track record in gains
is likely to attract rising inflows and boost demand for
silver ETFs in world markets. Further enhancing this
possibility is the fact that silver’s perfromance has
often exceeded that of gold, as is often the case during
certain phases in precious metals bull markets. Part
of the reason for this, that we have already alluded to
elsewhere in this report, is that silver’s above-ground
stocks and market liquidity are a good deal smaller
than is the case for gold. This tends to translate into
both higher price volatility (52.6% versus gold’s 31.7%
in 2008) and a wider trading range. As such, this could
lead to a growing demand for silver ETFs by those
investors seeking out potentially higher, albeit more
volatile returns.
Expansion of silver ETFs on world stock exchanges
would likely contribute to, if not fuel, price support for
the metal (at least during periods of bull markets),
with these products acting as a conduit for greater
investor inflows into silver. However, compared to the
initial launch of the first silver ETF, the broadening of
similar products on global exchanges would have a
relatively smaller impact on the price and concerns over
liquidity compared to what occurred at the time of the
iShares Silver Trust launch, when the silver market was
dealing with the introduction of a major new product in
what was and still remains the world’s most important
investment arena, namely the United States.

GFMS Limited
Hedges House
153-155 Regent Street
London
W1B 4JE
United Kingdom
Tel: +44 (0)20 7478 1777
Fax: +44 (0)20 7478 1779
E-mail: [email protected]
Web: www.gfms.co.uk
A WORLDWIDE ASSOCIATION OF SILVER
MINERS, REFINERS, FABRICATORS AND MANUFACTURERS
Suite 303, 888 16th Street, NW, Washington, DC 20006