Embed Size (px)
Citation preview

SAFEWAY INC. 2005 ANNUAL REPORT
Reinventing the Shopping Experience
Financial Highlights
52 Weeks 52 Weeks 53 Weeks(Dollars in millions, except per-share amounts) 2005 2004 2003
For the Year:
Sales and other revenue $38,416.0 $35,822.9 $35,727.2
Gross profit 11,112.9 10,595.3 10,724.2
Operating profit 1,214.7 1,172.8 573.9
Net income (loss) 561.1 560.2 (169.8)
Diluted earnings (loss) per share 1.25 1.25 (0.38)
Cash capital expenditures 1,383.5 1,212.5 935.8
At Year End:
Common shares outstanding (in millions) (Note 1) 449.4 447.7 444.2
Retail square feet (in millions) 81.0 82.1 82.6
Number of stores 1,775 1,802 1,817
Note 1: Net of 130.7 million, 130.8 million and 131.2 million shares held in treasury in 2005, 2004 and 2003, respectively.
ContentsLetter to Stockholders 2Focusing on the Consumer 5Directors and Principal Officers 16
Safeway at a Glance 18
Annual Report on Form 10-K 19
Investor Information Inside back cover
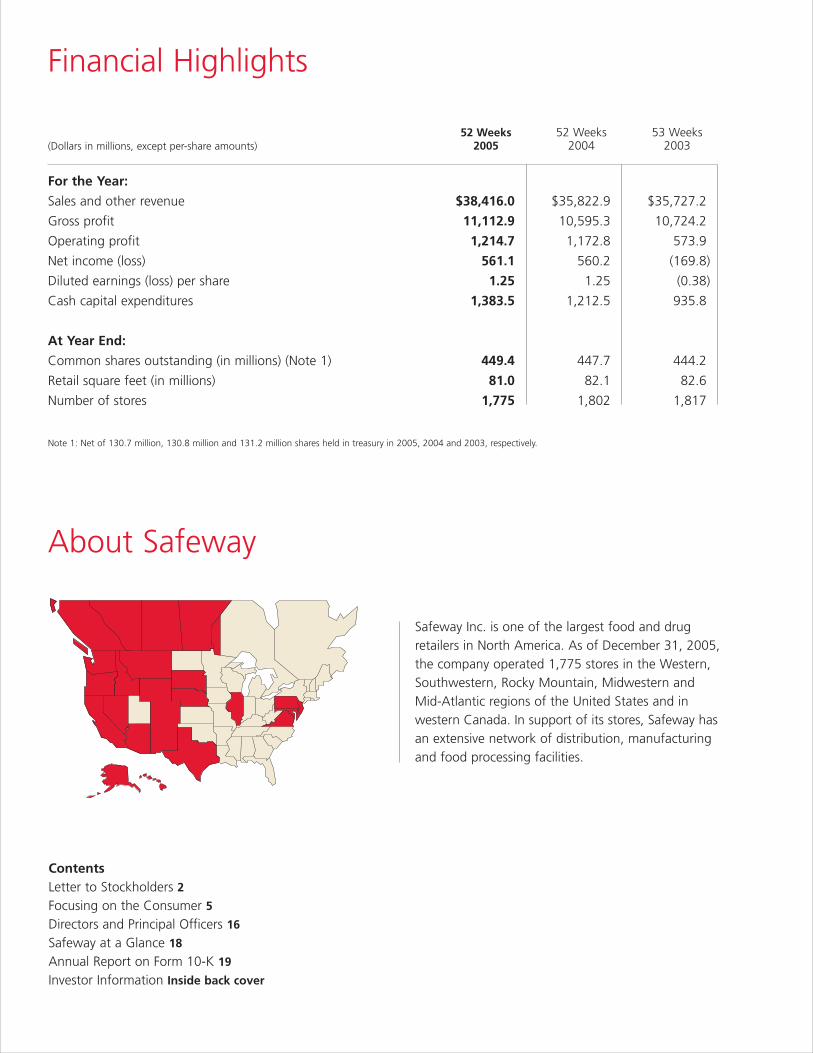
About Safeway
Safeway Inc. is one of the largest food and drugretailers in North America. As of December 31, 2005, the company operated 1,775 stores in the Western,Southwestern, Rocky Mountain, Midwestern andMid-Atlantic regions of the United States and inwestern Canada. In support of its stores, Safeway hasan extensive network of distribution, manufacturingand food processing facilities.
SAFEWAY INC. 2005 ANNUAL REPORT 1
Based on extensive consumer research, we developed a strategy
three years ago to fundamentally reinvent our business and better meet
our customers’ needs. In 2005, we began to see the fruits of our labors.
During the year we:
Generated Strong Same-Store SalesBy featuring world-class quality produce, expanding our line of
high-quality proprietary brands, revitalizing the center of the store,
developing solutions for our customers, and responding to health and
wellness concerns.
Lowered Our Cost StructureBy restructuring labor contracts, improving our marketing and supply
chain organization, and strengthening our capital structure, all of which
will allow us to compete effectively in a challenging industry.
Improved the Shopping ExperienceThrough an aggressive rollout of Lifestyle stores and continued focus
on customer service.
Communicated Our Brand Repositioning MessageThrough our Ingredients for life brand repositioning campaign, and
substantially improved the awareness of how Safeway is changing to
meet our customers’ needs.
This is an exciting time for Safeway. We believe we are on a path to
reestablish our company as the supermarket industry’s premier operator.
2 SAFEWAY INC. 2005 ANNUAL REPORT
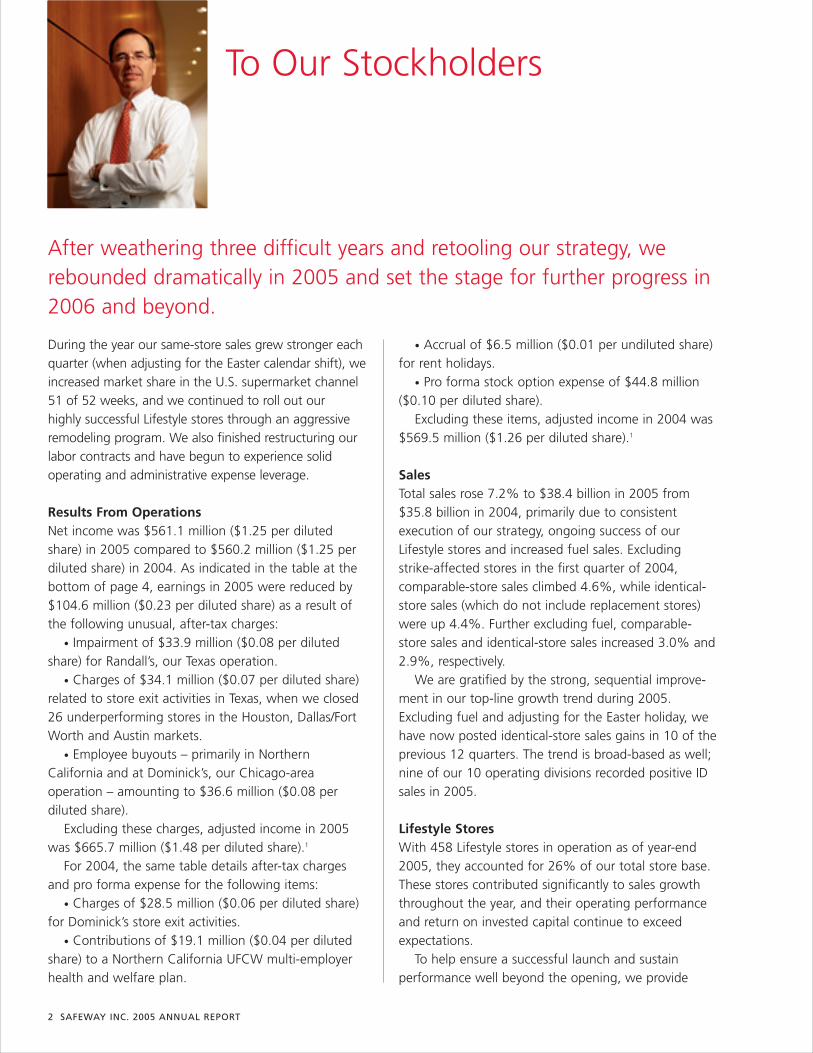
To Our Stockholders
During the year our same-store sales grew stronger eachquarter (when adjusting for the Easter calendar shift), weincreased market share in the U.S. supermarket channel51 of 52 weeks, and we continued to roll out our highly successful Lifestyle stores through an aggressiveremodeling program. We also finished restructuring ourlabor contracts and have begun to experience solidoperating and administrative expense leverage.
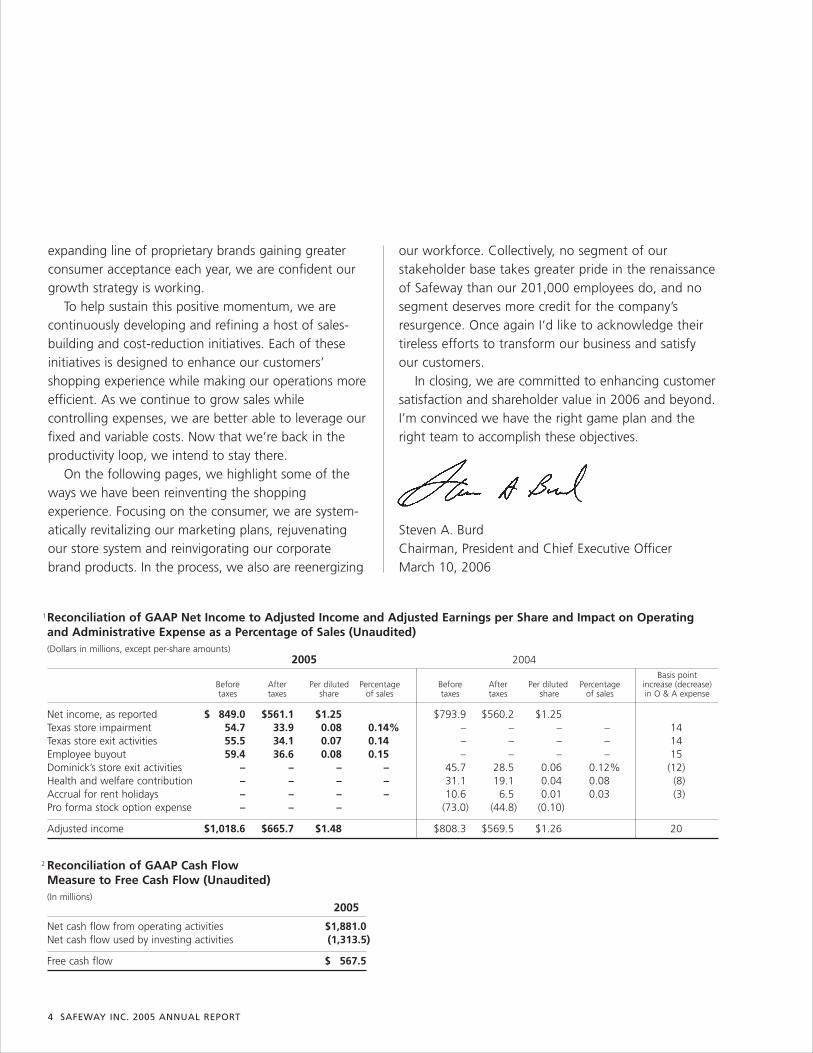
Results From OperationsNet income was $561.1 million ($1.25 per dilutedshare) in 2005 compared to $560.2 million ($1.25 perdiluted share) in 2004. As indicated in the table at thebottom of page 4, earnings in 2005 were reduced by$104.6 million ($0.23 per diluted share) as a result ofthe following unusual, after-tax charges:
• Impairment of $33.9 million ($0.08 per dilutedshare) for Randall’s, our Texas operation.
• Charges of $34.1 million ($0.07 per diluted share)related to store exit activities in Texas, when we closed26 underperforming stores in the Houston, Dallas/FortWorth and Austin markets.
• Employee buyouts – primarily in NorthernCalifornia and at Dominick’s, our Chicago-areaoperation – amounting to $36.6 million ($0.08 perdiluted share).
Excluding these charges, adjusted income in 2005was $665.7 million ($1.48 per diluted share).1
For 2004, the same table details after-tax chargesand pro forma expense for the following items:
• Charges of $28.5 million ($0.06 per diluted share)for Dominick’s store exit activities.
• Contributions of $19.1 million ($0.04 per dilutedshare) to a Northern California UFCW multi-employerhealth and welfare plan.
• Accrual of $6.5 million ($0.01 per undiluted share)for rent holidays.
• Pro forma stock option expense of $44.8 million($0.10 per diluted share).
Excluding these items, adjusted income in 2004 was$569.5 million ($1.26 per diluted share).1
Sales Total sales rose 7.2% to $38.4 billion in 2005 from$35.8 billion in 2004, primarily due to consistentexecution of our strategy, ongoing success of ourLifestyle stores and increased fuel sales. Excludingstrike-affected stores in the first quarter of 2004,comparable-store sales climbed 4.6%, while identical-store sales (which do not include replacement stores)were up 4.4%. Further excluding fuel, comparable-store sales and identical-store sales increased 3.0% and2.9%, respectively.
We are gratified by the strong, sequential improve-ment in our top-line growth trend during 2005.Excluding fuel and adjusting for the Easter holiday, wehave now posted identical-store sales gains in 10 of theprevious 12 quarters. The trend is broad-based as well;nine of our 10 operating divisions recorded positive IDsales in 2005.
Lifestyle StoresWith 458 Lifestyle stores in operation as of year-end2005, they accounted for 26% of our total store base.These stores contributed significantly to sales growththroughout the year, and their operating performanceand return on invested capital continue to exceedexpectations.
To help ensure a successful launch and sustainperformance well beyond the opening, we provide
After weathering three difficult years and retooling our strategy, werebounded dramatically in 2005 and set the stage for further progress in2006 and beyond.
each Lifestyle store with extensive promotional support. During the past year we have refined theseactivities so we can reduce the cost of promotionswithout diminishing operating results. Nevertheless, asanticipated, the cost of promoting Lifestyle openings in2005 reduced gross margin and increased operatingand administrative expense as a percentage of sales. As the Lifestyle stores opened last year mature in 2006,we expect their margins to improve and their contri-bution to operating profit to increase.
Gross ProfitGross profit in 2005 decreased 65 basis points to28.93% of sales. Higher fuel sales (which have a lowergross margin) accounted for 39 basis points of thedecline. The remaining 26 basis-point reduction wasdue to grand openings of Lifestyle stores, targetedprice investments, increased advertising expense andhigher energy costs.
Operating and Administrative ExpenseOperating and administrative expense last year decreased53 basis points to 25.77% of sales. The significant pre-taxcharges in 2005 and 2004 reflected in the table on page 4(other than pro forma stock option expense) increasedoperating and administrative expense as a percentage ofsales by a net 20 basis points. Stock option expense,labor costs associated with Lifestyle grand openings andhigher energy costs also increased our O&A expense-to-sales ratio. However, these items were more than offsetby the restructured labor agreements, increased fuelsales and reduced workers’ compensation costs.
Interest ExpenseInterest expense decreased $8.6 million to $402.6million in 2005 despite higher average interest rates,primarily because total debt declined to $6.4 billion.
Capital SpendingCash capital investments increased to $1.4 billion in 2005.
During the year we opened 21 new Lifestyle stores,completed 293 Lifestyle remodels and closed 48 older stores. In 2006 we plan to invest approxi-mately $1.6 billion in cash capital expenditures andopen 20 to 25 new Lifestyle stores while completingsome 280 Lifestyle remodels.
We also opened 20 fuel stations adjacent to ourstores. As of year-end 2005, 314 of our stores soldgasoline, boosting sales at these locations whileenhancing one-stop shopping convenience for our customers.
Cash FlowNet cash flow from operating activities was $1.9 billionin 2005, down from $2.2 billion in 2004. Workingcapital contributed to cash flow in 2005, but at a lowerlevel than in 2004. Net cash flow used by investingactivities, which consists principally of cash paid forproperty additions, increased $243 million to $1.3billion in 2005. Net cash flow used by financingactivities – mainly cash used to retire debt – was $467 million in 2005, down from $1.1 billion the prior year.
Free cash flow was $567.5 million in 2005.2 As aresult, debt declined $404.8 million, cash and cashequivalents increased $106.5 million and we paid$44.9 million in dividends to stockholders.
OutlookLooking ahead, we are encouraged by the strongrebound in our sales over the past year and by theunprecedentedsuccess of ourLifestyle stores. Withour operating resultssteadily improving,our capital invest-ments continuing toexceed targeted ratesof return, and our
NET INCOME
IN 2005:
$561 Million
4 SAFEWAY INC. 2005 ANNUAL REPORT
expanding line of proprietary brands gaining greaterconsumer acceptance each year, we are confident ourgrowth strategy is working.
To help sustain this positive momentum, we arecontinuously developing and refining a host of sales-building and cost-reduction initiatives. Each of theseinitiatives is designed to enhance our customers’shopping experience while making our operations moreefficient. As we continue to grow sales whilecontrolling expenses, we are better able to leverage ourfixed and variable costs. Now that we’re back in theproductivity loop, we intend to stay there.
On the following pages, we highlight some of theways we have been reinventing the shoppingexperience. Focusing on the consumer, we are system-atically revitalizing our marketing plans, rejuvenatingour store system and reinvigorating our corporatebrand products. In the process, we also are reenergizing
our workforce. Collectively, no segment of ourstakeholder base takes greater pride in the renaissanceof Safeway than our 201,000 employees do, and nosegment deserves more credit for the company’sresurgence. Once again I‘d like to acknowledge theirtireless efforts to transform our business and satisfyour customers.
In closing, we are committed to enhancing customersatisfaction and shareholder value in 2006 and beyond.I’m convinced we have the right game plan and theright team to accomplish these objectives.
Steven A. BurdChairman, President and Chief Executive OfficerMarch 10, 2006
Reconciliation of GAAP Net Income to Adjusted Income and Adjusted Earnings per Share and Impact on Operatingand Administrative Expense as a Percentage of Sales (Unaudited)(Dollars in millions, except per-share amounts)
2005 2004Basis point
Before After Per diluted Percentage Before After Per diluted Percentage increase (decrease)taxes taxes share of sales taxes taxes share of sales in O & A expense
Net income, as reported $ 849.0 $561.1 $1.25 $793.9 $560.2 $1.25Texas store impairment 54.7 33.9 0.08 0.14% – – – – 14Texas store exit activities 55.5 34.1 0.07 0.14 – – – – 14Employee buyout 59.4 36.6 0.08 0.15 – – – – 15Dominick’s store exit activities – – – – 45.7 28.5 0.06 0.12% (12)Health and welfare contribution – – – – 31.1 19.1 0.04 0.08 (8)Accrual for rent holidays – – – – 10.6 6.5 0.01 0.03 (3)Pro forma stock option expense – – – (73.0) (44.8) (0.10)
Adjusted income $1,018.6 $665.7 $1.48 $808.3 $569.5 $1.26 20
1
Reconciliation of GAAP Cash Flow Measure to Free Cash Flow (Unaudited)(In millions)
2005
Net cash flow from operating activities $1,881.0 Net cash flow used by investing activities (1,313.5)
Free cash flow $ 567.5
2
Focusing on the Consumer
Working with experts within the food industry and at
leading universities, we have developed a deeper, richer
understanding of what shoppers expect of a supermarket.
For example, we realize that because consumers lead busier,
more demanding lives today, choice and balance are more
important than ever before. With such insights, we are
able to target offerings geared to our customers’ specific
shopping patterns and preferences. At the same time, we
are developing a more complete shopping experience,
one with expansive choices that appeal to a wide range
of both needs and desires.
SAFEWAY INC. 2005 ANNUAL REPORT 5
6 SAFEWAY INC. 2005 ANNUAL REPORT
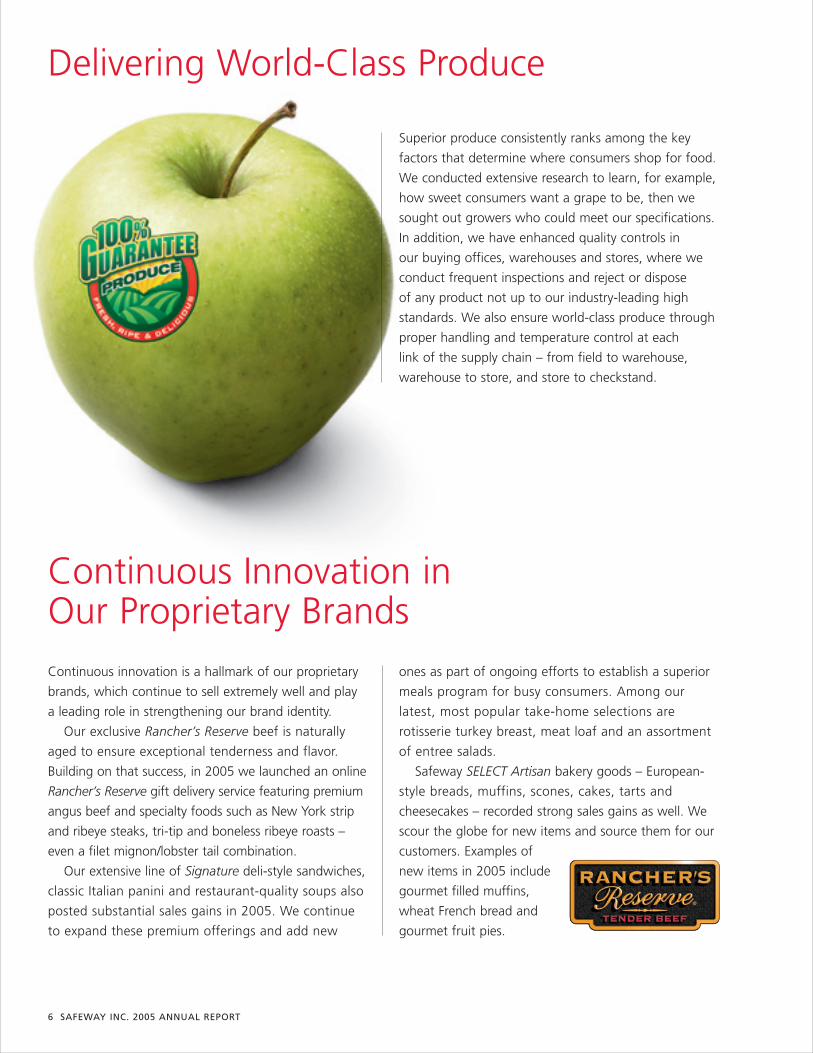
Superior produce consistently ranks among the key
factors that determine where consumers shop for food.
We conducted extensive research to learn, for example,
how sweet consumers want a grape to be, then we
sought out growers who could meet our specifications.
In addition, we have enhanced quality controls in
our buying offices, warehouses and stores, where we
conduct frequent inspections and reject or dispose
of any product not up to our industry-leading high
standards. We also ensure world-class produce through
proper handling and temperature control at each
link of the supply chain – from field to warehouse,
warehouse to store, and store to checkstand.
Continuous Innovation in Our Proprietary BrandsContinuous innovation is a hallmark of our proprietary
brands, which continue to sell extremely well and play
a leading role in strengthening our brand identity.
Our exclusive Rancher’s Reserve beef is naturally
aged to ensure exceptional tenderness and flavor.
Building on that success, in 2005 we launched an online
Rancher’s Reserve gift delivery service featuring premium
angus beef and specialty foods such as New York strip
and ribeye steaks, tri-tip and boneless ribeye roasts –
even a filet mignon/lobster tail combination.
Our extensive line of Signature deli-style sandwiches,
classic Italian panini and restaurant-quality soups also
posted substantial sales gains in 2005. We continue
to expand these premium offerings and add new
ones as part of ongoing efforts to establish a superior
meals program for busy consumers. Among our
latest, most popular take-home selections are
rotisserie turkey breast, meat loaf and an assortment
of entree salads.
Safeway SELECT Artisan bakery goods – European-
style breads, muffins, scones, cakes, tarts and
cheesecakes – recorded strong sales gains as well. We
scour the globe for new items and source them for our
customers. Examples of
new items in 2005 include
gourmet filled muffins,
wheat French bread and
gourmet fruit pies.
Delivering World-Class Produce

Superior quality is the defining characteristic of our proprietary brands. They continue to sellextremely well and play aleading role in strengtheningour brand identity.
GROWTH
IN SIGNATURE
SOUP SALES
75%
8 SAFEWAY INC. 2005 ANNUAL REPORT
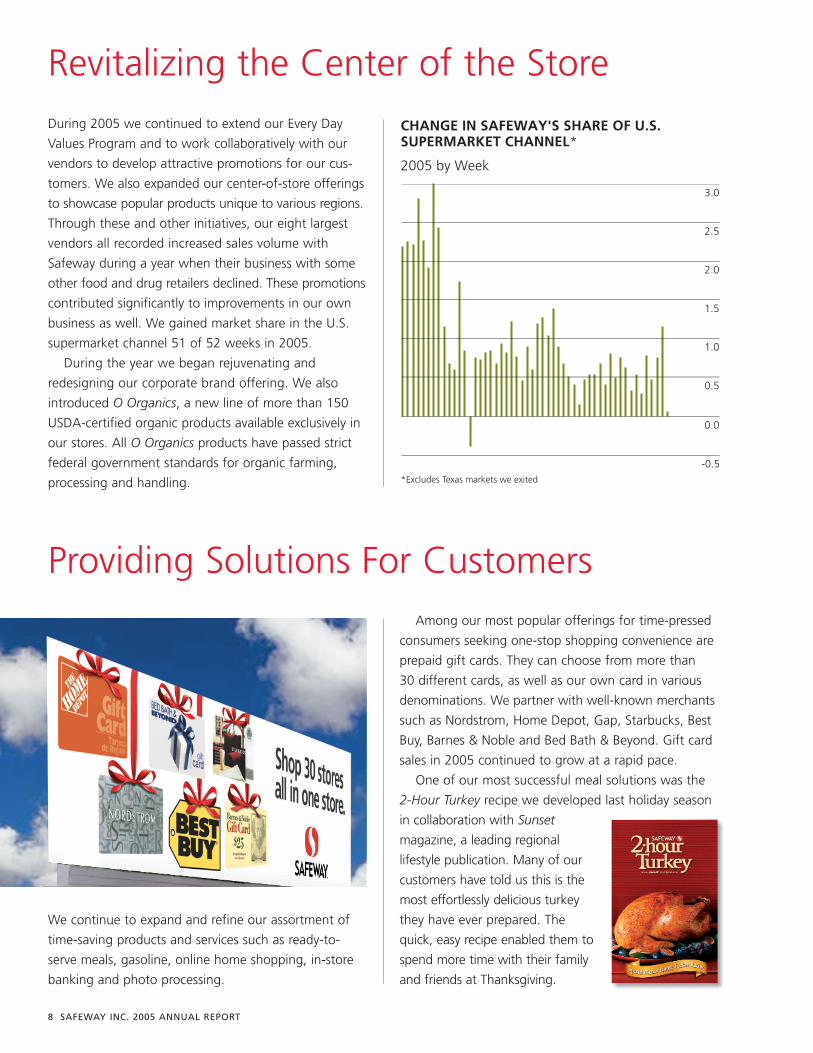
During 2005 we continued to extend our Every Day
Values Program and to work collaboratively with our
vendors to develop attractive promotions for our cus-
tomers. We also expanded our center-of-store offerings
to showcase popular products unique to various regions.
Through these and other initiatives, our eight largest
vendors all recorded increased sales volume with
Safeway during a year when their business with some
other food and drug retailers declined. These promotions
contributed significantly to improvements in our own
business as well. We gained market share in the U.S.
supermarket channel 51 of 52 weeks in 2005.
During the year we began rejuvenating and
redesigning our corporate brand offering. We also
introduced O Organics, a new line of more than 150
USDA-certified organic products available exclusively in
our stores. All O Organics products have passed strict
federal government standards for organic farming,
processing and handling.
Revitalizing the Center of the Store
Among our most popular offerings for time-pressed
consumers seeking one-stop shopping convenience are
prepaid gift cards. They can choose from more than
30 different cards, as well as our own card in various
denominations. We partner with well-known merchants
such as Nordstrom, Home Depot, Gap, Starbucks, Best
Buy, Barnes & Noble and Bed Bath & Beyond. Gift card
sales in 2005 continued to grow at a rapid pace.
One of our most successful meal solutions was the
2-Hour Turkey recipe we developed last holiday season
in collaboration with Sunset
magazine, a leading regional
lifestyle publication. Many of our
customers have told us this is the
most effortlessly delicious turkey
they have ever prepared. The
quick, easy recipe enabled them to
spend more time with their family
and friends at Thanksgiving.
We continue to expand and refine our assortment of
time-saving products and services such as ready-to-
serve meals, gasoline, online home shopping, in-store
banking and photo processing.
Providing Solutions For Customers
CHANGE IN SAFEWAY'S SHARE OF U.S. SUPERMARKET CHANNEL*
2005 by Week
*Excludes Texas markets we exited
3.0
2.5
2.0
1.5
1.0
0.5
0.0
-0.5

O ORGANICS
PRODUCTS
150+TM
10 SAFEWAY INC. 2005 ANNUAL REPORT
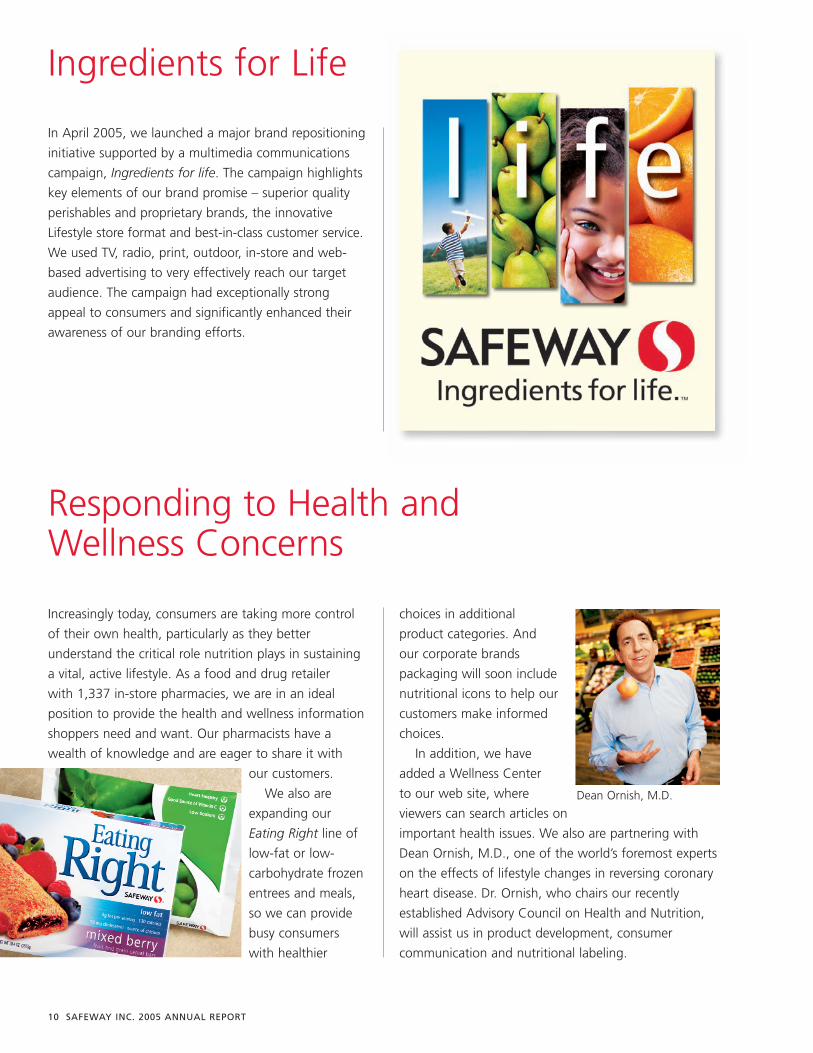
Ingredients for Life
Responding to Health and Wellness Concerns
In April 2005, we launched a major brand repositioning
initiative supported by a multimedia communications
campaign, Ingredients for life. The campaign highlights
key elements of our brand promise – superior quality
perishables and proprietary brands, the innovative
Lifestyle store format and best-in-class customer service.
We used TV, radio, print, outdoor, in-store and web-
based advertising to very effectively reach our target
audience. The campaign had exceptionally strong
appeal to consumers and significantly enhanced their
awareness of our branding efforts.
Increasingly today, consumers are taking more control
of their own health, particularly as they better
understand the critical role nutrition plays in sustaining
a vital, active lifestyle. As a food and drug retailer
with 1,337 in-store pharmacies, we are in an ideal
position to provide the health and wellness information
shoppers need and want. Our pharmacists have a
wealth of knowledge and are eager to share it with
our customers.
We also are
expanding our
Eating Right line of
low-fat or low-
carbohydrate frozen
entrees and meals,
so we can provide
busy consumers
with healthier
choices in additional
product categories. And
our corporate brands
packaging will soon include
nutritional icons to help our
customers make informed
choices.
In addition, we have
added a Wellness Center
to our web site, where
viewers can search articles on
important health issues. We also are partnering with
Dean Ornish, M.D., one of the world’s foremost experts
on the effects of lifestyle changes in reversing coronary
heart disease. Dr. Ornish, who chairs our recently
established Advisory Council on Health and Nutrition,
will assist us in product development, consumer
communication and nutritional labeling.
Dean Ornish, M.D.
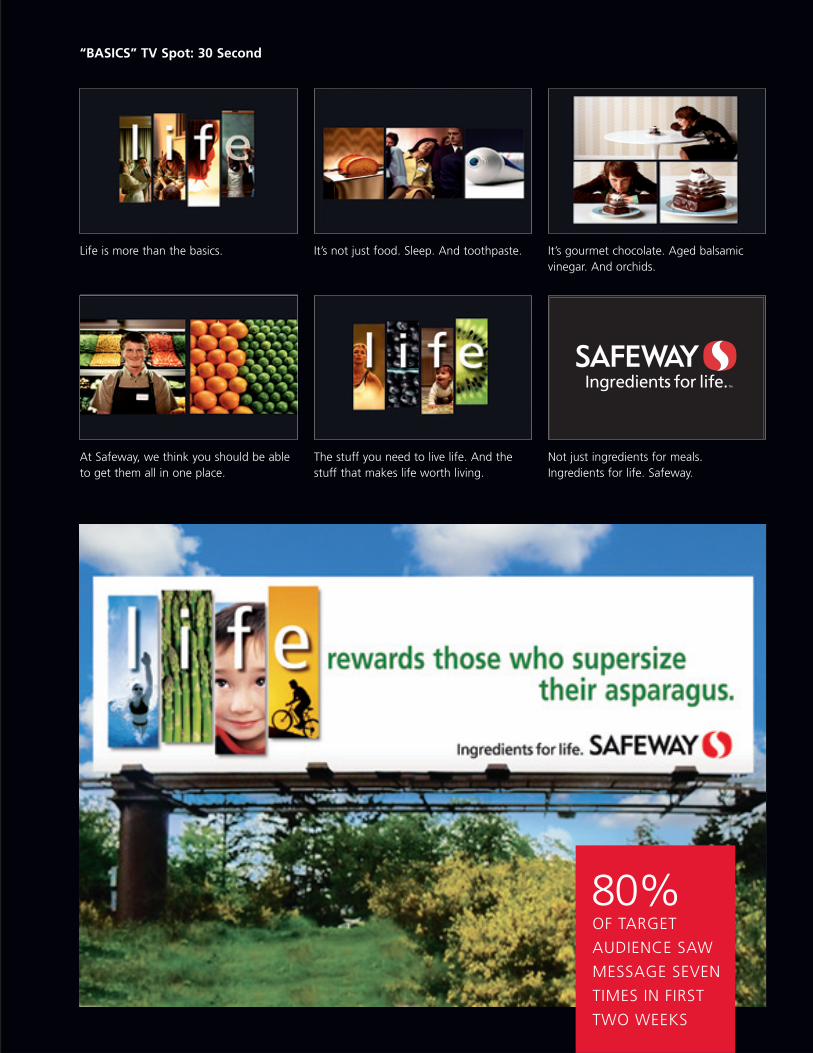
Life is more than the basics. It’s not just food. Sleep. And toothpaste. It’s gourmet chocolate. Aged balsamicvinegar. And orchids.
At Safeway, we think you should be ableto get them all in one place.
The stuff you need to live life. And thestuff that makes life worth living.
Not just ingredients for meals. Ingredients for life. Safeway.
“BASICS” TV Spot: 30 Second
OF TARGET
AUDIENCE SAW
MESSAGE SEVEN
TIMES IN FIRST
TWO WEEKS
80%
12 SAFEWAY INC. 2005 ANNUAL REPORT
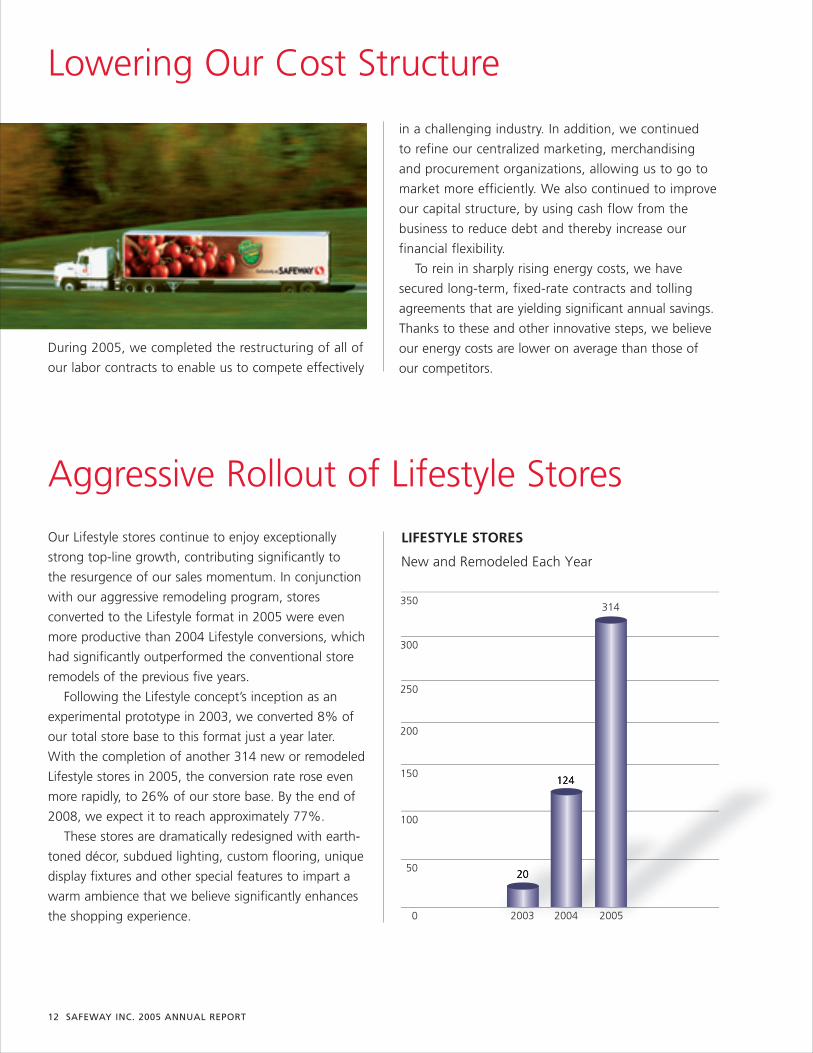
20
124
20052003 2004
LIFESTYLE STORES
New and Remodeled Each Year
300
250
350
200
150
100
50
0
314
During 2005, we completed the restructuring of all of
our labor contracts to enable us to compete effectively
Aggressive Rollout of Lifestyle Stores
Our Lifestyle stores continue to enjoy exceptionally
strong top-line growth, contributing significantly to
the resurgence of our sales momentum. In conjunction
with our aggressive remodeling program, stores
converted to the Lifestyle format in 2005 were even
more productive than 2004 Lifestyle conversions, which
had significantly outperformed the conventional store
remodels of the previous five years.
Following the Lifestyle concept’s inception as an
experimental prototype in 2003, we converted 8% of
our total store base to this format just a year later.
With the completion of another 314 new or remodeled
Lifestyle stores in 2005, the conversion rate rose even
more rapidly, to 26% of our store base. By the end of
2008, we expect it to reach approximately 77%.
These stores are dramatically redesigned with earth-
toned décor, subdued lighting, custom flooring, unique
display fixtures and other special features to impart a
warm ambience that we believe significantly enhances
the shopping experience.
Lowering Our Cost Structure
in a challenging industry. In addition, we continued
to refine our centralized marketing, merchandising
and procurement organizations, allowing us to go to
market more efficiently. We also continued to improve
our capital structure, by using cash flow from the
business to reduce debt and thereby increase our
financial flexibility.
To rein in sharply rising energy costs, we have
secured long-term, fixed-rate contracts and tolling
agreements that are yielding significant annual savings.
Thanks to these and other innovative steps, we believe
our energy costs are lower on average than those of
our competitors.
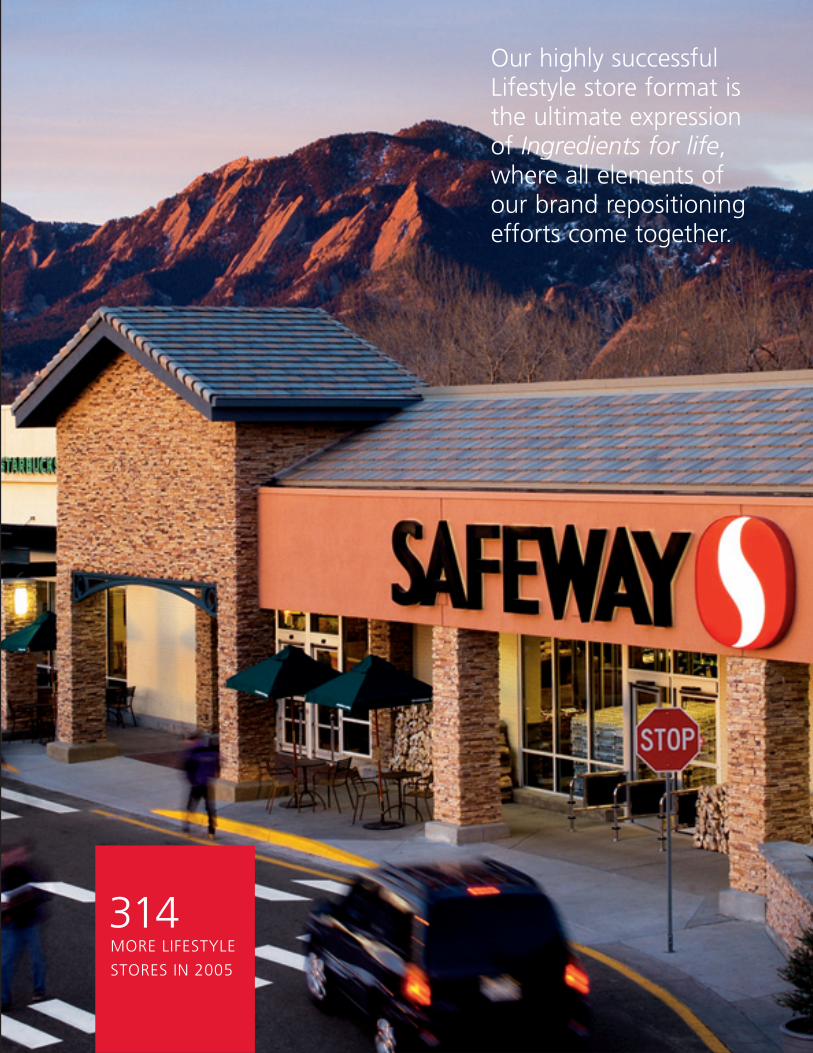
MORE LIFESTYLE
STORES IN 2005
314
Our highly successfulLifestyle store format isthe ultimate expressionof Ingredients for life,where all elements ofour brand repositioningefforts come together.
14 SAFEWAY INC. 2005 ANNUAL REPORT
Safeway supports the communities it serves through
a range of charitable activities and environmental
initiatives. During 2005 we donated millions of pounds
of merchandise to America’s Second Harvest food
banks and other hunger-relief organizations. We also
contributed more than $25 million to schools through
eScrip and other educational programs. In addition,
we donated a combined $15 million through major
fundraising campaigns to support breast and prostate
cancer research, treatment and education and to
further the fine work of the Muscular Dystrophy
Association and Easter Seals. We also raised more
than $3.6 million to assist victims of the devastating
Safeway also strives to maintain a balanced work
force that reflects the diversity of its customers and
the communities in which they live. In 2005, for the
third consecutive year, a leading business magazine
recognized our enterprise-wide Diversity Initiative by
including Safeway on its list of America’s 50 Best
Companies for Minorities. During the year we also
appeared on that publication’s lists of America’s
Most Admired Companies and America’s 50 Best
Companies for Women. In addition, we recently
received a Catalyst Award for the positive impact of
our diversity programs on recruiting, developing and
promoting managerial women.
Partners in Progress
Through training and development, and by embracing
diversity, Safeway believes it has some of the best
employees in the industry – our partners in progress.
We provide our employees with the knowledge, skills
and tools they need to excel at their jobs. In recognition
of our commitment to innovative workplace learning
and growth, the Food Marketing Institute honored us
with its 2005 Maximizing People Potential Award.
Social Responsibility
tsunami in South Asia and Eastern Africa, and
$3.7 million for Hurricane Katrina victims in the Gulf
Coast region.
Safeway also has been an industry leader in
environmental responsibility for 45 years. During 2005
we diverted more than 1 billion pounds of recyclable
materials from the waste stream. In addition, through
a partnership with the Environmental Protection
Agency, Safeway became one of the nation’s largest
commercial buyers of
renewable energy and
was named a top EPA
Green Power Partner.
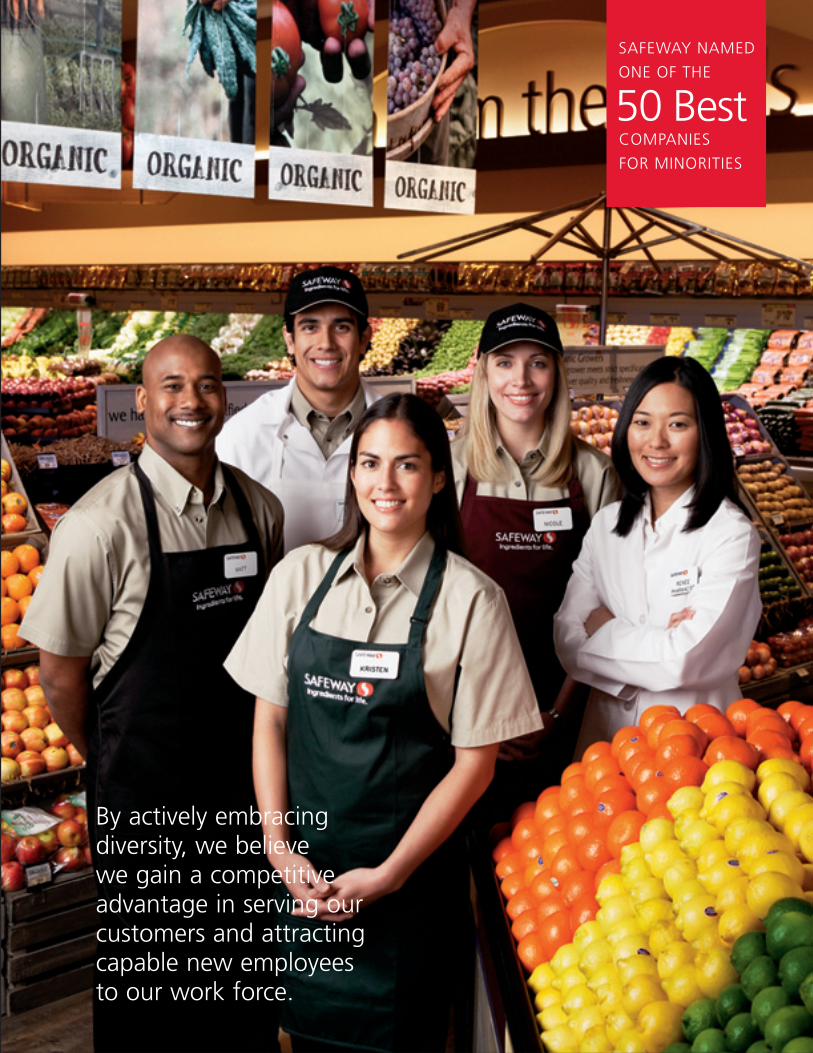
By actively embracing diversity, we believe we gain a competitive advantage in serving ourcustomers and attractingcapable new employees to our work force.
SAFEWAY NAMED
ONE OF THE
COMPANIES
FOR MINORITIES
50 Best
16 SAFEWAY INC. 2005 ANNUAL REPORT
DIRECTORS
Steven A. BurdChairman, President and Chief Executive OfficerSafeway Inc.
Paul HazenLead Independent DirectorFormer Chairman andChief Executive Officer Wells Fargo & Co.Deputy ChairmanVodafone Group PLC
Janet E. GroveChair and Chief Executive OfficerFederated Merchandising GroupVice ChairFederated Department Stores, Inc.
Mohan GyaniFormer President and Chief Executive OfficerMobility ServicesAT&T Wireless Services, Inc.
Robert I. MacDonnellRetired PartnerKKR & Co.
Douglas J. MackenziePartnerKleiner Perkins Caufield & Byers
Rebecca A. StirnBusiness Consultant
William Y. TauscherManaging MemberThe Tauscher Group
Raymond G. ViaultFormer Vice ChairmanGeneral Mills, Inc.
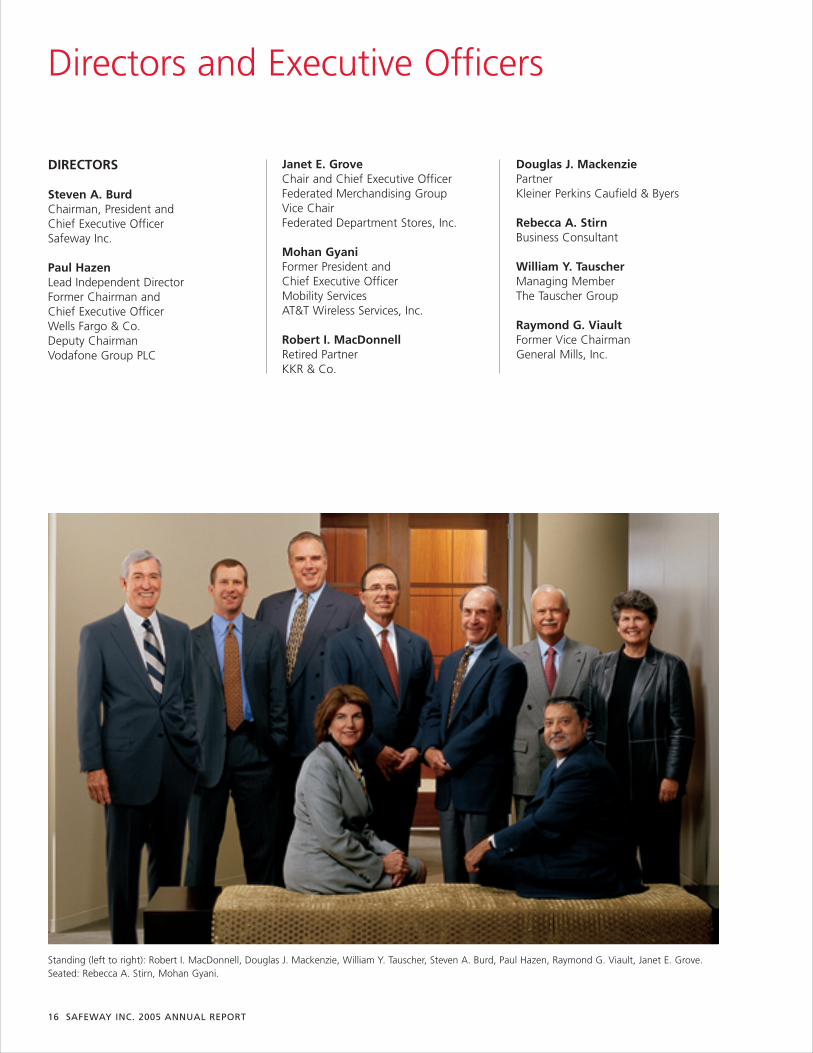
Directors and Executive Officers
Standing (left to right): Robert I. MacDonnell, Douglas J. Mackenzie, William Y. Tauscher, Steven A. Burd, Paul Hazen, Raymond G. Viault, Janet E. Grove.Seated: Rebecca A. Stirn, Mohan Gyani.
SAFEWAY INC. 2005 ANNUAL REPORT 17
EXECUTIVE OFFICERS
Steven A. BurdChairman, President and Chief Executive Officer
Brian C. CornellExecutive Vice President andChief Marketing Officer
Robert L. EdwardsExecutive Vice President and Chief Financial Officer
Bruce L. EveretteExecutive Vice PresidentRetail Operations
Larree M. RendaExecutive Vice PresidentChief Strategist and Administrative Officer
David F. BondSenior Vice President Finance and Control(Chief Accounting Officer)
David T. ChingSenior Vice President andChief Information Officer
Dick W. GonzalesSenior Vice PresidentHuman Resources
Robert A. GordonSenior Vice President,Secretary and General Counsel Chief Governance Officer
Melissa C. PlaisanceSenior Vice PresidentFinance and Investor Relations
Kenneth M. ShachmutSenior Vice PresidentReengineering and Marketing Analysis
David R. SternSenior Vice PresidentPlanning and Business Development
Jerry TidwellSenior Vice President Supply Operations
Donald P. WrightSenior Vice PresidentReal Estate and Engineering
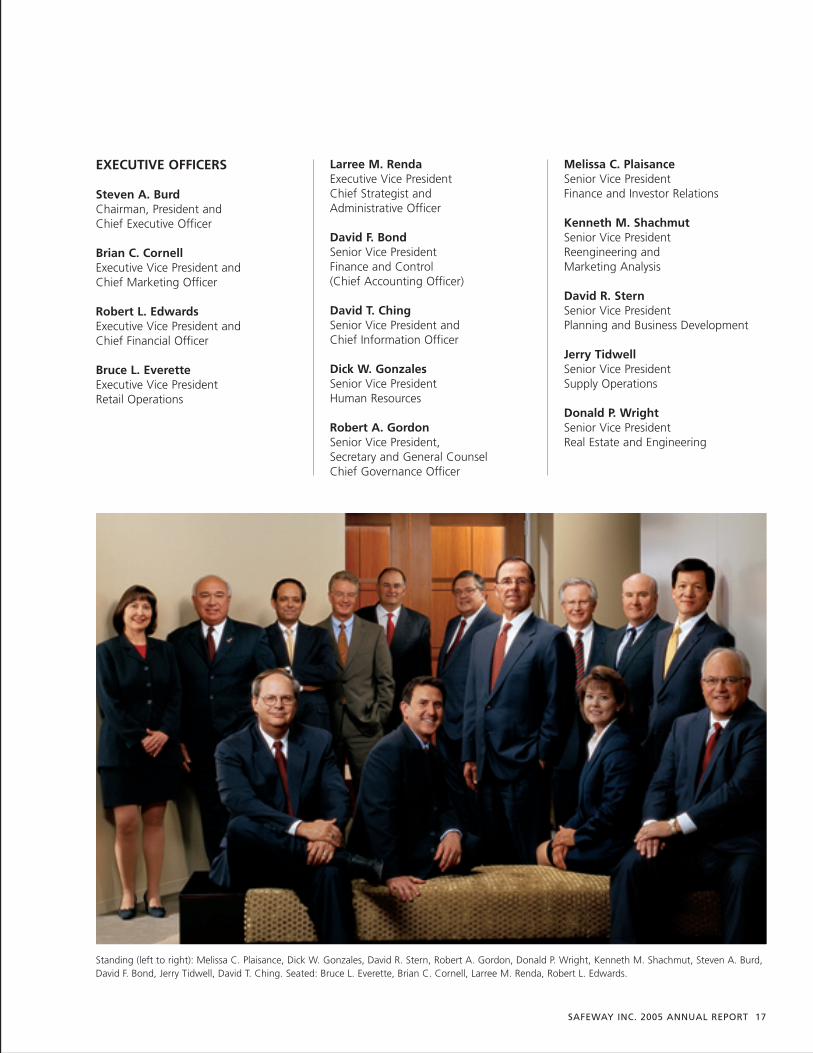
Standing (left to right): Melissa C. Plaisance, Dick W. Gonzales, David R. Stern, Robert A. Gordon, Donald P. Wright, Kenneth M. Shachmut, Steven A. Burd,David F. Bond, Jerry Tidwell, David T. Ching. Seated: Bruce L. Everette, Brian C. Cornell, Larree M. Renda, Robert L. Edwards.
18 SAFEWAY INC. 2005 ANNUAL REPORT
DIVISION PRESIDENTS
Henry A. CominielloEastern Division
Kelly GriffithPortland Division
Scott GrimmettDenver Division
Karl SchroederNorthern California Division
Gregory A. SparksSeattle Division
Daniel J. ValenzuelaPhoenix Division
Thomas C. KellerThe Vons Companies, Inc.
Donald KeprtaDominick’s Finer Foods, LLC
Steven R. FrisbyRandall’s Food & Drugs, LP
FOREIGN SUBSIDIARY
Canada Safeway Limited
Chuck Mulvenna President and Chief Operating Officer
EQUITY AFFILIATE
Casa Ley, S.A. De C.V. (Mexico)
Juan Manuel Ley LopezChairman and Chief Executive Officer
Other Principal Officers
PERCENTAGE OF STORES WITH SPECIALTY DEPARTMENTS
2005
Bakery 94%Deli 97Floral 92Pharmacy 75
MANUFACTURING AND PROCESSING FACILITIES
Year-end 2005
U.S. Canada
Milk Plants 6 3Bread Baking Plants 5 2Ice Cream Plants 2 2Cheese and Meat
Packaging Plants – 2Soft Drink Bottling
Plants 4 –Fruit and Vegetable
Processing Plants 1 3Other Food
Processing Plants 2 –Pet Food Plant 1 –
21 12
Safeway at a Glance
UNITED STATESSECURITIES AND EXCHANGE COMMISSION
Washington, D.C. 20549
FORM 10-K
(Mark One)
X ANNUAL REPORT PURSUANT TO SECTION 13 OR 15(d) OF THE SECURITIES EXCHANGE ACT OF 1934
For the fiscal year ended December 31, 2005OR
TRANSITION REPORT PURSUANT TO SECTION 13 OR 15(d) OF THE SECURITIES EXCHANGE ACT OF 1934
For the transition period from to Commission file number 1-00041
SAFEWAY INC.
(Exact name of registrant as specified in its charter)
Delaware 94-3019135(State or other jurisdiction of incorporation or
organization)(I.R.S. Employer Identification No.)
5918 Stoneridge Mall RoadPleasanton, California 94588-3229
(Address of principal executive offices) (Zip Code)
Registrant's telephone number, including areacode:
(925) 467-3000
Securities registered pursuant to Section 12(b) of the Act:
Title of each class Name of each exchange on which registered
Common Stock, $0.01 par value per share New York Stock Exchange9.30% Senior Secured Debentures due 2007 New York Stock Exchange
9.875% Senior Subordinated Debentures due 2007 New York Stock Exchange7.00% Senior Notes due 2007 New York Stock Exchange7.45% Senior Debentures due 2027 New York Stock Exchange
Securities registered pursuant to Section 12(g) of the Act:
(Title of class)
NONE
Indicate by check mark if the registrant is a well-known seasoned issuer, as defined in Rule 405 of the Securities Act. Yes X No .
(Cover continued on following page)
SAFEWAY INC. AND SUBSIDIARIES
2
(Cover continued from previous page)
Indicate by check mark if the registrant is not required to file reports pursuant to Section 13 or Section 15(d) of the Act.Yes _ No X.
Indicate by check mark whether the registrant (1) has filed all reports required to be filed by Section 13 or 15(d) of theSecurities Exchange Act of 1934 during the preceding 12 months (or for such shorter period that the registrant was requiredto file such reports), and (2) has been subject to such filing requirements for the past 90 days. Yes X No .
Indicate by check mark if disclosure of delinquent filers pursuant to Item 405 of Regulation S-K is not contained herein, andwill not be contained, to the best of registrant's knowledge, in definitive proxy or information statements incorporated byreference in Part III of this Form 10-K or any amendment to this Form 10-K X.
Indicate by check mark whether the registrant is a large accelerated filer, an accelerated filer, or a non-accelerated filer. Seedefinition of “accelerated filer and large accelerated filer” in Rule 12b-2 of the Exchange Act. (Check one):
Large accelerated filer X Accelerated filer __ Non-accelerated filer __
Indicate by check mark whether the registrant is a shell company (as defined in Rule 12b-2 of the Act). Yes No X.
State the aggregate market value of the voting and non-voting common equity held by non-affiliates computed by referenceto the price at which the common equity was last sold, or the average bid and asked price of such common equity, as of thelast business day of the registrant’s most recently completed second fiscal quarter. Aggregate market value of the votingstock held by non-affiliates of registrant as of June 18, 2005 was approximately $10.4 billion.
As of March 3, 2006, there were outstanding 449.7 million shares of the registrant's common stock.
DOCUMENTS INCORPORATED BY REFERENCE
The following document is incorporated by reference to the extent specified herein:
Document Description 10-K Part
Portions of the definitive proxy statement foruse in connection with the Annual Meeting ofStockholders (to be held May 25, 2006) to befiled within 120 days after the end of the fiscalyear ended December 31, 2005
III
SAFEWAY INC. AND SUBSIDIARIESTable of Contents
3
PageFORWARD-LOOKING STATEMENTS 4
PART IItem 1. Business 4
Item 1A. Risk Factors 9
Item 1B. Unresolved Staff Comments 11
Item 2. Properties 12
Item 3. Legal Proceedings 12
Item 4. Submission of Matters to a Vote of Security Holders 12
Executive Officers of the Registrant 12
PART IIItem 5. Market for Registrant’s Common Equity, Related Stockholder Matters and Issuer Purchases of
Equity Securities 14
Item 6. Selected Financial Data 16
Item 7. Management’s Discussion and Analysis of Financial Condition and Results of Operations 18
Item 7A. Quantitative and Qualitative Disclosures About Market Risk 28
Item 8. Financial Statements and Supplementary Data 29
Item 9. Changes in and Disagreements with Accountants on Accounting and Financial Disclosure 61
Item 9A. Controls and Procedures 61
Item 9B. Other Information 61
PART IIIItem 10. Directors and Executive Officers of the Registrant 62
Item 11. Executive Compensation 62
Item 12. Security Ownership of Certain Beneficial Owners and Management and Related StockholderMatters 62
Item 13. Certain Relationships and Related Transactions 62
Item 14. Principal Accounting Fees and Services 63
PART IVItem 15. Exhibits, Financial Statement Schedules 64
SIGNATURES 70
SAFEWAY INC. AND SUBSIDIARIES
4
FORWARD-LOOKING STATEMENTS
This Annual Report on Form 10-K for Safeway Inc. (“Safeway” or the “Company”) contains certain forward-lookingstatements within the meaning of Section 27A of the Securities Act of 1933 and Section 21E of the Securities Exchange Actof 1934. Such statements relate to, among other things, capital expenditures, the valuation of Safeway’s investments,operating improvements and costs, tax rate, tax contingencies, gross profit improvement, cash flow and other sources ofliquidity, uses of excess cash flow, common stock dividend payments and Lifestyle stores, and are indicated by words orphrases such as “estimate,” “continuing,” “ongoing,” “expect,” “anticipate,” “believe” and similar words or phrases andthe negative of such words or phrases. The following are among the principal factors that could cause actual results to differmaterially from the forward-looking statements: general business and economic conditions in our operating regions,including the rate of inflation, consumer spending levels, population, employment and job growth in our markets; pricingpressures and competitive factors, which could include pricing strategies, store openings and remodels by our competitors;results of our programs to control or reduce costs, improve buying practices and control shrink; results of our programs toincrease sales, including private-label sales, improvements in our perishables departments and our promotional programs;results of our programs to improve capital management; the ability to integrate any companies we acquire and achieveoperating improvements at those companies; changes in financial performance of our equity investments; increases in laborcosts and relations with union bargaining units representing our employees or employees of third-party operators of ourdistribution centers; changes in state or federal legislation or regulation; the cost and stability of power sources;opportunities, acquisitions or dispositions that we pursue; performance in new business ventures; the rate of return on ourpension assets; and the availability and terms of financing. Consequently, actual events and results may vary significantlyfrom those included in or contemplated or implied by such statements. The Company undertakes no obligation to updateforward-looking statements to reflect developments or information obtained after the date hereof and disclaims anyobligation to do so. For additional information regarding these risks and uncertainties, see “Item 1A. Risk Factors.”
PART I
Item 1. Business
General Safeway was incorporated in the state of Delaware in July 1986 as SSI Holdings Corporation and, thereafter, itsname was changed to Safeway Stores, Incorporated. In February 1990, the Company changed its name to Safeway Inc.
Safeway Inc. is one of the largest food and drug retailers in North America, with 1,775 stores at year-end 2005. TheCompany’s U.S. retail operations are located principally in California, Oregon, Washington, Alaska, Colorado, Arizona, Texas,the Chicago metropolitan area and the Mid-Atlantic region. The Company’s Canadian retail operations are locatedprincipally in British Columbia, Alberta and Manitoba/Saskatchewan. In support of its retail operations, the Company has anextensive network of distribution, manufacturing and food processing facilities.
Safeway also has a 49% ownership interest in Casa Ley, S.A. de C.V. (“Casa Ley”) which operates 119 food and generalmerchandise stores in Western Mexico. In addition, the Company has a strategic alliance with and a 56% ownership interestin GroceryWorks Holdings, Inc., an Internet grocer.
Stores Safeway's average store size is approximately 45,000 square feet. The Company determines the size of a new storebased on a number of considerations, including the needs of the community the store serves, the location and site plan, andthe estimated return on capital invested. Safeway's primary new store format, called the “Lifestyle” store, is typically 55,000square feet but can vary depending on the factors stated above. Lifestyle stores have an expanded perishables offering andfeature a warm and inviting décor, with special lighting to highlight products and departments.
Safeway’s stores provide a full array of dry grocery items tailored to local preferences. Most stores offer a wide selection offood and general merchandise and feature a variety of specialty departments such as bakery, delicatessen, floral andpharmacy. In addition, many stores now offer Starbucks coffee shops and adjacent fuel centers.
Safeway continues to operate a number of smaller stores that also offer an extensive selection of food and general
SAFEWAY INC. AND SUBSIDIARIES
5
merchandise and that generally include one or more specialty departments. These stores remain an important part of theCompany's store network in smaller communities and certain other locations where larger stores may not be feasiblebecause of space limitations and/or community needs or restrictions.
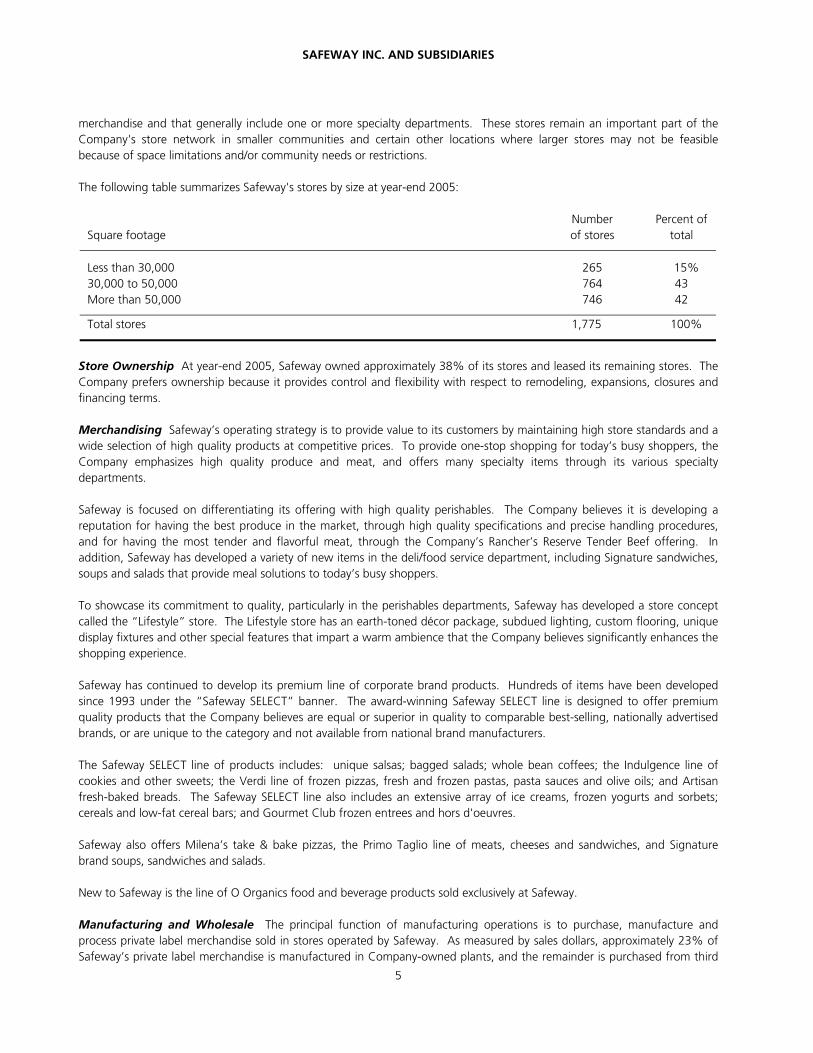
The following table summarizes Safeway's stores by size at year-end 2005:
Square footageNumberof stores
Percent oftotal
Less than 30,000 265 15%30,000 to 50,000 764 43More than 50,000 746 42
Total stores 1,775 100%
Store Ownership At year-end 2005, Safeway owned approximately 38% of its stores and leased its remaining stores. TheCompany prefers ownership because it provides control and flexibility with respect to remodeling, expansions, closures andfinancing terms.
Merchandising Safeway’s operating strategy is to provide value to its customers by maintaining high store standards and awide selection of high quality products at competitive prices. To provide one-stop shopping for today’s busy shoppers, theCompany emphasizes high quality produce and meat, and offers many specialty items through its various specialtydepartments.
Safeway is focused on differentiating its offering with high quality perishables. The Company believes it is developing areputation for having the best produce in the market, through high quality specifications and precise handling procedures,and for having the most tender and flavorful meat, through the Company’s Rancher’s Reserve Tender Beef offering. Inaddition, Safeway has developed a variety of new items in the deli/food service department, including Signature sandwiches,soups and salads that provide meal solutions to today’s busy shoppers.
To showcase its commitment to quality, particularly in the perishables departments, Safeway has developed a store conceptcalled the “Lifestyle” store. The Lifestyle store has an earth-toned décor package, subdued lighting, custom flooring, uniquedisplay fixtures and other special features that impart a warm ambience that the Company believes significantly enhances theshopping experience.
Safeway has continued to develop its premium line of corporate brand products. Hundreds of items have been developedsince 1993 under the “Safeway SELECT” banner. The award-winning Safeway SELECT line is designed to offer premiumquality products that the Company believes are equal or superior in quality to comparable best-selling, nationally advertisedbrands, or are unique to the category and not available from national brand manufacturers.
The Safeway SELECT line of products includes: unique salsas; bagged salads; whole bean coffees; the Indulgence line ofcookies and other sweets; the Verdi line of frozen pizzas, fresh and frozen pastas, pasta sauces and olive oils; and Artisanfresh-baked breads. The Safeway SELECT line also includes an extensive array of ice creams, frozen yogurts and sorbets;cereals and low-fat cereal bars; and Gourmet Club frozen entrees and hors d'oeuvres.
Safeway also offers Milena’s take & bake pizzas, the Primo Taglio line of meats, cheeses and sandwiches, and Signaturebrand soups, sandwiches and salads.
New to Safeway is the line of O Organics food and beverage products sold exclusively at Safeway.
Manufacturing and Wholesale The principal function of manufacturing operations is to purchase, manufacture andprocess private label merchandise sold in stores operated by Safeway. As measured by sales dollars, approximately 23% ofSafeway’s private label merchandise is manufactured in Company-owned plants, and the remainder is purchased from third
SAFEWAY INC. AND SUBSIDIARIES
6
parties.
Safeway's Canadian subsidiary has a wholesale operation that distributes both national brands and private label products toindependent grocery stores and institutional customers.
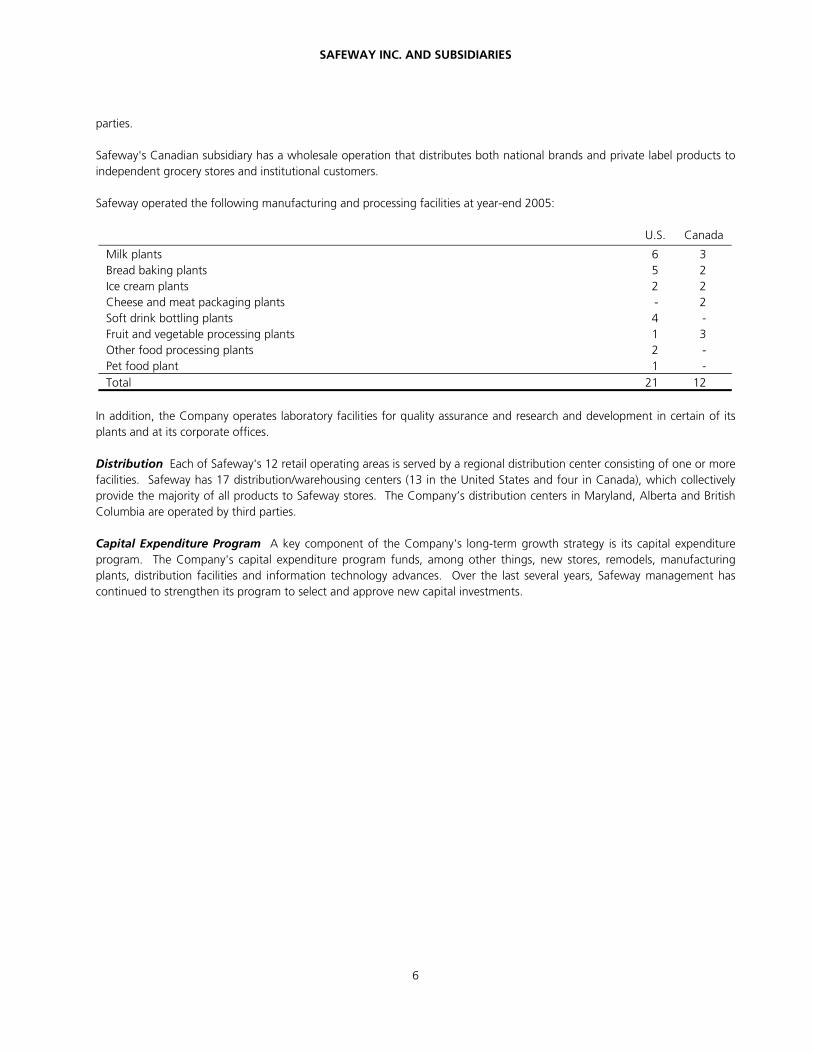
Safeway operated the following manufacturing and processing facilities at year-end 2005:
U.S. Canada
Milk plants 6 3Bread baking plants 5 2Ice cream plants 2 2Cheese and meat packaging plants - 2Soft drink bottling plants 4 -Fruit and vegetable processing plants 1 3Other food processing plants 2 -Pet food plant 1 -Total 21 12
In addition, the Company operates laboratory facilities for quality assurance and research and development in certain of itsplants and at its corporate offices.
Distribution Each of Safeway's 12 retail operating areas is served by a regional distribution center consisting of one or morefacilities. Safeway has 17 distribution/warehousing centers (13 in the United States and four in Canada), which collectivelyprovide the majority of all products to Safeway stores. The Company’s distribution centers in Maryland, Alberta and BritishColumbia are operated by third parties.
Capital Expenditure Program A key component of the Company's long-term growth strategy is its capital expenditureprogram. The Company's capital expenditure program funds, among other things, new stores, remodels, manufacturingplants, distribution facilities and information technology advances. Over the last several years, Safeway management hascontinued to strengthen its program to select and approve new capital investments.
SAFEWAY INC. AND SUBSIDIARIES
7
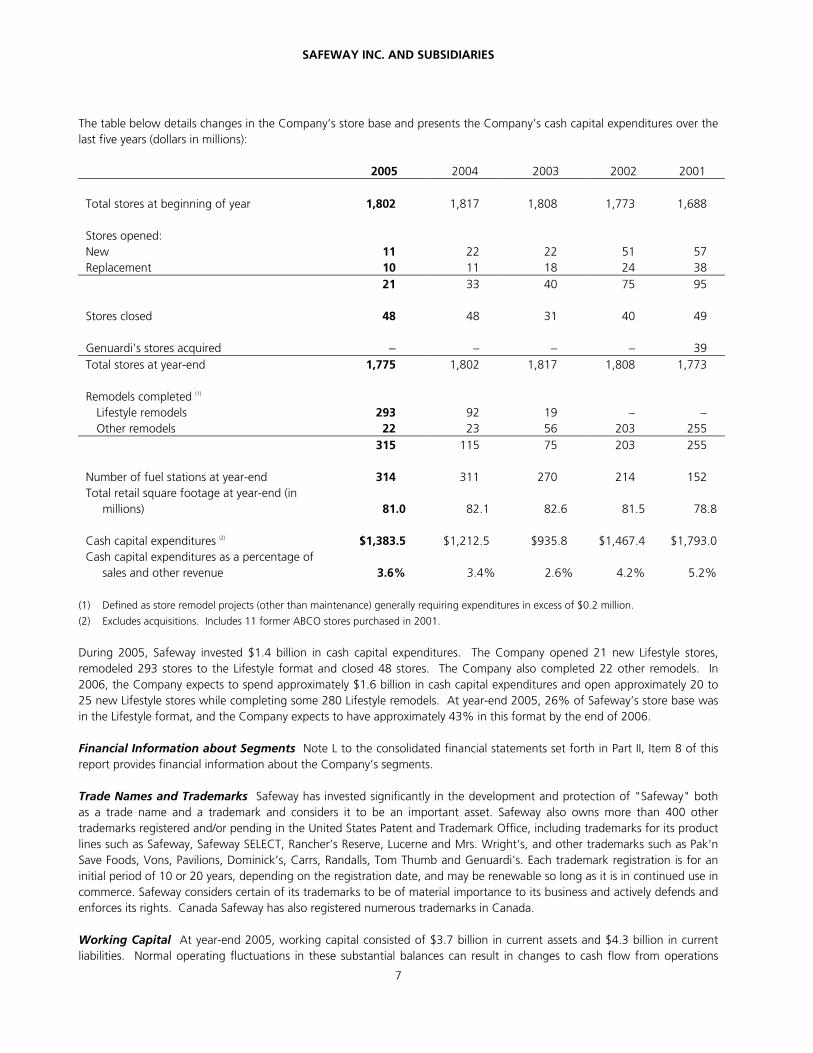
The table below details changes in the Company’s store base and presents the Company’s cash capital expenditures over thelast five years (dollars in millions):
2005 2004 2003 2002 2001
Total stores at beginning of year 1,802 1,817 1,808 1,773 1,688
Stores opened:New 11 22 22 51 57Replacement 10 11 18 24 38
21 33 40 75 95
Stores closed 48 48 31 40 49
Genuardi’s stores acquired − − − − 39Total stores at year-end 1,775 1,802 1,817 1,808 1,773
Remodels completed (1)
Lifestyle remodels 293 92 19 − −Other remodels 22 23 56 203 255
315 115 75 203 255
Number of fuel stations at year-end 314 311 270 214 152Total retail square footage at year-end (in
millions) 81.0 82.1 82.6 81.5 78.8
Cash capital expenditures (2) $1,383.5 $1,212.5 $935.8 $1,467.4 $1,793.0Cash capital expenditures as a percentage of
sales and other revenue 3.6% 3.4% 2.6% 4.2% 5.2%
(1) Defined as store remodel projects (other than maintenance) generally requiring expenditures in excess of $0.2 million.
(2) Excludes acquisitions. Includes 11 former ABCO stores purchased in 2001.
During 2005, Safeway invested $1.4 billion in cash capital expenditures. The Company opened 21 new Lifestyle stores,remodeled 293 stores to the Lifestyle format and closed 48 stores. The Company also completed 22 other remodels. In2006, the Company expects to spend approximately $1.6 billion in cash capital expenditures and open approximately 20 to25 new Lifestyle stores while completing some 280 Lifestyle remodels. At year-end 2005, 26% of Safeway’s store base wasin the Lifestyle format, and the Company expects to have approximately 43% in this format by the end of 2006.
Financial Information about Segments Note L to the consolidated financial statements set forth in Part II, Item 8 of thisreport provides financial information about the Company’s segments.
Trade Names and Trademarks Safeway has invested significantly in the development and protection of "Safeway" bothas a trade name and a trademark and considers it to be an important asset. Safeway also owns more than 400 othertrademarks registered and/or pending in the United States Patent and Trademark Office, including trademarks for its productlines such as Safeway, Safeway SELECT, Rancher’s Reserve, Lucerne and Mrs. Wright's, and other trademarks such as Pak'nSave Foods, Vons, Pavilions, Dominick’s, Carrs, Randalls, Tom Thumb and Genuardi's. Each trademark registration is for aninitial period of 10 or 20 years, depending on the registration date, and may be renewable so long as it is in continued use incommerce. Safeway considers certain of its trademarks to be of material importance to its business and actively defends andenforces its rights. Canada Safeway has also registered numerous trademarks in Canada.
Working Capital At year-end 2005, working capital consisted of $3.7 billion in current assets and $4.3 billion in currentliabilities. Normal operating fluctuations in these substantial balances can result in changes to cash flow from operations
SAFEWAY INC. AND SUBSIDIARIES
8
presented in the consolidated statements of cash flows that are not necessarily indicative of long-term operating trends.There are no unusual industry practices or requirements relating to working capital items.
Competition Food retailing is intensely competitive. The number of competitors and the amount of competitionexperienced by Safeway's stores varies by market area. The principal competitive factors that affect the Company's businessare location, quality, service, price and consumer loyalty to other brands and stores.
Local, regional and national food chains, as well as independent food stores, comprise the Company’s principal competition.Safeway also faces substantial competition from dollar stores, convenience stores, liquor retailers, membership warehouseclubs, specialty retailers, supercenters, and large-scale drug and pharmaceutical chains. Safeway and its competitors engagein price competition which, from time to time, has adversely affected operating margins in many of the Company’s markets.
Raw Materials Various agricultural commodities constitute the principal raw materials used by the Company in themanufacture of its food products. Management believes that raw materials for its products are not in short supply, and allare readily available from a wide variety of independent suppliers.
Compliance with Environmental Laws The Company's compliance with the federal, state, local and foreign laws andregulations which have been enacted or adopted regulating the discharge of materials into the environment or otherwiserelated to the protection of the environment, has not had and is not expected to have a material adverse effect upon theCompany’s financial position or results of operations.
Employees At year-end 2005, Safeway had more than 201,000 full- and part-time employees. Approximately 80% ofSafeway's employees in the United States and Canada are covered by collective bargaining agreements negotiated with localunions affiliated with one of 10 different international unions. There are approximately 400 such agreements, typicallyhaving three-year terms, with some agreements having terms of up to five years. Accordingly, Safeway renegotiates asignificant number of these agreements every year.
During 2005, the United Food and Commercial Workers International Union (“UFCW”) collective bargaining agreementscovering approximately 50,000 employees, primarily in the Company’s Northern California, Denver, Dominick’s andSaskatchewan stores, were ratified.
Also during 2005, other UFCW collective bargaining agreements−covering employees primarily in the Company's stores inWyoming; in-store Bakery Workers’ agreements in California, Seattle and Portland; and Teamsters’ agreements coveringemployees in Safeway's distribution centers in Southern California, Denver, Seattle and Edmonton−were ratified.
Other Labor Matters On October 11, 2003, seven UFCW locals struck the Company’s 289 stores in Southern California.As a result, pursuant to the terms of a multi-employer bargaining arrangement, Kroger and Albertson’s locked out certain oftheir retail union employees in Southern California food stores. An agreement ending the strike was ratified by the localunions on February 28, 2004. Employees returned to work beginning March 5, 2004. Safeway estimates the overall cost ofthe strike and its residual effects reduced 2004 earnings by $412.2 million before taxes ($0.57 per diluted share) and 2003earnings by $167.5 million before taxes ($0.23 per diluted share). Safeway estimated the impact of the strike by comparinginternal forecasts immediately before the strike with actual results during and after the strike, at strike-affected stores. Theestimate also includes the Company’s benefit under an agreement with Kroger and Albertson’s that arises out of the multi-employer bargaining process in Southern California.
Financial Information about Geographic Areas Note L to the consolidated financial statements set forth in Part II, Item 8of this report provides financial information by geographic area.
Available Information Safeway’s corporate web site is located at www.safeway.com. You may access our Securities andExchange Commission (“SEC”) filings free of charge at our corporate web site promptly after such material is electronicallyfiled with, or furnished to, the SEC. We also maintain certain corporate governance documents on our web site, includingthe Company’s Corporate Governance Guidelines, our Director Independence Standards, the Code of Business Conduct andEthics for the Company’s corporate directors, officers and employees, and the charters for our Audit, Nominating and
SAFEWAY INC. AND SUBSIDIARIES
9
Corporate Governance, and Executive Compensation committees. We will provide a copy of any such documents to anystockholder who requests it. We do not intend for information found on the Company’s web site to be part of thisdocument.
Item 1A. Risk Factors
We wish to caution you that there are risks and uncertainties that could affect our business. These risks and uncertaintiesinclude, but are not limited to, the risks described below and elsewhere in this report, particularly in “Forward-LookingStatements.” The following is not intended to be a complete discussion of all potential risks or uncertainties, as it is notpossible to predict or identify all risk factors.
Competitive Industry Conditions We face intense competition from traditional grocery retailers, non-traditionalcompetitors such as “supercenters” and “club stores,” as well as from specialty supermarkets, drug stores, dollar stores,convenience stores and restaurants. Some of our competitors are larger than we are, have greater financial resourcesavailable to them and, as a result, may be able to devote greater resources to sourcing, promoting and selling their products.Increased competition may have an adverse effect on profitability as the result of lower sales, lower gross profits and/orgreater operating costs such as marketing.
Our ability to attract customers is dependent, in large part, upon a combination of price, quality, product mix, brandrecognition, store location, in-store marketing and design, promotional strategies and continued growth into new markets.In each of these areas, traditional and non-traditional competitors compete with us and may successfully attract ourcustomers to their stores by aggressively matching or exceeding what we offer. In recent years, many of our competitorshave increased their presence in our markets. Our responses to competitive pressure, such as additional promotions andincreased advertising, could adversely affect our profitability. Also, we cannot assure that our actions will succeed in gainingor maintaining market share. Additionally, we cannot predict how our customers will react to the entrance of certain of ournon-traditional competitors into the grocery retailing business.
Because we face intense competition, we must anticipate and quickly respond to changing consumer demands moreeffectively than our competitors. In April 2005, we launched a $100 million marketing campaign to reposition our brand. Forthis campaign to be successful, we must achieve and maintain favorable recognition of our unique and exclusive private-labelbrands, effectively market our products to consumers in several diverse market segments, competitively price our productsand maintain and enhance a perception of value for consumers. Finally, we must source and market our merchandiseefficiently and creatively. Failure to accomplish these objectives could impair our ability to compete successfully and adverselyaffect our growth and profitability.
Labor Relations A significant majority of our employees are unionized, and our relationship with unions, including workstoppages, could have an adverse impact on our financial results.
We are a party to approximately 400 collective bargaining agreements, of which 35 are scheduled to expire in 2006. Theseexpiring agreements cover approximately 4% of our union-affiliated employees. In future negotiations with labor unions, weexpect that rising health care, pension and employee benefit costs, among other issues, will be important topics fornegotiation. If, upon the expiration of such collective bargaining agreements, we are unable to negotiate acceptablecontracts with labor unions, it could result in strikes by the affected workers and thereby significantly disrupt our operations.Further, if we are unable to control health care and pension costs provided for in the collective bargaining agreements, wemay experience increased operating costs and an adverse impact on future results of operations.
Profit Margins Profit margins in the grocery retail industry are very narrow. In order to increase or maintain our profitmargins, we develop strategies to reduce costs, such as productivity improvements, shrink reduction, distribution centerefficiencies and other similar strategies. Our failure to achieve forecasted cost reductions might have a material adverseeffect on our business. Changes in our product mix also may negatively affect certain financial measures. For example, wecontinue to add supermarket fuel centers, which generate low profit margins but significant sales. As a result, we expect tosee our gross profit margins decrease as fuel sales increase. Although this negatively affects our gross profit margin, fuelsales provide a positive effect on operating and administrative expense as a percent of sales.
SAFEWAY INC. AND SUBSIDIARIES
10
Opening and Remodeling of Stores Our inability to open and remodel stores as planned could have a material adverseeffect on our results. Our business plans include the opening and remodeling of a significant number of stores. In 2006, weanticipate opening approximately 20 to 25 Lifestyle stores while completing approximately 280 Lifestyle remodels. If, as aresult of labor relations issues, supply issues, environmental and real estate delays, these capital projects do not stay withinthe time and financial budgets that we have forecast, our future financial performance could be materially adverselyaffected. Further, we cannot ensure that the new or remodeled stores will achieve anticipated same-store sales or profitlevels.
Food Safety, Quality and Health Concerns We could be adversely affected if consumers lose confidence in the safetyand quality of certain food products. Adverse publicity about these types of concerns, whether or not valid, may discourageconsumers from buying our products or cause production and delivery disruptions. The real or perceived sale ofcontaminated food products by us could result in product liability claims and a loss of consumer confidence, which couldhave a material adverse effect on our sales and operations.
Economic Conditions that Impact Consumer Spending Our results of operations are sensitive to changes in overalleconomic conditions that impact consumer spending, including discretionary spending. Future economic conditions such asemployment levels, business conditions, interest rates, energy costs and tax rates could reduce consumer spending or changeconsumer purchasing habits. A general reduction in the level of consumer spending or our inability to respond to shiftingconsumer attitudes regarding products, store location and other factors could adversely affect our growth and profitability.
Unfavorable Changes in Government Regulation Our stores are subject to various federal, state, local and foreign laws,regulations and administrative practices affecting our business. We must comply with numerous provisions regulating healthand sanitation standards, food labeling, equal employment opportunity, minimum wages and licensing for the sale of food,drugs and alcoholic beverages. We cannot predict the nature of future laws, regulations, interpretations or applications, ordetermine what effect either additional government regulations or administrative orders, when and if promulgated, ordisparate federal, state, local and foreign regulatory schemes would have on our future business. They could, however,require the reformulation of certain products to meet new standards, the recall or discontinuance of certain products notable to be reformulated, additional record keeping, expanded documentation of the properties of certain products, expandedor different labeling and/or scientific substantiation. Any or all of such requirements could have an adverse effect on ourresults of operations and financial condition.
Substantial Indebtedness We currently have, and expect to continue to have, a significant amount of debt, which couldadversely affect our financial health. As of December 31, 2005, we had approximately $6.4 billion in total consolidated debtoutstanding. This substantial indebtedness could increase our vulnerability to general adverse economic and industryconditions. If debt markets do not permit us to refinance certain maturing debt, we may be required to: dedicate asubstantial portion of our cash flow from operations to payments on our indebtedness, thereby reducing the availability ofour cash flow to fund working capital, capital expenditures, acquisitions, development efforts and other general corporatepurposes; limit our flexibility in planning for, or reacting to, changes in our business; place ourselves at a competitivedisadvantage relative to our competitors that have less debt; and limit, along with the financial and other restrictivecovenants in the documents governing our indebtedness, among other things, our ability to borrow additional funds.Changes in our credit ratings may have an adverse impact on our financing costs and structure in future periods, such as theability to participate in the commercial paper market and higher interest costs on future financings. Additionally, interestexpense could be materially and adversely affected by changes in the interest rate environment, changes in our credit rating,fluctuations in the amount of outstanding debt, decisions to incur premiums on the early redemption of debt and any otherfactor that results in an increase in debt.
Retirement Plans We maintain defined benefit retirement plans for substantially all employees not participating in multi-employer pension plans. Expenses from defined benefit pension plans may be significantly affected by changes in the actualreturn on plan assets and actuarial assumptions.
In addition, we participate in various multi-employer pension plans for substantially all employees represented by unions. Weare required to make contributions to these plans in amounts established under collective bargaining agreements. Pensionexpense for these plans is recognized as contributions are funded. Benefits generally are based on a fixed amount for each
SAFEWAY INC. AND SUBSIDIARIES
11
year of service. We contributed $234.5 million, $196.8 million and $172.1 million to these funds in 2005, 2004 and 2003,respectively. Based on the most recent information available to us, we believe a number of these multi-employer plans areunderfunded. As a result, we expect that contributions to these plans may continue to increase, although at a slower ratethan in recent years. Additionally, the benefit levels and related issues will continue to create collective bargainingchallenges. Most recently completed labor negotiations resulted in a reduction of pension liabilities (and, therefore, areduction of projected contribution increases). Under current law, an employer that withdraws or partially withdraws from amulti-employer pension plan may incur withdrawal liability to the plan, which represents the portion of the plan’sunderfunding that is allocable to the withdrawing employer under very complex actuarial and allocation rules. The amountof any increase or decrease in our required contributions to these multi-employer pension plans will depend upon theoutcome of collective bargaining, actions taken by trustees who manage the plans, government regulations, the actualreturn on assets held in the plans, and the potential payment of a withdrawal liability if we choose to exit a market, amongother factors.
Legal Proceedings From time to time, we are a party to legal proceedings, including matters involving personnel andemployment issues, personal injury, antitrust claims and other proceedings arising in the ordinary course of business. Inaddition, there is an increasing number of cases being filed against companies generally, which contain class-actionallegations under federal and state wage and hour laws. We estimate our exposure to these legal proceedings and establishreserves for the estimated liabilities. Assessing and predicting the outcome of these matters involves substantialuncertainties. Although not currently anticipated by management, unexpected outcomes in these legal proceedings, orchanges in management’s evaluations or predictions, could have a material adverse impact on our financial results.
Insurance Plan Claims We use a combination of insurance and self-insurance to provide for potential liabilities for workers’compensation, automobile and general liability, property insurance, director and officers’ liability insurance, and employeehealth care benefits. We estimate the liabilities associated with the risks that are retained by us, in part, by consideringhistorical claims experience, demographic and severity factors and other actuarial assumptions which, by their nature, aresubject to a high degree of variability. Any actuarial projection of losses concerning workers’ compensation and generalliability is subject to a high degree of variability. Among the causes of this variability are unpredictable external factorsaffecting future inflation rates, discount rates, litigation trends, legal interpretations, benefit level changes and claimsettlement patterns.
The majority of the Company’s workers’ compensation liability is from claims occurring in California. California workers’compensation has received intense scrutiny from the state’s politicians, insurers, employers and providers, as well as thepublic in general. Recent years have seen escalation in the number of legislative reforms, judicial rulings and socialphenomena affecting this business. Some of the many sources of uncertainty in the Company’s reserve estimates includechanges in benefit levels, medical fee schedules, medical utilization guidelines, vocation rehabilitation and apportionment.
Goodwill/Impairment of Long-Lived Assets We have $2.4 billion of goodwill on our balance sheet that is subject toperiodic testing for impairment. Our long-lived assets, primarily stores, also are subject to periodic testing for impairment.Failure to achieve sufficient levels of cash flow at specific divisions or specific stores could result in impairment charges ongoodwill and/or long-lived assets. We have incurred significant impairment charges to earnings in the past for goodwill andfor long-lived assets.
Information Technology Risks The Company has large, complex information technology systems that are important tobusiness operations. The Company could encounter difficulties developing new systems or maintaining and upgradingexisting systems. Such difficulties could lead to significant expenses or to losses due to disruption in business operations.
Despite the Company’s considerable efforts and technology to secure our computer network, security could becompromised, confidential information could be misappropriated, or system disruptions could occur. This could lead to lossof sales or profits or cause the Company to incur significant costs to reimburse third parties for damages.
Item 1B. Unresolved Staff Comments
None.
SAFEWAY INC. AND SUBSIDIARIES
12
Item 2. Properties
The information required by this item is set forth in Part I, Item 1 of this report.
Item 3. Legal Proceedings
Information about legal proceedings appears under the captions “Legal Matters” and “Furr’s and Homeland Lease Liabilities”as reported in Note K to the consolidated financial statements set forth in Part II, Item 8 of this report.
Item 4. Submission of Matters to a Vote of Security Holders
No matters were submitted to a vote of the stockholders during the fourth quarter of fiscal 2005.
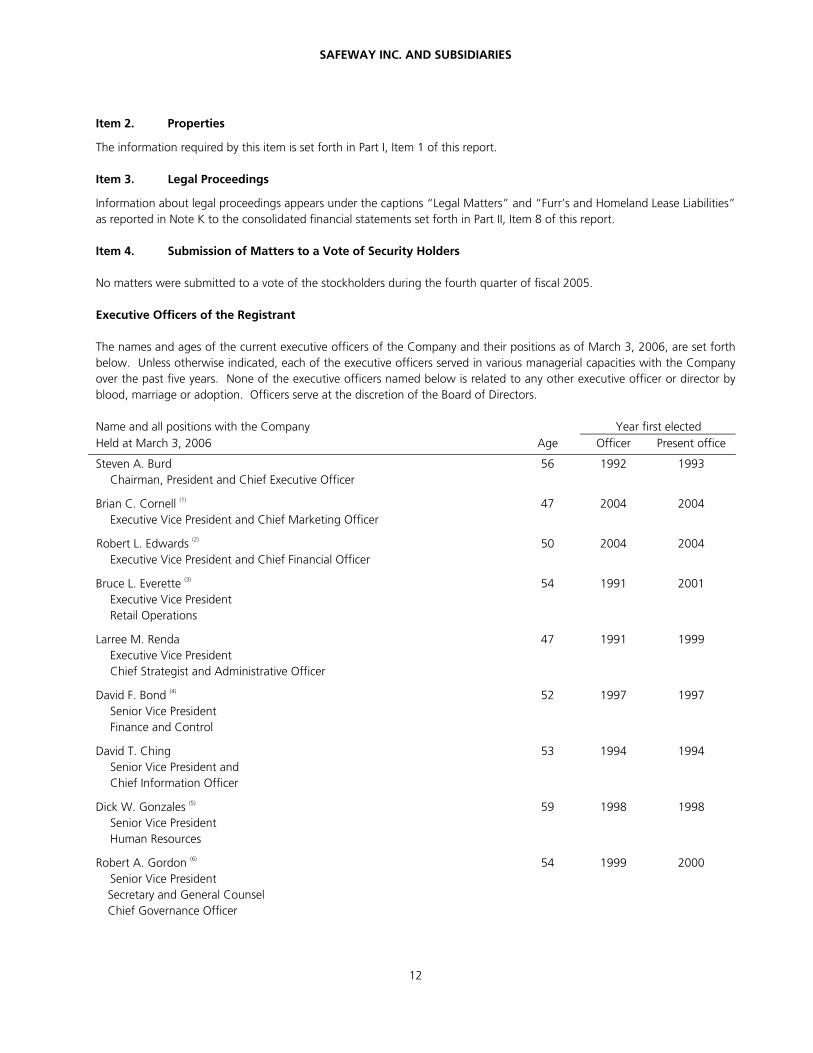
Executive Officers of the Registrant
The names and ages of the current executive officers of the Company and their positions as of March 3, 2006, are set forthbelow. Unless otherwise indicated, each of the executive officers served in various managerial capacities with the Companyover the past five years. None of the executive officers named below is related to any other executive officer or director byblood, marriage or adoption. Officers serve at the discretion of the Board of Directors.
Name and all positions with the Company Year first electedHeld at March 3, 2006 Age Officer Present office
Steven A. BurdChairman, President and Chief Executive Officer
56 1992 1993
Brian C. Cornell (1)
Executive Vice President and Chief Marketing Officer47 2004 2004
Robert L. Edwards (2)
Executive Vice President and Chief Financial Officer50 2004 2004
Bruce L. Everette (3)
Executive Vice PresidentRetail Operations
54 1991 2001
Larree M. RendaExecutive Vice PresidentChief Strategist and Administrative Officer
47 1991 1999
David F. Bond (4)
Senior Vice PresidentFinance and Control
52 1997 1997
David T. ChingSenior Vice President andChief Information Officer
53 1994 1994
Dick W. Gonzales (5)
Senior Vice PresidentHuman Resources
59 1998 1998
Robert A. Gordon (6)
Senior Vice PresidentSecretary and General CounselChief Governance Officer
54 1999 2000
SAFEWAY INC. AND SUBSIDIARIES
13
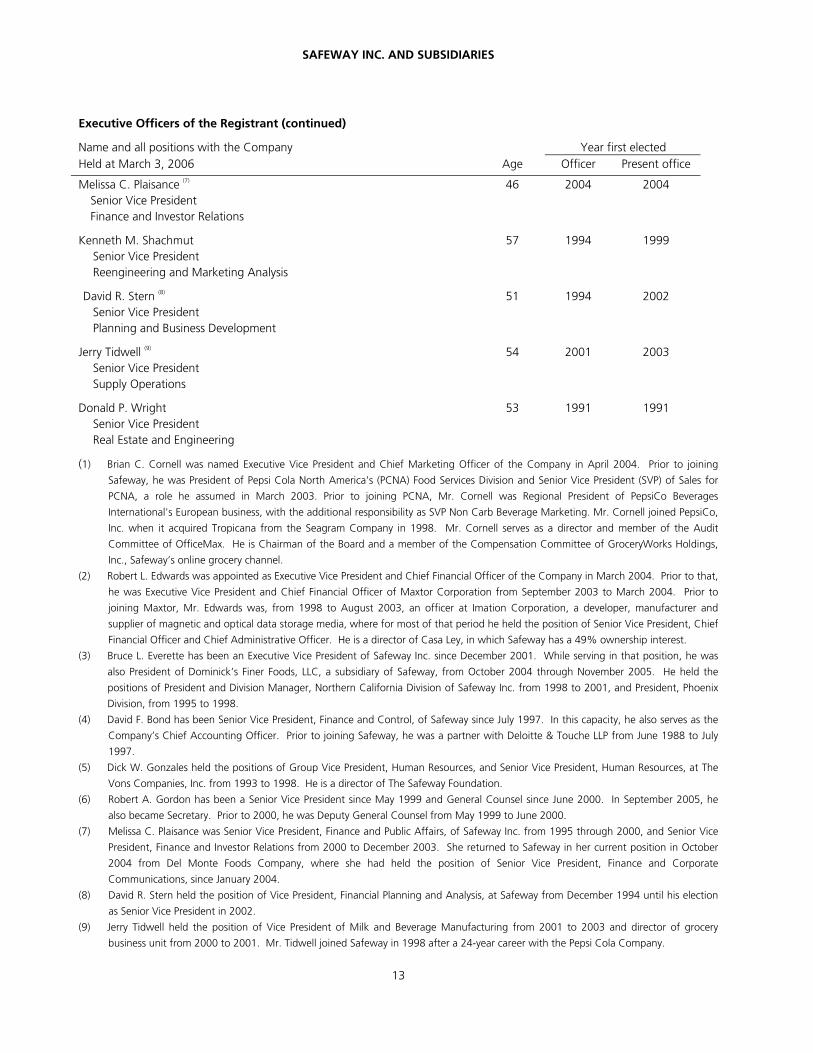
Executive Officers of the Registrant (continued)
Name and all positions with the Company Year first electedHeld at March 3, 2006 Age Officer Present office
Melissa C. Plaisance (7)
Senior Vice PresidentFinance and Investor Relations
46 2004 2004
Kenneth M. ShachmutSenior Vice PresidentReengineering and Marketing Analysis
57 1994 1999
David R. Stern (8)
Senior Vice PresidentPlanning and Business Development
51 1994 2002
Jerry Tidwell (9)
Senior Vice PresidentSupply Operations
54 2001 2003
Donald P. WrightSenior Vice PresidentReal Estate and Engineering
53 1991 1991
(1) Brian C. Cornell was named Executive Vice President and Chief Marketing Officer of the Company in April 2004. Prior to joining
Safeway, he was President of Pepsi Cola North America's (PCNA) Food Services Division and Senior Vice President (SVP) of Sales for
PCNA, a role he assumed in March 2003. Prior to joining PCNA, Mr. Cornell was Regional President of PepsiCo Beverages
International's European business, with the additional responsibility as SVP Non Carb Beverage Marketing. Mr. Cornell joined PepsiCo,
Inc. when it acquired Tropicana from the Seagram Company in 1998. Mr. Cornell serves as a director and member of the Audit
Committee of OfficeMax. He is Chairman of the Board and a member of the Compensation Committee of GroceryWorks Holdings,
Inc., Safeway’s online grocery channel.
(2) Robert L. Edwards was appointed as Executive Vice President and Chief Financial Officer of the Company in March 2004. Prior to that,
he was Executive Vice President and Chief Financial Officer of Maxtor Corporation from September 2003 to March 2004. Prior to
joining Maxtor, Mr. Edwards was, from 1998 to August 2003, an officer at Imation Corporation, a developer, manufacturer and
supplier of magnetic and optical data storage media, where for most of that period he held the position of Senior Vice President, Chief
Financial Officer and Chief Administrative Officer. He is a director of Casa Ley, in which Safeway has a 49% ownership interest.
(3) Bruce L. Everette has been an Executive Vice President of Safeway Inc. since December 2001. While serving in that position, he was
also President of Dominick’s Finer Foods, LLC, a subsidiary of Safeway, from October 2004 through November 2005. He held the
positions of President and Division Manager, Northern California Division of Safeway Inc. from 1998 to 2001, and President, Phoenix
Division, from 1995 to 1998.
(4) David F. Bond has been Senior Vice President, Finance and Control, of Safeway since July 1997. In this capacity, he also serves as the
Company’s Chief Accounting Officer. Prior to joining Safeway, he was a partner with Deloitte & Touche LLP from June 1988 to July
1997.
(5) Dick W. Gonzales held the positions of Group Vice President, Human Resources, and Senior Vice President, Human Resources, at The
Vons Companies, Inc. from 1993 to 1998. He is a director of The Safeway Foundation.
(6) Robert A. Gordon has been a Senior Vice President since May 1999 and General Counsel since June 2000. In September 2005, he
also became Secretary. Prior to 2000, he was Deputy General Counsel from May 1999 to June 2000.
(7) Melissa C. Plaisance was Senior Vice President, Finance and Public Affairs, of Safeway Inc. from 1995 through 2000, and Senior Vice
President, Finance and Investor Relations from 2000 to December 2003. She returned to Safeway in her current position in October
2004 from Del Monte Foods Company, where she had held the position of Senior Vice President, Finance and Corporate
Communications, since January 2004.
(8) David R. Stern held the position of Vice President, Financial Planning and Analysis, at Safeway from December 1994 until his election
as Senior Vice President in 2002.
(9) Jerry Tidwell held the position of Vice President of Milk and Beverage Manufacturing from 2001 to 2003 and director of grocery
business unit from 2000 to 2001. Mr. Tidwell joined Safeway in 1998 after a 24-year career with the Pepsi Cola Company.
SAFEWAY INC. AND SUBSIDIARIES
14
PART II
Item 5. Market for Registrant's Common Equity, Related Stockholder Matters and Issuer Purchases of EquitySecurities
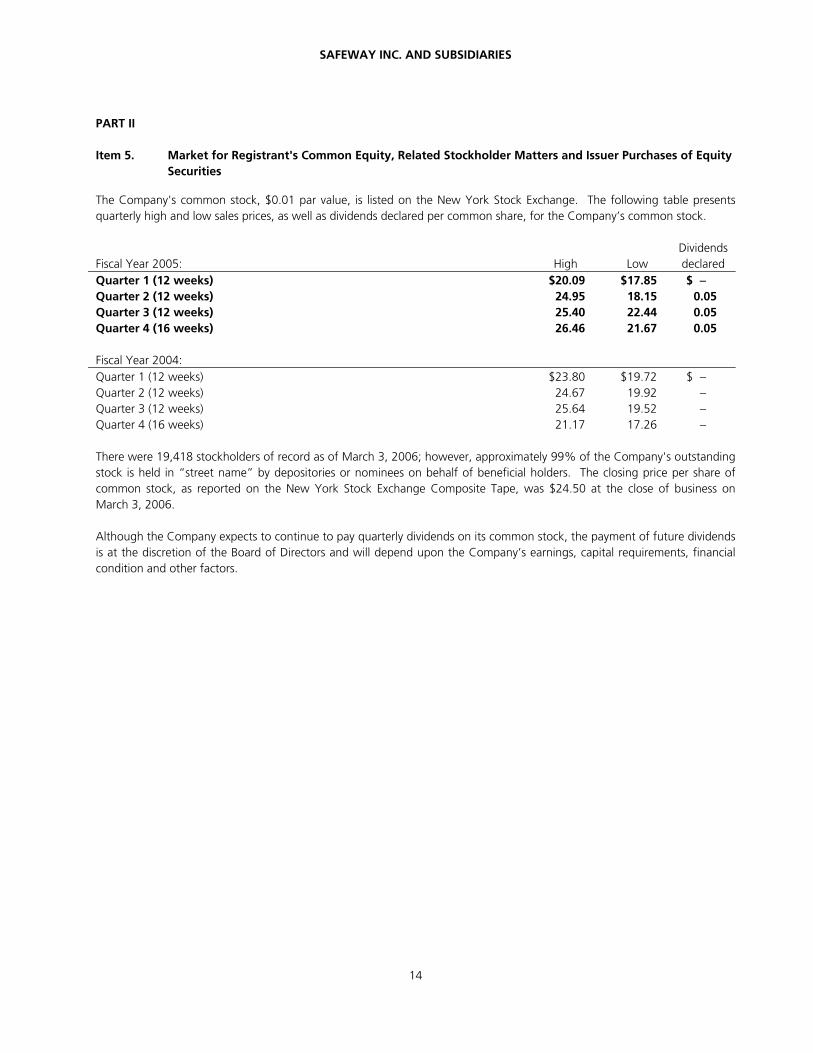
The Company's common stock, $0.01 par value, is listed on the New York Stock Exchange. The following table presentsquarterly high and low sales prices, as well as dividends declared per common share, for the Company’s common stock.
Fiscal Year 2005: High LowDividendsdeclared
Quarter 1 (12 weeks) $20.09 $17.85 $ −Quarter 2 (12 weeks) 24.95 18.15 0.05Quarter 3 (12 weeks) 25.40 22.44 0.05Quarter 4 (16 weeks) 26.46 21.67 0.05
Fiscal Year 2004:Quarter 1 (12 weeks) $23.80 $19.72 $ −Quarter 2 (12 weeks) 24.67 19.92 −Quarter 3 (12 weeks) 25.64 19.52 −Quarter 4 (16 weeks) 21.17 17.26 −
There were 19,418 stockholders of record as of March 3, 2006; however, approximately 99% of the Company's outstandingstock is held in “street name” by depositories or nominees on behalf of beneficial holders. The closing price per share ofcommon stock, as reported on the New York Stock Exchange Composite Tape, was $24.50 at the close of business onMarch 3, 2006.
Although the Company expects to continue to pay quarterly dividends on its common stock, the payment of future dividendsis at the discretion of the Board of Directors and will depend upon the Company’s earnings, capital requirements, financialcondition and other factors.
SAFEWAY INC. AND SUBSIDIARIES
15
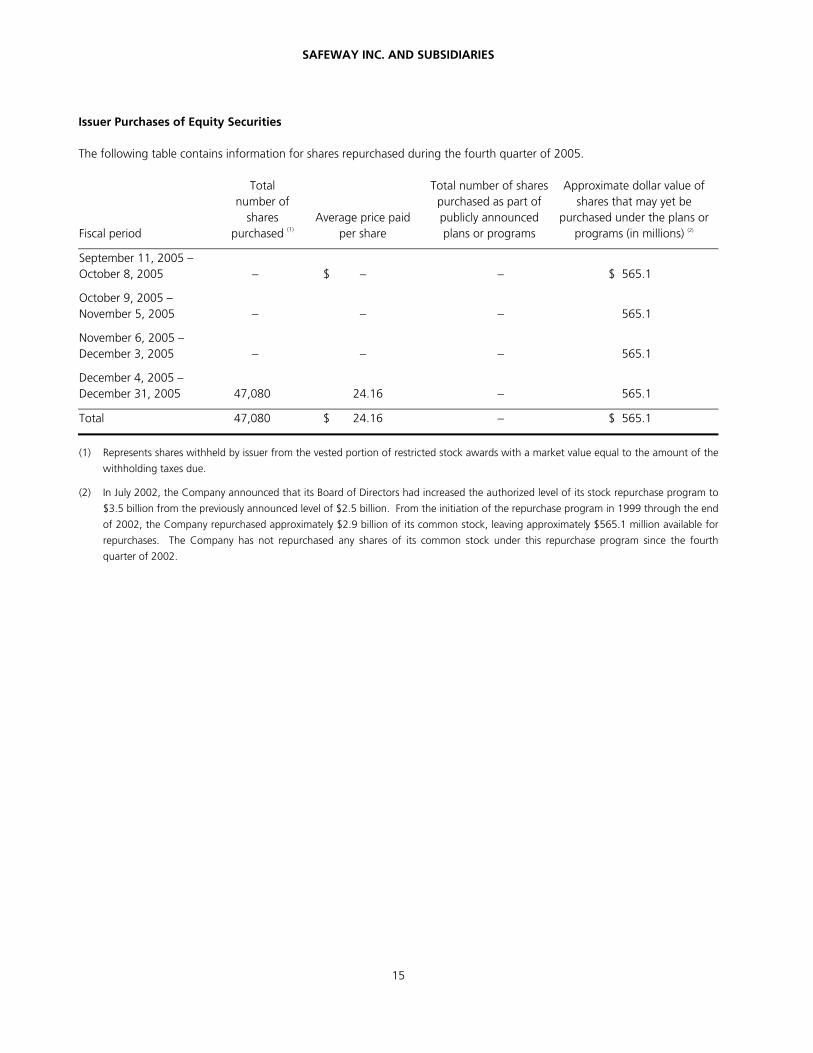
Issuer Purchases of Equity Securities
The following table contains information for shares repurchased during the fourth quarter of 2005.
Fiscal period
Totalnumber of
sharespurchased (1)
Average price paidper share
Total number of sharespurchased as part ofpublicly announcedplans or programs
Approximate dollar value ofshares that may yet be
purchased under the plans orprograms (in millions) (2)
September 11, 2005 –October 8, 2005 − $ − − $ 565.1
October 9, 2005 –November 5, 2005 − − − 565.1
November 6, 2005 –December 3, 2005 − − − 565.1
December 4, 2005 –December 31, 2005 47,080 24.16 − 565.1
Total 47,080 $ 24.16 − $ 565.1
(1) Represents shares withheld by issuer from the vested portion of restricted stock awards with a market value equal to the amount of the
withholding taxes due.
(2) In July 2002, the Company announced that its Board of Directors had increased the authorized level of its stock repurchase program to
$3.5 billion from the previously announced level of $2.5 billion. From the initiation of the repurchase program in 1999 through the end
of 2002, the Company repurchased approximately $2.9 billion of its common stock, leaving approximately $565.1 million available for
repurchases. The Company has not repurchased any shares of its common stock under this repurchase program since the fourth
quarter of 2002.
SAFEWAY INC. AND SUBSIDIARIES
16
Item 6. Selected Financial Data
(Dollars in millions, except per-
share amounts)
52 Weeks 2005(1)
52 Weeks 2004
53 Weeks 2003
52 Weeks 2002
52 Weeks 2001
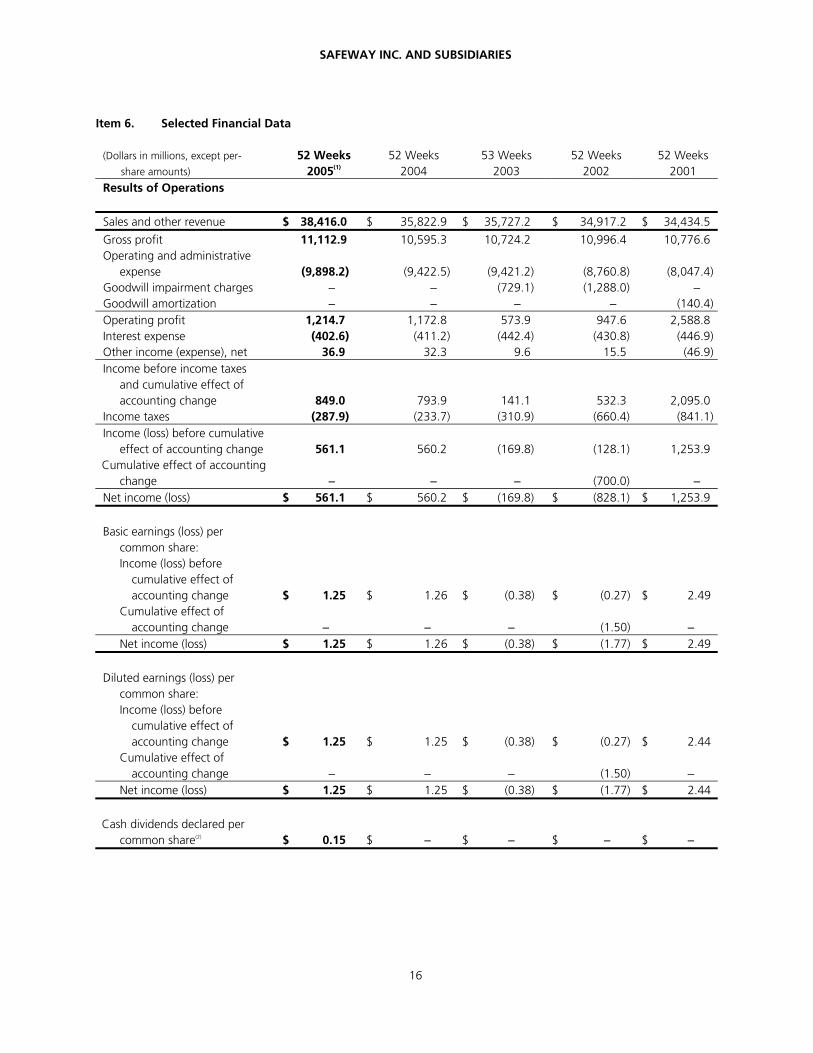
Results of Operations
Sales and other revenue $ 38,416.0 $ 35,822.9 $ 35,727.2 $ 34,917.2 $ 34,434.5
Gross profit 11,112.9 10,595.3 10,724.2 10,996.4 10,776.6Operating and administrative
expense (9,898.2) (9,422.5) (9,421.2) (8,760.8) (8,047.4)Goodwill impairment charges − − (729.1) (1,288.0) −Goodwill amortization − − − − (140.4)Operating profit 1,214.7 1,172.8 573.9 947.6 2,588.8Interest expense (402.6) (411.2) (442.4) (430.8) (446.9)Other income (expense), net 36.9 32.3 9.6 15.5 (46.9)Income before income taxes
and cumulative effect ofaccounting change 849.0 793.9 141.1 532.3 2,095.0
Income taxes (287.9) (233.7) (310.9) (660.4) (841.1)Income (loss) before cumulative
effect of accounting change 561.1 560.2 (169.8) (128.1) 1,253.9Cumulative effect of accounting
change − − − (700.0) −Net income (loss) $ 561.1 $ 560.2 $ (169.8) $ (828.1) $ 1,253.9
Basic earnings (loss) percommon share:Income (loss) before
cumulative effect ofaccounting change $ 1.25 $ 1.26 $ (0.38) $ (0.27) $ 2.49
Cumulative effect ofaccounting change − − − (1.50) −
Net income (loss) $ 1.25 $ 1.26 $ (0.38) $ (1.77) $ 2.49
Diluted earnings (loss) percommon share:Income (loss) before
cumulative effect ofaccounting change $ 1.25 $ 1.25 $ (0.38) $ (0.27) $ 2.44
Cumulative effect ofaccounting change − − − (1.50) −
Net income (loss) $ 1.25 $ 1.25 $ (0.38) $ (1.77) $ 2.44
Cash dividends declared percommon share(2) $ 0.15 $ − $ − $ − $ −
SAFEWAY INC. AND SUBSIDIARIES
17
Item 6. Selected Financial Data (continued)
(Dollars in millions, except per-share amounts)
52 Weeks 2005 (1)
52 Weeks 2004
53 Weeks 2003
52 Weeks 2002
52 Weeks 2001
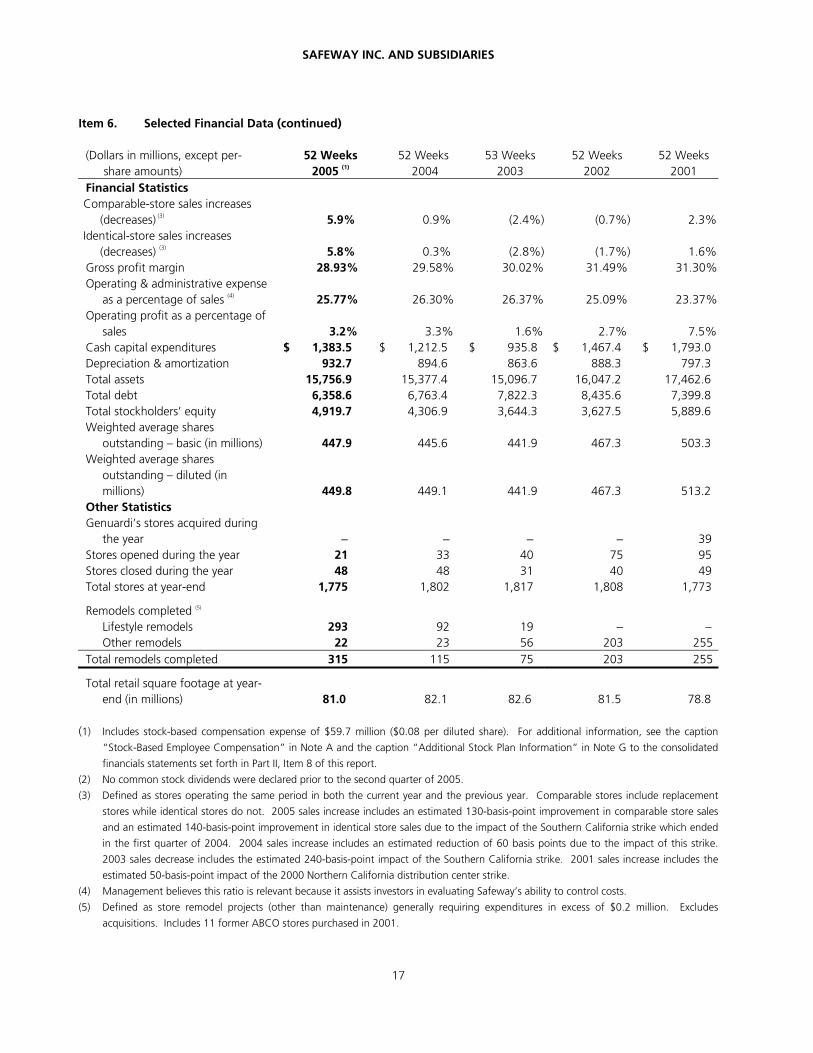
Financial StatisticsComparable-store sales increases
(decreases) (3) 5.9% 0.9% (2.4%) (0.7%) 2.3%Identical-store sales increases
(decreases) (3) 5.8% 0.3% (2.8%) (1.7%) 1.6%Gross profit margin 28.93% 29.58% 30.02% 31.49% 31.30%Operating & administrative expense
as a percentage of sales (4) 25.77% 26.30% 26.37% 25.09% 23.37%Operating profit as a percentage of
sales 3.2% 3.3% 1.6% 2.7% 7.5%Cash capital expenditures $ 1,383.5 $ 1,212.5 $ 935.8 $ 1,467.4 $ 1,793.0Depreciation & amortization 932.7 894.6 863.6 888.3 797.3Total assets 15,756.9 15,377.4 15,096.7 16,047.2 17,462.6Total debt 6,358.6 6,763.4 7,822.3 8,435.6 7,399.8Total stockholders’ equity 4,919.7 4,306.9 3,644.3 3,627.5 5,889.6Weighted average shares
outstanding – basic (in millions) 447.9 445.6 441.9 467.3 503.3Weighted average shares
outstanding – diluted (inmillions) 449.8 449.1 441.9 467.3 513.2
Other StatisticsGenuardi’s stores acquired during
the year − − − − 39Stores opened during the year 21 33 40 75 95Stores closed during the year 48 48 31 40 49Total stores at year-end 1,775 1,802 1,817 1,808 1,773
Remodels completed (5)
Lifestyle remodels 293 92 19 − −Other remodels 22 23 56 203 255
Total remodels completed 315 115 75 203 255
Total retail square footage at year-end (in millions) 81.0 82.1 82.6 81.5 78.8
(1) Includes stock-based compensation expense of $59.7 million ($0.08 per diluted share). For additional information, see the caption
“Stock-Based Employee Compensation” in Note A and the caption “Additional Stock Plan Information” in Note G to the consolidated
financials statements set forth in Part II, Item 8 of this report.
(2) No common stock dividends were declared prior to the second quarter of 2005.
(3) Defined as stores operating the same period in both the current year and the previous year. Comparable stores include replacement
stores while identical stores do not. 2005 sales increase includes an estimated 130-basis-point improvement in comparable store sales
and an estimated 140-basis-point improvement in identical store sales due to the impact of the Southern California strike which ended
in the first quarter of 2004. 2004 sales increase includes an estimated reduction of 60 basis points due to the impact of this strike.
2003 sales decrease includes the estimated 240-basis-point impact of the Southern California strike. 2001 sales increase includes the
estimated 50-basis-point impact of the 2000 Northern California distribution center strike.
(4) Management believes this ratio is relevant because it assists investors in evaluating Safeway’s ability to control costs.
(5) Defined as store remodel projects (other than maintenance) generally requiring expenditures in excess of $0.2 million. Excludes
acquisitions. Includes 11 former ABCO stores purchased in 2001.
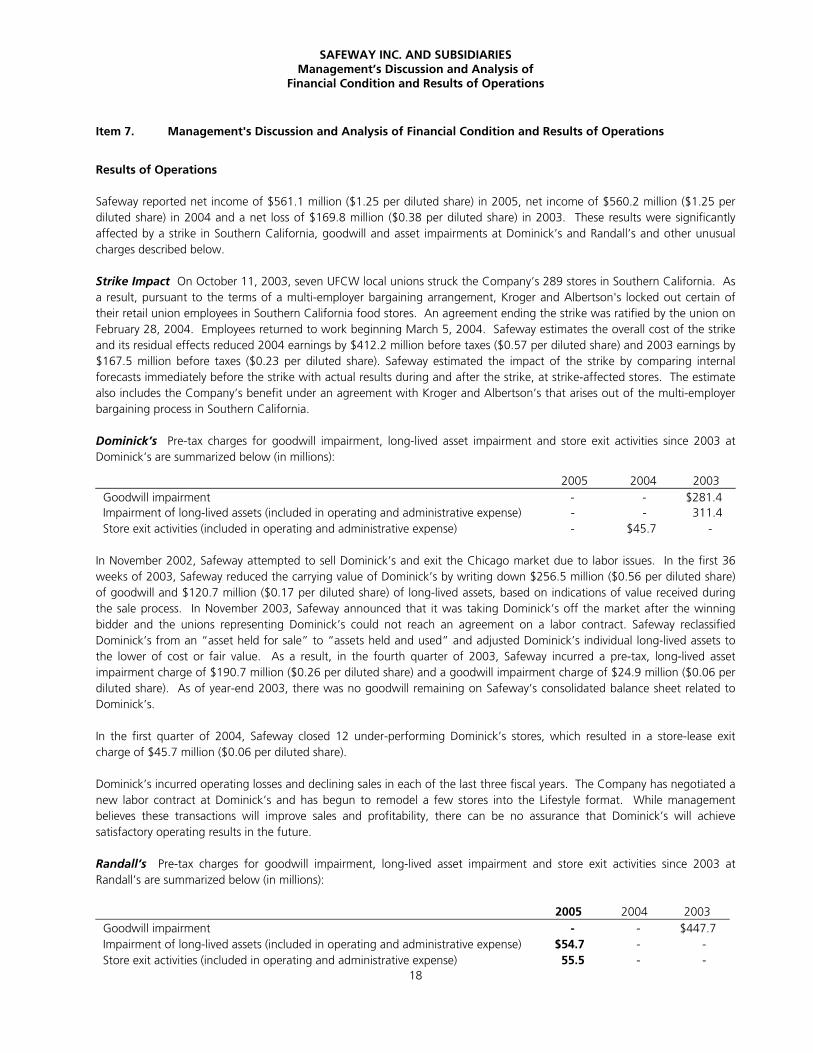
SAFEWAY INC. AND SUBSIDIARIESManagement’s Discussion and Analysis of
Financial Condition and Results of Operations
18
Item 7. Management's Discussion and Analysis of Financial Condition and Results of Operations
Results of Operations
Safeway reported net income of $561.1 million ($1.25 per diluted share) in 2005, net income of $560.2 million ($1.25 perdiluted share) in 2004 and a net loss of $169.8 million ($0.38 per diluted share) in 2003. These results were significantlyaffected by a strike in Southern California, goodwill and asset impairments at Dominick’s and Randall’s and other unusualcharges described below.
Strike Impact On October 11, 2003, seven UFCW local unions struck the Company’s 289 stores in Southern California. Asa result, pursuant to the terms of a multi-employer bargaining arrangement, Kroger and Albertson's locked out certain oftheir retail union employees in Southern California food stores. An agreement ending the strike was ratified by the union onFebruary 28, 2004. Employees returned to work beginning March 5, 2004. Safeway estimates the overall cost of the strikeand its residual effects reduced 2004 earnings by $412.2 million before taxes ($0.57 per diluted share) and 2003 earnings by$167.5 million before taxes ($0.23 per diluted share). Safeway estimated the impact of the strike by comparing internalforecasts immediately before the strike with actual results during and after the strike, at strike-affected stores. The estimatealso includes the Company’s benefit under an agreement with Kroger and Albertson’s that arises out of the multi-employerbargaining process in Southern California.
Dominick’s Pre-tax charges for goodwill impairment, long-lived asset impairment and store exit activities since 2003 atDominick’s are summarized below (in millions):
2005 2004 2003Goodwill impairment - - $281.4Impairment of long-lived assets (included in operating and administrative expense) - - 311.4Store exit activities (included in operating and administrative expense) - $45.7 -
In November 2002, Safeway attempted to sell Dominick’s and exit the Chicago market due to labor issues. In the first 36weeks of 2003, Safeway reduced the carrying value of Dominick’s by writing down $256.5 million ($0.56 per diluted share)of goodwill and $120.7 million ($0.17 per diluted share) of long-lived assets, based on indications of value received duringthe sale process. In November 2003, Safeway announced that it was taking Dominick’s off the market after the winningbidder and the unions representing Dominick’s could not reach an agreement on a labor contract. Safeway reclassifiedDominick’s from an “asset held for sale” to “assets held and used” and adjusted Dominick’s individual long-lived assets tothe lower of cost or fair value. As a result, in the fourth quarter of 2003, Safeway incurred a pre-tax, long-lived assetimpairment charge of $190.7 million ($0.26 per diluted share) and a goodwill impairment charge of $24.9 million ($0.06 perdiluted share). As of year-end 2003, there was no goodwill remaining on Safeway’s consolidated balance sheet related toDominick’s.
In the first quarter of 2004, Safeway closed 12 under-performing Dominick’s stores, which resulted in a store-lease exitcharge of $45.7 million ($0.06 per diluted share).
Dominick’s incurred operating losses and declining sales in each of the last three fiscal years. The Company has negotiated anew labor contract at Dominick’s and has begun to remodel a few stores into the Lifestyle format. While managementbelieves these transactions will improve sales and profitability, there can be no assurance that Dominick’s will achievesatisfactory operating results in the future.
Randall’s Pre-tax charges for goodwill impairment, long-lived asset impairment and store exit activities since 2003 atRandall’s are summarized below (in millions):
2005 2004 2003Goodwill impairment - - $447.7Impairment of long-lived assets (included in operating and administrative expense) $54.7 - -Store exit activities (included in operating and administrative expense) 55.5 - -
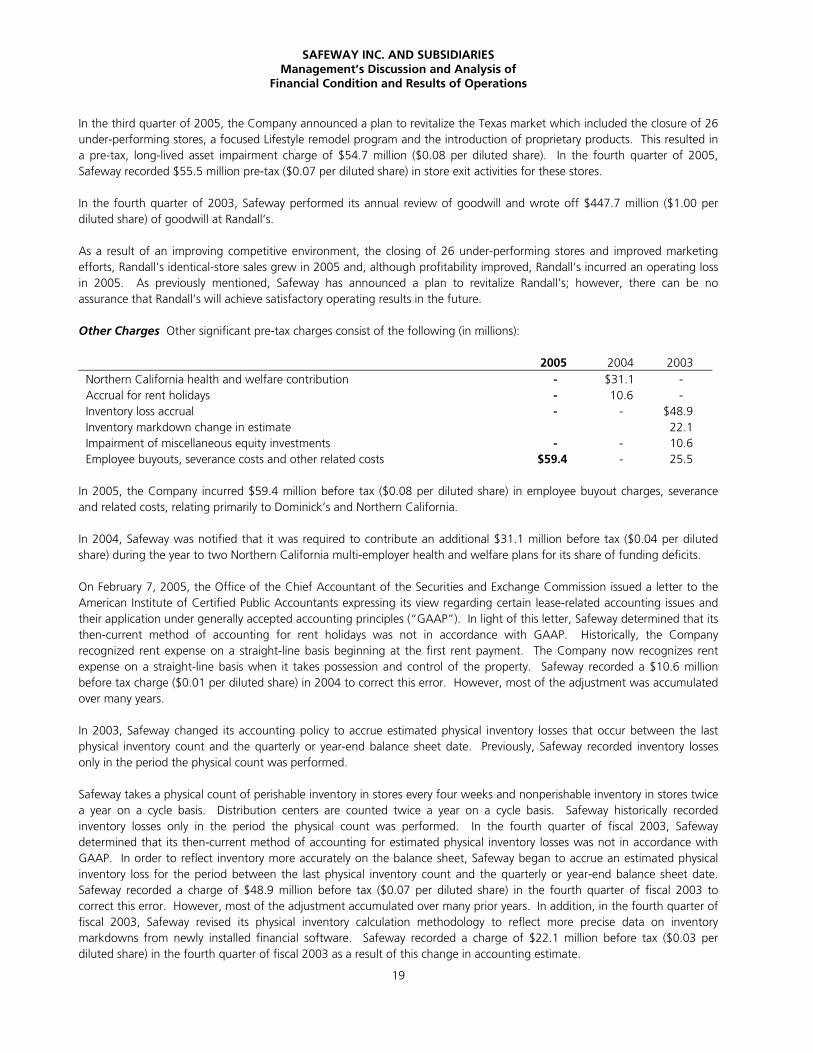
SAFEWAY INC. AND SUBSIDIARIESManagement’s Discussion and Analysis of
Financial Condition and Results of Operations
19
In the third quarter of 2005, the Company announced a plan to revitalize the Texas market which included the closure of 26under-performing stores, a focused Lifestyle remodel program and the introduction of proprietary products. This resulted ina pre-tax, long-lived asset impairment charge of $54.7 million ($0.08 per diluted share). In the fourth quarter of 2005,Safeway recorded $55.5 million pre-tax ($0.07 per diluted share) in store exit activities for these stores.
In the fourth quarter of 2003, Safeway performed its annual review of goodwill and wrote off $447.7 million ($1.00 perdiluted share) of goodwill at Randall’s.
As a result of an improving competitive environment, the closing of 26 under-performing stores and improved marketingefforts, Randall’s identical-store sales grew in 2005 and, although profitability improved, Randall’s incurred an operating lossin 2005. As previously mentioned, Safeway has announced a plan to revitalize Randall’s; however, there can be noassurance that Randall’s will achieve satisfactory operating results in the future.
Other Charges Other significant pre-tax charges consist of the following (in millions):
2005 2004 2003Northern California health and welfare contribution - $31.1 -Accrual for rent holidays - 10.6 -Inventory loss accrual - - $48.9Inventory markdown change in estimate 22.1Impairment of miscellaneous equity investments - - 10.6Employee buyouts, severance costs and other related costs $59.4 - 25.5
In 2005, the Company incurred $59.4 million before tax ($0.08 per diluted share) in employee buyout charges, severanceand related costs, relating primarily to Dominick’s and Northern California.
In 2004, Safeway was notified that it was required to contribute an additional $31.1 million before tax ($0.04 per dilutedshare) during the year to two Northern California multi-employer health and welfare plans for its share of funding deficits.
On February 7, 2005, the Office of the Chief Accountant of the Securities and Exchange Commission issued a letter to theAmerican Institute of Certified Public Accountants expressing its view regarding certain lease-related accounting issues andtheir application under generally accepted accounting principles (“GAAP”). In light of this letter, Safeway determined that itsthen-current method of accounting for rent holidays was not in accordance with GAAP. Historically, the Companyrecognized rent expense on a straight-line basis beginning at the first rent payment. The Company now recognizes rentexpense on a straight-line basis when it takes possession and control of the property. Safeway recorded a $10.6 millionbefore tax charge ($0.01 per diluted share) in 2004 to correct this error. However, most of the adjustment was accumulatedover many years.
In 2003, Safeway changed its accounting policy to accrue estimated physical inventory losses that occur between the lastphysical inventory count and the quarterly or year-end balance sheet date. Previously, Safeway recorded inventory lossesonly in the period the physical count was performed.
Safeway takes a physical count of perishable inventory in stores every four weeks and nonperishable inventory in stores twicea year on a cycle basis. Distribution centers are counted twice a year on a cycle basis. Safeway historically recordedinventory losses only in the period the physical count was performed. In the fourth quarter of fiscal 2003, Safewaydetermined that its then-current method of accounting for estimated physical inventory losses was not in accordance withGAAP. In order to reflect inventory more accurately on the balance sheet, Safeway began to accrue an estimated physicalinventory loss for the period between the last physical inventory count and the quarterly or year-end balance sheet date.Safeway recorded a charge of $48.9 million before tax ($0.07 per diluted share) in the fourth quarter of fiscal 2003 tocorrect this error. However, most of the adjustment accumulated over many prior years. In addition, in the fourth quarter offiscal 2003, Safeway revised its physical inventory calculation methodology to reflect more precise data on inventorymarkdowns from newly installed financial software. Safeway recorded a charge of $22.1 million before tax ($0.03 perdiluted share) in the fourth quarter of fiscal 2003 as a result of this change in accounting estimate.
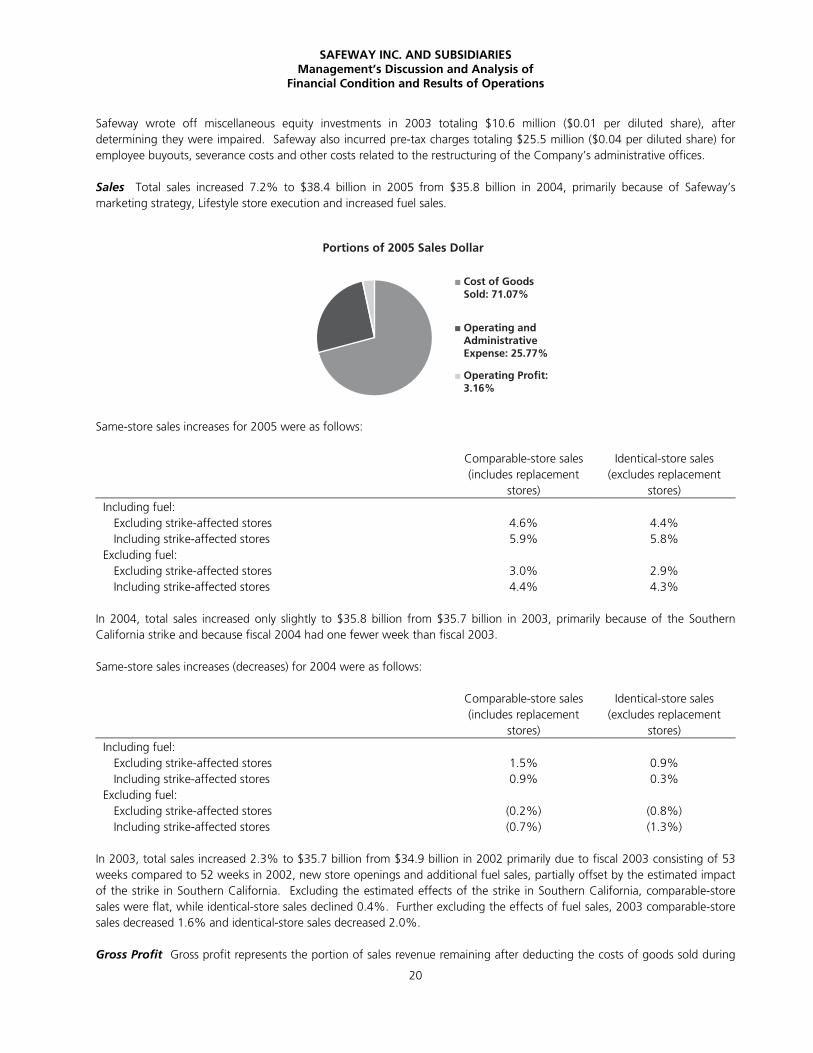
SAFEWAY INC. AND SUBSIDIARIESManagement’s Discussion and Analysis of
Financial Condition and Results of Operations
20
Safeway wrote off miscellaneous equity investments in 2003 totaling $10.6 million ($0.01 per diluted share), afterdetermining they were impaired. Safeway also incurred pre-tax charges totaling $25.5 million ($0.04 per diluted share) foremployee buyouts, severance costs and other costs related to the restructuring of the Company’s administrative offices.
Sales Total sales increased 7.2% to $38.4 billion in 2005 from $35.8 billion in 2004, primarily because of Safeway’smarketing strategy, Lifestyle store execution and increased fuel sales.
Same-store sales increases for 2005 were as follows:
Comparable-store sales(includes replacement
stores)
Identical-store sales(excludes replacement
stores)Including fuel:
Excluding strike-affected stores 4.6% 4.4%Including strike-affected stores 5.9% 5.8%
Excluding fuel:Excluding strike-affected stores 3.0% 2.9%Including strike-affected stores 4.4% 4.3%
In 2004, total sales increased only slightly to $35.8 billion from $35.7 billion in 2003, primarily because of the SouthernCalifornia strike and because fiscal 2004 had one fewer week than fiscal 2003.
Same-store sales increases (decreases) for 2004 were as follows:
Comparable-store sales(includes replacement
stores)
Identical-store sales(excludes replacement
stores)Including fuel:
Excluding strike-affected stores 1.5% 0.9%Including strike-affected stores 0.9% 0.3%
Excluding fuel:Excluding strike-affected stores (0.2%) (0.8%)Including strike-affected stores (0.7%) (1.3%)
In 2003, total sales increased 2.3% to $35.7 billion from $34.9 billion in 2002 primarily due to fiscal 2003 consisting of 53weeks compared to 52 weeks in 2002, new store openings and additional fuel sales, partially offset by the estimated impactof the strike in Southern California. Excluding the estimated effects of the strike in Southern California, comparable-storesales were flat, while identical-store sales declined 0.4%. Further excluding the effects of fuel sales, 2003 comparable-storesales decreased 1.6% and identical-store sales decreased 2.0%.
Gross Profit Gross profit represents the portion of sales revenue remaining after deducting the costs of goods sold during
Portions of 2005 Sales Dollar
Cost of GoodsSold: 71.07%
Operating andAdministrativeExpense: 25.77%
Operating Profit:3.16%
SAFEWAY INC. AND SUBSIDIARIESManagement’s Discussion and Analysis of
Financial Condition and Results of Operations
21
the period, including purchase and distribution costs. These costs include inbound freight charges, purchasing and receivingcosts, warehouse inspection costs, warehousing costs, and other costs of Safeway’s distribution network. Advertising andpromotional expenses are also a component of cost of goods sold. Additionally, all vendor allowances are classified as anelement of cost of goods sold.
Gross profit margin was 28.93% of sales in 2005, 29.58% in 2004, and 30.02% in 2003.
The gross profit margin decreased 65 basis points to 28.93% of sales in 2005 from 29.58% in 2004. Higher fuel salesreduced gross profit by 39 basis points. The remaining decline is due to grand openings of Lifestyle stores, investment inprice, increased advertising expense and higher energy costs.
Gross profit declined 44 basis points in 2004. The strike in Southern California reduced gross profit by an estimated 41 basispoints, and higher fuel sales (which have a lower gross margin) reduced gross profit by 40 basis points. Gross profit in 2003was reduced by 20 basis points due to the $71.0 million charge to accrue estimated inventory losses and a change inestimate for inventory markdowns. The remaining 17-basis-point increase was primarily the result of targeted pricing andpromotion.
Gross profit declined 147 basis points in 2003. Higher fuel sales reduced gross profit by 38 basis points. The $71.0 million ininventory charges reduced gross profit 20 basis points. The strike in Southern California reduced gross profit by an estimatedfive basis points. The remaining 84-basis-point decline was primarily the result of targeted pricing and promotion.
Vendor allowances totaled $2.4 billion in 2005 and $2.2 billion each in 2004 and 2003. Vendor allowances can be groupedinto the following broad categories: promotional allowances, slotting allowances and contract allowances. All vendorallowances are classified as an element of cost of goods sold.
Promotional allowances make up nearly three-quarters of all allowances. With promotional allowances, vendors pay Safewayto promote their product. The promotion may be any combination of a temporary price reduction, a feature in print ads, afeature in a Safeway circular, or a preferred location in the store. The promotions are typically one to two weeks long.
Slotting allowances are a small portion of total allowances (typically less than 5% of all allowances). With slottingallowances, the vendor reimburses Safeway for the cost of placing new product on the shelf. Safeway has no obligation orcommitment to keep the product on the shelf for a minimum period.
Contract allowances make up the remainder of all allowances. Under the typical contract allowance, a vendor pays Safewayto keep product on the shelf for a minimum period of time or when volume thresholds are achieved.
Operating and Administrative Expense Operating and administrative expense consists primarily of store occupancy costsand backstage expenses, which, in turn, consist primarily of wages, employee benefits, rent, depreciation and utilities.
Operating and administrative expense was 25.77% of sales in 2005 compared to 26.30% in 2004 and 26.37% in 2003.
Operating and administrative expense decreased 53 basis points in 2005 to 25.77% of sales from 26.30% in 2004. Thesignificant pre-tax charges discussed above (impairment of long-lived assets, store exit activities and employee buyouts in2005 combined with store exit activities, health and welfare contributions and the accrual for rent holidays in 2004)increased operating and administrative expense, as a percentage of sales, by 20 basis points. Stock option expense, laborcosts associated with the grand opening of Lifestyle stores and higher energy costs also increased operating andadministrative expense, as a percentage of sales. These items were more than offset by the restructured labor agreements,increased fuel sales and reduced workers’ compensation costs.
Operating and administrative expense decreased seven basis points in 2004. Lower impairment charges reduced operatingand administrative expense as a percentage of sales by 77 basis points and higher fuel sales reduced operating andadministrative expense by 39 basis points. These improvements were offset by a 22-basis-point increase from the strike inSouthern California and 87 basis points due to higher wages, benefits and occupancy expense.
SAFEWAY INC. AND SUBSIDIARIESManagement’s Discussion and Analysis of
Financial Condition and Results of Operations
22
Operating and administrative expense increased 128 basis points in 2003. Higher Dominick’s impairment charges increasedoperating and administrative expense 30 basis points. Reduced sales from the Southern California strike increased operatingand administrative expense by an estimated 29 basis points. Higher pension expense added 28 basis points, and higherworkers’ compensation expense added 15 basis points. The remaining 26-basis-point increase was primarily due to higheremployee benefit costs, soft sales and settlement income from the termination of an in-store banking agreement recorded in2002 operating and administrative expense.
Interest Expense Interest expense was $402.6 million in 2005, compared to $411.2 million in 2004 and $442.4 million in2003. Interest expense decreased in 2005 primarily due to lower average borrowings in 2005 compared to 2004, partiallyoffset by a higher average interest rate. Interest expense also decreased in 2004, primarily due to lower average borrowingsin 2004 compared to 2003. Interest expense increased in 2003, primarily due to higher average borrowings in 2003compared to 2002.
Other Income (Loss) Other income consists of interest income, minority interest in a consolidated affiliate and equity inearnings from Safeway’s unconsolidated affiliates. Interest income was $12.7 million in 2005, $9.7 million in 2004 and $5.4million in 2003. Equity in earnings (losses) of unconsolidated affiliates was income of $15.8 million in 2005, income of $12.6million in 2004 and a loss of $7.1 million in 2003.
Income Taxes The Company’s effective tax rates for 2005, 2004 and 2003 were 33.9%, 29.4% and 220.3%, respectively.The effective tax rate for 2005 includes a tax benefit from the repatriation of foreign earnings under the American JobsCreation Act of 2004, and a benefit from the favorable resolution of certain tax issues. In 2004, the effective tax rateincluded benefits related to tax law changes and the resolution of certain tax issues. The higher effective tax rate in 2003reflects the tax effect of a charge for nondeductible goodwill impairment.
Critical Accounting Policies and Estimates
Critical accounting policies are those accounting policies that management believes are important to the portrayal ofSafeway’s financial condition and results of operations and require management’s most difficult, subjective or complexjudgments, often as a result of the need to make estimates about the effect of matters that are inherently uncertain.
Workers’ Compensation The Company is primarily self-insured for workers’ compensation, automobile and general liabilitycosts. It is the Company’s policy to record its self-insurance liability, as determined actuarially, based on claims filed and anestimate of claims incurred but not yet reported, discounted at a risk-free interest rate. Any actuarial projection of lossesconcerning workers’ compensation and general liability is subject to a high degree of variability. Among the causes of thisvariability are unpredictable external factors affecting future inflation rates, discount rates, litigation trends, legalinterpretations, benefit level changes and claim settlement patterns. A 25-basis-point increase in the Company’s discountrate would reduce its liability by approximately $4.7 million.
The majority of the Company’s workers’ compensation liability is from claims occurring in California. California workers’compensation has received intense scrutiny from the state’s politicians, insurers, employers and providers, as well as thepublic in general. Recent years have seen escalation in the number of legislative reforms, judicial rulings and socialphenomena affecting this business. Some of the many sources of uncertainty in the Company’s reserve estimates includechanges in benefit levels, medical fee schedules, medical utilization guidelines, vocation rehabilitation and apportionment.
Store Closures Safeway’s policy is to recognize losses relating to the impairment of long-lived assets when expected netfuture cash flows are less than the assets’ carrying values. When stores that are under long-term leases close, Safewayrecords a liability for the future minimum lease payments and related ancillary costs, net of estimated cost recoveries. In bothcases, fair value is determined by estimating net future cash flows and discounting them using a risk-adjusted rate of interest.The Company estimates future cash flows based on its experience and knowledge of the market in which the closed store islocated and, when necessary, uses real estate brokers. However, these estimates project future cash flows several years intothe future and are affected by factors such as inflation, real estate markets and economic conditions.
Employee Benefit Plans The determination of Safeway’s obligation and expense for pension benefits is dependent, in part,
SAFEWAY INC. AND SUBSIDIARIESManagement’s Discussion and Analysis of
Financial Condition and Results of Operations
23
on the Company’s selection of certain assumptions used by its actuaries in calculating these amounts. These assumptions aredisclosed in Note I to the consolidated financial statements and include, among other things, the discount rate, the expectedlong-term rate of return on plan assets and the rate of compensation increases. Actual results in any given year will oftendiffer from actuarial assumptions because of economic and other factors. In accordance with GAAP, actual results that differfrom the actuarial assumptions are accumulated and amortized over future periods and, therefore, affect recognized expenseand recorded obligation in such future periods. While Safeway believes its assumptions are appropriate, significantdifferences in actual results or significant changes in the Company’s assumptions may materially affect Safeway’s pensionand other post-retirement obligations and its future expense.
Safeway bases the discount rate on current investment yields on high quality fixed-income investments. The discount rateused to determine 2005 pension expense was 5.8%. A lower discount rate increases the present value of benefit obligationsand increases pension expense. Expected return on pension plan assets is based on historical experience of the Company’sportfolio and the review of projected returns by asset class on broad, publicly traded equity and fixed-income indices, as wellas target asset allocation. Safeway’s target asset allocation mix is designed to meet the Company’s long-term pensionrequirements. For 2005, the Company’s assumed rate of return was 8.5% on U.S. pension assets and 7.0% on Canadianpension assets. Over the 10-year period ended December 31, 2005, the average rate of return was approximately 10% forU.S. and Canadian pension assets.
Sensitivity to changes in the major assumptions for Safeway’s pension plans are as follows (dollars in millions):
United States Canada
Percentagepoint change
Projectedbenefit
obligationdecrease(increase)
Expensedecrease(increase)
Projectedbenefit
obligationdecrease(increase)
Expensedecrease(increase)
Expected return on assets +/-1.0 pt − $16.3/(16.3) − $2.3/(2.3)Discount rate +/-1.0 pt $188.5/(216.2) $40.2/(26.6) $47.3/(55.8) $4.5/(5.3)
Cash contributions, primarily in Canada, to the Company’s pension plans are expected to total approximately $27.0 million in2006 and totaled $22.4 million in 2005, $19.0 million in 2004 and $16.0 million in 2003. Safeway expects to fund futurecontributions to the Company’s pension plans with cash flow from operations.
Stock-Based Employee Compensation Safeway elected to early adopt SFAS No. 123R in the first quarter of 2005 usingthe modified prospective method. SFAS No. 123R requires all share-based payments to employees, including grants ofemployee stock options, to be recognized in the financial statements as compensation cost based on the fair value on thedate of grant. The Company determines fair value of such awards using the Black-Scholes option pricing model. The Black-Scholes option pricing model incorporates certain assumptions, such as risk-free interest rate, expected volatility, expecteddividend yield and expected life of options, in order to arrive at a fair value estimate.
Goodwill Safeway accounts for goodwill in accordance with SFAS No. 142, “Goodwill and Other Intangible Assets.” Asrequired by SFAS No. 142, Safeway tests for goodwill annually using a two-step approach with extensive use of accountingjudgments and estimates of future operating results. Changes in estimates or application of alternative assumptions anddefinitions could produce significantly different results. The factors that most significantly affect the fair value calculation aremarket multiples and estimates of future cash flows. Fair value is determined by an independent third-party appraiser whoprimarily used the discounted cash flow method and the guideline company method.
Income Tax Contingencies The Company is subject to periodic audits by the Internal Revenue Service and other foreign,state and local taxing authorities. These audits may challenge certain of the Company’s tax positions such as the timing andamount of deductions and allocation of taxable income to the various tax jurisdictions. Loss and gain contingencies areaccounted for in accordance with SFAS No. 5, “Accounting for Contingencies,” and may require significant managementjudgment in estimating final outcomes. Actual results could materially differ from these estimates and could significantlyaffect the effective tax rate and cash flows in future years.
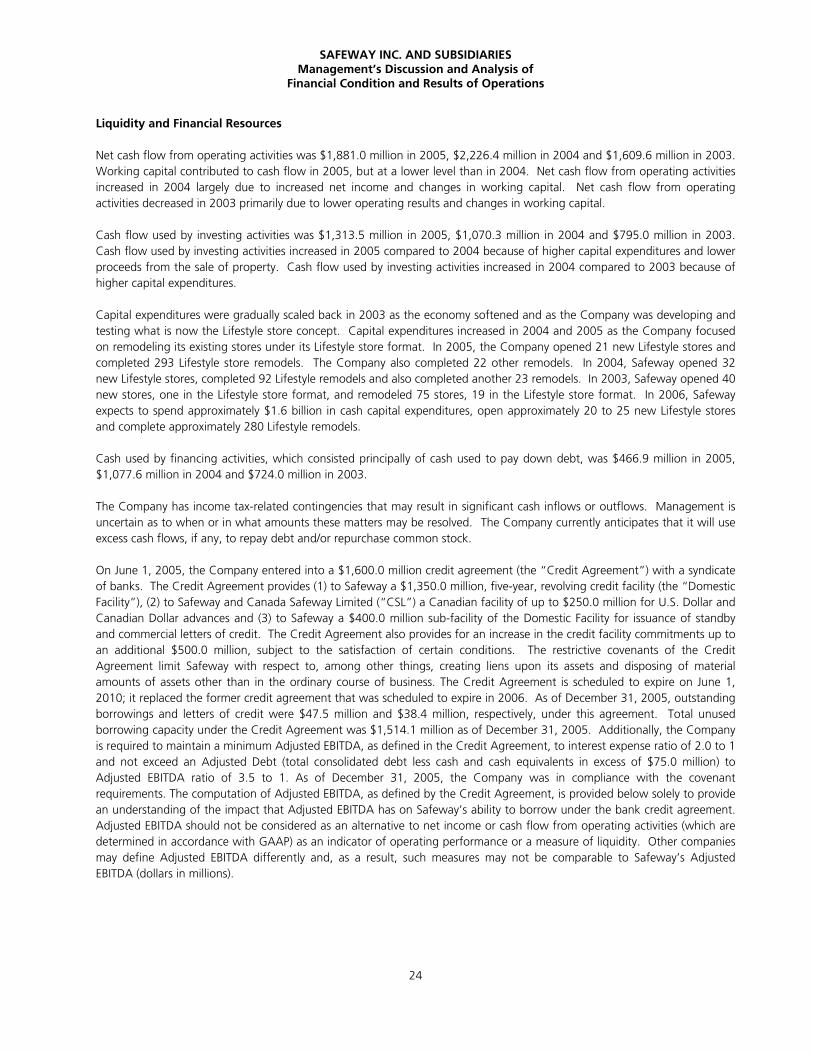
SAFEWAY INC. AND SUBSIDIARIESManagement’s Discussion and Analysis of
Financial Condition and Results of Operations
24
Liquidity and Financial Resources
Net cash flow from operating activities was $1,881.0 million in 2005, $2,226.4 million in 2004 and $1,609.6 million in 2003.Working capital contributed to cash flow in 2005, but at a lower level than in 2004. Net cash flow from operating activitiesincreased in 2004 largely due to increased net income and changes in working capital. Net cash flow from operatingactivities decreased in 2003 primarily due to lower operating results and changes in working capital.
Cash flow used by investing activities was $1,313.5 million in 2005, $1,070.3 million in 2004 and $795.0 million in 2003.Cash flow used by investing activities increased in 2005 compared to 2004 because of higher capital expenditures and lowerproceeds from the sale of property. Cash flow used by investing activities increased in 2004 compared to 2003 because ofhigher capital expenditures.
Capital expenditures were gradually scaled back in 2003 as the economy softened and as the Company was developing andtesting what is now the Lifestyle store concept. Capital expenditures increased in 2004 and 2005 as the Company focusedon remodeling its existing stores under its Lifestyle store format. In 2005, the Company opened 21 new Lifestyle stores andcompleted 293 Lifestyle store remodels. The Company also completed 22 other remodels. In 2004, Safeway opened 32new Lifestyle stores, completed 92 Lifestyle remodels and also completed another 23 remodels. In 2003, Safeway opened 40new stores, one in the Lifestyle store format, and remodeled 75 stores, 19 in the Lifestyle store format. In 2006, Safewayexpects to spend approximately $1.6 billion in cash capital expenditures, open approximately 20 to 25 new Lifestyle storesand complete approximately 280 Lifestyle remodels.
Cash used by financing activities, which consisted principally of cash used to pay down debt, was $466.9 million in 2005,$1,077.6 million in 2004 and $724.0 million in 2003.
The Company has income tax-related contingencies that may result in significant cash inflows or outflows. Management isuncertain as to when or in what amounts these matters may be resolved. The Company currently anticipates that it will useexcess cash flows, if any, to repay debt and/or repurchase common stock.
On June 1, 2005, the Company entered into a $1,600.0 million credit agreement (the “Credit Agreement”) with a syndicateof banks. The Credit Agreement provides (1) to Safeway a $1,350.0 million, five-year, revolving credit facility (the “DomesticFacility”), (2) to Safeway and Canada Safeway Limited (“CSL”) a Canadian facility of up to $250.0 million for U.S. Dollar andCanadian Dollar advances and (3) to Safeway a $400.0 million sub-facility of the Domestic Facility for issuance of standbyand commercial letters of credit. The Credit Agreement also provides for an increase in the credit facility commitments up toan additional $500.0 million, subject to the satisfaction of certain conditions. The restrictive covenants of the CreditAgreement limit Safeway with respect to, among other things, creating liens upon its assets and disposing of materialamounts of assets other than in the ordinary course of business. The Credit Agreement is scheduled to expire on June 1,2010; it replaced the former credit agreement that was scheduled to expire in 2006. As of December 31, 2005, outstandingborrowings and letters of credit were $47.5 million and $38.4 million, respectively, under this agreement. Total unusedborrowing capacity under the Credit Agreement was $1,514.1 million as of December 31, 2005. Additionally, the Companyis required to maintain a minimum Adjusted EBITDA, as defined in the Credit Agreement, to interest expense ratio of 2.0 to 1and not exceed an Adjusted Debt (total consolidated debt less cash and cash equivalents in excess of $75.0 million) toAdjusted EBITDA ratio of 3.5 to 1. As of December 31, 2005, the Company was in compliance with the covenantrequirements. The computation of Adjusted EBITDA, as defined by the Credit Agreement, is provided below solely to providean understanding of the impact that Adjusted EBITDA has on Safeway’s ability to borrow under the bank credit agreement.Adjusted EBITDA should not be considered as an alternative to net income or cash flow from operating activities (which aredetermined in accordance with GAAP) as an indicator of operating performance or a measure of liquidity. Other companiesmay define Adjusted EBITDA differently and, as a result, such measures may not be comparable to Safeway’s AdjustedEBITDA (dollars in millions).
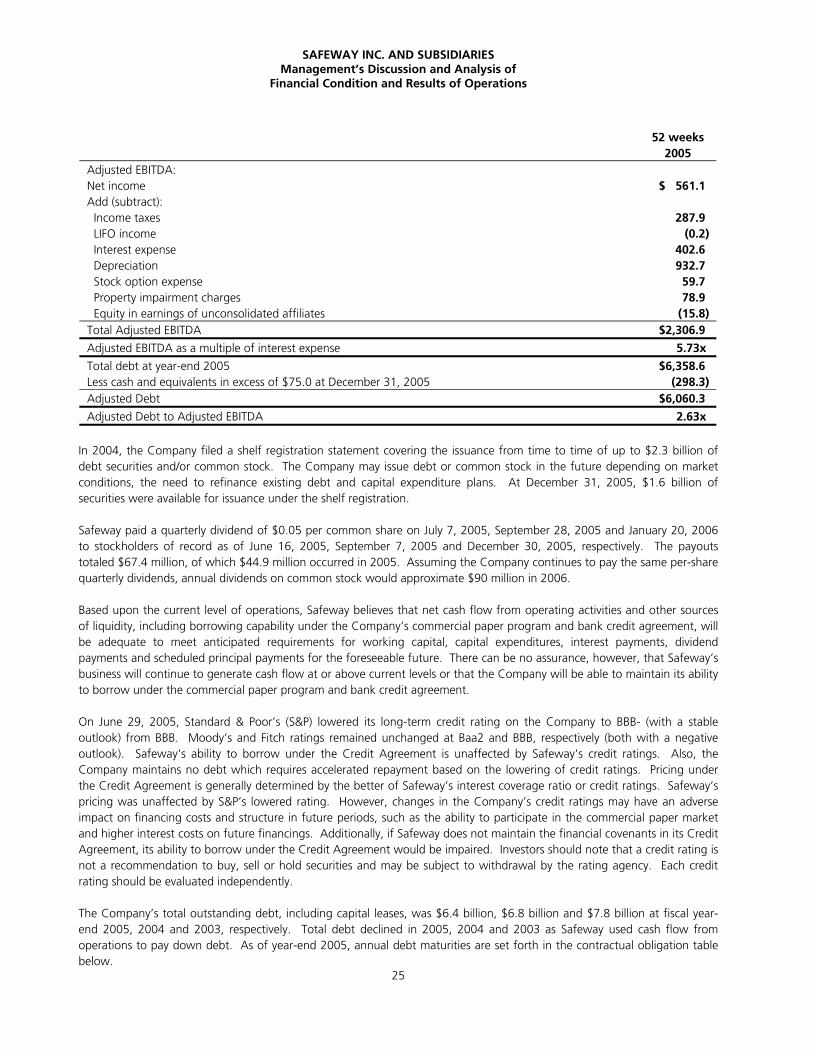
SAFEWAY INC. AND SUBSIDIARIESManagement’s Discussion and Analysis of
Financial Condition and Results of Operations
25
52 weeks2005
Adjusted EBITDA:Net income $ 561.1Add (subtract): Income taxes 287.9 LIFO income (0.2) Interest expense 402.6 Depreciation 932.7 Stock option expense 59.7 Property impairment charges 78.9 Equity in earnings of unconsolidated affiliates (15.8)Total Adjusted EBITDA $2,306.9
Adjusted EBITDA as a multiple of interest expense 5.73x
Total debt at year-end 2005 $6,358.6Less cash and equivalents in excess of $75.0 at December 31, 2005 (298.3)Adjusted Debt $6,060.3
Adjusted Debt to Adjusted EBITDA 2.63x
In 2004, the Company filed a shelf registration statement covering the issuance from time to time of up to $2.3 billion ofdebt securities and/or common stock. The Company may issue debt or common stock in the future depending on marketconditions, the need to refinance existing debt and capital expenditure plans. At December 31, 2005, $1.6 billion ofsecurities were available for issuance under the shelf registration.
Safeway paid a quarterly dividend of $0.05 per common share on July 7, 2005, September 28, 2005 and January 20, 2006to stockholders of record as of June 16, 2005, September 7, 2005 and December 30, 2005, respectively. The payoutstotaled $67.4 million, of which $44.9 million occurred in 2005. Assuming the Company continues to pay the same per-sharequarterly dividends, annual dividends on common stock would approximate $90 million in 2006.
Based upon the current level of operations, Safeway believes that net cash flow from operating activities and other sourcesof liquidity, including borrowing capability under the Company’s commercial paper program and bank credit agreement, willbe adequate to meet anticipated requirements for working capital, capital expenditures, interest payments, dividendpayments and scheduled principal payments for the foreseeable future. There can be no assurance, however, that Safeway’sbusiness will continue to generate cash flow at or above current levels or that the Company will be able to maintain its abilityto borrow under the commercial paper program and bank credit agreement.
On June 29, 2005, Standard & Poor’s (S&P) lowered its long-term credit rating on the Company to BBB- (with a stableoutlook) from BBB. Moody’s and Fitch ratings remained unchanged at Baa2 and BBB, respectively (both with a negativeoutlook). Safeway's ability to borrow under the Credit Agreement is unaffected by Safeway's credit ratings. Also, theCompany maintains no debt which requires accelerated repayment based on the lowering of credit ratings. Pricing underthe Credit Agreement is generally determined by the better of Safeway’s interest coverage ratio or credit ratings. Safeway’spricing was unaffected by S&P’s lowered rating. However, changes in the Company’s credit ratings may have an adverseimpact on financing costs and structure in future periods, such as the ability to participate in the commercial paper marketand higher interest costs on future financings. Additionally, if Safeway does not maintain the financial covenants in its CreditAgreement, its ability to borrow under the Credit Agreement would be impaired. Investors should note that a credit rating isnot a recommendation to buy, sell or hold securities and may be subject to withdrawal by the rating agency. Each creditrating should be evaluated independently.
The Company’s total outstanding debt, including capital leases, was $6.4 billion, $6.8 billion and $7.8 billion at fiscal year-end 2005, 2004 and 2003, respectively. Total debt declined in 2005, 2004 and 2003 as Safeway used cash flow fromoperations to pay down debt. As of year-end 2005, annual debt maturities are set forth in the contractual obligation tablebelow.
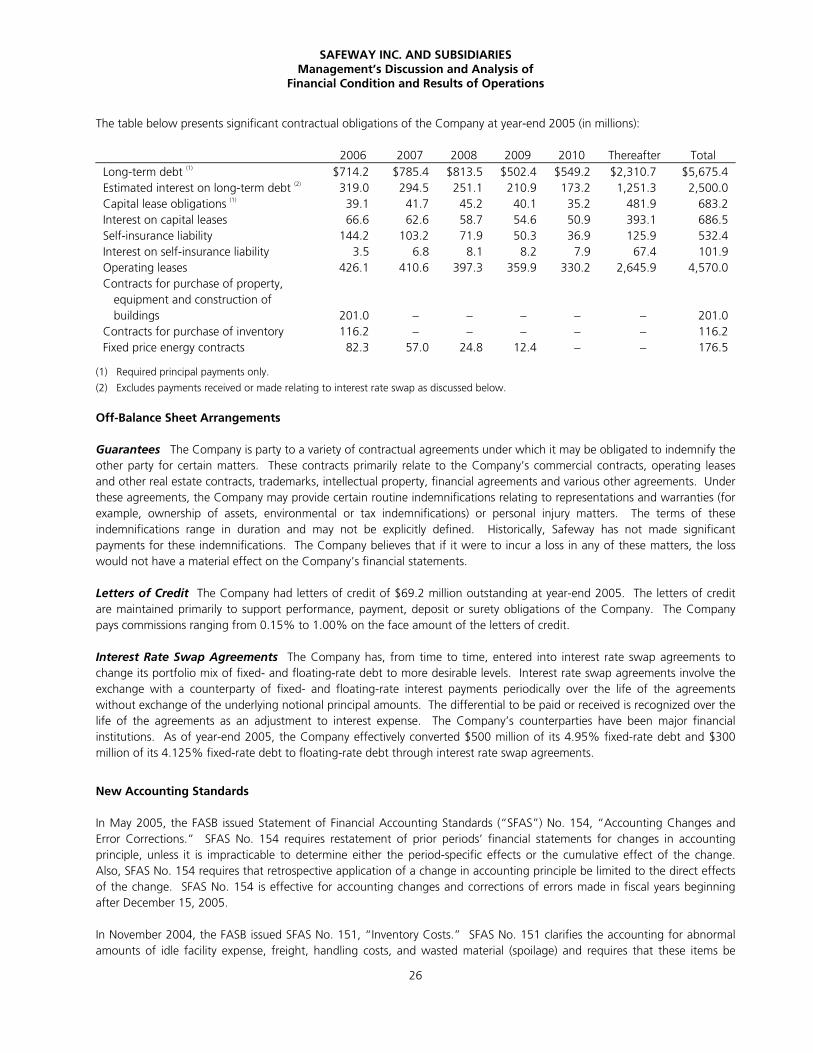
SAFEWAY INC. AND SUBSIDIARIESManagement’s Discussion and Analysis of
Financial Condition and Results of Operations
26
The table below presents significant contractual obligations of the Company at year-end 2005 (in millions):
2006 2007 2008 2009 2010 Thereafter TotalLong-term debt (1) $714.2 $785.4 $813.5 $502.4 $549.2 $2,310.7 $5,675.4Estimated interest on long-term debt (2) 319.0 294.5 251.1 210.9 173.2 1,251.3 2,500.0Capital lease obligations (1) 39.1 41.7 45.2 40.1 35.2 481.9 683.2Interest on capital leases 66.6 62.6 58.7 54.6 50.9 393.1 686.5Self-insurance liability 144.2 103.2 71.9 50.3 36.9 125.9 532.4Interest on self-insurance liability 3.5 6.8 8.1 8.2 7.9 67.4 101.9Operating leases 426.1 410.6 397.3 359.9 330.2 2,645.9 4,570.0Contracts for purchase of property,
equipment and construction ofbuildings 201.0 − − − − − 201.0
Contracts for purchase of inventory 116.2 − − − − − 116.2Fixed price energy contracts 82.3 57.0 24.8 12.4 − − 176.5
(1) Required principal payments only.
(2) Excludes payments received or made relating to interest rate swap as discussed below.
Off-Balance Sheet Arrangements
Guarantees The Company is party to a variety of contractual agreements under which it may be obligated to indemnify theother party for certain matters. These contracts primarily relate to the Company’s commercial contracts, operating leasesand other real estate contracts, trademarks, intellectual property, financial agreements and various other agreements. Underthese agreements, the Company may provide certain routine indemnifications relating to representations and warranties (forexample, ownership of assets, environmental or tax indemnifications) or personal injury matters. The terms of theseindemnifications range in duration and may not be explicitly defined. Historically, Safeway has not made significantpayments for these indemnifications. The Company believes that if it were to incur a loss in any of these matters, the losswould not have a material effect on the Company’s financial statements.
Letters of Credit The Company had letters of credit of $69.2 million outstanding at year-end 2005. The letters of creditare maintained primarily to support performance, payment, deposit or surety obligations of the Company. The Companypays commissions ranging from 0.15% to 1.00% on the face amount of the letters of credit.
Interest Rate Swap Agreements The Company has, from time to time, entered into interest rate swap agreements tochange its portfolio mix of fixed- and floating-rate debt to more desirable levels. Interest rate swap agreements involve theexchange with a counterparty of fixed- and floating-rate interest payments periodically over the life of the agreementswithout exchange of the underlying notional principal amounts. The differential to be paid or received is recognized over thelife of the agreements as an adjustment to interest expense. The Company’s counterparties have been major financialinstitutions. As of year-end 2005, the Company effectively converted $500 million of its 4.95% fixed-rate debt and $300million of its 4.125% fixed-rate debt to floating-rate debt through interest rate swap agreements.
New Accounting Standards
In May 2005, the FASB issued Statement of Financial Accounting Standards (“SFAS”) No. 154, “Accounting Changes andError Corrections.” SFAS No. 154 requires restatement of prior periods’ financial statements for changes in accountingprinciple, unless it is impracticable to determine either the period-specific effects or the cumulative effect of the change.Also, SFAS No. 154 requires that retrospective application of a change in accounting principle be limited to the direct effectsof the change. SFAS No. 154 is effective for accounting changes and corrections of errors made in fiscal years beginningafter December 15, 2005.
In November 2004, the FASB issued SFAS No. 151, “Inventory Costs.” SFAS No. 151 clarifies the accounting for abnormalamounts of idle facility expense, freight, handling costs, and wasted material (spoilage) and requires that these items be

SAFEWAY INC. AND SUBSIDIARIESManagement’s Discussion and Analysis of
Financial Condition and Results of Operations
27
recognized as current-period charges. In addition, SFAS No. 151 requires that allocation of fixed production overhead toconversion costs be based on the normal capacity of the production facilities. SFAS No. 151 is effective for inventory costsincurred during fiscal years beginning after June 15, 2005. SFAS No. 151 is not expected to have a material effect on theCompany’s financial statements.
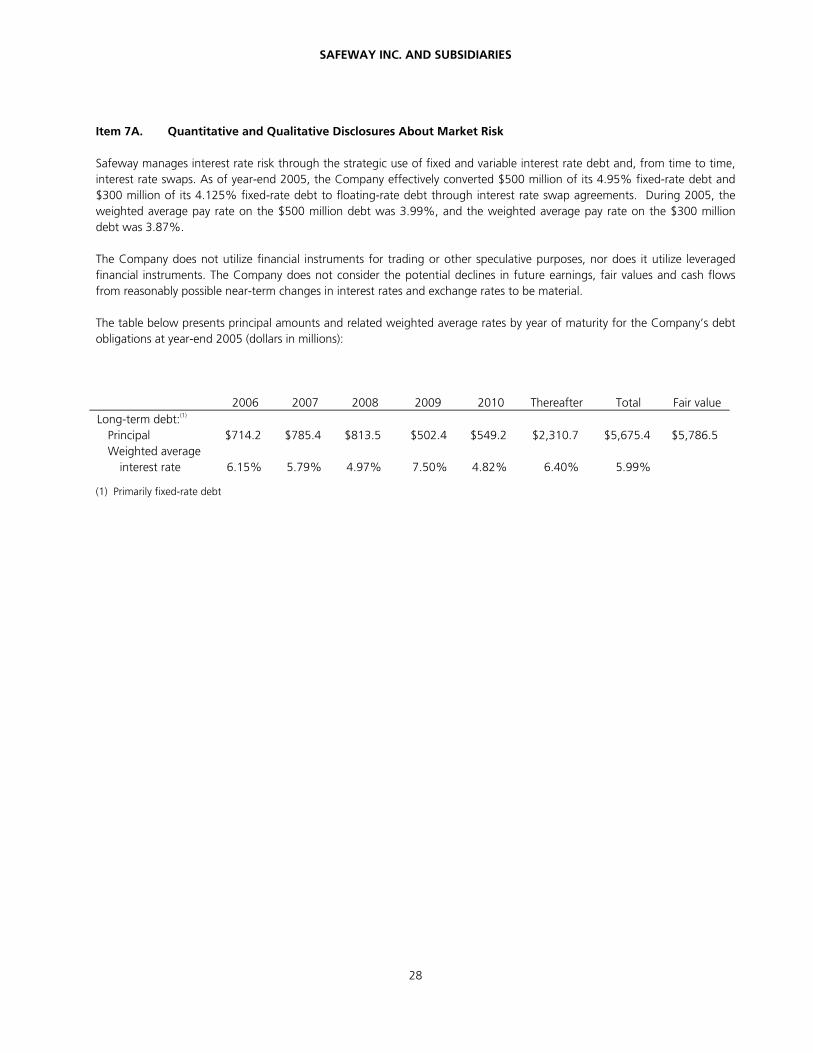
SAFEWAY INC. AND SUBSIDIARIES
28
Item 7A. Quantitative and Qualitative Disclosures About Market Risk
Safeway manages interest rate risk through the strategic use of fixed and variable interest rate debt and, from time to time,interest rate swaps. As of year-end 2005, the Company effectively converted $500 million of its 4.95% fixed-rate debt and$300 million of its 4.125% fixed-rate debt to floating-rate debt through interest rate swap agreements. During 2005, theweighted average pay rate on the $500 million debt was 3.99%, and the weighted average pay rate on the $300 milliondebt was 3.87%.
The Company does not utilize financial instruments for trading or other speculative purposes, nor does it utilize leveragedfinancial instruments. The Company does not consider the potential declines in future earnings, fair values and cash flowsfrom reasonably possible near-term changes in interest rates and exchange rates to be material.
The table below presents principal amounts and related weighted average rates by year of maturity for the Company’s debtobligations at year-end 2005 (dollars in millions):
2006 2007 2008 2009 2010 Thereafter Total Fair valueLong-term debt:(1)
Principal $714.2 $785.4 $813.5 $502.4 $549.2 $2,310.7 $5,675.4 $5,786.5Weighted average
interest rate 6.15% 5.79% 4.97% 7.50% 4.82% 6.40% 5.99%
(1) Primarily fixed-rate debt
SAFEWAY INC. AND SUBSIDIARIES
29
Item 8. Financial Statements and Supplementary Data
Page
Management’s Annual Report on Internal Control over Financial Reporting 30Report of Independent Registered Public Accounting Firm 31Consolidated Statements of Operations for fiscal 2005, 2004 and 2003 33Consolidated Balance Sheets as of the end of fiscal 2005 and 2004 34Consolidated Statements of Cash Flows for fiscal 2005, 2004 and 2003 36Consolidated Statements of Stockholders’ Equity for fiscal 2005, 2004 and 2003 38Notes to Consolidated Financial Statements 39
SAFEWAY INC. AND SUBSIDIARIESManagement’s Annual Report on Internal Control over Financial Reporting
30
Management of the Company, including the Chief Executive Officer and the Chief Financial Officer, is responsible forestablishing and maintaining adequate internal control over financial reporting, as defined in Rules 13a-15(f) and 15d-15(f) ofthe Securities Exchange Act of 1934, as amended. The Company’s internal controls were designed to provide reasonableassurance as to the reliability of its financial reporting and the preparation and presentation of the consolidated financialstatements for external purposes in accordance with accounting principles generally accepted in the United States andincludes those policies and procedures that (1) pertain to the maintenance of records that in reasonable detail accurately andfairly reflect the transactions and dispositions of the assets of the Company; (2) provide reasonable assurance thattransactions are recorded as necessary to permit preparation of financial statements in accordance with generally acceptedaccounting principles, and that receipts and expenditures of the Company are being made only in accordance withauthorizations of management and directors of the Company; and (3) provide reasonable assurance regarding prevention ortimely detection of unauthorized acquisition, use or disposition of the Company's assets that could have a material effect onthe financial statements.
The Company conducted an evaluation of the effectiveness of its internal control over financial reporting based on theframework in Internal Control−Integrated Framework issued by the Committee of Sponsoring Organizations of the TreadwayCommission. This evaluation included review of the documentation of controls, evaluation of the design effectiveness ofcontrols, testing of the operating effectiveness of controls and a conclusion on this evaluation. Through this evaluation,management did not identify any material weakness in the Company’s internal control. There are inherent limitations in theeffectiveness of any system of internal control over financial reporting; however, based on the evaluation, management hasconcluded the Company’s internal control over financial reporting were effective as of December 31, 2005.
The Company’s independent registered public accounting firm has audited the accompanying consolidated financialstatements, the Company’s internal control over financial reporting and management’s assessment that it maintainedeffective internal control over financial reporting. Their attestation report on management’s assessment of the effectivenessof the Company’s internal control over financial reporting is included in this Annual Report on Form 10-K and begins on thefollowing page.
STEVEN A. BURD ROBERT L. EDWARDSChairman, President andChief Executive Officer
Executive Vice Presidentand Chief Financial officer
March 10, 2006 March 10, 2006
Report of Independent Registered Public Accounting Firm
31
To the Board of Directors and Stockholders of Safeway Inc.:
We have audited the accompanying consolidated balance sheets of Safeway Inc. and subsidiaries (the “Company”) as ofDecember 31, 2005 and January 1, 2005, and the related consolidated statements of operations, stockholders' equity, andcash flows for each of the three years in the period ended December 31, 2005. We also have audited management'sassessment, included in the accompanying “Management’s Annual Report on Internal Control over Financial Reporting,” thatthe Company maintained effective internal control over financial reporting as of December 31, 2005, based on criteriaestablished in Internal Control—Integrated Framework issued by the Committee of Sponsoring Organizations of theTreadway Commission. The Company's management is responsible for these financial statements, for maintaining effectiveinternal control over financial reporting, and for its assessment of the effectiveness of internal control over financialreporting. Our responsibility is to express an opinion on these financial statements, an opinion on management'sassessment, and an opinion on the effectiveness of the Company's internal control over financial reporting based on ouraudits.
We conducted our audits in accordance with the standards of the Public Company Accounting Oversight Board (UnitedStates). Those standards require that we plan and perform the audit to obtain reasonable assurance about whether thefinancial statements are free of material misstatement and whether effective internal control over financial reporting wasmaintained in all material respects. Our audit of financial statements included examining, on a test basis, evidencesupporting the amounts and disclosures in the financial statements, assessing the accounting principles used and significantestimates made by management, and evaluating the overall financial statement presentation. Our audit of internal controlover financial reporting included obtaining an understanding of internal control over financial reporting, evaluatingmanagement's assessment, testing and evaluating the design and operating effectiveness of internal control, and performingsuch other procedures as we considered necessary in the circumstances. We believe that our audits provide a reasonablebasis for our opinions.
A company's internal control over financial reporting is a process designed by, or under the supervision of, the company'sprincipal executive and principal financial officers, or persons performing similar functions, and effected by the company'sboard of directors, management, and other personnel to provide reasonable assurance regarding the reliability of financialreporting and the preparation of financial statements for external purposes in accordance with generally acceptedaccounting principles. A company's internal control over financial reporting includes those policies and procedures that (1)pertain to the maintenance of records that, in reasonable detail, accurately and fairly reflect the transactions and dispositionsof the assets of the company; (2) provide reasonable assurance that transactions are recorded as necessary to permitpreparation of financial statements in accordance with generally accepted accounting principles, and that receipts andexpenditures of the company are being made only in accordance with authorizations of management and directors of thecompany; and (3) provide reasonable assurance regarding prevention or timely detection of unauthorized acquisition, use, ordisposition of the company's assets that could have a material effect on the financial statements.
Because of the inherent limitations of internal control over financial reporting, including the possibility of collusion orimproper management override of controls, material misstatements due to error or fraud may not be prevented or detectedon a timely basis. Also, projections of any evaluation of the effectiveness of the internal control over financial reporting tofuture periods are subject to the risk that the controls may become inadequate because of changes in conditions, or that thedegree of compliance with the policies or procedures may deteriorate.
In our opinion, the consolidated financial statements referred to above present fairly, in all material respects, the financialposition of Safeway Inc. and subsidiaries as of December 31, 2005 and January 1, 2005, and the results of their operationsand their cash flows for each of the three years in the period ended December 31, 2005, in conformity with accountingprinciples generally accepted in the United States of America. Also in our opinion, management's assessment that theCompany maintained effective internal control over financial reporting as of December 31, 2005, is fairly stated, in allmaterial respects, based on the criteria established in Internal Control—Integrated Framework issued by the Committee ofSponsoring Organizations of the Treadway Commission. Furthermore, in our opinion, the Company maintained, in allmaterial respects, effective internal control over financial reporting as of December 31, 2005, based on the criteriaestablished in Internal Control—Integrated Framework issued by the Committee of Sponsoring Organizations of theTreadway Commission.
Report of Independent Registered Public Accounting Firm
32
As discussed in Note A to the consolidated financial statements, in fiscal 2005, the Company changed its method ofaccounting for share-based payment arrangements to conform to Statement of Financial Accounting Standards No. 123(R),“Share-Based Payment.”
San Francisco, CaliforniaMarch 10, 2006
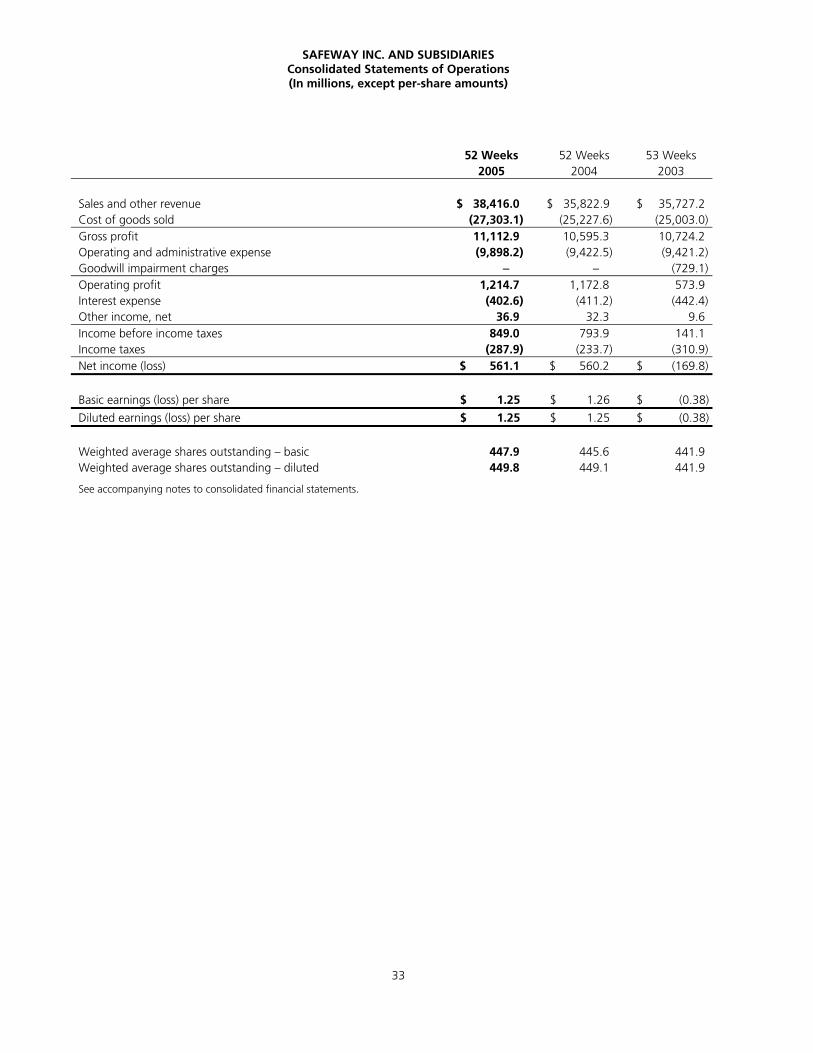
SAFEWAY INC. AND SUBSIDIARIESConsolidated Statements of Operations(In millions, except per-share amounts)
33
52 Weeks2005
52 Weeks2004
53 Weeks2003
Sales and other revenue $ 38,416.0 $ 35,822.9 $ 35,727.2Cost of goods sold (27,303.1) (25,227.6) (25,003.0)Gross profit 11,112.9 10,595.3 10,724.2Operating and administrative expense (9,898.2) (9,422.5) (9,421.2)Goodwill impairment charges − − (729.1)Operating profit 1,214.7 1,172.8 573.9Interest expense (402.6) (411.2) (442.4)Other income, net 36.9 32.3 9.6Income before income taxes 849.0 793.9 141.1Income taxes (287.9) (233.7) (310.9)Net income (loss) $ 561.1 $ 560.2 $ (169.8)
Basic earnings (loss) per share $ 1.25 $ 1.26 $ (0.38)
Diluted earnings (loss) per share $ 1.25 $ 1.25 $ (0.38)
Weighted average shares outstanding – basic 447.9 445.6 441.9Weighted average shares outstanding – diluted 449.8 449.1 441.9
See accompanying notes to consolidated financial statements.
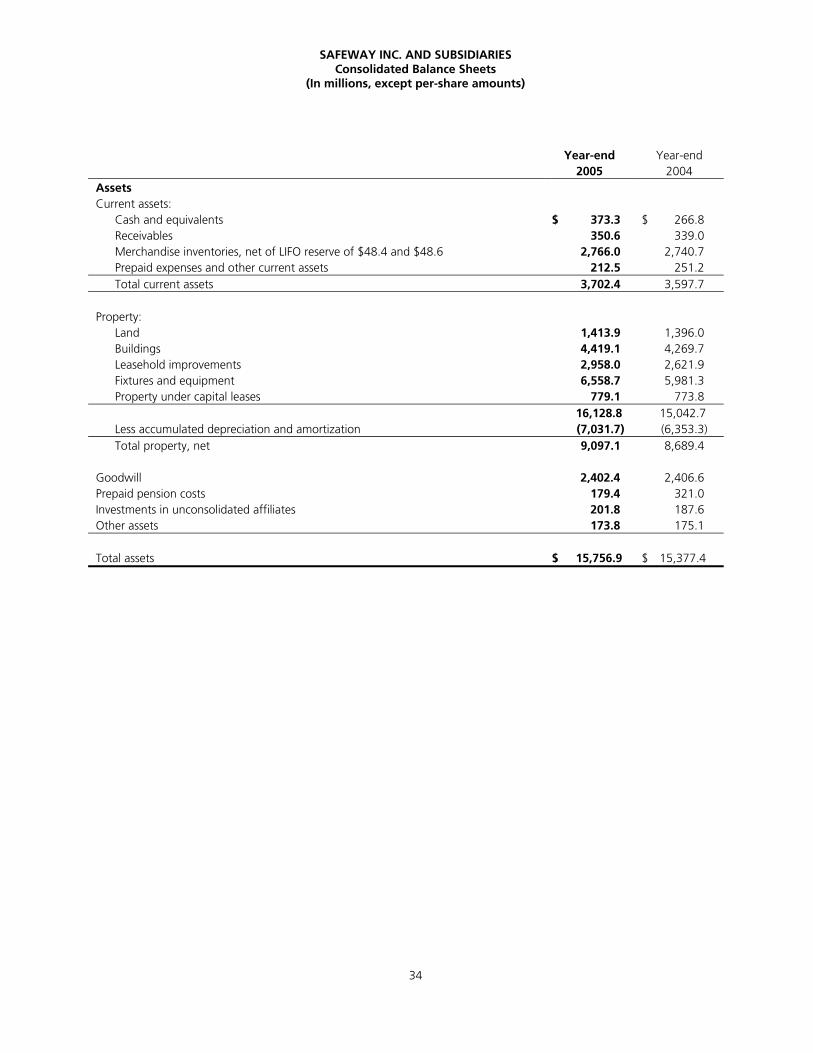
SAFEWAY INC. AND SUBSIDIARIESConsolidated Balance Sheets
(In millions, except per-share amounts)
34
Year-end2005
Year-end2004
AssetsCurrent assets:
Cash and equivalents $ 373.3 $ 266.8Receivables 350.6 339.0Merchandise inventories, net of LIFO reserve of $48.4 and $48.6 2,766.0 2,740.7Prepaid expenses and other current assets 212.5 251.2Total current assets 3,702.4 3,597.7
Property:Land 1,413.9 1,396.0Buildings 4,419.1 4,269.7Leasehold improvements 2,958.0 2,621.9Fixtures and equipment 6,558.7 5,981.3Property under capital leases 779.1 773.8
16,128.8 15,042.7Less accumulated depreciation and amortization (7,031.7) (6,353.3)Total property, net 9,097.1 8,689.4
Goodwill 2,402.4 2,406.6Prepaid pension costs 179.4 321.0Investments in unconsolidated affiliates 201.8 187.6Other assets 173.8 175.1
Total assets $ 15,756.9 $ 15,377.4
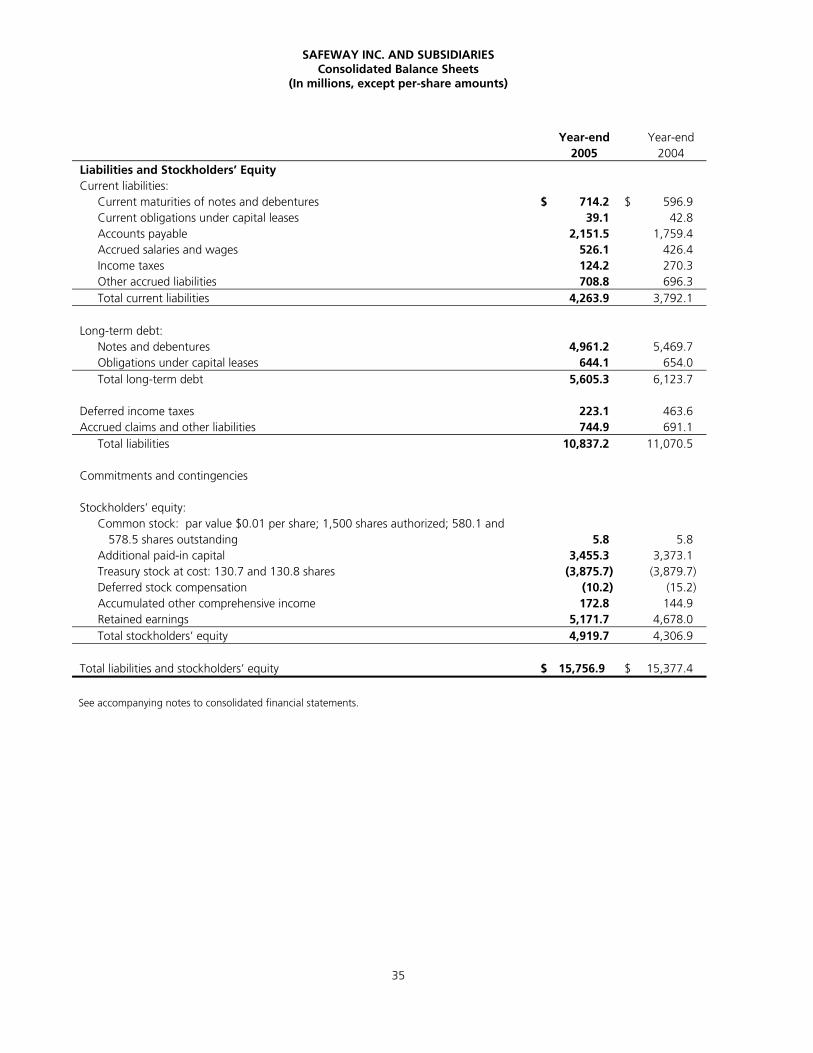
SAFEWAY INC. AND SUBSIDIARIESConsolidated Balance Sheets
(In millions, except per-share amounts)
35
Year-end2005
Year-end2004
Liabilities and Stockholders’ EquityCurrent liabilities:
Current maturities of notes and debentures $ 714.2 $ 596.9Current obligations under capital leases 39.1 42.8Accounts payable 2,151.5 1,759.4Accrued salaries and wages 526.1 426.4Income taxes 124.2 270.3Other accrued liabilities 708.8 696.3Total current liabilities 4,263.9 3,792.1
Long-term debt:Notes and debentures 4,961.2 5,469.7Obligations under capital leases 644.1 654.0Total long-term debt 5,605.3 6,123.7
Deferred income taxes 223.1 463.6Accrued claims and other liabilities 744.9 691.1
Total liabilities 10,837.2 11,070.5
Commitments and contingencies
Stockholders’ equity:Common stock: par value $0.01 per share; 1,500 shares authorized; 580.1 and
578.5 shares outstanding 5.8 5.8Additional paid-in capital 3,455.3 3,373.1Treasury stock at cost: 130.7 and 130.8 shares (3,875.7) (3,879.7)Deferred stock compensation (10.2) (15.2)Accumulated other comprehensive income 172.8 144.9Retained earnings 5,171.7 4,678.0Total stockholders’ equity 4,919.7 4,306.9
Total liabilities and stockholders’ equity $ 15,756.9 $ 15,377.4
See accompanying notes to consolidated financial statements.
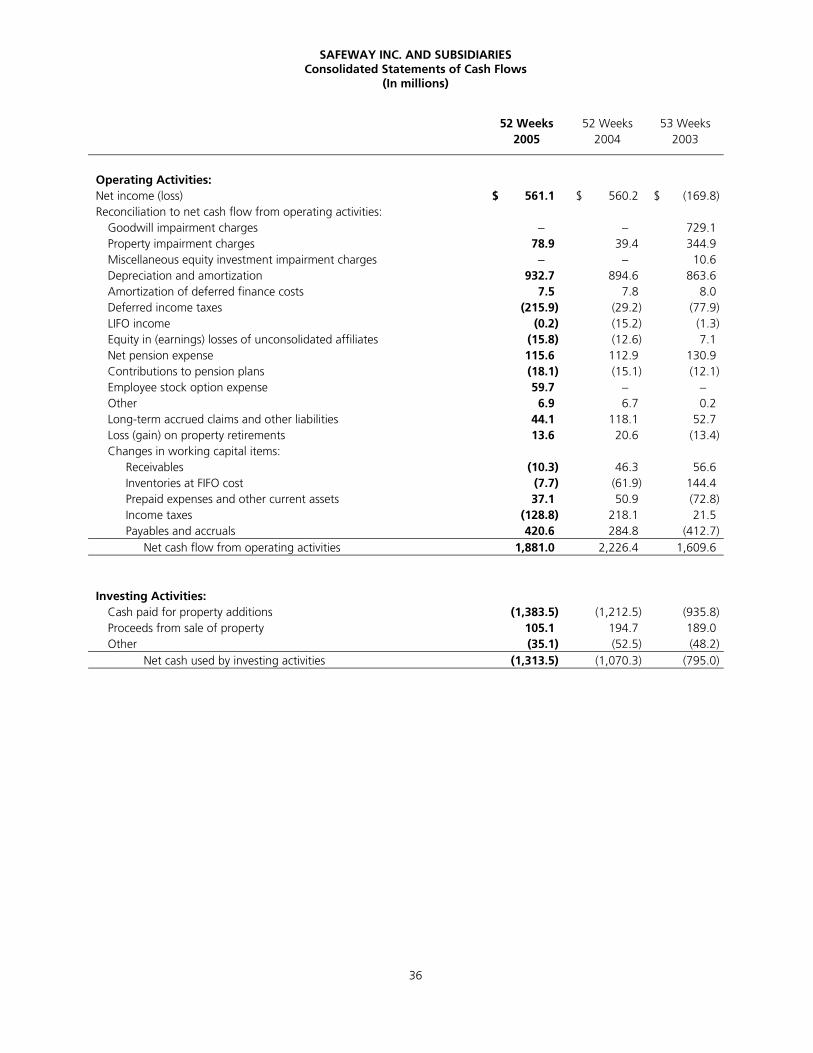
SAFEWAY INC. AND SUBSIDIARIESConsolidated Statements of Cash Flows
(In millions)
36
52 Weeks2005
52 Weeks2004
53 Weeks2003
Operating Activities:Net income (loss) $ 561.1 $ 560.2 $ (169.8)Reconciliation to net cash flow from operating activities:
Goodwill impairment charges − − 729.1Property impairment charges 78.9 39.4 344.9Miscellaneous equity investment impairment charges − − 10.6Depreciation and amortization 932.7 894.6 863.6Amortization of deferred finance costs 7.5 7.8 8.0Deferred income taxes (215.9) (29.2) (77.9)LIFO income (0.2) (15.2) (1.3)Equity in (earnings) losses of unconsolidated affiliates (15.8) (12.6) 7.1Net pension expense 115.6 112.9 130.9Contributions to pension plans (18.1) (15.1) (12.1)Employee stock option expense 59.7 − −Other 6.9 6.7 0.2Long-term accrued claims and other liabilities 44.1 118.1 52.7Loss (gain) on property retirements 13.6 20.6 (13.4)Changes in working capital items:
Receivables (10.3) 46.3 56.6Inventories at FIFO cost (7.7) (61.9) 144.4Prepaid expenses and other current assets 37.1 50.9 (72.8)Income taxes (128.8) 218.1 21.5Payables and accruals 420.6 284.8 (412.7)
Net cash flow from operating activities 1,881.0 2,226.4 1,609.6
Investing Activities:Cash paid for property additions (1,383.5) (1,212.5) (935.8)Proceeds from sale of property 105.1 194.7 189.0Other (35.1) (52.5) (48.2)
Net cash used by investing activities (1,313.5) (1,070.3) (795.0)
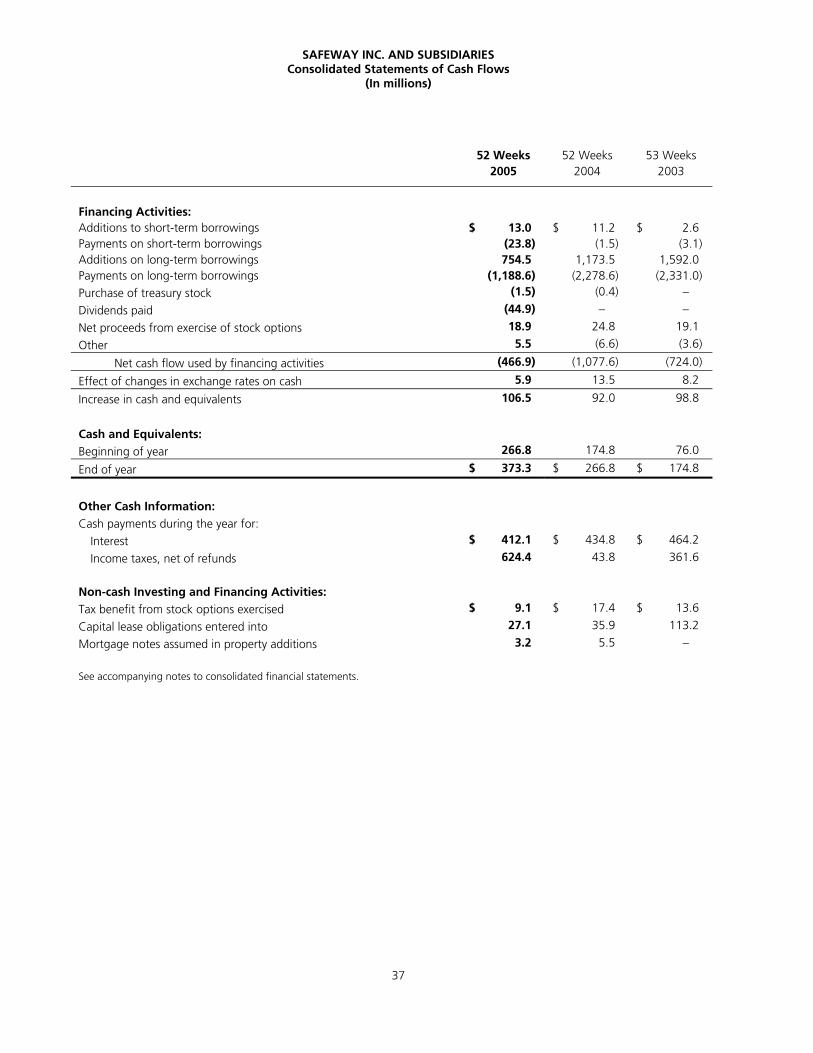
SAFEWAY INC. AND SUBSIDIARIESConsolidated Statements of Cash Flows
(In millions)
37
52 Weeks2005
52 Weeks2004
53 Weeks2003
Financing Activities:Additions to short-term borrowings $ 13.0 $ 11.2 $ 2.6Payments on short-term borrowings (23.8) (1.5) (3.1)Additions on long-term borrowings 754.5 1,173.5 1,592.0Payments on long-term borrowings (1,188.6) (2,278.6) (2,331.0)
Purchase of treasury stock (1.5) (0.4) −Dividends paid (44.9) − −Net proceeds from exercise of stock options 18.9 24.8 19.1
Other 5.5 (6.6) (3.6)
Net cash flow used by financing activities (466.9) (1,077.6) (724.0)
Effect of changes in exchange rates on cash 5.9 13.5 8.2
Increase in cash and equivalents 106.5 92.0 98.8
Cash and Equivalents:Beginning of year 266.8 174.8 76.0
End of year $ 373.3 $ 266.8 $ 174.8
Other Cash Information:Cash payments during the year for:
Interest $ 412.1 $ 434.8 $ 464.2
Income taxes, net of refunds 624.4 43.8 361.6
Non-cash Investing and Financing Activities:Tax benefit from stock options exercised $ 9.1 $ 17.4 $ 13.6
Capital lease obligations entered into 27.1 35.9 113.2
Mortgage notes assumed in property additions 3.2 5.5 −
See accompanying notes to consolidated financial statements.
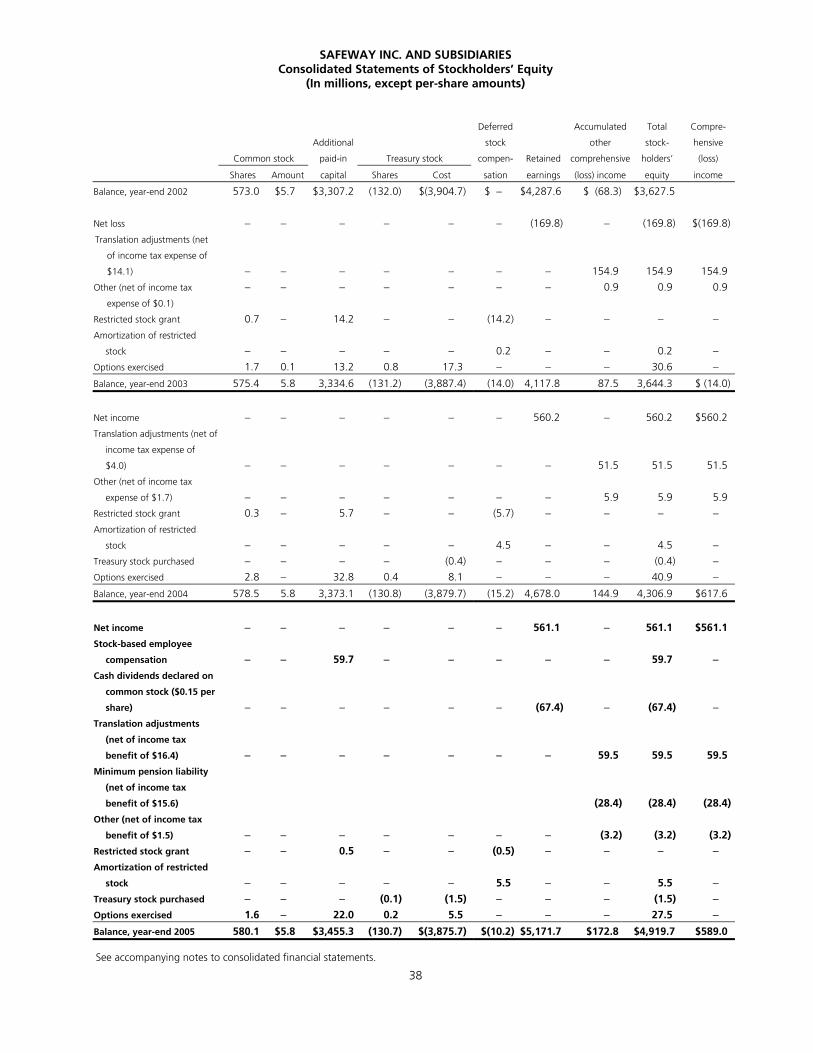
SAFEWAY INC. AND SUBSIDIARIESConsolidated Statements of Stockholders’ Equity
(In millions, except per-share amounts)
38
Deferred Accumulated Total Compre-
Additional stock other stock- hensive
Common stock paid-in Treasury stock compen- Retained comprehensive holders’ (loss)
Shares Amount capital Shares Cost sation earnings (loss) income equity income
Balance, year-end 2002 573.0 $5.7 $3,307.2 (132.0) $(3,904.7) $ − $4,287.6 $ (68.3) $3,627.5
Net loss − − − − − − (169.8) − (169.8) $(169.8)
Translation adjustments (net
of income tax expense of
$14.1) − − − − − − − 154.9 154.9 154.9
Other (net of income tax
expense of $0.1)
− − − − − − − 0.9 0.9 0.9
Restricted stock grant 0.7 − 14.2 − − (14.2) − − − −Amortization of restricted
stock − − − − − 0.2 − − 0.2 −Options exercised 1.7 0.1 13.2 0.8 17.3 − − − 30.6 −Balance, year-end 2003 575.4 5.8 3,334.6 (131.2) (3,887.4) (14.0) 4,117.8 87.5 3,644.3 $ (14.0)
Net income − − − − − − 560.2 − 560.2 $560.2
Translation adjustments (net of
income tax expense of
$4.0) − − − − − − − 51.5 51.5 51.5
Other (net of income tax
expense of $1.7) − − − − − − − 5.9 5.9 5.9
Restricted stock grant 0.3 − 5.7 − − (5.7) − − − −Amortization of restricted
stock − − − − − 4.5 − − 4.5 −Treasury stock purchased − − − − (0.4) − − − (0.4) −Options exercised 2.8 − 32.8 0.4 8.1 − − − 40.9 −Balance, year-end 2004 578.5 5.8 3,373.1 (130.8) (3,879.7) (15.2) 4,678.0 144.9 4,306.9 $617.6
Net income − − − − − − 561.1 − 561.1 $561.1
Stock-based employee
compensation − − 59.7 − − − − − 59.7 −Cash dividends declared on
common stock ($0.15 per
share) − − − − − − (67.4) − (67.4) −Translation adjustments
(net of income tax
benefit of $16.4) − − − − − − − 59.5 59.5 59.5
Minimum pension liability
(net of income tax
benefit of $15.6) (28.4) (28.4) (28.4)
Other (net of income tax
benefit of $1.5) − − − − − − − (3.2) (3.2) (3.2)
Restricted stock grant − − 0.5 − − (0.5) − − − −Amortization of restricted
stock − − − − − 5.5 − − 5.5 −Treasury stock purchased − − − (0.1) (1.5) − − − (1.5) −Options exercised 1.6 − 22.0 0.2 5.5 − − − 27.5 −Balance, year-end 2005 580.1 $5.8 $3,455.3 (130.7) $(3,875.7) $(10.2) $5,171.7 $172.8 $4,919.7 $589.0
See accompanying notes to consolidated financial statements.
SAFEWAY INC. AND SUBSIDIARIESNotes to Consolidated Financial Statements
39
Note A: The Company and Significant Accounting Policies
The Company Safeway Inc. (“Safeway” or the “Company”) is one of the largest food and drug retailers in North America,with 1,775 stores as of year-end 2005. Safeway’s U.S. retail operations are located principally in California, Oregon,Washington, Alaska, Colorado, Arizona, Texas, the Chicago metropolitan area and the Mid-Atlantic region. The Company’sCanadian retail operations are located principally in British Columbia, Alberta and Manitoba/Saskatchewan. In support of itsretail operations, the Company has an extensive network of distribution, manufacturing and food processing facilities. TheCompany also has a 49% ownership interest in Casa Ley, S.A. de C.V. (“Casa Ley”), which operates 119 food and generalmerchandise stores in Western Mexico. In addition, Safeway has a strategic alliance with and a 56% ownership interest inGroceryWorks Holdings, Inc. (“GroceryWorks”), an Internet grocer.
Basis of Presentation The consolidated financial statements include Safeway Inc., a Delaware corporation, and all majority-owned subsidiaries and have been prepared in accordance with accounting principles generally accepted in the United Statesof America. All significant intercompany transactions and balances have been eliminated in consolidation. The Company’sinvestment in Casa Ley is reported using the equity method and is recorded on a one-month delay basis because financialinformation for the latest month is not available from Casa Ley in time to be included in Safeway’s consolidated results untilthe following reporting period.
Fiscal Year The Company's fiscal year ends on the Saturday nearest December 31. The last three fiscal years consist of the52-week period ended December 31, 2005 (fiscal 2005), the 52-week period ended January 1, 2005 (fiscal 2004) and the53-week period ended January 3, 2004 (fiscal 2003).
Reclassifications Certain prior year amounts were reclassified to conform to the 2005 presentation.
Revenue Recognition Revenue is recognized at the point of sale for retail sales. Discounts provided to customers inconnection with loyalty cards are accounted for as a reduction of sales.
Cost of Goods Sold Cost of goods sold includes cost of inventory sold during the period, including purchase anddistribution costs. These costs include inbound freight charges, purchasing and receiving costs, warehouse inspection costs,warehousing costs and other costs of Safeway’s distribution network. Advertising and promotional expenses are alsoincluded as a component of cost of goods sold. Such costs are expensed in the period the advertisement occurs. Advertisingand promotional expenses totaled $523.7 million in 2005, $487.8 million in 2004 and $419.9 million in 2003.
Vendor allowances totaled $2.4 billion in 2005 and $2.2 billion each in 2004 and 2003. Vendor allowances can be groupedinto the following broad categories: promotional allowances, slotting allowances, and contract allowances. All vendorallowances are classified as an element of cost of goods sold.
Promotional allowances make up nearly three-quarters of all allowances. With promotional allowances vendors pay Safewayto promote their product. The promotion may be any combination of a temporary price reduction, a feature in print ads, afeature in a Safeway circular, or a preferred location in the store. The promotions are typically one to two weeks long.
Slotting allowances are a small portion of total allowances (typically less than 5% of all allowances). With slottingallowances, the vendor reimburses Safeway for the cost of placing new product on the shelf. Safeway has no obligation orcommitment to keep the product on the shelf for a minimum period.
Contract allowances make up the remainder of all allowances. Under a typical contract allowance, a vendor pays Safeway tokeep product on the shelf for a minimum period of time or when volume thresholds are achieved.
Slotting and promotional allowances are accounted for as a reduction in the cost of purchased inventory and recognizedwhen the related inventory is sold. Contract allowances are recognized as a reduction in the cost of goods sold as volumethresholds are achieved or through the passage of time.
Use of Estimates The preparation of financial statements, in conformity with accounting principles generally accepted in
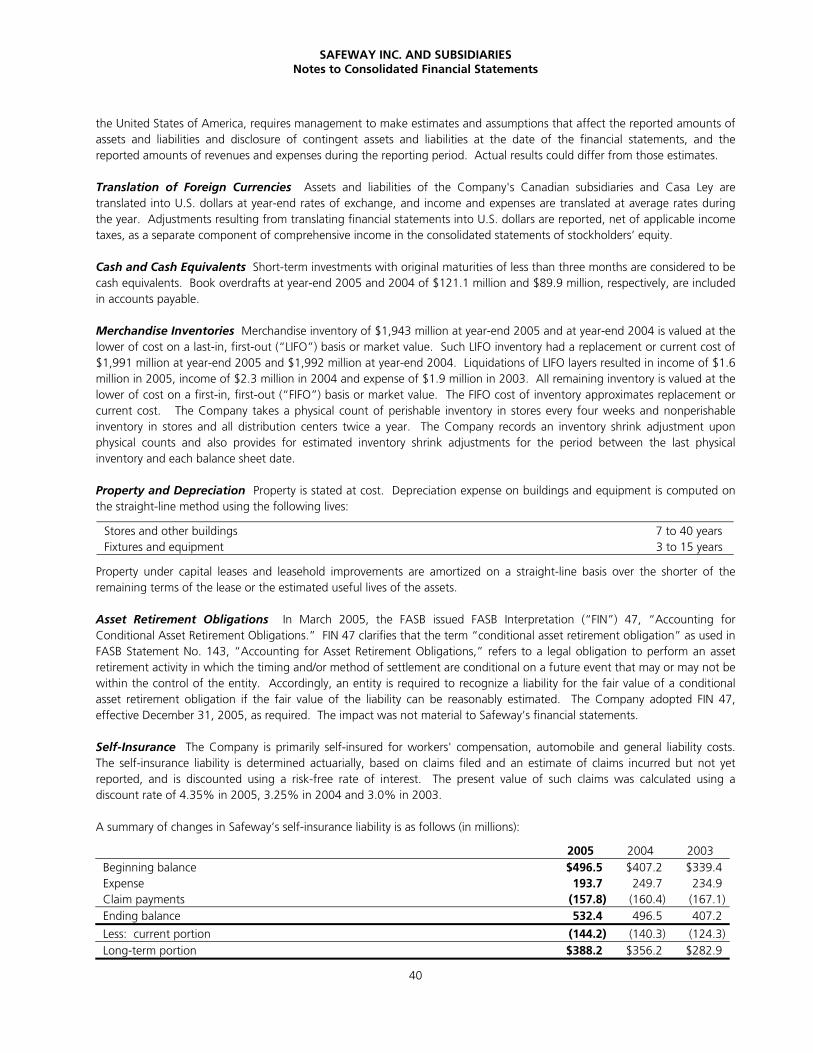
SAFEWAY INC. AND SUBSIDIARIESNotes to Consolidated Financial Statements
40
the United States of America, requires management to make estimates and assumptions that affect the reported amounts ofassets and liabilities and disclosure of contingent assets and liabilities at the date of the financial statements, and thereported amounts of revenues and expenses during the reporting period. Actual results could differ from those estimates.
Translation of Foreign Currencies Assets and liabilities of the Company's Canadian subsidiaries and Casa Ley aretranslated into U.S. dollars at year-end rates of exchange, and income and expenses are translated at average rates duringthe year. Adjustments resulting from translating financial statements into U.S. dollars are reported, net of applicable incometaxes, as a separate component of comprehensive income in the consolidated statements of stockholders’ equity.
Cash and Cash Equivalents Short-term investments with original maturities of less than three months are considered to becash equivalents. Book overdrafts at year-end 2005 and 2004 of $121.1 million and $89.9 million, respectively, are includedin accounts payable.
Merchandise Inventories Merchandise inventory of $1,943 million at year-end 2005 and at year-end 2004 is valued at thelower of cost on a last-in, first-out (“LIFO”) basis or market value. Such LIFO inventory had a replacement or current cost of$1,991 million at year-end 2005 and $1,992 million at year-end 2004. Liquidations of LIFO layers resulted in income of $1.6million in 2005, income of $2.3 million in 2004 and expense of $1.9 million in 2003. All remaining inventory is valued at thelower of cost on a first-in, first-out (“FIFO”) basis or market value. The FIFO cost of inventory approximates replacement orcurrent cost. The Company takes a physical count of perishable inventory in stores every four weeks and nonperishableinventory in stores and all distribution centers twice a year. The Company records an inventory shrink adjustment uponphysical counts and also provides for estimated inventory shrink adjustments for the period between the last physicalinventory and each balance sheet date.
Property and Depreciation Property is stated at cost. Depreciation expense on buildings and equipment is computed onthe straight-line method using the following lives:
Stores and other buildings 7 to 40 yearsFixtures and equipment 3 to 15 years
Property under capital leases and leasehold improvements are amortized on a straight-line basis over the shorter of theremaining terms of the lease or the estimated useful lives of the assets.
Asset Retirement Obligations In March 2005, the FASB issued FASB Interpretation (“FIN”) 47, “Accounting forConditional Asset Retirement Obligations.” FIN 47 clarifies that the term “conditional asset retirement obligation” as used inFASB Statement No. 143, “Accounting for Asset Retirement Obligations,” refers to a legal obligation to perform an assetretirement activity in which the timing and/or method of settlement are conditional on a future event that may or may not bewithin the control of the entity. Accordingly, an entity is required to recognize a liability for the fair value of a conditionalasset retirement obligation if the fair value of the liability can be reasonably estimated. The Company adopted FIN 47,effective December 31, 2005, as required. The impact was not material to Safeway’s financial statements.
Self-Insurance The Company is primarily self-insured for workers' compensation, automobile and general liability costs.The self-insurance liability is determined actuarially, based on claims filed and an estimate of claims incurred but not yetreported, and is discounted using a risk-free rate of interest. The present value of such claims was calculated using adiscount rate of 4.35% in 2005, 3.25% in 2004 and 3.0% in 2003.
A summary of changes in Safeway’s self-insurance liability is as follows (in millions):
2005 2004 2003Beginning balance $496.5 $407.2 $339.4Expense 193.7 249.7 234.9Claim payments (157.8) (160.4) (167.1)Ending balance 532.4 496.5 407.2
Less: current portion (144.2) (140.3) (124.3)Long-term portion $388.2 $356.2 $282.9
SAFEWAY INC. AND SUBSIDIARIESNotes to Consolidated Financial Statements
41
The current portion of the self-insurance liability is included in other accrued liabilities, and the long-term portion is includedin accrued claims and other liabilities in the consolidated balance sheets. The total undiscounted liability was $634.3 millionat year-end 2005 and $558.8 million at year-end 2004.
Rent Holidays Certain of the Company’s operating leases contain rent holidays. For these leases, Safeway recognizes therelated rent expense on a straight-line basis at the earlier of the first rent payment or the date of possession of the leasedproperty. The difference between the amounts charged to expense and the rent paid is recorded as deferred lease incentivesand amortized over the lease term.
Construction Allowances As part of certain lease agreements, the Company receives construction allowances fromlandlords. The construction allowances are deferred and amortized on a straight-line basis over the life of the lease as areduction to rent expense.
Income Taxes The Company provides income tax expense or benefit in accordance with Statement of Financial AccountingStandards (“SFAS”) No. 109, “Accounting for Income Taxes.” Deferred income taxes represent future net tax effectsresulting from temporary differences between the financial statement and tax basis of assets and liabilities using enacted taxrates in effect for the year in which the differences are expected to reverse.
Income Tax Contingencies The Company is subject to periodic audits by the Internal Revenue Service and other foreign,state and local taxing authorities. These audits may challenge certain of the Company’s tax positions such as the timing andamount of deductions and allocation of taxable income to the various tax jurisdictions. Loss and gain contingencies areaccounted for in accordance with SFAS No. 5, “Accounting for Contingencies,” and may require significant managementjudgment in estimating final outcomes. Actual results could materially differ from these estimates and could significantlyaffect the effective tax rate and cash flows in future years.
Off-Balance Sheet Financial Instruments The Company has, from time to time, entered into interest rate swapagreements to change its portfolio mix of fixed- and floating-rate debt to more desirable levels. Interest rate swapagreements involve the exchange with a counterparty of fixed- and floating-rate interest payments periodically over the lifeof the agreements without exchange of the underlying notional principal amounts. The differential to be paid or received isrecognized over the life of the agreements as an adjustment to interest expense. The Company's counterparties have beenmajor financial institutions.
Fair Value of Financial Instruments Generally accepted accounting principles require the disclosure of the fair value ofcertain financial instruments, whether or not recognized in the balance sheet, for which it is practicable to estimate fairvalue. The Company estimated the fair values presented below using appropriate valuation methodologies and marketinformation available as of year-end. Considerable judgment is required to develop estimates of fair value, and the estimatespresented are not necessarily indicative of the amounts that the Company could realize in a current market exchange. Theuse of different market assumptions or estimation methodologies could have a material effect on the estimated fair values.Additionally, the fair values were estimated at year-end, and current estimates of fair value may differ significantly from theamounts presented.
The following methods and assumptions were used to estimate the fair value of each class of financial instruments:
Cash and equivalents, accounts receivable, accounts payable and short-term debt. The carrying amount of these itemsapproximates fair value.
Long-term debt. Market values quoted on the New York Stock Exchange are used to estimate the fair value of publiclytraded debt. To estimate the fair value of debt issues that are not quoted on an exchange, the Company uses those interestrates that are currently available to it for issuance of debt with similar terms and remaining maturities. At year-end 2005, theestimated fair value of debt was $5.8 billion compared to a carrying value of $5.7 billion. At year-end 2004, the estimatedfair value of debt was $6.4 billion compared to a carrying value of $6.1 billion.
Interest rate swaps. Interest rate swaps, under which the Company agrees to pay variable rates of interest, are designated as
SAFEWAY INC. AND SUBSIDIARIESNotes to Consolidated Financial Statements
42
fair value hedges of fixed-rate debt. For these fair value hedges that qualify for hedge accounting treatment, Safeway usesthe short-cut method, and thus, there are no gains or losses recognized due to hedge ineffectiveness. Unrealized gains orlosses from changes in the value of fair value hedges are offset by changes in the fair value of the hedged underlying debt.
Store Closing and Impairment Charges Safeway regularly reviews its stores’ operating performance and assesses theCompany’s plans for certain store and plant closures. In accordance with SFAS No. 144, “Accounting for the Impairment orDisposal of Long-Lived Assets,” losses related to the impairment of long-lived assets are recognized when expected futurecash flows are less than the asset's carrying value. At the time a store is closed or because of changes in circumstances thatindicate the carrying value of an asset may not be recoverable, the Company evaluates the carrying value of the assets inrelation to its expected future cash flows. If the carrying value is greater than the future cash flows, a provision is made forthe impairment of the assets to write the assets down to estimated fair value. Fair value is determined by estimating netfuture cash flows, discounted using a risk-adjusted rate of return. The Company calculates impairment on a store-by-storebasis. These provisions are recorded as a component of operating and administrative expense and are disclosed in Note C.
When stores that are under long-term leases close, the Company records a liability for the future minimum lease paymentsand related ancillary costs, net of estimated cost recoveries that may be achieved through subletting properties or throughfavorable lease terminations, discounted using a risk-adjusted rate of interest. This liability is recorded at the time the store isclosed. Activity included in the reserve for store lease exit costs is disclosed in Note C.
Stock-Based Employee Compensation Safeway elected to early adopt SFAS No. 123R (revised 2004), “Share-BasedPayment” (“SFAS No. 123R”) in the first quarter of 2005 using the modified prospective method. SFAS No. 123R requires allshare-based payments to employees, including grants of employee stock options, to be recognized in the financialstatements as compensation cost based on the fair value on the date of grant. The Company determines fair value of suchawards using the Black-Scholes option pricing model. The Black-Scholes option pricing model incorporates certainassumptions, such as risk-free interest rate, expected volatility, expected dividend yield and expected life of options, in orderto arrive at a fair value estimate.
Prior to January 2, 2005, Safeway accounted for stock-based awards to employees using the intrinsic value method inaccordance with Accounting Principles Board Opinion No. 25, “Accounting for Stock Issued to Employees.” The followingtable illustrates the effect on net income (loss) and earnings (loss) per share for fiscal 2004 and fiscal 2003 if the Companyhad applied the fair value recognition provisions of SFAS No. 123, as amended by SFAS No. 148 (in millions, except per-shareamounts):
2004 2003
Net income (loss) – as reported $560.2 $(169.8)Add: Stock-based employee compensation expense included in reported net income, net of
related tax effects 2.8 0.1Less: Total stock-based employee compensation expense determined under fair value based
method for all awards, net of related tax effects (47.6) (51.2)Net income (loss) – pro forma $515.4 $(220.9)
Basic earnings (loss) per share:As reportedPro forma
$1.261.16
$(0.38)(0.50)
Diluted earnings (loss) per share:As reportedPro forma
$1.251.15
$(0.38)(0.50)
New Accounting Standards
In May 2005, the Financial Accounting Standards Board (“FASB”) issued Statement of Financial Accounting Standards(“SFAS”) No. 154, “Accounting Changes and Error Corrections.” SFAS No. 154 requires restatement of prior periods’financial statements for changes in accounting principle, unless it is impracticable to determine either the period-specific
SAFEWAY INC. AND SUBSIDIARIESNotes to Consolidated Financial Statements
43
effects or the cumulative effect of the change. Also, SFAS No. 154 requires that retrospective application of a change inaccounting principle be limited to the direct effects of the change. SFAS No. 154 is effective for accounting changes andcorrections of errors made in fiscal years beginning after December 15, 2005.
In November 2004, the FASB issued SFAS No. 151, “Inventory Costs.” SFAS No. 151 clarifies the accounting for abnormalamounts of idle facility expense, freight, handling costs, and wasted material (spoilage) and requires that these items berecognized as current-period charges. In addition, SFAS No. 151 requires that allocation of fixed production overhead toconversion costs be based on the normal capacity of the production facilities. SFAS No. 151 is effective for inventory costsincurred during fiscal years beginning after June 15, 2005. SFAS No. 151 is not expected to have a material effect on theCompany’s financial statements.
Note B: Goodwill
A summary of changes in Safeway's goodwill during 2005 and 2004 by geographic area is as follows (in millions):
2005 2004
U.S. Canada Total U.S. Canada Total
Balance – beginning of year $ 2,325.6 $ 81.0 $ 2,406.6 $ 2,328.3 $ 76.6 $ 2,404.9Other adjustments (7.8) (1) 3.6 (2) (4.2) (2.7) (1) 4.4 (2) 1.7Balance – end of year $ 2,317.8 $ 84.6 $ 2,402.4 $ 2,325.6 $ 81.0 $ 2,406.6
(1) Primarily represents revised estimate of pre-acquisition tax accrual.
(2) Represents foreign currency translation adjustments in Canada.
The Company accounts for goodwill in accordance with SFAS No. 142, “Goodwill and Other Intangible Assets.” In November2002, Safeway announced the decision to sell Dominick’s and exit the Chicago market due to labor issues. In the first 36weeks of 2003, Safeway reduced the carrying value of Dominick’s in part by writing down $256.5 million of goodwill, basedon indications of value received during the sale process. In November 2003, Safeway announced that it was takingDominick’s off the market. As a result, in the fourth quarter of 2003, Safeway incurred an additional goodwill impairmentcharge of $24.9 million relating to Dominick’s.
Also in the fourth quarter of 2003, Safeway performed its annual review of goodwill. Fair value was determined based on avaluation study performed by an independent third party which primarily considered the discounted cash flow and guidelinecompany method. As a result of this annual review, Safeway recorded an impairment charge for Randall’s goodwill of$447.7 million. The additional charges reflect declining multiples in the retail grocery industry and operating performance.There was no remaining goodwill for Dominick’s or Randall’s on Safeway’s consolidated balance sheet at year-end 2003.
Safeway completed its annual impairment tests in the fourth quarters of 2004 and 2005. Fair value was determined basedon a valuation study performed by an independent third party which primarily considered the discounted cash flow andguideline company method. As a result of these annual reviews, Safeway concluded that no impairment charge wasrequired.
Note C: Store Closing and Impairment Charges
Impairment Write-Downs Safeway recognized impairment charges on the write-down of long-lived assets of $78.9million in 2005, $39.4 million in 2004 and $344.9 million in 2003. This includes Randall’s impairment charges of $54.7million in 2005 and Dominick’s impairment charges of $311.4 million in 2003. These charges are included as a componentof operating and administrative expense.
In November 2002, Safeway announced the decision to sell Dominick’s and exit the Chicago market due to labor issues. Inthe first 36 weeks of 2003, Safeway reduced the carrying value of Dominick’s in part by writing down $120.7 million of
SAFEWAY INC. AND SUBSIDIARIESNotes to Consolidated Financial Statements
44
long-lived assets, based on indications of value received during the sale process. In November 2003, Safeway announcedthat it was taking Dominick’s off the market. Safeway reclassified Dominick’s from an “asset held for sale” to “asset heldand used” and adjusted Dominick’s individual long-lived assets to the lower of cost or fair value. As a result, in the fourthquarter of 2003, Safeway incurred a pre-tax, long-lived asset impairment charge of $190.7 million.
Store Lease Exit Costs The reserve for store lease exit costs includes the following activity for 2005, 2004 and 2003 (inmillions):
2005 2004 2003
Beginning balance $167.1 $129.1 $132.1Provision for estimated net future cash flows of additional closed stores (1) 67.3 55.1 3.7Net cash flows, interest accretion, changes in estimates of net future cash flows (36.7) (17.1) (6.7)Ending balance $197.7 $167.1 $129.1
(1) Estimated net future cash flows represents future minimum lease payments and related ancillary costs from the date of closure to the
end of the remaining lease term, net of estimated cost recoveries that may be achieved through subletting properties or through
favorable lease terminations.
Store lease exit costs are included as a component of operating and administrative expense and the liability is included inaccrued claims and other liabilities.
Store lease exit costs related to the Furr’s and Homeland bankruptcies are not included above but are discussed in Note K.
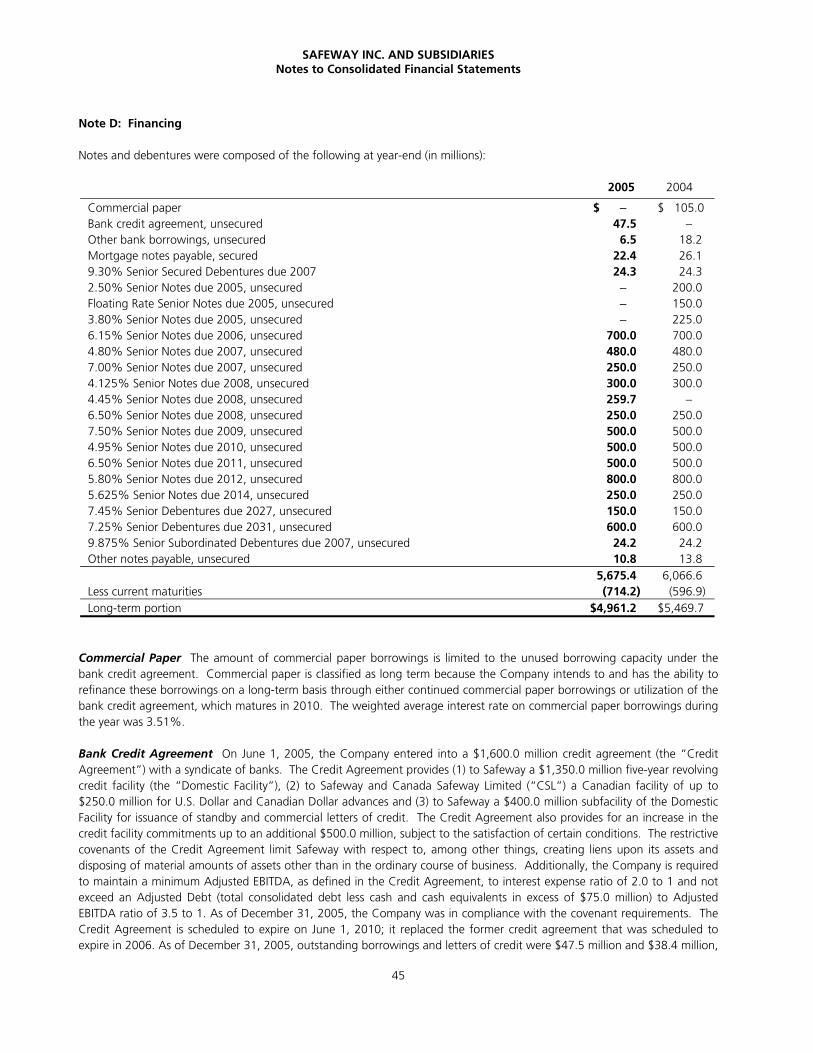
SAFEWAY INC. AND SUBSIDIARIESNotes to Consolidated Financial Statements
45
Note D: Financing
Notes and debentures were composed of the following at year-end (in millions):
Commercial Paper The amount of commercial paper borrowings is limited to the unused borrowing capacity under thebank credit agreement. Commercial paper is classified as long term because the Company intends to and has the ability torefinance these borrowings on a long-term basis through either continued commercial paper borrowings or utilization of thebank credit agreement, which matures in 2010. The weighted average interest rate on commercial paper borrowings duringthe year was 3.51%.
Bank Credit Agreement On June 1, 2005, the Company entered into a $1,600.0 million credit agreement (the “CreditAgreement”) with a syndicate of banks. The Credit Agreement provides (1) to Safeway a $1,350.0 million five-year revolvingcredit facility (the “Domestic Facility”), (2) to Safeway and Canada Safeway Limited (“CSL”) a Canadian facility of up to$250.0 million for U.S. Dollar and Canadian Dollar advances and (3) to Safeway a $400.0 million subfacility of the DomesticFacility for issuance of standby and commercial letters of credit. The Credit Agreement also provides for an increase in thecredit facility commitments up to an additional $500.0 million, subject to the satisfaction of certain conditions. The restrictivecovenants of the Credit Agreement limit Safeway with respect to, among other things, creating liens upon its assets anddisposing of material amounts of assets other than in the ordinary course of business. Additionally, the Company is requiredto maintain a minimum Adjusted EBITDA, as defined in the Credit Agreement, to interest expense ratio of 2.0 to 1 and notexceed an Adjusted Debt (total consolidated debt less cash and cash equivalents in excess of $75.0 million) to AdjustedEBITDA ratio of 3.5 to 1. As of December 31, 2005, the Company was in compliance with the covenant requirements. TheCredit Agreement is scheduled to expire on June 1, 2010; it replaced the former credit agreement that was scheduled toexpire in 2006. As of December 31, 2005, outstanding borrowings and letters of credit were $47.5 million and $38.4 million,
2005 2004
Commercial paper $ − $ 105.0Bank credit agreement, unsecured 47.5 −Other bank borrowings, unsecured 6.5 18.2Mortgage notes payable, secured 22.4 26.19.30% Senior Secured Debentures due 2007 24.3 24.32.50% Senior Notes due 2005, unsecured − 200.0Floating Rate Senior Notes due 2005, unsecured − 150.03.80% Senior Notes due 2005, unsecured − 225.06.15% Senior Notes due 2006, unsecured 700.0 700.04.80% Senior Notes due 2007, unsecured 480.0 480.07.00% Senior Notes due 2007, unsecured 250.0 250.04.125% Senior Notes due 2008, unsecured 300.0 300.04.45% Senior Notes due 2008, unsecured 259.7 −6.50% Senior Notes due 2008, unsecured 250.0 250.07.50% Senior Notes due 2009, unsecured 500.0 500.04.95% Senior Notes due 2010, unsecured 500.0 500.06.50% Senior Notes due 2011, unsecured 500.0 500.05.80% Senior Notes due 2012, unsecured 800.0 800.05.625% Senior Notes due 2014, unsecured 250.0 250.07.45% Senior Debentures due 2027, unsecured 150.0 150.07.25% Senior Debentures due 2031, unsecured 600.0 600.09.875% Senior Subordinated Debentures due 2007, unsecured 24.2 24.2Other notes payable, unsecured 10.8 13.8
5,675.4 6,066.6Less current maturities (714.2) (596.9)Long-term portion $4,961.2 $5,469.7
SAFEWAY INC. AND SUBSIDIARIESNotes to Consolidated Financial Statements
46
respectively, under this agreement. Total unused borrowing capacity under the Credit Agreement was $1,514.1 million as ofDecember 31, 2005.
U.S. borrowings under the bank credit agreement carry interest at one of the following rates selected by the Company: (1)the prime rate; (2) a rate based on rates at which Eurodollar deposits are offered to first-class banks by the lenders in thebank credit agreement plus a pricing margin based on the Company's debt rating or interest coverage ratio (the “PricingMargin”); or (3) rates quoted at the discretion of the lenders. Canadian borrowings denominated in U.S. dollars carryinterest at one of the following rates selected by the Company: (a) the Canadian base rate; or (b) the Canadian Eurodollarrate plus the Pricing Margin. Canadian borrowings denominated in Canadian dollars carry interest at one of the followingrates selected by the Company: (1) the Canadian prime rate or (2) the rate for Canadian bankers acceptances plus the PricingMargin.
During 2005, the Company paid facility fees ranging from 0.11% to 0.145% on the total amount of the former credit facilityuntil it expired on May 31, 2005. Starting June 1, 2005, the Company paid facility fees of 0.10% under the new CreditAgreement.
Other Bank Borrowings Other bank borrowings at year-end 2005 mature during 2006 and had a weighted averageinterest rate during 2005 of 5.91%.
Mortgage Notes Payable Mortgage notes payable at year-end 2005 have remaining terms ranging from one to 18 years,had a weighted average interest rate during 2005 of 8.59% and are secured by properties with a net book value ofapproximately $167.5 million.
Senior Secured Indebtedness The 9.30% Senior Secured Debentures due 2007 are secured by a deed of trust thatcreated a lien on the land, buildings and equipment owned by Safeway at its distribution center in Tracy, California.
Senior Unsecured Indebtedness In November 2005, the Company issued senior unsecured debt in Canada consisting of$259.7 million (CAD300 million) of 4.45% Notes due 2008.
In August 2004, Safeway issued senior unsecured debt securities consisting of $500.0 million of 4.95% Notes due 2010 and$250 million of 5.625% Notes due 2014.
In October 2003, Safeway issued senior unsecured debt facilities consisting of $150.0 million of Floating Rate Notes (LIBORplus 0.47%) due 2005, $200 million of 2.50% Notes due 2005 and $300 million of 4.125% Notes due 2008.
Senior Subordinated Indebtedness The 9.875% Senior Subordinated Debentures due 2007 are subordinated in right ofpayment to, among other things, the Company's borrowings under the Credit Agreement, the 9.30% Senior SecuredDebentures, the senior unsecured indebtedness and mortgage notes payable.
Other Notes Payable Other notes payable at year-end 2005 have remaining terms ranging from six months to 17 yearsand a weighted average interest rate of 2.62% during 2005.
Fair Value Hedges The Company effectively converted $500 million of its 4.95% fixed-rate debt to floating-rate debtthrough an interest swap agreement in 2004. In 2003, the Company effectively converted $300.0 million of its 4.125%fixed-rate debt to floating-rate debt through an interest rate swap agreement. These swaps are designated as fair valuehedges of fixed-rate debt. For these fair value hedges that qualify for hedge accounting treatment, Safeway uses the short-cut method, and thus, there are no gains or losses recognized due to hedge ineffectiveness. Unrealized gains or losses fromchanges in the value of fair value hedges are offset by changes in the fair value of the hedged underlying debt.
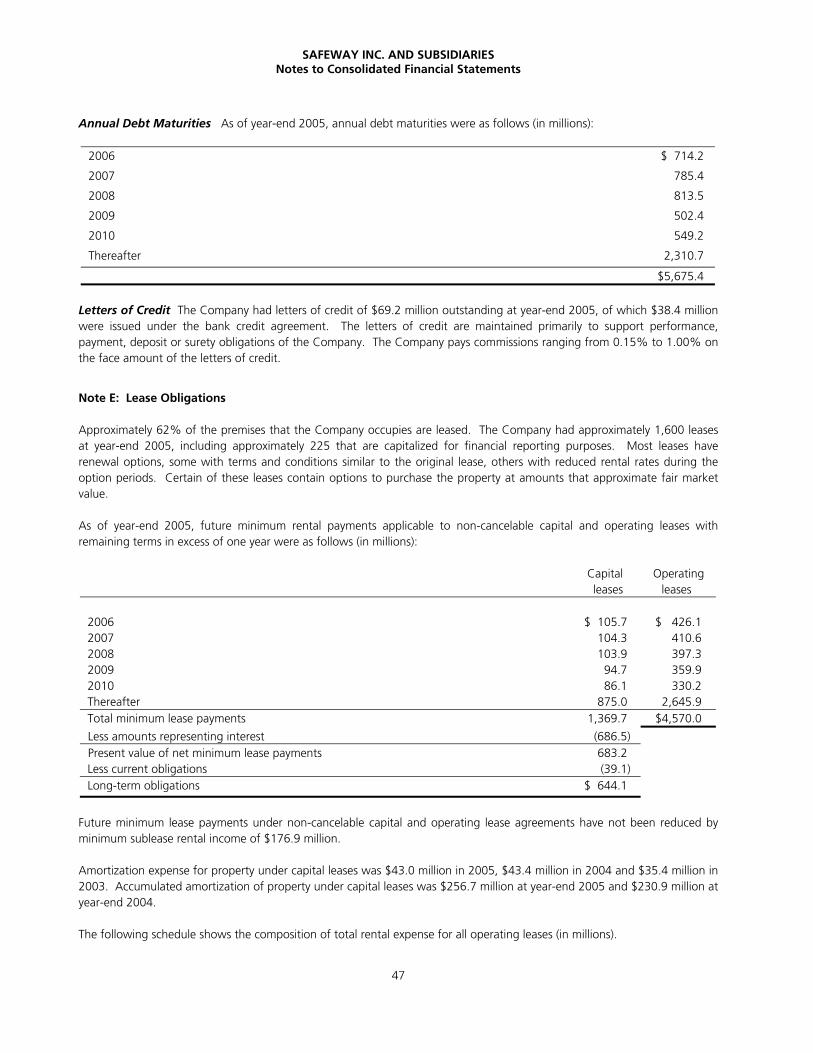
SAFEWAY INC. AND SUBSIDIARIESNotes to Consolidated Financial Statements
47
Annual Debt Maturities As of year-end 2005, annual debt maturities were as follows (in millions):
2006 $ 714.2
2007 785.4
2008 813.5
2009 502.4
2010 549.2
Thereafter 2,310.7
$5,675.4
Letters of Credit The Company had letters of credit of $69.2 million outstanding at year-end 2005, of which $38.4 millionwere issued under the bank credit agreement. The letters of credit are maintained primarily to support performance,payment, deposit or surety obligations of the Company. The Company pays commissions ranging from 0.15% to 1.00% onthe face amount of the letters of credit.
Note E: Lease Obligations
Approximately 62% of the premises that the Company occupies are leased. The Company had approximately 1,600 leasesat year-end 2005, including approximately 225 that are capitalized for financial reporting purposes. Most leases haverenewal options, some with terms and conditions similar to the original lease, others with reduced rental rates during theoption periods. Certain of these leases contain options to purchase the property at amounts that approximate fair marketvalue.
As of year-end 2005, future minimum rental payments applicable to non-cancelable capital and operating leases withremaining terms in excess of one year were as follows (in millions):
Capital Operatingleases leases
2006 $ 105.7 $ 426.12007 104.3 410.62008 103.9 397.32009 94.7 359.92010 86.1 330.2Thereafter 875.0 2,645.9Total minimum lease payments 1,369.7 $4,570.0
Less amounts representing interest (686.5)Present value of net minimum lease payments 683.2Less current obligations (39.1)Long-term obligations $ 644.1
Future minimum lease payments under non-cancelable capital and operating lease agreements have not been reduced byminimum sublease rental income of $176.9 million.
Amortization expense for property under capital leases was $43.0 million in 2005, $43.4 million in 2004 and $35.4 million in2003. Accumulated amortization of property under capital leases was $256.7 million at year-end 2005 and $230.9 million atyear-end 2004.
The following schedule shows the composition of total rental expense for all operating leases (in millions).
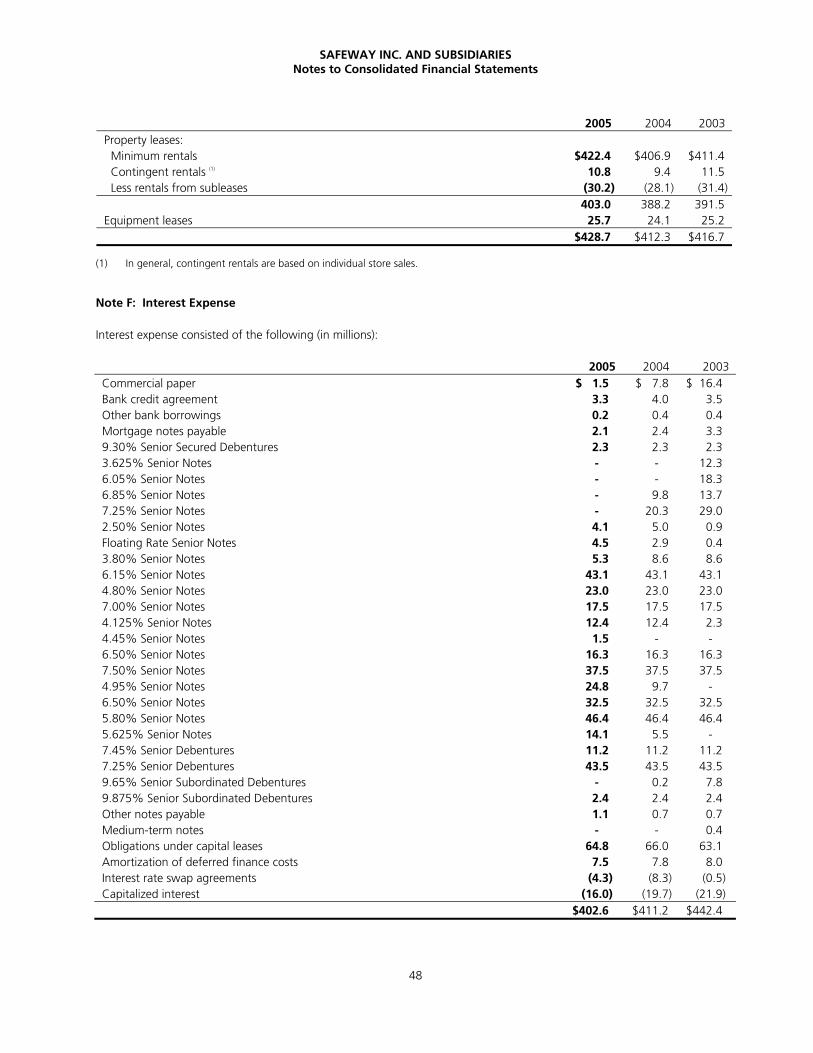
SAFEWAY INC. AND SUBSIDIARIESNotes to Consolidated Financial Statements
48
(1) In general, contingent rentals are based on individual store sales.
Note F: Interest Expense
Interest expense consisted of the following (in millions):
2005 2004 2003Property leases: Minimum rentals $422.4 $406.9 $411.4 Contingent rentals (1) 10.8 9.4 11.5 Less rentals from subleases (30.2) (28.1) (31.4)
403.0 388.2 391.5Equipment leases 25.7 24.1 25.2
$428.7 $412.3 $416.7
2005 2004 2003Commercial paper $ 1.5 $ 7.8 $ 16.4Bank credit agreement 3.3 4.0 3.5Other bank borrowings 0.2 0.4 0.4Mortgage notes payable 2.1 2.4 3.39.30% Senior Secured Debentures 2.3 2.3 2.33.625% Senior Notes - - 12.36.05% Senior Notes - - 18.36.85% Senior Notes - 9.8 13.77.25% Senior Notes - 20.3 29.02.50% Senior Notes 4.1 5.0 0.9Floating Rate Senior Notes 4.5 2.9 0.43.80% Senior Notes 5.3 8.6 8.66.15% Senior Notes 43.1 43.1 43.14.80% Senior Notes 23.0 23.0 23.07.00% Senior Notes 17.5 17.5 17.54.125% Senior Notes 12.4 12.4 2.34.45% Senior Notes 1.5 - -6.50% Senior Notes 16.3 16.3 16.37.50% Senior Notes 37.5 37.5 37.54.95% Senior Notes 24.8 9.7 -6.50% Senior Notes 32.5 32.5 32.55.80% Senior Notes 46.4 46.4 46.45.625% Senior Notes 14.1 5.5 -7.45% Senior Debentures 11.2 11.2 11.27.25% Senior Debentures 43.5 43.5 43.59.65% Senior Subordinated Debentures - 0.2 7.89.875% Senior Subordinated Debentures 2.4 2.4 2.4Other notes payable 1.1 0.7 0.7Medium-term notes - - 0.4Obligations under capital leases 64.8 66.0 63.1Amortization of deferred finance costs 7.5 7.8 8.0Interest rate swap agreements (4.3) (8.3) (0.5)Capitalized interest (16.0) (19.7) (21.9)
$402.6 $411.2 $442.4
SAFEWAY INC. AND SUBSIDIARIESNotes to Consolidated Financial Statements
49
Note G: Capital Stock
Shares Authorized and Issued Authorized preferred stock consists of 25 million shares of which none was outstandingduring 2005, 2004 or 2003. Authorized common stock consists of 1.5 billion shares at $0.01 par value. Common stockoutstanding at year-end 2005 was 449.4 million shares (net of 130.7 million shares of treasury stock) and 447.7 millionshares at year-end 2004 (net of 130.8 million shares of treasury stock).
Stock Option Plans Under Safeway’s stock option plans, the Company may grant incentive and non-qualified options topurchase common stock at an exercise price equal to or greater than the fair market value at the grant date, as determinedby the Executive Compensation Committee of the Board of Directors. Options generally vest over five or seven years. Vestedoptions are exercisable in part or in full at any time prior to the expiration date of six to 15 years from the date of the grant.Options to purchase 14.4 million shares were available for grant at December 31, 2005 under the 1999 Amended andRestated Equity Participation Plan. Shares issued, as a result of stock option exercises, will be funded with the issuance ofnew shares. Converted options from the acquisitions of Randall’s and Vons will be funded out of treasury shares except tothe extent there are insufficient treasury shares in which case new shares will be issued.
On July 31, 2002, the Board of Directors adopted the 2002 Equity Incentive Plan of Safeway Inc. (the “2002 Plan”), underwhich awards of non-qualified stock options and stock-based awards may be made. There are 2.0 million shares of commonstock authorized for issuance pursuant to grants under the 2002 Plan. As of December 31, 2005, no options have beengranted under this plan.
In September 2004, Safeway initiated a voluntary exchange program for stock options and stock rights having an exerciseprice greater than $35.00 to eligible employees. The Company’s executive officers, members of the Board of Directors andformer employees were not eligible to participate. The exchange program ended on October 5, 2004 and approximately 9.7million stock options and rights were surrendered and cancelled. Replacement stock options and replacement stock rightstotaling approximately 4.5 million were issued on April 7, 2005 at an exercise price of $20.75. These replacement stockoptions have a six-year term and vest over five years.
Restricted Stock The Company awarded 21,187 shares of restricted stock in 2005, 263,135 shares of restricted stock in2004 and 706,236 shares of restricted stock in 2003 to certain officers and key employees. These shares vest over a periodof between three to four years and are subject to certain transfer restrictions and forfeiture prior to vesting. Deferred stockcompensation, representing the fair value of the stock at the measurement date of the award, is amortized to compensationexpense over the vesting period. The amortization of this restricted stock resulted in compensation expense of $5.5 million in2005, $4.5 million in 2004 and $0.2 million in 2003. As of December 31, 2005, 428,108 restricted shares were vested,562,450 were unvested and 87,676 shares have been returned to Safeway to satisfy tax-withholding obligations ofemployees.
SAFEWAY INC. AND SUBSIDIARIESNotes to Consolidated Financial Statements
50
Activity in the Company’s stock option plans for the three-year period ended December 31, 2005 was as follows:
Options
Weightedaverage
exercise price
Aggregateintrinsic value(in millions)
Outstanding, year-end 2002 37,943,510 $ 31.70
2003 Activity:Granted 4,230,118 21.87Canceled (3,355,444) 38.42Exercised (2,511,557) 6.85
Outstanding, year-end 2003 36,306,627 $ 31.51 $ 141.8
2004 Activity:Granted 5,871,639 20.60Canceled (12,167,123) 44.07Exercised (3,196,582) 6.78
Outstanding, year-end 2004 26,814,561 $ 26.37 $ 81.4
2005 Activity:Granted 11,515,944 20.19Canceled (1,575,189) 28.55Exercised (1,889,572) 8.12
Outstanding, year-end 2005 34,865,744 $ 25.23 $ 139.3
Exercisable, year-end 2003 21,697,133 $ 27.24 138.5
Exercisable, year-end 2004 15,218,373 26.35 81.1Exercisable, year-end 2005 16,239,331 29.16 81.9
Weighted average fair value of options granted during the year:2003 $9.642004 8.572005 6.32
The total intrinsic value of options exercised in 2005 was $26.6 million. As of year-end 2005, there was $139.0 million oftotal unrecognized compensation cost related to nonvested stock-based compensation arrangements granted under theCompany’s stock option plans. That cost is expected to be recognized over a weighted average period of 1.8 years.
SAFEWAY INC. AND SUBSIDIARIESNotes to Consolidated Financial Statements
51
The following table summarizes stock option information at year-end 2005:
Options outstanding Options exercisable
Range of exercise pricesNumber
of options
Weighted-average
remainingcontractual life
(in years)
Weighted-averageexercise
priceNumber of
optionsWeighted-average
exercise price
$ 2.38 to $ 4.47 2,907,935 2.05 $ 2.89 2,907,935 $ 2.894.50 18.11 5,083,071 4.39 16.37 991,105 9.24
18.12 19.99 4,580,151 4.84 19.80 1,052,982 19.7720.00 20.75 6,342,596 4.87 20.57 701,208 20.1720.86 22.83 3,090,408 5.77 22.25 614,134 22.5122.85 27.15 3,647,094 4.79 25.26 1,930,035 25.6527.40 35.75 2,196,512 4.21 32.34 1,760,391 32.4535.94 45.94 3,056,480 3.89 41.75 2,689,406 41.5946.09 52.94 1,591,583 4.76 49.21 1,295,664 49.3553.23 62.50 2,369,914 4.92 54.41 2,296,471 54.322.38 62.50 34,865,744 4.50 25.23 16,239,331 29.16
Additional Stock Plan Information In December 2004, the FASB issued SFAS No. 123 (revised 2004). Safeway elected toearly adopt SFAS No. 123R in the first quarter of 2005 using the modified prospective approach. Under the modifiedprospective method, compensation expense has been and will be recorded for the unvested portion of previously issuedawards that remain outstanding at January 2, 2005 using the same estimate of the grant date fair value and the sameattribution method used to determine the pro forma disclosure under SFAS No. 123. SFAS No. 123R requires that all share-based payments to employees, including grants of employee stock options after January 1, 2005, be recognized in thefinancial statements as compensation cost based on the fair value on the date of grant.
The Company determines fair value of such awards using the Black-Scholes option pricing model. The following weightedaverage assumptions were used to value Safeway’s grants in 2005: 4.5 years expected life; expected stock volatility of28.9% to 30.8%; risk-free interest rate of 3.83% to 4.09%; and expected dividend yield of 0% - 1% during the expectedterm.
The expected term of the awards was determined using the “simplified method” stated in SEC Staff Accounting Bulletin No.107 that utilizes the following formula: ((vesting term + original contract term)/2). Expected stock volatility was determinedbased upon a combination of historical volatility for the 4.5-year-period preceding the measurement date and estimates ofimplied volatility based on open interests in traded option contracts on Safeway common stock. The risk-free interest ratewas based on the yield curve in effect at the time the options were granted, using U.S. constant maturities over the expectedlife of the option. Expected dividend yield was based on the Company’s dividend policy at the time the options weregranted.
The Company recognized stock-based compensation expense of $59.7 million ($0.08 per diluted share) during fiscal 2005 asa component of operating and administrative expense.
Had compensation cost for Safeway’s stock option plans been determined based on the fair value at the grant date forawards from 1996 through 2004, consistent with the provisions of SFAS No. 123, the Company’s net income and earningsper share would have been reduced to the pro forma amounts disclosed in Note A.
SAFEWAY INC. AND SUBSIDIARIESNotes to Consolidated Financial Statements
52
Note H: Taxes on Income
The components of income (loss) before tax expense is as follows (in millions):
2005 2004 2003
Domestic $723.7 $550.2 $ (86.2)Foreign 125.3 243.7 227.3
$849.0 $793.9 $141.1
The components of income tax expense are as follows (in millions):
2005 2004 2003
Current:Federal $389.4 $153.5 $251.5State 59.1 25.7 51.8Foreign 55.3 83.7 85.5
503.8 262.9 388.8Deferred:
Federal (186.2) (17.4) (48.5)State (17.6) (10.6) (24.5)Foreign (12.1) (1.2) (4.9)
(215.9) (29.2) (77.9)$287.9 $233.7 $310.9
Reconciliation of the provision for income taxes at the U.S. federal statutory income tax rate to the Company's income taxesis as follows (dollars in millions):
2005 2004 2003
Statutory rate 35% 35% 35%Income tax expense using federal statutory rate $297.2 $277.9 $ 49.4State taxes on income net of federal benefit 27.0 9.8 17.7Nondeductible goodwill impairment − − 255.2Equity earnings of foreign affiliates (0.9) (1.5) 7.0Charitable donations of inventory (11.1) (9.8) (8.5)Affiliate’s losses not currently benefitted 2.7 3.3 4.1Tax settlements (3.2) (40.0) (6.2)Repatriation of foreign earnings (16.5) − −Other (7.3) (6.0) (7.8)
$287.9 $233.7 $310.9
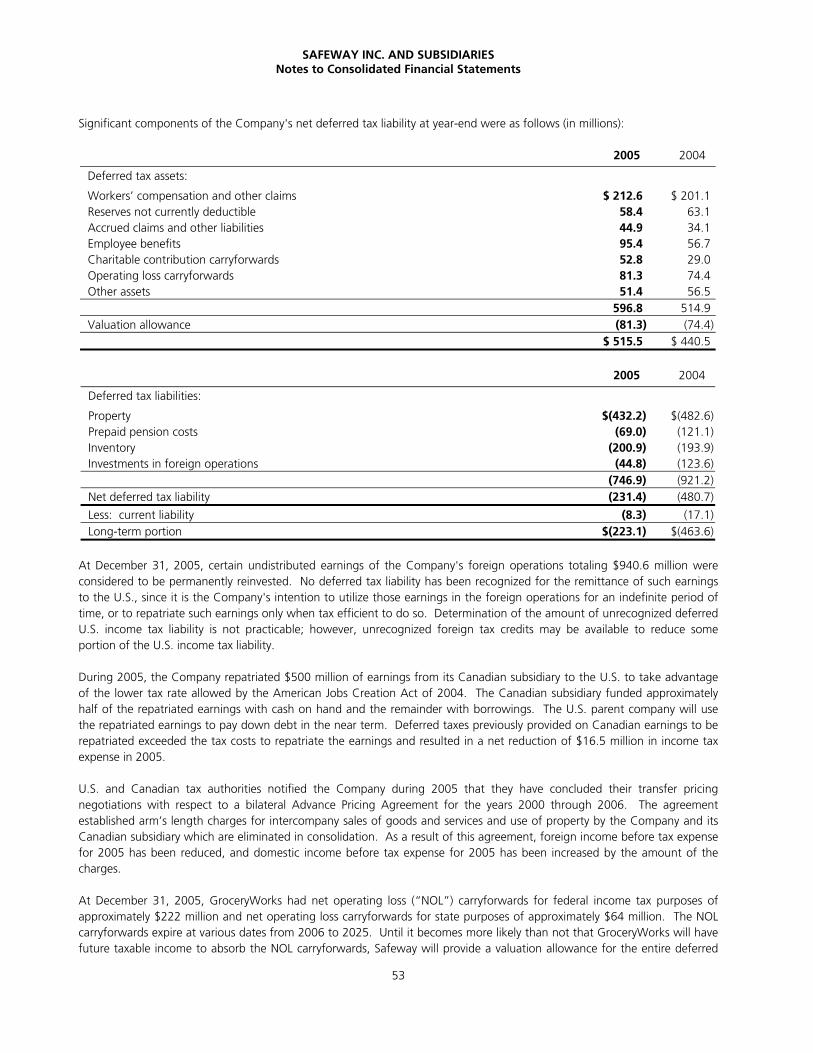
SAFEWAY INC. AND SUBSIDIARIESNotes to Consolidated Financial Statements
53
Significant components of the Company's net deferred tax liability at year-end were as follows (in millions):
2005 2004
Deferred tax assets:
Workers’ compensation and other claims $ 212.6 $ 201.1Reserves not currently deductible 58.4 63.1Accrued claims and other liabilities 44.9 34.1Employee benefits 95.4 56.7Charitable contribution carryforwards 52.8 29.0Operating loss carryforwards 81.3 74.4Other assets 51.4 56.5
596.8 514.9Valuation allowance (81.3) (74.4)
$ 515.5 $ 440.5
2005 2004
Deferred tax liabilities:
Property $(432.2) $(482.6)Prepaid pension costs (69.0) (121.1)Inventory (200.9) (193.9)Investments in foreign operations (44.8) (123.6)
(746.9) (921.2)Net deferred tax liability (231.4) (480.7)
Less: current liability (8.3) (17.1)Long-term portion $(223.1) $(463.6)
At December 31, 2005, certain undistributed earnings of the Company's foreign operations totaling $940.6 million wereconsidered to be permanently reinvested. No deferred tax liability has been recognized for the remittance of such earningsto the U.S., since it is the Company's intention to utilize those earnings in the foreign operations for an indefinite period oftime, or to repatriate such earnings only when tax efficient to do so. Determination of the amount of unrecognized deferredU.S. income tax liability is not practicable; however, unrecognized foreign tax credits may be available to reduce someportion of the U.S. income tax liability.
During 2005, the Company repatriated $500 million of earnings from its Canadian subsidiary to the U.S. to take advantageof the lower tax rate allowed by the American Jobs Creation Act of 2004. The Canadian subsidiary funded approximatelyhalf of the repatriated earnings with cash on hand and the remainder with borrowings. The U.S. parent company will usethe repatriated earnings to pay down debt in the near term. Deferred taxes previously provided on Canadian earnings to berepatriated exceeded the tax costs to repatriate the earnings and resulted in a net reduction of $16.5 million in income taxexpense in 2005.
U.S. and Canadian tax authorities notified the Company during 2005 that they have concluded their transfer pricingnegotiations with respect to a bilateral Advance Pricing Agreement for the years 2000 through 2006. The agreementestablished arm’s length charges for intercompany sales of goods and services and use of property by the Company and itsCanadian subsidiary which are eliminated in consolidation. As a result of this agreement, foreign income before tax expensefor 2005 has been reduced, and domestic income before tax expense for 2005 has been increased by the amount of thecharges.
At December 31, 2005, GroceryWorks had net operating loss (“NOL”) carryforwards for federal income tax purposes ofapproximately $222 million and net operating loss carryforwards for state purposes of approximately $64 million. The NOLcarryforwards expire at various dates from 2006 to 2025. Until it becomes more likely than not that GroceryWorks will havefuture taxable income to absorb the NOL carryforwards, Safeway will provide a valuation allowance for the entire deferred
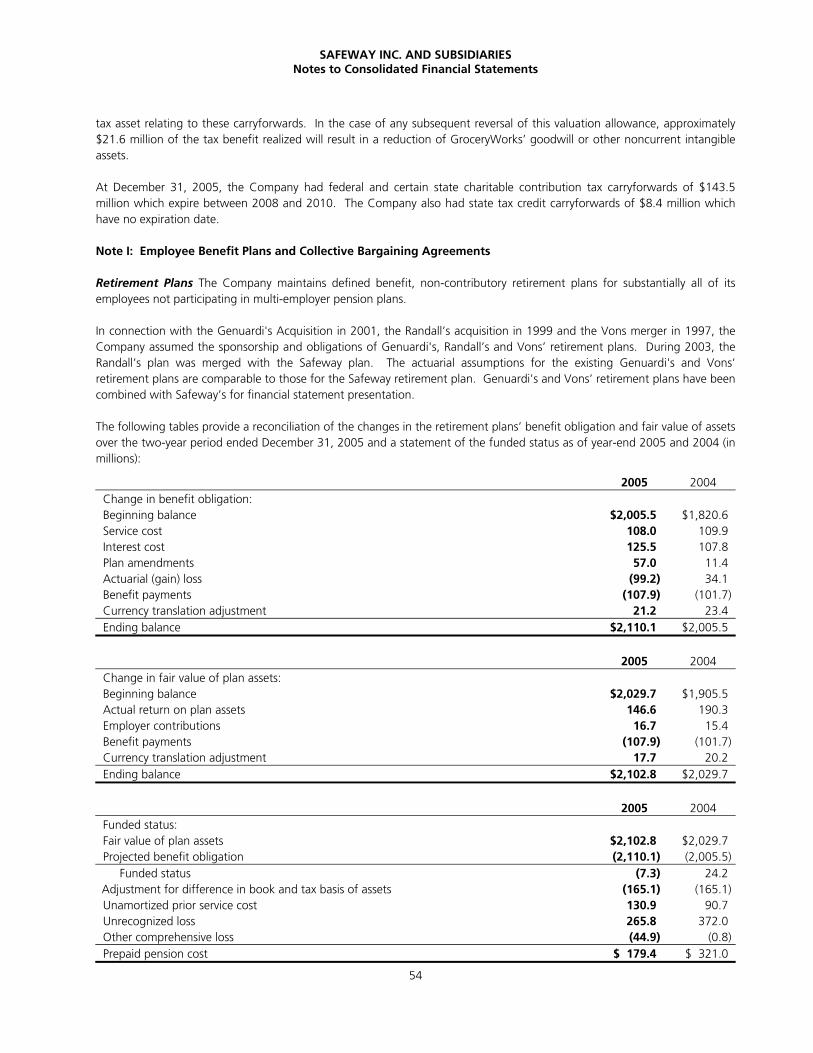
SAFEWAY INC. AND SUBSIDIARIESNotes to Consolidated Financial Statements
54
tax asset relating to these carryforwards. In the case of any subsequent reversal of this valuation allowance, approximately$21.6 million of the tax benefit realized will result in a reduction of GroceryWorks’ goodwill or other noncurrent intangibleassets.
At December 31, 2005, the Company had federal and certain state charitable contribution tax carryforwards of $143.5million which expire between 2008 and 2010. The Company also had state tax credit carryforwards of $8.4 million whichhave no expiration date.
Note I: Employee Benefit Plans and Collective Bargaining Agreements
Retirement Plans The Company maintains defined benefit, non-contributory retirement plans for substantially all of itsemployees not participating in multi-employer pension plans.
In connection with the Genuardi's Acquisition in 2001, the Randall’s acquisition in 1999 and the Vons merger in 1997, theCompany assumed the sponsorship and obligations of Genuardi's, Randall’s and Vons’ retirement plans. During 2003, theRandall’s plan was merged with the Safeway plan. The actuarial assumptions for the existing Genuardi's and Vons’retirement plans are comparable to those for the Safeway retirement plan. Genuardi's and Vons’ retirement plans have beencombined with Safeway’s for financial statement presentation.
The following tables provide a reconciliation of the changes in the retirement plans’ benefit obligation and fair value of assetsover the two-year period ended December 31, 2005 and a statement of the funded status as of year-end 2005 and 2004 (inmillions):
2005 2004Change in benefit obligation:Beginning balance $2,005.5 $1,820.6Service cost 108.0 109.9Interest cost 125.5 107.8Plan amendments 57.0 11.4Actuarial (gain) loss (99.2) 34.1Benefit payments (107.9) (101.7)Currency translation adjustment 21.2 23.4Ending balance $2,110.1 $2,005.5
2005 2004Change in fair value of plan assets:Beginning balance $2,029.7 $1,905.5Actual return on plan assets 146.6 190.3Employer contributions 16.7 15.4Benefit payments (107.9) (101.7)Currency translation adjustment 17.7 20.2Ending balance $2,102.8 $2,029.7
2005 2004Funded status:Fair value of plan assets $2,102.8 $2,029.7Projected benefit obligation (2,110.1) (2,005.5)
Funded status (7.3) 24.2Adjustment for difference in book and tax basis of assets (165.1) (165.1)Unamortized prior service cost 130.9 90.7Unrecognized loss 265.8 372.0Other comprehensive loss (44.9) (0.8)Prepaid pension cost $ 179.4 $ 321.0
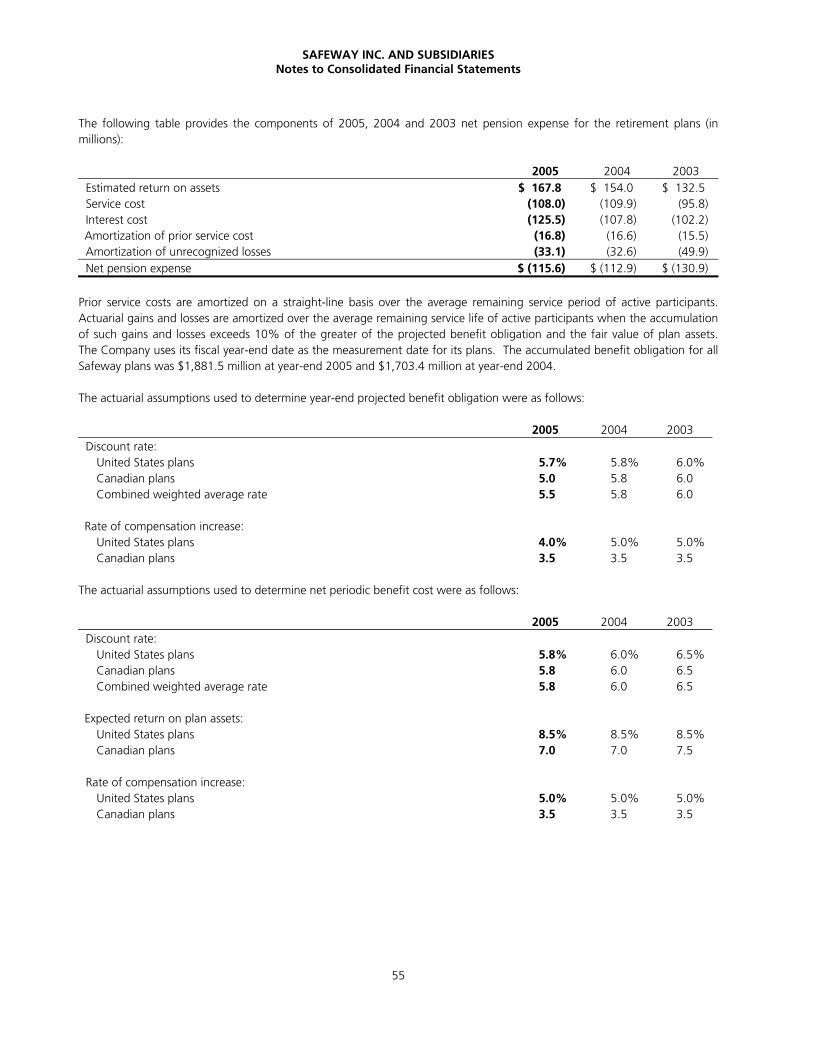
SAFEWAY INC. AND SUBSIDIARIESNotes to Consolidated Financial Statements
55
The following table provides the components of 2005, 2004 and 2003 net pension expense for the retirement plans (inmillions):
2005 2004 2003Estimated return on assets $ 167.8 $ 154.0 $ 132.5Service cost (108.0) (109.9) (95.8)Interest cost (125.5) (107.8) (102.2)Amortization of prior service cost (16.8) (16.6) (15.5)Amortization of unrecognized losses (33.1) (32.6) (49.9)Net pension expense $ (115.6) $ (112.9) $ (130.9)
Prior service costs are amortized on a straight-line basis over the average remaining service period of active participants.Actuarial gains and losses are amortized over the average remaining service life of active participants when the accumulationof such gains and losses exceeds 10% of the greater of the projected benefit obligation and the fair value of plan assets.The Company uses its fiscal year-end date as the measurement date for its plans. The accumulated benefit obligation for allSafeway plans was $1,881.5 million at year-end 2005 and $1,703.4 million at year-end 2004.
The actuarial assumptions used to determine year-end projected benefit obligation were as follows:
2005 2004 2003Discount rate:
United States plans 5.7% 5.8% 6.0%Canadian plans 5.0 5.8 6.0Combined weighted average rate 5.5 5.8 6.0
Rate of compensation increase:United States plans 4.0% 5.0% 5.0%Canadian plans 3.5 3.5 3.5
The actuarial assumptions used to determine net periodic benefit cost were as follows:
2005 2004 2003Discount rate:
United States plans 5.8% 6.0% 6.5%Canadian plans 5.8 6.0 6.5Combined weighted average rate 5.8 6.0 6.5
Expected return on plan assets:United States plans 8.5% 8.5% 8.5%Canadian plans 7.0 7.0 7.5
Rate of compensation increase:United States plans 5.0% 5.0% 5.0%Canadian plans 3.5 3.5 3.5
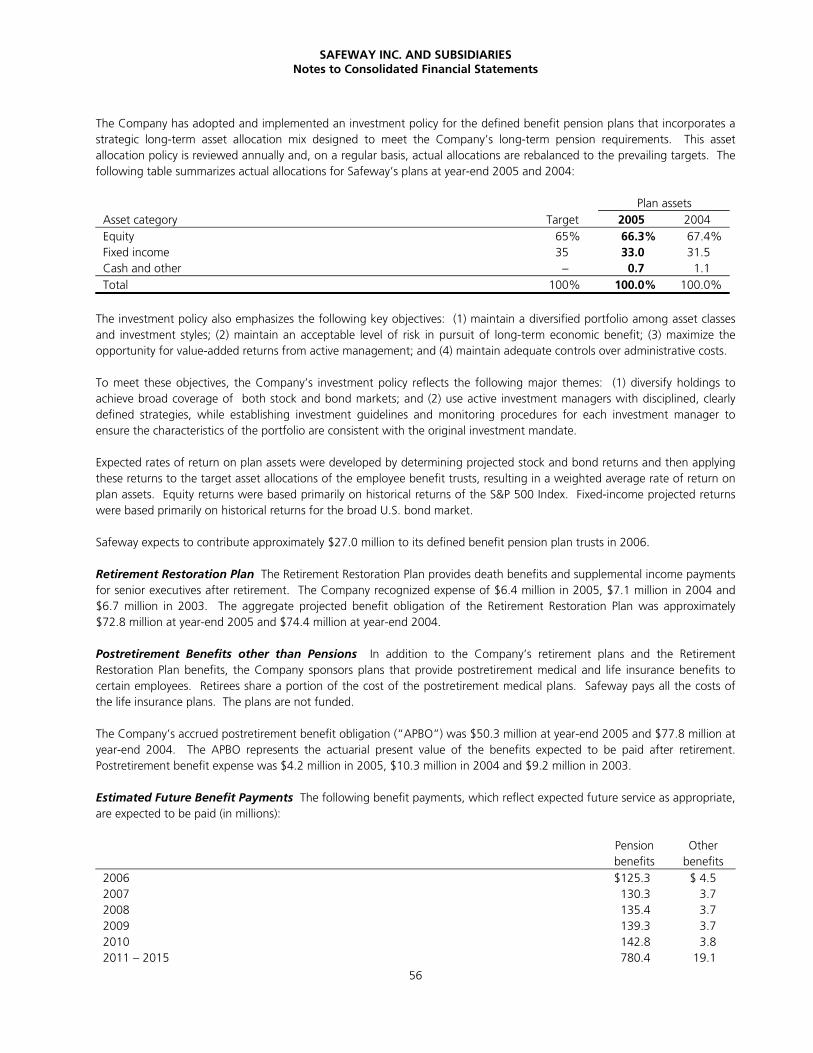
SAFEWAY INC. AND SUBSIDIARIESNotes to Consolidated Financial Statements
56
The Company has adopted and implemented an investment policy for the defined benefit pension plans that incorporates astrategic long-term asset allocation mix designed to meet the Company’s long-term pension requirements. This assetallocation policy is reviewed annually and, on a regular basis, actual allocations are rebalanced to the prevailing targets. Thefollowing table summarizes actual allocations for Safeway’s plans at year-end 2005 and 2004:
Plan assetsAsset category Target 2005 2004Equity 65% 66.3% 67.4%Fixed income 35 33.0 31.5Cash and other − 0.7 1.1Total 100% 100.0% 100.0%
The investment policy also emphasizes the following key objectives: (1) maintain a diversified portfolio among asset classesand investment styles; (2) maintain an acceptable level of risk in pursuit of long-term economic benefit; (3) maximize theopportunity for value-added returns from active management; and (4) maintain adequate controls over administrative costs.
To meet these objectives, the Company’s investment policy reflects the following major themes: (1) diversify holdings toachieve broad coverage of both stock and bond markets; and (2) use active investment managers with disciplined, clearlydefined strategies, while establishing investment guidelines and monitoring procedures for each investment manager toensure the characteristics of the portfolio are consistent with the original investment mandate.
Expected rates of return on plan assets were developed by determining projected stock and bond returns and then applyingthese returns to the target asset allocations of the employee benefit trusts, resulting in a weighted average rate of return onplan assets. Equity returns were based primarily on historical returns of the S&P 500 Index. Fixed-income projected returnswere based primarily on historical returns for the broad U.S. bond market.
Safeway expects to contribute approximately $27.0 million to its defined benefit pension plan trusts in 2006.
Retirement Restoration Plan The Retirement Restoration Plan provides death benefits and supplemental income paymentsfor senior executives after retirement. The Company recognized expense of $6.4 million in 2005, $7.1 million in 2004 and$6.7 million in 2003. The aggregate projected benefit obligation of the Retirement Restoration Plan was approximately$72.8 million at year-end 2005 and $74.4 million at year-end 2004.
Postretirement Benefits other than Pensions In addition to the Company’s retirement plans and the RetirementRestoration Plan benefits, the Company sponsors plans that provide postretirement medical and life insurance benefits tocertain employees. Retirees share a portion of the cost of the postretirement medical plans. Safeway pays all the costs ofthe life insurance plans. The plans are not funded.
The Company’s accrued postretirement benefit obligation (“APBO”) was $50.3 million at year-end 2005 and $77.8 million atyear-end 2004. The APBO represents the actuarial present value of the benefits expected to be paid after retirement.Postretirement benefit expense was $4.2 million in 2005, $10.3 million in 2004 and $9.2 million in 2003.
Estimated Future Benefit Payments The following benefit payments, which reflect expected future service as appropriate,are expected to be paid (in millions):
Pensionbenefits
Otherbenefits
2006 $125.3 $ 4.52007 130.3 3.72008 135.4 3.72009 139.3 3.72010 142.8 3.82011 − 2015 780.4 19.1
SAFEWAY INC. AND SUBSIDIARIESNotes to Consolidated Financial Statements
57
Multi-Employer Pension Plans Safeway participates in various multi-employer retirement plans, covering substantially allCompany employees not covered under the Company's non-contributory retirement plans, pursuant to agreements betweenthe Company and various unions. These plans are generally defined benefit plans; however, in many cases, specific benefitlevels are not negotiated with or known by the employer-contributors. Contributions of $234.5 million in 2005, $196.8million in 2004 and $172.1 million in 2003 were made and charged to expense. The increase in the 2005 contributions waslargely due to the expiration of a pension holiday.
Collective Bargaining Agreements At year-end 2005, Safeway had approximately 201,000 full- and part-time employees.Approximately 80% of Safeway's employees in the United States and Canada are covered by collective bargainingagreements negotiated with local unions affiliated with one of 10 different international unions. There are approximately400 such agreements, typically having three-year terms, with some agreements having terms up to five years. Accordingly,Safeway renegotiates a significant number of these agreements every year.
Note J: Investment in Unconsolidated Affiliates
At year-end 2005, 2004 and 2003, Safeway’s investment in unconsolidated affiliates consists of a 49% ownership interest inCasa Ley, which operates 119 food and general merchandise stores in Western Mexico.
Equity in earnings (losses) from Safeway’s unconsolidated affiliates, which is included in other income (expense), was incomeof $15.8 million in 2005, income of $12.6 million in 2004 and a loss of $7.1 million in 2003.
Note K: Commitments and Contingencies
Legal Matters In July 1988, there was a major fire at the Company’s dry grocery warehouse in Richmond, California.Through March 1, 2006, in excess of 126,000 claims for personal injury and property damage arising from the fire have beensettled for an aggregate amount of approximately $125 million. The Company’s loss as a result of the fire damage to itsproperty and settlement of the above claims was substantially covered by insurance.
As of March 1, 2006, there were still pending approximately 175 claims against the Company for personal injury (includingpunitive damages), arising from the smoke, ash and embers generated by the fire. A substantial percentage of these claimshas been asserted in lawsuits against the Company filed in the Superior Court for Alameda County, California. There can beno assurance that the pending claims will be settled or otherwise disposed of for amounts and on terms comparable to thosesettled to date. Safeway continues to believe that coverage under its insurance policy will be sufficient and available forresolution of all remaining personal injury and property damage claims arising out of the fire.
On February 2, 2004, the Attorney General for the State of California filed an action in the United States District Court forthe Central District of California (Los Angeles), entitled State of California, ex rel. Bill Lockyer v. Safeway Inc. dba Vons, et al.,against the Company’s subsidiary, The Vons Companies, Inc., Albertson’s, Inc. and Ralphs Grocery Company, a division ofthe Kroger Company. The complaint alleges that certain provisions of a Mutual Strike Assistance Agreement entered into bythe defendants in connection with the Southern California grocery strike that began on October 11, 2003 constituted aviolation of section 1 of the Sherman Antitrust Act. The complaint seeks declaratory and injunctive relief. Defendants filed amotion for summary judgment based on the federal non-statutory labor exemption to the antitrust laws, which motion wasdenied by the court on May 25, 2005. On November 25, 2005, the Ninth Circuit issued an order refusing to hear aninterlocutory appeal of the order denying defendants’ summary judgment motion. No trial date in the district court has beenset.
There are also pending against the Company various claims and lawsuits arising in the normal course of business, some ofwhich seek damages and other relief, which, if granted, would require large expenditures.
It is management’s opinion that although the amount of liability with respect to all of the above matters cannot beascertained at this time, any resulting liability, including any punitive damages, will not have a material adverse effect on theCompany’s financial statements taken as a whole.
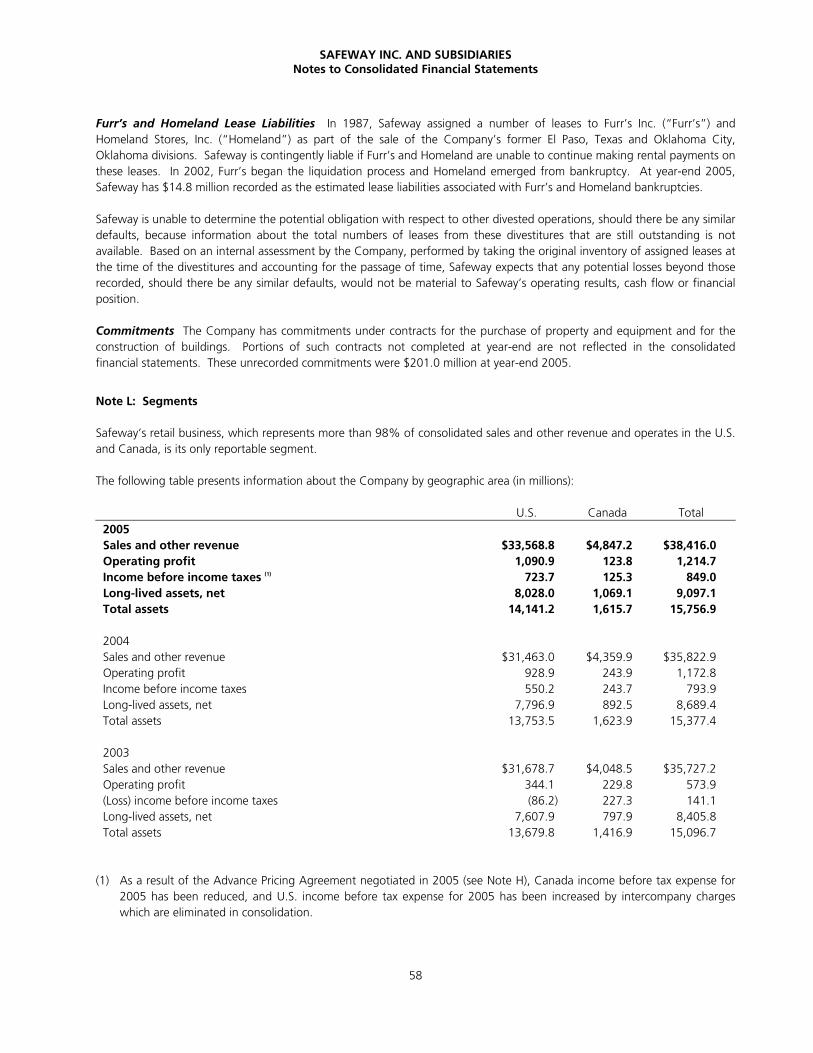
SAFEWAY INC. AND SUBSIDIARIESNotes to Consolidated Financial Statements
58
Furr’s and Homeland Lease Liabilities In 1987, Safeway assigned a number of leases to Furr’s Inc. (“Furr’s”) andHomeland Stores, Inc. (“Homeland”) as part of the sale of the Company’s former El Paso, Texas and Oklahoma City,Oklahoma divisions. Safeway is contingently liable if Furr’s and Homeland are unable to continue making rental payments onthese leases. In 2002, Furr’s began the liquidation process and Homeland emerged from bankruptcy. At year-end 2005,Safeway has $14.8 million recorded as the estimated lease liabilities associated with Furr’s and Homeland bankruptcies.
Safeway is unable to determine the potential obligation with respect to other divested operations, should there be any similardefaults, because information about the total numbers of leases from these divestitures that are still outstanding is notavailable. Based on an internal assessment by the Company, performed by taking the original inventory of assigned leases atthe time of the divestitures and accounting for the passage of time, Safeway expects that any potential losses beyond thoserecorded, should there be any similar defaults, would not be material to Safeway’s operating results, cash flow or financialposition.
Commitments The Company has commitments under contracts for the purchase of property and equipment and for theconstruction of buildings. Portions of such contracts not completed at year-end are not reflected in the consolidatedfinancial statements. These unrecorded commitments were $201.0 million at year-end 2005.
Note L: Segments
Safeway’s retail business, which represents more than 98% of consolidated sales and other revenue and operates in the U.S.and Canada, is its only reportable segment.
The following table presents information about the Company by geographic area (in millions):
U.S. Canada Total2005Sales and other revenue $33,568.8 $4,847.2 $38,416.0Operating profit 1,090.9 123.8 1,214.7Income before income taxes (1) 723.7 125.3 849.0Long-lived assets, net 8,028.0 1,069.1 9,097.1Total assets 14,141.2 1,615.7 15,756.9
2004Sales and other revenue $31,463.0 $4,359.9 $35,822.9Operating profit 928.9 243.9 1,172.8Income before income taxes 550.2 243.7 793.9Long-lived assets, net 7,796.9 892.5 8,689.4Total assets 13,753.5 1,623.9 15,377.4
2003Sales and other revenue $31,678.7 $4,048.5 $35,727.2Operating profit 344.1 229.8 573.9(Loss) income before income taxes (86.2) 227.3 141.1Long-lived assets, net 7,607.9 797.9 8,405.8Total assets 13,679.8 1,416.9 15,096.7
(1) As a result of the Advance Pricing Agreement negotiated in 2005 (see Note H), Canada income before tax expense for2005 has been reduced, and U.S. income before tax expense for 2005 has been increased by intercompany chargeswhich are eliminated in consolidation.
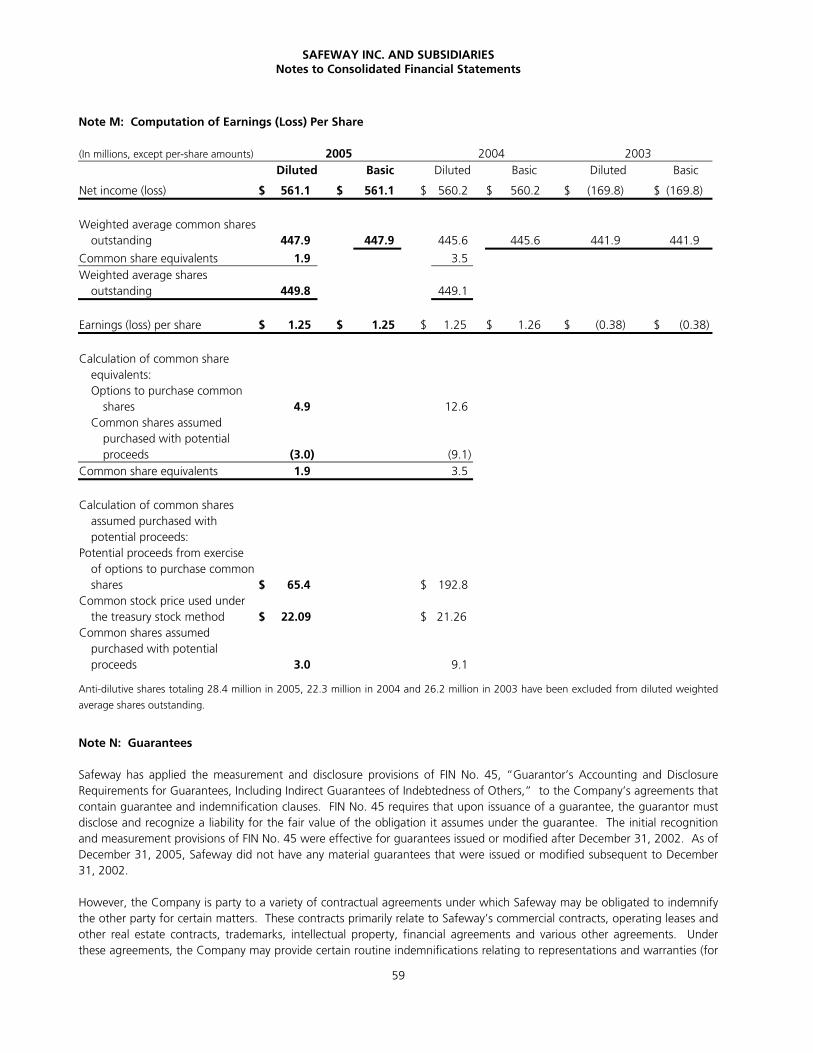
SAFEWAY INC. AND SUBSIDIARIESNotes to Consolidated Financial Statements
59
Note M: Computation of Earnings (Loss) Per Share
(In millions, except per-share amounts) 2005 2004 2003Diluted Basic Diluted Basic Diluted Basic
Net income (loss) $ 561.1 $ 561.1 $ 560.2 $ 560.2 $ (169.8) $ (169.8)
Weighted average common sharesoutstanding 447.9 447.9 445.6 445.6 441.9 441.9
Common share equivalents 1.9 3.5Weighted average shares
outstanding 449.8 449.1
Earnings (loss) per share $ 1.25 $ 1.25 $ 1.25 $ 1.26 $ (0.38) $ (0.38)
Calculation of common shareequivalents:Options to purchase common
shares 4.9 12.6Common shares assumed
purchased with potentialproceeds (3.0) (9.1)
Common share equivalents 1.9 3.5
Calculation of common sharesassumed purchased withpotential proceeds:
Potential proceeds from exerciseof options to purchase commonshares $ 65.4 $ 192.8
Common stock price used underthe treasury stock method $ 22.09 $ 21.26
Common shares assumedpurchased with potentialproceeds 3.0 9.1
Anti-dilutive shares totaling 28.4 million in 2005, 22.3 million in 2004 and 26.2 million in 2003 have been excluded from diluted weighted
average shares outstanding.
Note N: Guarantees
Safeway has applied the measurement and disclosure provisions of FIN No. 45, “Guarantor’s Accounting and DisclosureRequirements for Guarantees, Including Indirect Guarantees of Indebtedness of Others,” to the Company’s agreements thatcontain guarantee and indemnification clauses. FIN No. 45 requires that upon issuance of a guarantee, the guarantor mustdisclose and recognize a liability for the fair value of the obligation it assumes under the guarantee. The initial recognitionand measurement provisions of FIN No. 45 were effective for guarantees issued or modified after December 31, 2002. As ofDecember 31, 2005, Safeway did not have any material guarantees that were issued or modified subsequent to December31, 2002.
However, the Company is party to a variety of contractual agreements under which Safeway may be obligated to indemnifythe other party for certain matters. These contracts primarily relate to Safeway’s commercial contracts, operating leases andother real estate contracts, trademarks, intellectual property, financial agreements and various other agreements. Underthese agreements, the Company may provide certain routine indemnifications relating to representations and warranties (for
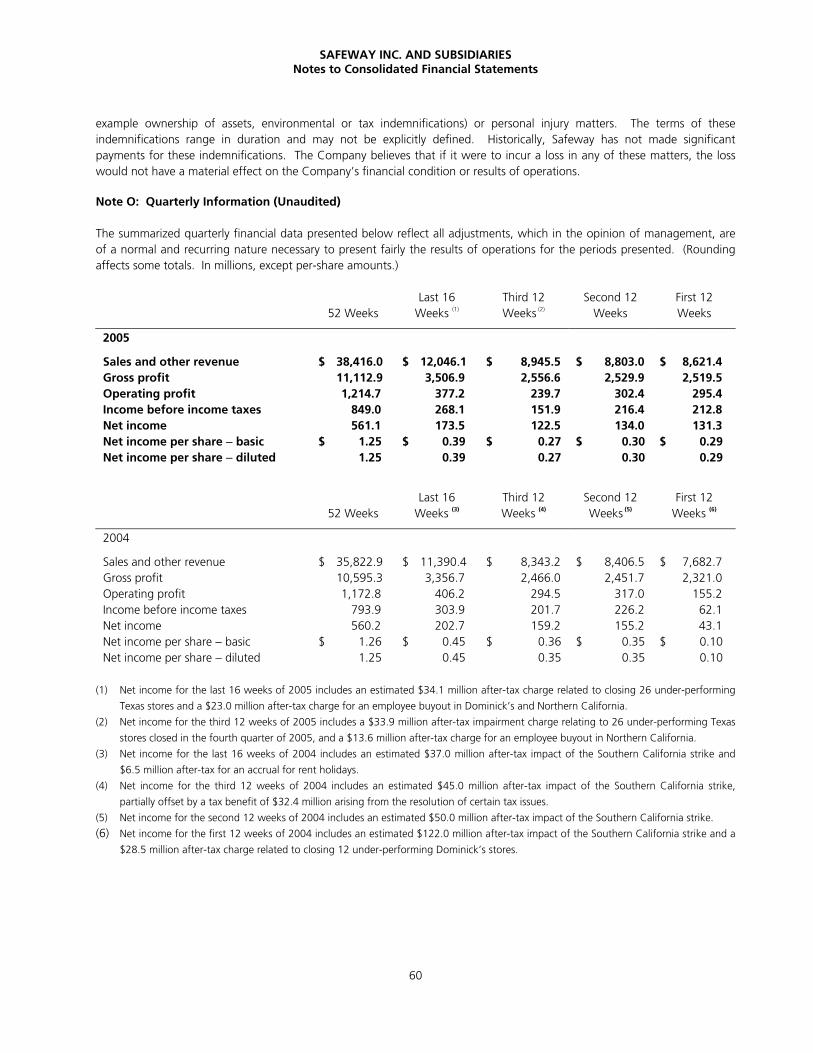
SAFEWAY INC. AND SUBSIDIARIESNotes to Consolidated Financial Statements
60
example ownership of assets, environmental or tax indemnifications) or personal injury matters. The terms of theseindemnifications range in duration and may not be explicitly defined. Historically, Safeway has not made significantpayments for these indemnifications. The Company believes that if it were to incur a loss in any of these matters, the losswould not have a material effect on the Company’s financial condition or results of operations.
Note O: Quarterly Information (Unaudited)
The summarized quarterly financial data presented below reflect all adjustments, which in the opinion of management, areof a normal and recurring nature necessary to present fairly the results of operations for the periods presented. (Roundingaffects some totals. In millions, except per-share amounts.)
52 WeeksLast 16
Weeks (1)
Third 12Weeks (2)
Second 12Weeks
First 12Weeks
2005
Sales and other revenue $ 38,416.0 $ 12,046.1 $ 8,945.5 $ 8,803.0 $ 8,621.4Gross profit 11,112.9 3,506.9 2,556.6 2,529.9 2,519.5Operating profit 1,214.7 377.2 239.7 302.4 295.4Income before income taxes 849.0 268.1 151.9 216.4 212.8Net income 561.1 173.5 122.5 134.0 131.3Net income per share − basic $ 1.25 $ 0.39 $ 0.27 $ 0.30 $ 0.29Net income per share − diluted 1.25 0.39 0.27 0.30 0.29
52 WeeksLast 16
Weeks (3)
Third 12Weeks (4)
Second 12Weeks (5)
First 12Weeks (6)
2004
Sales and other revenue $ 35,822.9 $ 11,390.4 $ 8,343.2 $ 8,406.5 $ 7,682.7Gross profit 10,595.3 3,356.7 2,466.0 2,451.7 2,321.0Operating profit 1,172.8 406.2 294.5 317.0 155.2Income before income taxes 793.9 303.9 201.7 226.2 62.1Net income 560.2 202.7 159.2 155.2 43.1Net income per share − basic $ 1.26 $ 0.45 $ 0.36 $ 0.35 $ 0.10Net income per share − diluted 1.25 0.45 0.35 0.35 0.10
(1) Net income for the last 16 weeks of 2005 includes an estimated $34.1 million after-tax charge related to closing 26 under-performing
Texas stores and a $23.0 million after-tax charge for an employee buyout in Dominick’s and Northern California.
(2) Net income for the third 12 weeks of 2005 includes a $33.9 million after-tax impairment charge relating to 26 under-performing Texas
stores closed in the fourth quarter of 2005, and a $13.6 million after-tax charge for an employee buyout in Northern California.
(3) Net income for the last 16 weeks of 2004 includes an estimated $37.0 million after-tax impact of the Southern California strike and
$6.5 million after-tax for an accrual for rent holidays.
(4) Net income for the third 12 weeks of 2004 includes an estimated $45.0 million after-tax impact of the Southern California strike,
partially offset by a tax benefit of $32.4 million arising from the resolution of certain tax issues.
(5) Net income for the second 12 weeks of 2004 includes an estimated $50.0 million after-tax impact of the Southern California strike.
(6) Net income for the first 12 weeks of 2004 includes an estimated $122.0 million after-tax impact of the Southern California strike and a
$28.5 million after-tax charge related to closing 12 under-performing Dominick’s stores.
SAFEWAY INC. AND SUBSIDIARIES
61
Item 9. Changes in and Disagreements with Accountants on Accounting and Financial Disclosure
Not applicable.
Item 9A. Controls and Procedures
The Company maintains disclosure controls and procedures that are designed to ensure that information required to bedisclosed in the Company’s Exchange Act reports is recorded, processed, summarized and reported within the time periodsspecified in the SEC’s rules and forms, and that such information is accumulated and communicated to the Company’smanagement, including its President and Chief Executive Officer and Chief Financial Officer, as appropriate, to allow timelydecisions regarding required disclosure. Management necessarily applied its judgment in assessing the costs and benefits ofsuch controls and procedures which, by their nature, can provide only reasonable assurance regarding management’s controlobjectives. Management, including the Company’s President and Chief Executive Officer along with the Company’s ChiefFinancial Officer, concluded that the Company’s disclosure controls and procedures are effective in reaching the level ofreasonable assurance regarding management’s control objectives. The Company also has investments in certainunconsolidated entities, including Casa Ley. As the Company does not control or manage these entities, its disclosurecontrols and procedures with respect to such entities are necessarily more limited than those it maintains with respect to itsconsolidated subsidiaries.
The Company has carried out an evaluation, under the supervision and with the participation of the Company’smanagement, including the Company’s President and Chief Executive Officer along with the Company’s Chief FinancialOfficer, of the effectiveness of the design and operation of the Company’s disclosure controls and procedures pursuant toExchange Act Rule 13a-15(b). Based upon the foregoing, as of December 31, 2005, the Company’s President and ChiefExecutive Officer along with the Company’s Chief Financial Officer, concluded that the Company’s disclosure controls andprocedures are effective in timely alerting them to material information relating to the Company (including its consolidatedsubsidiaries) required to be included in the Company’s Exchange Act reports. There has been no change during theCompany’s fiscal quarter ended December 31, 2005 in the Company’s internal control over financial reporting that wasidentified in connection with the foregoing evaluation which has materially affected, or is reasonably likely to materiallyaffect, the Company’s internal control over financial reporting.
Management of Safeway Inc. has prepared an annual report on internal control over financial reporting. The Company’sindependent registered public accounting firm has issued an attestation report on management’s assessment of theeffectiveness of the Company’s internal control over financial reporting. Management’s report, together with the attestationreport of the independent registered public accounting firm, is set forth in Part II, Item 8 of this report.
Item 9B. Other Information
None.
SAFEWAY INC. AND SUBSIDIARIES
62
PART III
Item 10. Directors and Executive Officers of the Registrant
Directors of the Registrant Information on the nominees for election as Directors of the Company is incorporated byreference from the Company's definitive proxy statement for the 2006 Annual Meeting of Stockholders to be filed pursuantto Regulation 14A under the Exchange Act no later than 120 days after the end of the Company's 2005 fiscal year.
Executive Officers of the Registrant This information has been included in a separate item captioned “Executive Officersof the Registrant” in Part I of this report pursuant to Instruction G(3) of Form 10-K and Instruction 3 to Item 401(b) ofRegulation S-K.
Audit Committee Financial Expert This information is incorporated by reference from the Company’s definitive proxystatement for the 2006 Annual Meeting of Stockholders to be filed pursuant to Regulation 14A under the Exchange Act nolater than 120 days after the end of the Company’s 2005 fiscal year.
Identification of the Audit Committee This information is incorporated by reference from the Company’s definitive proxystatement for the 2006 Annual Meeting of Stockholders to be filed pursuant to Regulation 14A under the Exchange Act nolater than 120 days after the end of the Company’s 2005 fiscal year.
Compliance with Section 16(a) of the Exchange Act The information called for is incorporated by reference from theCompany's definitive proxy statement for the 2006 Annual Meeting of Stockholders to be filed pursuant to Regulation 14Aunder the Exchange Act no later than 120 days after the end of the Company's 2005 fiscal year.
Code of Ethics The Company has adopted a Code of Business Conduct and Ethics (the “Code of Ethics”), which is postedon the Company’s web site at www.safeway.com/investor_relations. The Code of Ethics applies to the Company’s principalexecutive officer, principal financial officer, principal accounting officer, controller and other persons who perform similarfunctions for the Company, in addition to the corporate directors and employees of the Company. Any amendment to, orwaiver from, a provision of the Code of Ethics that (i) applies to our chief executive officer, chief financial officer, principalaccounting officer, controller or any person performing functions similar to those performed by such officers, and (ii) relatesto any element of the code of ethics definitions, as enumerated in Item 406(b) of SEC Regulation S-K, will be posted on ourweb site at www.safeway.com within four business days following the date of the amendment or waiver.
Item 11. Executive Compensation
The information called for by Item 11 is incorporated by reference from the Company's definitive proxy statement for the2006 Annual Meeting of Stockholders to be filed pursuant to Regulation 14A under the Exchange Act no later than 120 daysafter the end of the Company's 2005 fiscal year. Information appearing under the captions “Report of the ExecutiveCompensation Committee”; “Report of the Audit Committee” and “Stock Performance Graph” to be included in theCompany's 2006 Proxy Statement is not incorporated herein by this reference.
Item 12. Security Ownership of Certain Beneficial Owners and Management and Related Stockholder Matters
The information called for by Item 12 is incorporated by reference from the Company's definitive proxy statement for the2006 Annual Meeting of Stockholders to be filed pursuant to Regulation 14A under the Exchange Act no later than 120 daysafter the end of the Company's 2005 fiscal year.
Item 13. Certain Relationships and Related Transactions
The information called for by Item 13 is incorporated by reference from the Company's definitive proxy statement for the2006 Annual Meeting of Stockholders to be filed pursuant to Regulation 14A under the Exchange Act no later than 120 daysafter the end of the Company's 2005 fiscal year.

SAFEWAY INC. AND SUBSIDIARIES
63
Item 14. Principal Accounting Fees and Services
The information called for by Item 14 is incorporated by reference from the Company’s definitive proxy statement for the2006 Annual Meeting of Stockholders to be filed pursuant to Regulation 14A under the Exchange Act no later than 120 daysafter the end of the Company’s 2005 fiscal year.
SAFEWAY INC. AND SUBSIDIARIES
64
PART IV
Item 15. Exhibits, Financial Statement Schedules
(a) The following documents are filed as a part of this report:
1. Consolidated Financial Statements:
See Index to Consolidated Financial Statements in Part II, Item 8 of this report.
2. Consolidated Financial Statement Schedules:
None required.
3. The following exhibits are filed as part of this report:
Exhibit 2.1 Agreement and Plan of Merger, dated as of July 22, 1999, among Safeway Inc., SI Merger Sub, Inc.and Randall’s Food Markets Inc. (incorporated by reference to Exhibit 2 to the registrant’s CurrentReport on Form 8-K dated August 3, 1999).
Exhibit 2.2 Agreement and Plan of Merger dated as of August 6, 1998 among Carr-Gottstein Foods Co.,Safeway Inc. and ACG Merger Sub, Inc. and Stockholder Support Agreement dated August 6, 1998entered into by Green Equity Investors, L.P. for the benefit of Safeway Inc. (incorporated byreference to Exhibit 2.1 of the registrant's Form 10-Q for the quarterly period ended September 12,1998).
Exhibit 2.3 Agreement and Plan of Merger dated as of October 13, 1998, by and among Safeway Inc., WindyCity Acquisition Corp. and Dominick’s Supermarkets, Inc. (incorporated by reference to Exhibit (c)(1)to registrant’s Schedule 14D-1 dated October 19, 1998), and Stockholders Agreement dated as ofOctober 12, 1998 between Safeway Inc., Windy City Acquisition Corp., and each of thestockholders of Dominick’s Supermarkets, Inc. named on the signature pages thereto (incorporatedby reference to Exhibit (c)(2) to registrant’s Schedule 14D-1 dated October 19, 1998).
Exhibit 3.1 Restated Certificate of Incorporation of Safeway Inc., as amended June 17, 2004, May 12, 1998 andMay 14, 1996 (incorporated by reference to Exhibit 3.1 to registrant’s Form S-3 Registration filed onJuly 27, 2004).
Exhibit 3.2 Form of By-Laws of the Company as amended and restated (incorporated by reference to Exhibit 3.2to the registrant's Form 10-Q for the quarterly period ended March 26, 2005).
Exhibit 4(i).1 Specimen Common Stock Certificate (incorporated by reference to Exhibit 4(i).2 to RegistrationStatement No. 33-33388).
Exhibit 4(i).2 Indenture dated as of September 1, 1992 between the Company and The Chase Manhattan Bank(National Association), as Trustee, relating to the Company's Debt Securities (incorporated byreference to Exhibit 4.1 of registrant's Current Report on Form 8-K dated September 16, 1992), assupplemented by the Supplemental Indenture dated as of September 4, 1997 (incorporated byreference to Exhibit 4(i).9 to registrant's Form 10-K for the year ended January 3, 1998).
SAFEWAY INC. AND SUBSIDIARIES
65
Item 15. Exhibits, Financial Statement Schedules (continued)
Exhibit 4(i).3 Form of Officers' Certificate relating to the Company's Fixed Rate Medium-Term Notes and theCompany's Floating Rate Medium-Term Notes, form of Fixed Rate Note and form of Floating RateNote (incorporated by reference to Exhibits 4.2, 4.3 and 4.4 of registrant's Current Report on Form8-K dated September 16, 1992).
Exhibit 4(i).4 Indenture, dated as of September 10, 1997, between Safeway Inc. and The Bank of New York, asTrustee (incorporated by reference to Exhibit 4.1 to registrant’s Current Report on Form 8-K datedSeptember 10, 1997).
Exhibit 4(i).5 Form of Officers’ Certificate establishing the terms of the 7.00% Senior Notes due 2007 and theCompany’s 7.45% Senior Debentures due 2027, including the forms of Notes (incorporated byreference to Exhibits 4.2, 4.3, 4.4, 4.5 and 4.6 to registrant’s Current Report on Form 8-K datedSeptember 10, 1997).
Exhibit 4(i).6 Form of Officers’ Certificate establishing the terms of the registrant’s 6.50% Notes due 2008,including form of Notes (incorporated by reference to Exhibits 4.2, 4.5 and 4.6 to registrant’sCurrent Report on Form 8-K dated November 9, 1998).
Exhibit 4(i).7 Form of Officers’ Certificate establishing terms of the registrant’s 7.5% Notes due 2009, includingthe form of Notes (incorporated by reference to Exhibits 4.2, 4.4, 4.5 and 4.6 to registrant’sCurrent Report on Form 8-K dated September 14, 1999).
Exhibit 4(i).8 Form of Officers’ Certificate establishing terms of the registrant’s 7.25% Debentures due 2031,including the form of Notes (incorporated by reference to Exhibits 4.2, 4.3, 4.4, 4.5 and 4.6 toregistrant’s Current Report on Form 8-K dated January 31, 2001).
Exhibit 4(i).9 Form of Officers’ Certificate establishing terms of the registrant’s 6.50% Notes due 2011, includingthe form of Notes (incorporated by reference to Exhibits 4.2, 4.3, 4.4, 4.5 and 4.6 to registrant’sCurrent Report on Form 8-K dated March 5, 2001).
Exhibit 4(i).10 Form of Officers’ Certificate establishing terms of the registrant’s 4.80% Notes due 2007, includingthe form of Notes (incorporated by reference to Exhibits 4.2, 4.3, 4.4, 4.5 and 4.6 to registrant’sCurrent Report on Form 8-K dated July 16, 2002).
Exhibit 4(i).11 Form of Officers’ Certificate establishing terms of the registrant’s 5.80% Notes due 2012, includingthe form of Notes (incorporated by reference to Exhibits 4.2, 4.3, 4.4, 4.5 and 4.6 to registrant’sCurrent Report on Form 8-K dated August 13, 2002).
Exhibit 4(i).12 Form of Officers’ Certificate establishing terms of the registrant’s 4.125% Notes due 2008including the form of Notes (incorporated by reference to Exhibits 4.2, 4.3, 4.4 and 4.5 toregistrant’s Current Report of Form 8-K dated October 29, 2003).
Exhibit 4(i).13 Form of Officers’ Certificate establishing terms of the registrant’s 4.950% Notes due 2010 and5.625% Notes due 2014, including the forms of Notes (incorporated by reference to Exhibits 4.2,4.3 and 4.4 to the registrant’s Current Report on Form 8-K dated August 12, 2004).
Exhibit 4(iii) Registrant agrees to provide the Securities and Exchange Commission, upon request, with copies ofinstruments defining the rights of holders of long-term debt of the registrant and all of itssubsidiaries for which consolidated financial statements are required to be filed with the Securitiesand Exchange Commission.
SAFEWAY INC. AND SUBSIDIARIES
66
Item 15. Exhibits, Financial Statement Schedules (continued)
Exhibit 10(iii).1* 1999 Amended and Restated Equity Participation Plan of Safeway Inc. (incorporated by referenceto Exhibit 10(iii).1 to the registrant’s Quarterly Report on Form 10-Q for the quarterly period endingJune 19, 1999), and Amendment to the 1999 Amended and Restated Equity Participation Plan(incorporated by reference to Exhibit 4.3 to the registrant’s Registration Statement on Form S-8(333-112976)).
Exhibit 10(iii).2* The 2001 Amended and Restated Share Appreciation Rights Plan of Canada Safeway Limited(incorporated by reference to Exhibit 10(iii).33 to the registrant’s Form 10-Q for the quarterlyperiod ended June 19, 2004).
Exhibit 10(iii).3* Share Appreciation Rights Plan of Lucerne Foods Ltd. (incorporated by reference to Exhibit 10(iii).18to registrant's Form 10-K for the year ended December 29, 1990) and Amendment No. 1 theretodated December 13, 1991 (incorporated by reference to Exhibit 10(iii).18 to registrant's Form 10-Kfor the year ended December 28, 1991).
Exhibit 10(iii).4* Amended and Restated 1997 Stock Purchase and Option Plan for Key Employees for Randall’s FoodMarkets, Inc. and Subsidiaries (incorporated by reference to Exhibit 4.3 to Randall’s Food Markets,Inc.’s Registration Statement on Form S-8 dated January 19, 1999).
Exhibit 10(iii).5* Randall’s Food Markets, Inc. Stock Option Plan and Restricted Stock Plan (incorporated by referenceto Exhibit 4.2 of Registration Statement 333-84749).
Exhibit 10(iii).6* Amendment dated September 11, 1999 to the Randall’s Food Markets, Inc. Stock Option andRestricted Stock and the Amended and Restated 1997 Stock Purchase and Option Plan forRandall’s Food Markets, Inc. and Subsidiaries (incorporated by reference to Exhibit 4.3 ofRegistration Statement 333-84749).
Exhibit 10(iii).7* The 1996 Equity Participation Plan of Dominick’s Supermarkets, Inc. (incorporated by reference toExhibit 10.13 to Dominick’s Supermarkets, Inc.’s Form 10-K for the year ended November 1, 1996).
Exhibit 10(iii).8* The 1995 Amended and Restated Stock Option Plan of Dominick’s Supermarkets, Inc.(incorporated by reference to Exhibit 10.12 to Dominick’s Supermarkets, Inc.’s Form 10-K for theyear ended November 1, 1996).
Exhibit 10(iii).9* Form of Amendment to Stock Option Agreements under The 1996 Equity Participation Plan ofDominick’s Supermarkets, Inc., and the 1995 Amended and Restated Stock Option Plan ofDominick’s Supermarkets, Inc. (incorporated by reference to Exhibit 4.5 to registrant’s Registrationon Form S-8 No. 333-67575 dated November 19, 1998).
Exhibit 10(iii).10* The 2001 Amended and Restated Operating Performance Bonus Plan for Executive Officers ofSafeway Inc. (incorporated by reference to Exhibit 10(ii).10 of registrant's Form 10-K for the yearended December 30, 2000).
Exhibit 10(iii).11* Capital Performance Bonus Plan for Executive Officers of Safeway Inc. (incorporated by reference toExhibit 10(iii).8 of registrant's Form 10-K for the year ended January 2, 1998).
______________
* Management contract, or compensatory plan or arrangement.
SAFEWAY INC. AND SUBSIDIARIES
67
Item 15. Exhibits, Financial Statement Schedules (continued)
Exhibit 10(iii).12* Retirement Restoration Plan of Safeway Inc. (incorporated by reference to Exhibit 10(iii).11 toregistrant's Form 10-K for the year ended January 1, 1994).
Exhibit 10(iii).13* Deferred Compensation Plan for Safeway Directors (incorporated by reference to Exhibit 10(iii).11of registrant's Form 10-K for the year ended December 31, 1994).
Exhibit 10(iii).14* Form of stock option agreement for former directors of The Vons Companies, Inc. (incorporated byreference to Exhibit 10(iii).12 of registrant's Form 10-K for the year ended December 28, 1996).
Exhibit 10(iii).15* The Vons Companies, Inc. Management Stock Option Plan (incorporated by reference to Exhibit10.3 to The Vons Companies, Inc. Annual Report on Form 10-K for the twenty-seven weeks endedJanuary 3, 1988).
Exhibit 10(iii).16* The Vons Companies, Inc. 1990 Stock Option and Restricted Stock Plan (incorporated by referenceto Appendix A to The Vons Companies, Inc. Proxy Statement for its May 17, 1990 Annual Meetingof Shareholders).
Exhibit 10(iii).17* Amendment, dated February 17, 1993, to The Vons Companies, Inc. 1990 Stock Option andRestricted Stock Plan (incorporated by reference to Exhibit 10.13.1 to The Vons Companies, Inc.Form 10-Q for the quarterly period ended March 28, 1993).
Exhibit 10(iii).18* Safeway Executive Deferred Compensation Plan and Deferral Election Form (incorporated byreference to Exhibit 10(iii).18 to the registrant's Form 10-K for the year ended January 1, 2000).
Exhibit 10(iii).19* Canada Safeway Limited Executive Deferred Compensation Plan and Deferral Election Form(incorporated by reference to Exhibit 10(iii).19 to the registrant's Form 10-K for the year endedJanuary 1, 2000).
Exhibit 10(iii).20* Safeway Inc. Stock Option Gain Deferred Compensation Plan and Deferral Election Form(incorporated by reference to Exhibit 10(iii).20 to the registrant's Form 10-K for the year endedJanuary 1, 2000).
Exhibit 10(iii).21* Amendment, effective as of December 13, 1996, to The Vons Companies, Inc. 1990 Stock Optionand Restricted Stock Plan (incorporated by reference to Exhibit 10.7.2 to The Vons Companies, Inc.Form 10-K for the fiscal year ended December 29, 1996).
Exhibit 10(iii).22* Form of Amendments, dated April 8, 1997, to The Vons Companies, Inc. Management StockOption Plan and The Vons Companies, Inc. 1990 Stock Option and Restricted Stock Plan(incorporated by reference to Exhibit 4.5 to registrant’s Form S-4 filed on March 5, 1997).
Exhibit 10(iii).23* Employment Agreement made and entered into as of April 10, 2004 by and between Safeway Inc.and Brian Cornell (incorporated by reference to Exhibit 10 of registrant's Form 10-Q for thequarterly period ended March 27, 2004).
Exhibit 10(iii).24* The 2002 Equity Incentive Plan of Safeway Inc. (incorporated by reference to Exhibit 4.1 ofregistrant’s Registration Statement No. 333-98103 on Form S-8 dated August 14, 2002).
______________* Management contract, or compensatory plan or arrangement.
SAFEWAY INC. AND SUBSIDIARIES
68
Item 15. Exhibits, Financial Statement Schedules (continued)
Exhibit 10(iii).25* Amendment dated February 26, 2004 to the Amended and Restated 1999 Equity Participation Planof Safeway Inc. (incorporated by reference to Exhibit 10(iii).27 to the registrant’s Form 10-Q for thequarterly period ended June 19, 2004).
Exhibit 10(iii).26* Amendment dated May 2, 2004 to the Amended and Restated 1999 Equity Participation Plan ofSafeway Inc. (incorporated by reference to Exhibit 10(iii).28 to the Registrant’s Form 10-Q for thequarterly period ended June 19, 2004).
Exhibit 10(iii).27* Amendment dated June 2, 2004 to the Amended and Restated 1999 Equity Participation Plan ofSafeway Inc. (incorporated by reference to Exhibit 10(iii).29 to the registrant’s Form 10-Q for thequarterly period ended June 19, 2004).
Exhibit 10(iii).28* Form of Non-Qualified Stock Option Agreement for U.S. Employees for the Amended and Restated1999 Equity Participation Plan (incorporated by reference to Exhibit 10(iii).30 to the registrant’sForm 10-Q for the quarterly period ended June 19, 2004).
Exhibit 10(iii).29* Amendment dated May 2, 2004 to the 2002 Equity Incentive Plan of Safeway Inc. (incorporatedby reference to Exhibit 10(iii).31 to the registrant’s Form 10-Q for the quarterly period ended June19, 2004).
Exhibit 10(iii).30* Deferred Compensation Plan for Safeway Non-Employee Directors, Amended and Restated June 2,2004 (incorporated by reference to Exhibit 10(iii).32 to the registrant’s Form 10-Q for the quarterlyperiod ended June 19, 2004).
Exhibit 10(iii).31* Form of Stock Rights Agreement for the Amended and Restated 1999 Equity Participation Plan ofSafeway Inc. and the 2001 Amended and Restated Share Appreciation Rights Plan of CanadaSafeway Limited (incorporated by reference to Exhibit 10(iii).34 to the registrant’s Form 10-Q forthe quarterly period ended June 19, 2004).
Exhibit 10(iii).32* Supplemental Retirement Benefit Agreement between Safeway Inc. and Steven A. Burd datedMarch 10, 2005 (incorporated by reference to Exhibit 10.1 to the registrant’s Current Report onForm 8-K dated March 10, 2005).
Exhibit 10(iii).33* Amendment dated March 10, 2005 to the Amended and Restated 1999 Equity Participation Planof Safeway Inc. (incorporated by reference to Exhibit 10.2 to the registrant’s Current Report onForm 8-K dated March 10, 2005).
Exhibit 10(iii).34 Form of Credit Agreement dated as of June 1, 2005 by and among Safeway Inc., Canada SafewayLimited, Banc of America Securities LLC and J.P. Morgan Securities Inc., as joint lead arrangers,Deutsche Bank AG New York Branch, as administrative agent, Bank of America, N.A., JPMorganChase Bank, National Association, Citicorp USA, Inc. and BNP Paribas, as co-syndication agents,U.S. National Bank Association, as documentation agent, and the lenders that are parties to theAgreement (incorporated by reference to Exhibit 10.1 to the Company’s Current Report on Form8-K filed on June 7, 2005).
Exhibit 10(iii).35* Blackhawk Marketing Services, Inc. 2006 Restricted Stock Plan for Eligible Employees of SafewayInc. (incorporated by reference to Exhibit 10.1 to the Company’s Current Report on Form 8-K filedon February 28, 2006).
______________* Management contract, or compensatory plan or arrangement.
SAFEWAY INC. AND SUBSIDIARIES
69
Item 15. Exhibits, Financial Statement Schedules (continued)
Exhibit 10(iii).36* Form of Restricted Stock Award Grant Notice and Restricted Stock Agreement (incorporated byreference to Exhibit 10.2 to the Company’s Current Report on Form 8-K filed on February 28,2006).
Exhibit 11.1 Computation of Earnings per Share (set forth in Part II, Item 8 of this report).
Exhibit 12.1 Computation of Ratio of Earnings to Fixed Charges.
Exhibit 14 Safeway Inc. Code of Business Conduct and Ethics (incorporated by reference to Exhibit 14 to theregistrant’s Current Report on Form 8-K dated March 10, 2005).
Exhibit 21.1 Schedule of Subsidiaries.
Exhibit 23.1 Consent of Independent Registered Public Accounting Firm.
Exhibit 24 Power of Attorney (included on the signature page of this Annual Report on Form 10-K of SafewayInc.).
Exhibit 31.1 Rule 13(a)-14(a)/15d-14(a) Certification.
Exhibit 31.2 Rule 13(a)-14(a)/15d-14(a) Certification.
Exhibit 32 Section 1350 Certifications.
______________* Management contract, or compensatory plan or arrangement.
SAFEWAY INC. AND SUBSIDIARIES
70
Signatures
Pursuant to the requirements of Section 13 or 15(d) of the Securities Exchange Act of 1934, the registrant has duly causedthis report to be signed on its behalf by the undersigned, thereunto duly authorized.
SAFEWAY INC.
By: /s/ Steven A. Burd Date: March 10, 2006
Steven A. BurdChairman, President andChief Executive Officer
KNOW ALL PERSONS BY THESE PRESENTS, that each person whose signature appears below hereby constitutes and appointsSTEVEN A. BURD, ROBERT L. EDWARDS and ROBERT A. GORDON and each of them, his or her true and lawful attorneys-in-fact and agents, with full power of substitution and resubstitution, in his or her name, place and stead, in any and allcapacities, to sign any and all amendments to this Annual Report on Form 10-K, and to file the same, with all exhibitsthereto, and other documents in connection therewith, with the Securities and Exchange Commission, granting unto suchattorneys-in-fact and agents full power and authority to do and perform each and every act, as fully to all intents andpurposes as they might or could do in person, thereby ratifying and confirming all that such attorneys-in-fact and agents, orany of them, or their substitutes, may lawfully do or cause to be done by virtue hereof.
Pursuant to the requirements of the Securities Exchange Act of 1934, this report has been signed below by the followingpersons on behalf of the registrant and in the capacities and on the dates indicated.
By: /s/ Robert L. Edwards Date: March 10, 2006
Robert L. EdwardsExecutive Vice President and Chief FinancialOfficer
/s/ David F. Bond Date: March 10, 2006
David F. Bond
Senior Vice President, Finance and Control(Chief Accounting Officer)
Director
/s/ Steven A. Burd Date: March 10, 2006Steven A. Burd
/s/ Paul Hazen March 10, 2006Paul Hazen
/s/ Janet E. Grove March 10, 2006Janet E. Grove
/s/ Mohan Gyani March 10, 2006Mohan Gyani
/s/ Robert I. MacDonnell March 10, 2006Robert I. MacDonnell
/s/ Douglas J. Mackenzie March 10, 2006Douglas J. Mackenzie
SAFEWAY INC. AND SUBSIDIARIES
71
Director
/s/ Rebecca A. Stirn Date: March 10, 2006Rebecca A. Stirn
/s/ William Y. Tauscher March 10, 2006William Y. Tauscher
/s/ Raymond G. Viault March 10, 2006Raymond G. Viault
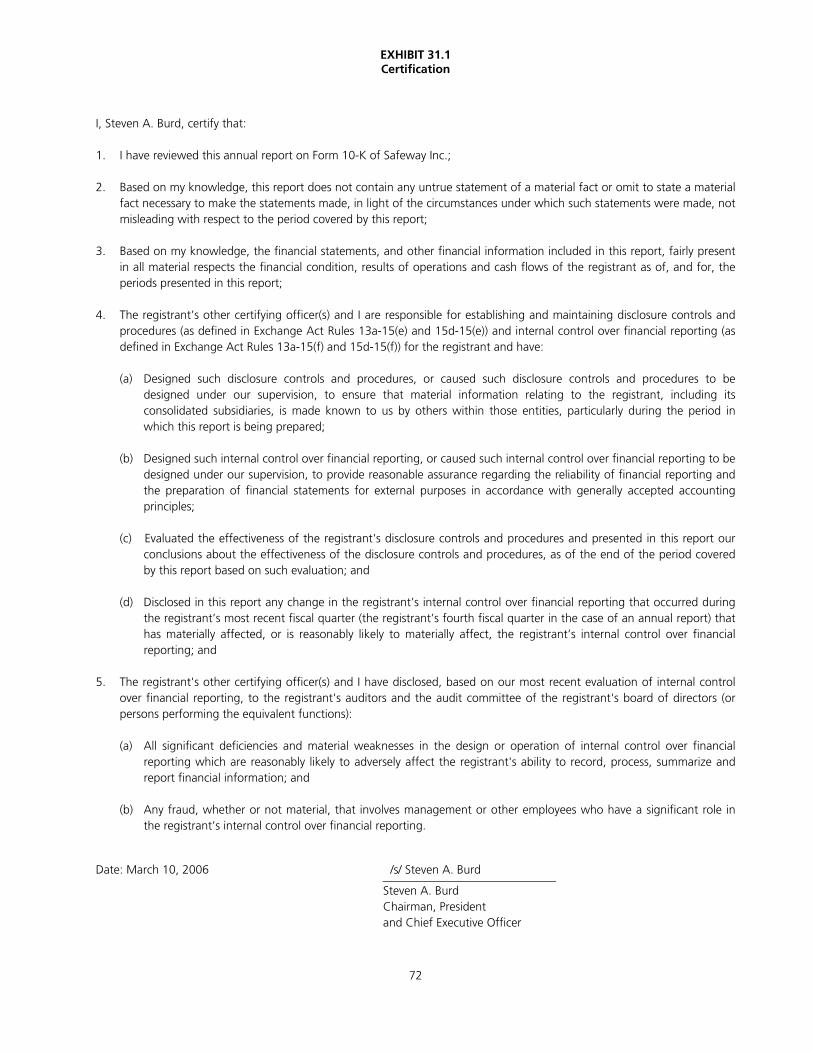
EXHIBIT 31.1Certification
72
I, Steven A. Burd, certify that:
1. I have reviewed this annual report on Form 10-K of Safeway Inc.;
2. Based on my knowledge, this report does not contain any untrue statement of a material fact or omit to state a materialfact necessary to make the statements made, in light of the circumstances under which such statements were made, notmisleading with respect to the period covered by this report;
3. Based on my knowledge, the financial statements, and other financial information included in this report, fairly presentin all material respects the financial condition, results of operations and cash flows of the registrant as of, and for, theperiods presented in this report;
4. The registrant’s other certifying officer(s) and I are responsible for establishing and maintaining disclosure controls andprocedures (as defined in Exchange Act Rules 13a-15(e) and 15d-15(e)) and internal control over financial reporting (asdefined in Exchange Act Rules 13a-15(f) and 15d-15(f)) for the registrant and have:
(a) Designed such disclosure controls and procedures, or caused such disclosure controls and procedures to bedesigned under our supervision, to ensure that material information relating to the registrant, including itsconsolidated subsidiaries, is made known to us by others within those entities, particularly during the period inwhich this report is being prepared;
(b) Designed such internal control over financial reporting, or caused such internal control over financial reporting to bedesigned under our supervision, to provide reasonable assurance regarding the reliability of financial reporting andthe preparation of financial statements for external purposes in accordance with generally accepted accountingprinciples;
(c) Evaluated the effectiveness of the registrant's disclosure controls and procedures and presented in this report ourconclusions about the effectiveness of the disclosure controls and procedures, as of the end of the period coveredby this report based on such evaluation; and
(d) Disclosed in this report any change in the registrant’s internal control over financial reporting that occurred duringthe registrant’s most recent fiscal quarter (the registrant’s fourth fiscal quarter in the case of an annual report) thathas materially affected, or is reasonably likely to materially affect, the registrant’s internal control over financialreporting; and
5. The registrant's other certifying officer(s) and I have disclosed, based on our most recent evaluation of internal controlover financial reporting, to the registrant's auditors and the audit committee of the registrant's board of directors (orpersons performing the equivalent functions):
(a) All significant deficiencies and material weaknesses in the design or operation of internal control over financialreporting which are reasonably likely to adversely affect the registrant's ability to record, process, summarize andreport financial information; and
(b) Any fraud, whether or not material, that involves management or other employees who have a significant role inthe registrant’s internal control over financial reporting.
Date: March 10, 2006 /s/ Steven A. Burd
Steven A. BurdChairman, Presidentand Chief Executive Officer
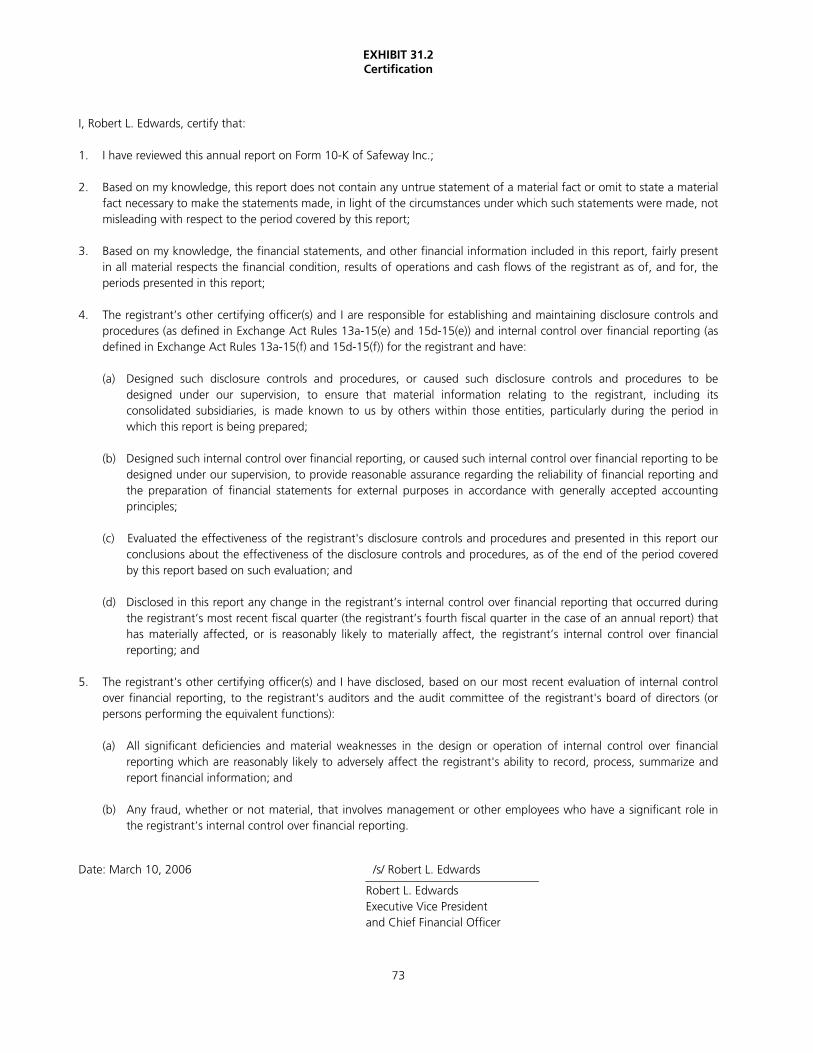
EXHIBIT 31.2Certification
73
I, Robert L. Edwards, certify that:
1. I have reviewed this annual report on Form 10-K of Safeway Inc.;
2. Based on my knowledge, this report does not contain any untrue statement of a material fact or omit to state a materialfact necessary to make the statements made, in light of the circumstances under which such statements were made, notmisleading with respect to the period covered by this report;
3. Based on my knowledge, the financial statements, and other financial information included in this report, fairly presentin all material respects the financial condition, results of operations and cash flows of the registrant as of, and for, theperiods presented in this report;
4. The registrant’s other certifying officer(s) and I are responsible for establishing and maintaining disclosure controls andprocedures (as defined in Exchange Act Rules 13a-15(e) and 15d-15(e)) and internal control over financial reporting (asdefined in Exchange Act Rules 13a-15(f) and 15d-15(f)) for the registrant and have:
(a) Designed such disclosure controls and procedures, or caused such disclosure controls and procedures to bedesigned under our supervision, to ensure that material information relating to the registrant, including itsconsolidated subsidiaries, is made known to us by others within those entities, particularly during the period inwhich this report is being prepared;
(b) Designed such internal control over financial reporting, or caused such internal control over financial reporting to bedesigned under our supervision, to provide reasonable assurance regarding the reliability of financial reporting andthe preparation of financial statements for external purposes in accordance with generally accepted accountingprinciples;
(c) Evaluated the effectiveness of the registrant's disclosure controls and procedures and presented in this report ourconclusions about the effectiveness of the disclosure controls and procedures, as of the end of the period coveredby this report based on such evaluation; and
(d) Disclosed in this report any change in the registrant’s internal control over financial reporting that occurred duringthe registrant’s most recent fiscal quarter (the registrant’s fourth fiscal quarter in the case of an annual report) thathas materially affected, or is reasonably likely to materially affect, the registrant’s internal control over financialreporting; and
5. The registrant's other certifying officer(s) and I have disclosed, based on our most recent evaluation of internal controlover financial reporting, to the registrant's auditors and the audit committee of the registrant's board of directors (orpersons performing the equivalent functions):
(a) All significant deficiencies and material weaknesses in the design or operation of internal control over financialreporting which are reasonably likely to adversely affect the registrant's ability to record, process, summarize andreport financial information; and
(b) Any fraud, whether or not material, that involves management or other employees who have a significant role inthe registrant’s internal control over financial reporting.
Date: March 10, 2006 /s/ Robert L. Edwards
Robert L. EdwardsExecutive Vice Presidentand Chief Financial Officer
EXHIBIT 32Certifications
74
Certification of Chief Executive Officer
Pursuant to 18 U.S.C. § 1350, as created by Section 906 of the Sarbanes-Oxley Act of 2002, the undersignedofficer of Safeway Inc. (the “Company”) hereby certifies that:
(i) the Annual Report on Form 10-K of the Company for the fiscal year ended December 31, 2005 (the“Report”) fully complies with the requirements of Section 13(a) or Section 15(d), as applicable, of the SecuritiesExchange Act of 1934, as amended; and
(ii) the information contained in the Report fairly presents, in all material respects, the financial condition andresults of operations of the Company.
Dated: March 10, 2006 /s/ Steven A. BurdSteven A. BurdChief Executive Officer
Certification of Chief Financial Officer
Pursuant to 18 U.S.C. § 1350, as created by Section 906 of the Sarbanes-Oxley Act of 2002, the undersignedofficer of Safeway Inc. (the “Company”) hereby certifies that:
(i) the Annual Report on Form 10-K of the Company for the fiscal year ended December 31, 2005 (the“Report”) fully complies with the requirements of Section 13(a) or Section 15(d), as applicable, of the SecuritiesExchange Act of 1934, as amended; and
(ii) the information contained in the Report fairly presents, in all material respects, the financial condition andresults of operations of the Company.
Dated: March 10, 2006 /s/ Robert L. EdwardsRobert L. EdwardsChief Financial Officer
The foregoing certifications are being furnished solely to accompany the Report pursuant to 18 U.S.C. § 1350, and are notbeing filed for purposes of Section 18 of the Securities Exchange Act of 1934, as amended, and are not to be incorporatedby reference into any filing of the Company, whether made before or after the date hereof, regardless of any generalincorporation language in such filing.
A signed original of this written statement as required by Section 906 has been provided to Safeway Inc., and will beretained by Safeway Inc. and furnished to the Securities and Exchange Commission or its staff upon request.
Executive OfficesMailing Address:Safeway Inc.P.O. Box 99Pleasanton, CA 94566-0009
Internet AddressSafeway’s web site on the Internet canbe accessed at www.safeway.com. Wedo not incorporate the information onour web site into this annual report,and you should not consider it part ofthis annual report.
Stock Transfer Agent and RegistrarComputershare Trust Company, N.A.P.O. Box 43023Providence, RI 02940-3023877-498-8861Hearing impaired: 800-952-9245www.computershare.com
Annual Report on Form 10-KSafeway’s 2005 Annual Report on Form 10-K filed with the Securities and Exchange Commissioncan be accessed online at www.safeway. com/investor_relations.Alternately, a copy of the form may beobtained by writing to the InvestorRelations Department at our executiveoffices or by calling 925-467-3790.
Certifications The company submitted a Section12(a) CEO certification to the New YorkStock Exchange within 30 days of its2005 Annual Meeting of Stockholders.
Independent AuditorsDeloitte & Touche LLP San Francisco, California
Annual MeetingThe 2006 Annual Meeting ofStockholders will be held on May 25,2006. A notice of the meeting, together with a proxy statement and a form of proxy, will be mailed tostockholders within 120 days of theend of the fiscal year.
Stock Exchange ListingThe company’s common stock, whichtrades under the symbol SWY, and certain debentures and notes are listedon the New York Stock Exchange.
Investor InquiriesCommunication regarding investorrecords, including changes of addressor ownership, should be directed to the company’s transfer agent,Computershare Trust Company, N.A.,at the address listed on the left. To inquire by phone, please call 877-498-8861, or visit their web site at www.computershare.com.
Investors, security analysts andmembers of the media should directtheir financial inquiries to our InvestorRelations Department at 925-467-3832.
To access or obtain financialreports, please visit our web site atwww. safeway. com/investor_relations,write to our Investor RelationsDepartment or call 925-467-3790.
EEO-1 ReportAs an equal opportunity employer,Safeway values and actively supportsdiversity in the workplace. A copy ofthe company’s 2005 summary EEO-1report, filed with the federal EqualEmployment Opportunity Commission,is available upon request at our executive offices.
Trustees and Paying Agents4.125% Senior Notes 4.80% Senior Notes4.95% Senior Notes5.625% Senior Notes5.80% Senior Notes6.15% Senior Notes6.50% Senior Notes7.00% Senior Notes7.25% Senior Debentures7.45% Senior Debentures7.50% Senior Notes9.875% Senior Subordinated
Debentures
The Bank of New YorkBondholder Relations DepartmentCorporate Trust DivisionFiscal Agencies Department101 Barclay Street, 7-EastNew York, NY 10286800-548-5075
9.30% Senior Secured Debentures
JPMorgan Chase & Co.Institutional Trust ServicesP.O. Box 2320Dallas, TX 75221-2320800-275-2048
4.45% Senior Notes (Canada Safeway Limited)
BNY Trust Company of Canada 4 King Street West, Suite 1101Toronto, Ontario MSH 1B6416-933-8500
Investor InformationD
ES
IG
N:
B
RO
OM
&
B
RO
OM
,
IN
C.
S
AN
F
RA
NC
IS
CO
SAFEWAY INC. AND SUBSIDIARIES
Safeway Inc.P.O. Box 99 Pleasanton, CA 94566-0009 www.safeway.com