Embed Size (px)
Citation preview
Recent Developments in China’s Stock Markets
August 2015
Published by:
Ali Dagli (Partner), Okan Inaltay (Analyst), Zepeng “Frank” Wu (Intern)
2
Table of Contents
1 Recent Developments in China’s Stock Markets
2 GP Bullhound Update

3
Executive Summary on China’s Stock Market Developments
After the Global Financial Crisis of 2007-2008, China’s stock market remained stable
China’s markets are too big to ignore: as of May 2015, 3 of the world’s 6 largest stock
exchanges are Chinese (including Hong Kong as the 6th largest)
China’s markets started their dramatic rise in November 2014 and after just 7 months in June
2015, reached their highest levels since 2008
This was a $8 trillion (125%+) increase in less than 1 year and half the companies listed on
the Shanghai and Shenzhen exchanges were priced above 85x earnings
With the one month plunge in June 2015, China’s stock markets in total lost $4 trillion;
>2x the size of India’s entire stock market and >15x of total GDP in Greece
The major cause for the massive decline was the deleveraging process of the colossal
amount of margin trading
― When stock prices fell, investors who bought stocks with borrowed money had to either
increase their margin or liquidate their positions
― As investors liquidated their positions, the stock prices fell further, which prompted more
investors to liquidate their positions, resulting in an ever-accelerating downward spiral
― The deleveraging process slowed down due to a large number of company trading
suspensions and Chinese government’s actions
After unprecedented levels of Chinese government actions, China’s markets rebounded
and stabilized a bit, before crashing again on August 24 dubbed “Black Monday” – Over
80% of the stocks listed in Shanghai were down by more than 10%
China’s stock market developments should draw Western investors’ attention, as declines
on China’s exchanges negatively affected US-listed Chinese companies during the last 3
months, especially Sohu (-35%), Youku (-48%), and Sina (-23%)
The increased market volatility also poses question on whether the wave of US-listed Chinese
companies delisting in the US and relisting in China will continue
With the recent market volatility and significant decline in valuations, publicly-listed Chinese
companies that are aggressive with overseas acquisition plans will likely shift to more cash-
based acquisition strategies
Although the GDP in China continues to grow at a healthy rate (7.7% vs 5.0% in India and
2.2% in US) and the amount available for trading is still a relatively small portion of GDP
(1/3rd compared with 100%+ in western markets)…
…questions still remain on whether or not state intervention failed, how far this could go,
and how badly these recent developments damaged confidence of Chinese (85% is retail)
and foreign investors (only 2% of total) in Chinese equity markets – and more importantly
confidence in the Chinese government
Sources: Bloomberg.com, CapitalIQ, Economist.com, FactSet.com, Eastday.com, Forbes.com, FT.com, Money.cnn.com, SSE.com.cn, SZSE.cn, and WSJ.com
Notes: $ represents USD
8/24/2014 11/24/2014 2/24/2015 5/24/2015 8/24/2015
1 year period
Shanghai Composite
Margin Balance
Shenzhen Composite
Hang Seng Index
4
Overview of Largest Chinese Stock Exchanges & Nasdaq
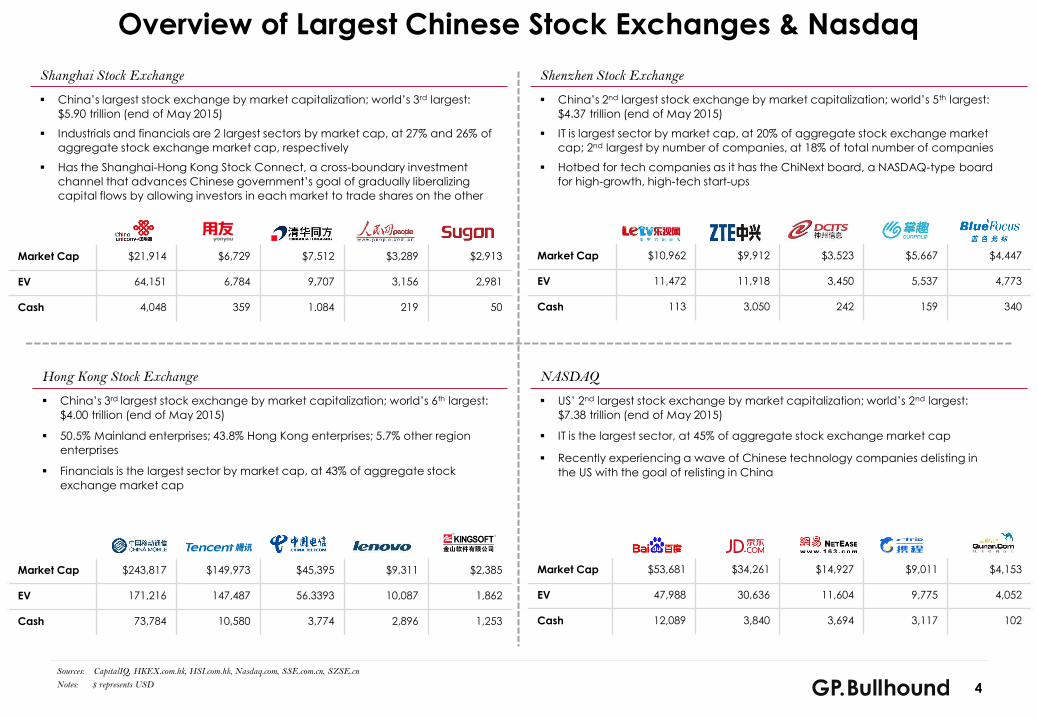
Shanghai Stock Exchange
China’s largest stock exchange by market capitalization; world’s 3rd largest:
$5.90 trillion (end of May 2015)
Industrials and financials are 2 largest sectors by market cap, at 27% and 26% of
aggregate stock exchange market cap, respectively
Has the Shanghai-Hong Kong Stock Connect, a cross-boundary investment
channel that advances Chinese government’s goal of gradually liberalizing
capital flows by allowing investors in each market to trade shares on the other
Hong Kong Stock Exchange
China’s 3rd largest stock exchange by market capitalization; world’s 6th largest:
$4.00 trillion (end of May 2015)
50.5% Mainland enterprises; 43.8% Hong Kong enterprises; 5.7% other region
enterprises
Financials is the largest sector by market cap, at 43% of aggregate stock
exchange market cap
Shenzhen Stock Exchange
China’s 2nd largest stock exchange by market capitalization; world’s 5th largest:
$4.37 trillion (end of May 2015)
IT is largest sector by market cap, at 20% of aggregate stock exchange market
cap; 2nd largest by number of companies, at 18% of total number of companies
Hotbed for tech companies as it has the ChiNext board, a NASDAQ-type board
for high-growth, high-tech start-ups
NASDAQ
US’ 2nd largest stock exchange by market capitalization; world’s 2nd largest:
$7.38 trillion (end of May 2015)
IT is the largest sector, at 45% of aggregate stock exchange market cap
Recently experiencing a wave of Chinese technology companies delisting in
the US with the goal of relisting in China
Market Cap $21,914 $6,729 $7,512 $3,289 $2,913
EV 64,151 6,784 9,707 3,156 2,981
Cash 4,048 359 1.084 219 50
Market Cap $10,962 $9,912 $3,523 $5,667 $4,447
EV 11,472 11,918 3,450 5,537 4,773
Cash 113 3,050 242 159 340
Market Cap $243,817 $149,973 $45,395 $9,311 $2,385
EV 171,216 147,487 56.3393 10,087 1,862
Cash 73,784 10,580 3,774 2,896 1,253
Market Cap $53,681 $34,261 $14,927 $9,011 $4,153
EV 47,988 30,636 11,604 9,775 4,052
Cash 12,089 3,840 3,694 3,117 102
Sources: CapitalIQ, HKEX.com.hk, HSI.com.hk, Nasdaq.com, SSE.com.cn, SZSE.cn
Notes: $ represents USD
5
¥1,500
¥2,000
¥2,500
¥3,000
¥3,500
¥4,000
¥4,500
¥5,000
¥5,500
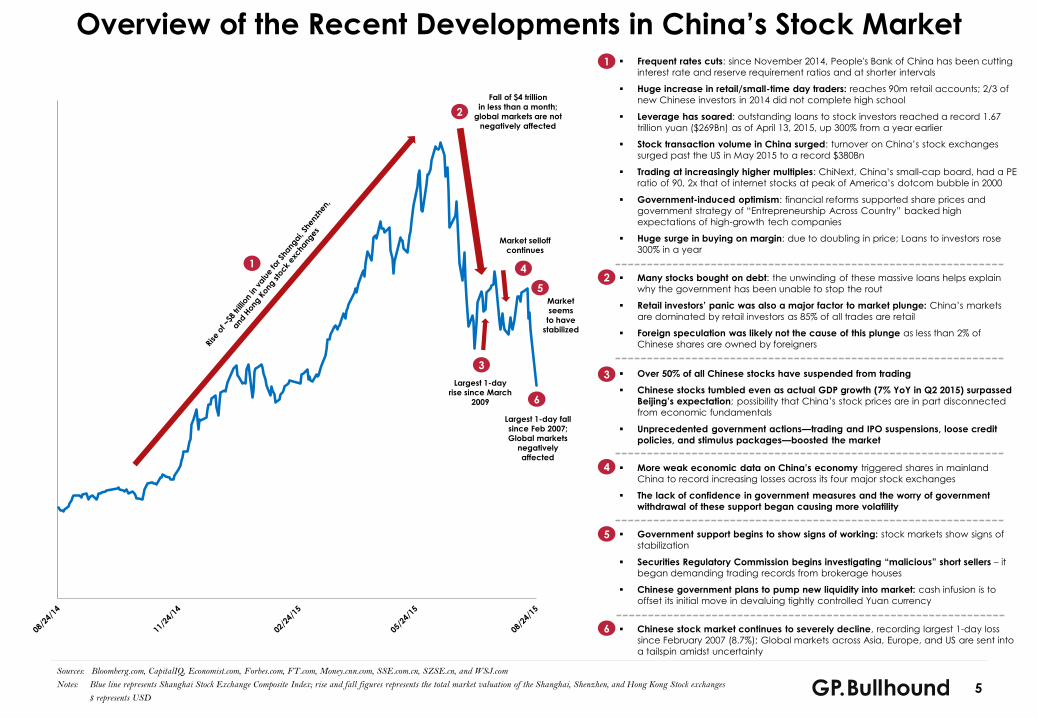
Overview of the Recent Developments in China’s Stock Market Frequent rates cuts: since November 2014, People's Bank of China has been cutting
interest rate and reserve requirement ratios and at shorter intervals
Huge increase in retail/small-time day traders: reaches 90m retail accounts; 2/3 of
new Chinese investors in 2014 did not complete high school
Leverage has soared: outstanding loans to stock investors reached a record 1.67
trillion yuan ($269Bn) as of April 13, 2015, up 300% from a year earlier
Stock transaction volume in China surged: turnover on China’s stock exchanges
surged past the US in May 2015 to a record $380Bn
Trading at increasingly higher multiples: ChiNext, China’s small-cap board, had a PE
ratio of 90, 2x that of internet stocks at peak of America’s dotcom bubble in 2000
Government-induced optimism: financial reforms supported share prices and
government strategy of “Entrepreneurship Across Country” backed high
expectations of high-growth tech companies
Huge surge in buying on margin: due to doubling in price; Loans to investors rose
300% in a year
Many stocks bought on debt: the unwinding of these massive loans helps explain
why the government has been unable to stop the rout
Retail investors’ panic was also a major factor to market plunge: China’s markets
are dominated by retail investors as 85% of all trades are retail
Foreign speculation was likely not the cause of this plunge as less than 2% of
Chinese shares are owned by foreigners
Over 50% of all Chinese stocks have suspended from trading
Chinese stocks tumbled even as actual GDP growth (7% YoY in Q2 2015) surpassed
Beijing’s expectation; possibility that China’s stock prices are in part disconnected
from economic fundamentals
Unprecedented government actions—trading and IPO suspensions, loose credit
policies, and stimulus packages—boosted the market
More weak economic data on China’s economy triggered shares in mainland
China to record increasing losses across its four major stock exchanges
The lack of confidence in government measures and the worry of government
withdrawal of these support began causing more volatility
Government support begins to show signs of working: stock markets show signs of
stabilization
Securities Regulatory Commission begins investigating “malicious” short sellers – it
began demanding trading records from brokerage houses
Chinese government plans to pump new liquidity into market: cash infusion is to
offset its initial move in devaluing tightly controlled Yuan currency
Chinese stock market continues to severely decline, recording largest 1-day loss
since February 2007 (8.7%); Global markets across Asia, Europe, and US are sent into
a tailspin amidst uncertainty
1
2
3
4
5
Sources: Bloomberg.com, CapitalIQ, Economist.com, Forbes.com, FT.com, Money.cnn.com, SSE.com.cn, SZSE.cn, and WSJ.com
Notes: Blue line represents Shanghai Stock Exchange Composite Index; rise and fall figures represents the total market valuation of the Shanghai, Shenzhen, and Hong Kong Stock exchanges
$ represents USD
6
Fall of $4 trillion
in less than a month;
global markets are not
negatively affected
Largest 1-day
rise since March
2009
3
Market selloff
continues
4
5Market
seems
to have
stabilized
6
Largest 1-day fall
since Feb 2007;
Global markets
negatively
affected
6
$20,000
$21,000
$22,000
$23,000
$24,000
$25,000
$26,000
$27,000
$28,000
$29,000
$30,000
10
¥500
¥1,000
¥1,500
¥2,000
¥2,500
¥3,000
¥3,500
¥1,500
¥2,000
¥2,500
¥3,000
¥3,500
¥4,000
¥4,500
¥5,000
¥5,500
$4,000
$4,200
$4,400
$4,600
$4,800
$5,000
$5,200
$5,400
Nasdaq Composite Index
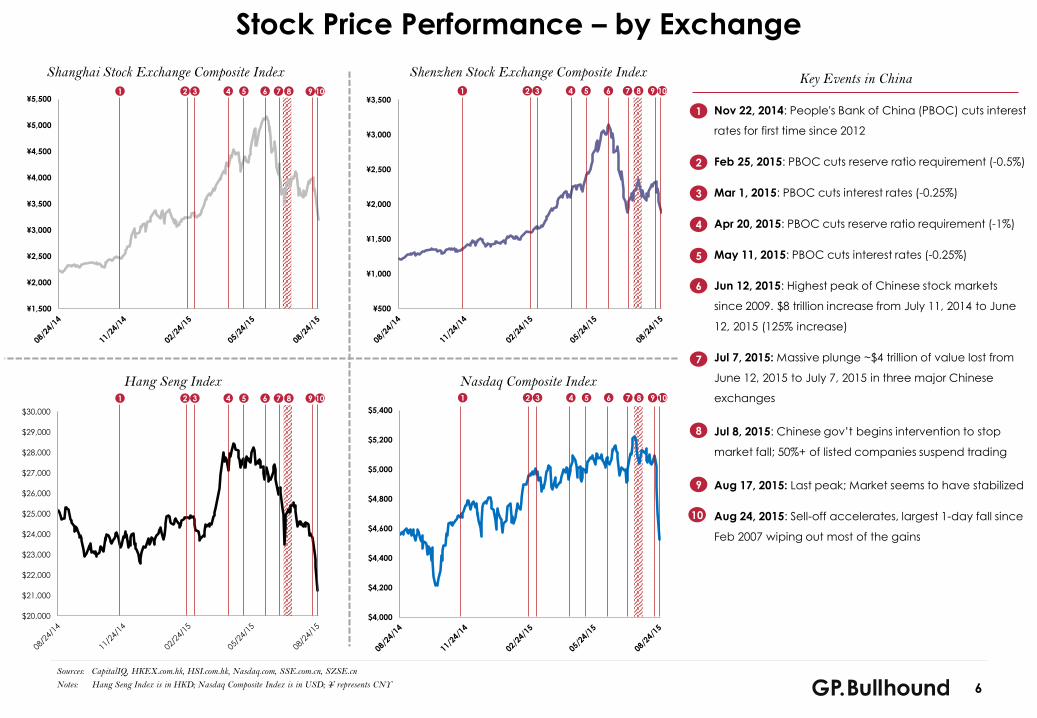
Stock Price Performance – by Exchange
Shenzhen Stock Exchange Composite Index Key Events in ChinaShanghai Stock Exchange Composite Index
Hang Seng Index
Nov 22, 2014: People's Bank of China (PBOC) cuts interest
rates for first time since 2012
Feb 25, 2015: PBOC cuts reserve ratio requirement (-0.5%)
Mar 1, 2015: PBOC cuts interest rates (-0.25%)
Apr 20, 2015: PBOC cuts reserve ratio requirement (-1%)
May 11, 2015: PBOC cuts interest rates (-0.25%)
Jun 12, 2015: Highest peak of Chinese stock markets
since 2009. $8 trillion increase from July 11, 2014 to June
12, 2015 (125% increase)
Jul 7, 2015: Massive plunge ~$4 trillion of value lost from
June 12, 2015 to July 7, 2015 in three major Chinese
exchanges
Jul 8, 2015: Chinese gov’t begins intervention to stop
market fall; 50%+ of listed companies suspend trading
Aug 17, 2015: Last peak; Market seems to have stabilized
Aug 24, 2015: Sell-off accelerates, largest 1-day fall since
Feb 2007 wiping out most of the gains
Sources: CapitalIQ, HKEX.com.hk, HSI.com.hk, Nasdaq.com, SSE.com.cn, SZSE.cn
Notes: Hang Seng Index is in HKD; Nasdaq Composite Index is in USD; ¥ represents CNY
1
2
3
4
5
6
7
8
2 3 4 5 6 7 81
9
10
9 10 2 3 4 5 6 7 81 9
2 3 4 5 6 7 81 9 10 2 3 4 5 6 7 81 109
7
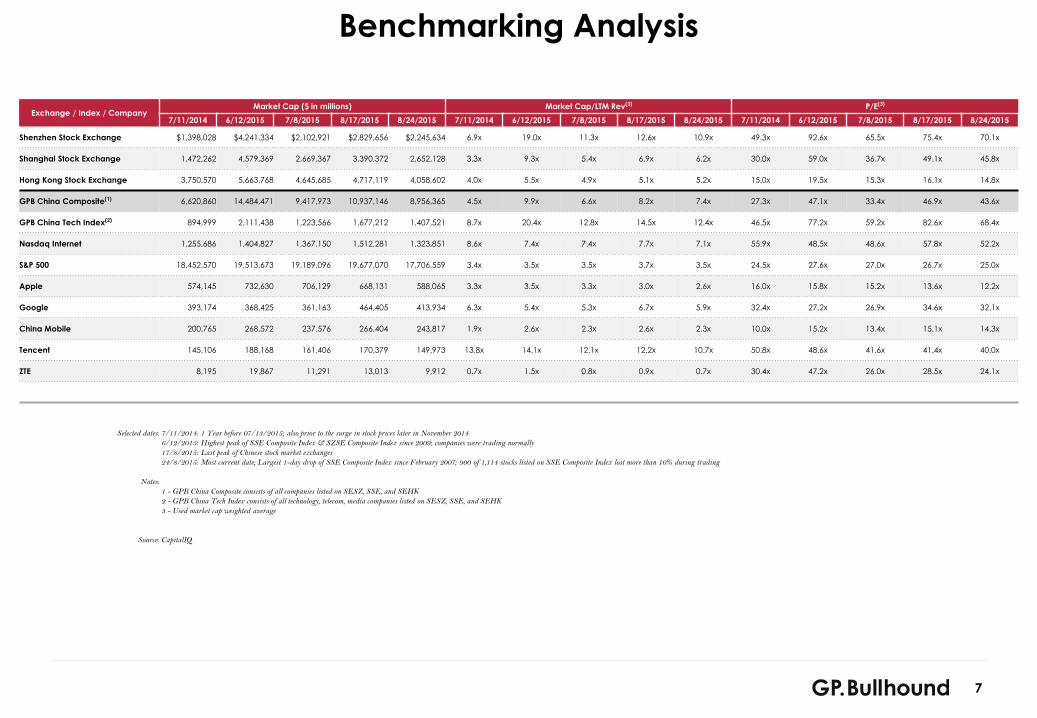
Benchmarking Analysis
Exchange / Index / CompanyMarket Cap ($ in millions) Market Cap/LTM Rev(3) P/E(3)
7/11/2014 6/12/2015 7/8/2015 8/17/2015 8/24/2015 7/11/2014 6/12/2015 7/8/2015 8/17/2015 8/24/2015 7/11/2014 6/12/2015 7/8/2015 8/17/2015 8/24/2015
Shenzhen Stock Exchange $1,398,028 $4,241,334 $2,102,921 $2,829,656 $2,245,634 6.9x 19.0x 11.3x 12.6x 10.9x 49.3x 92.6x 65.5x 75.4x 70.1x
Shanghai Stock Exchange 1,472,262 4,579,369 2,669,367 3,390,372 2,652,128 3.3x 9.3x 5.4x 6.9x 6.2x 30.0x 59.0x 36.7x 49.1x 45.8x
Hong Kong Stock Exchange 3,750,570 5,663,768 4,645,685 4,717,119 4,058,602 4.0x 5.5x 4.9x 5.1x 5.2x 15.0x 19.5x 15.3x 16.1x 14.8x
GPB China Composite(1) 6,620,860 14,484,471 9,417,973 10,937,146 8,956,365 4.5x 9.9x 6.6x 8.2x 7.4x 27.3x 47.1x 33.4x 46.9x 43.6x
GPB China Tech Index(2) 894,999 2,111,438 1,223,566 1,677,212 1,407,521 8.7x 20.4x 12.8x 14.5x 12.4x 46.5x 77.2x 59.2x 82.6x 68.4x
Nasdaq Internet 1,255,686 1,404,827 1,367,150 1,512,281 1,323,851 8.6x 7.4x 7.4x 7.7x 7.1x 55.9x 48.5x 48.6x 57.8x 52.2x
S&P 500 18,452,570 19,513,673 19,189,096 19,677,070 17,706,559 3.4x 3.5x 3.5x 3.7x 3.5x 24.5x 27.6x 27.0x 26.7x 25.0x
Apple 574,145 732,630 706,129 668,131 588,065 3.3x 3.5x 3.3x 3.0x 2.6x 16.0x 15.8x 15.2x 13.6x 12.2x
Google 393,174 368,425 361,163 464,405 413,934 6.3x 5.4x 5.3x 6.7x 5.9x 32.4x 27.2x 26.9x 34.6x 32.1x
China Mobile 200,765 268,572 237,576 266,404 243,817 1.9x 2.6x 2.3x 2.6x 2.3x 10.0x 15.2x 13.4x 15.1x 14.3x
Tencent 145,106 188,168 161,406 170,379 149,973 13.8x 14.1x 12.1x 12.2x 10.7x 50.8x 48.6x 41.6x 41.4x 40.0x
ZTE 8,195 19,867 11,291 13,013 9,912 0.7x 1.5x 0.8x 0.9x 0.7x 30.4x 47.2x 26.0x 28.5x 24.1x
Selected dates: 7/11/2014: 1 Year before 07/13/2015; also prior to the surge in stock prices later in November 2014
6/12/2015: Highest peak of SSE Composite Index & SZSE Composite Index since 2009; companies were trading normally
17/8/2015: Last peak of Chinese stock market exchanges
24/8/2015: Most current date; Largest 1-day drop of SSE Composite Index since February 2007; 900 of 1,114 stocks listed on SSE Composite Index lost more than 10% during trading
Notes:
1 - GPB China Composite consists of all companies listed on SESZ, SSE, and SEHK
2 - GPB China Tech Index consists of all technology, telecom, media companies listed on SESZ, SSE, and SEHK
3 - Used market cap weighted average
Source: CapitalIQ
8
¥3,000
¥3,500
¥4,000
¥4,500
¥5,000
¥5,500
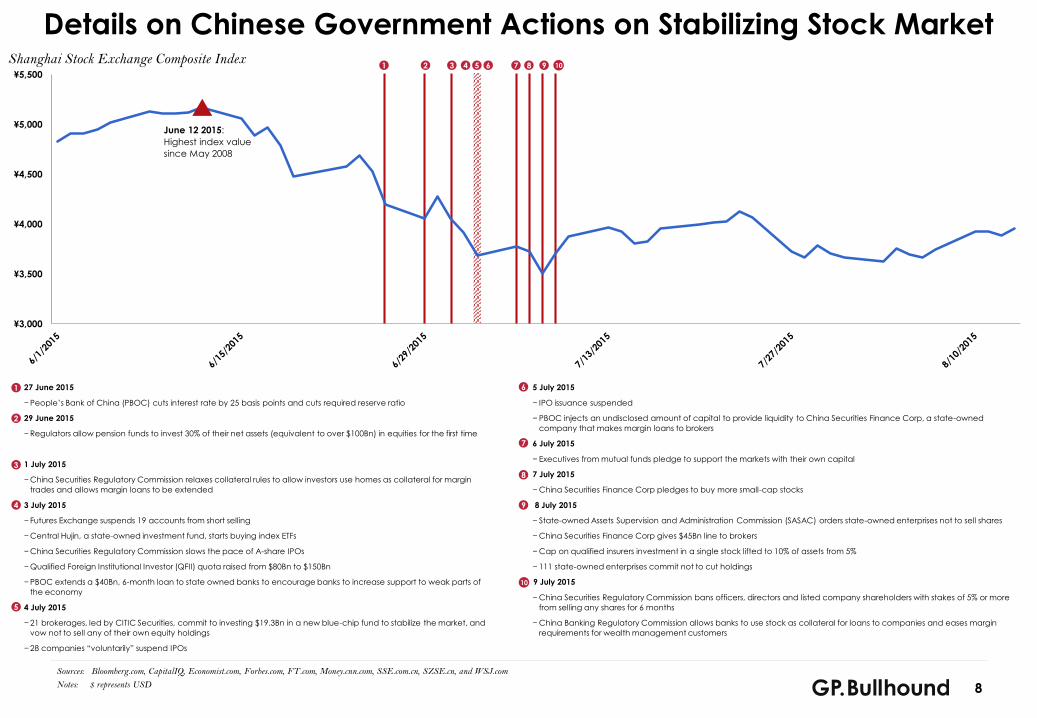
27 June 2015
− People’s Bank of China (PBOC) cuts interest rate by 25 basis points and cuts required reserve ratio
29 June 2015
− Regulators allow pension funds to invest 30% of their net assets (equivalent to over $100Bn) in equities for the first time
1 July 2015
− China Securities Regulatory Commission relaxes collateral rules to allow investors use homes as collateral for margin
trades and allows margin loans to be extended
3 July 2015
− Futures Exchange suspends 19 accounts from short selling
− Central Hujin, a state-owned investment fund, starts buying index ETFs
− China Securities Regulatory Commission slows the pace of A-share IPOs
− Qualified Foreign Institutional Investor (QFII) quota raised from $80Bn to $150Bn
− PBOC extends a $40Bn, 6-month loan to state owned banks to encourage banks to increase support to weak parts of
the economy
4 July 2015
− 21 brokerages, led by CITIC Securities, commit to investing $19.3Bn in a new blue-chip fund to stabilize the market, and
vow not to sell any of their own equity holdings
− 28 companies “voluntarily” suspend IPOs
5 July 2015
− IPO issuance suspended
− PBOC injects an undisclosed amount of capital to provide liquidity to China Securities Finance Corp, a state-owned
company that makes margin loans to brokers
6 July 2015
− Executives from mutual funds pledge to support the markets with their own capital
7 July 2015
− China Securities Finance Corp pledges to buy more small-cap stocks
8 July 2015
− State-owned Assets Supervision and Administration Commission (SASAC) orders state-owned enterprises not to sell shares
− China Securities Finance Corp gives $45Bn line to brokers
− Cap on qualified insurers investment in a single stock lifted to 10% of assets from 5%
− 111 state-owned enterprises commit not to cut holdings
9 July 2015
− China Securities Regulatory Commission bans officers, directors and listed company shareholders with stakes of 5% or more
from selling any shares for 6 months
− China Banking Regulatory Commission allows banks to use stock as collateral for loans to companies and eases margin
requirements for wealth management customers
Details on Chinese Government Actions on Stabilizing Stock Market9876521 43 10
Shanghai Stock Exchange Composite Index
1
2
3
4
5
6
7
8
9
10
Sources: Bloomberg.com, CapitalIQ, Economist.com, Forbes.com, FT.com, Money.cnn.com, SSE.com.cn, SZSE.cn, and WSJ.com
Notes: $ represents USD
June 12 2015:
Highest index value
since May 2008
9
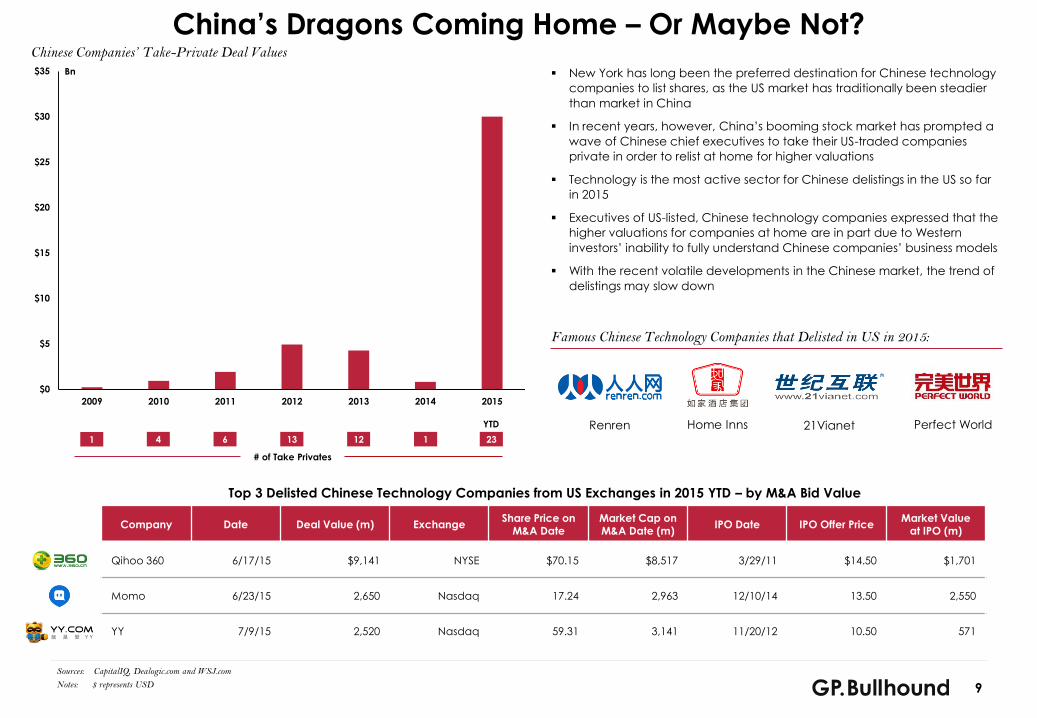
China’s Dragons Coming Home – Or Maybe Not?
Bn New York has long been the preferred destination for Chinese technology
companies to list shares, as the US market has traditionally been steadier
than market in China
In recent years, however, China’s booming stock market has prompted a
wave of Chinese chief executives to take their US-traded companies
private in order to relist at home for higher valuations
Technology is the most active sector for Chinese delistings in the US so far
in 2015
Executives of US-listed, Chinese technology companies expressed that the
higher valuations for companies at home are in part due to Western
investors’ inability to fully understand Chinese companies’ business models
With the recent volatile developments in the Chinese market, the trend of
delistings may slow down
Famous Chinese Technology Companies that Delisted in US in 2015:
Chinese Companies’ Take-Private Deal Values
Company Date Deal Value (m) ExchangeShare Price on
M&A DateMarket Cap on M&A Date (m)
IPO Date IPO Offer Price Market Value
at IPO (m)
Qihoo 360 6/17/15 $9,141 NYSE $70.15 $8,517 3/29/11 $14.50 $1,701
Momo 6/23/15 2,650 Nasdaq 17.24 2,963 12/10/14 13.50 2,550
YY 7/9/15 2,520 Nasdaq 59.31 3,141 11/20/12 10.50 571
$0
$5
$10
$15
$20
$25
$30
$35
2009 2010 2011 2012 2013 2014 2015
1 4 6 23113 12
YTD
# of Take Privates
Top 3 Delisted Chinese Technology Companies from US Exchanges in 2015 YTD – by M&A Bid Value
Renren Home Inns 21Vianet Perfect World
Sources: CapitalIQ, Dealogic.com and WSJ.com
Notes: $ represents USD
10
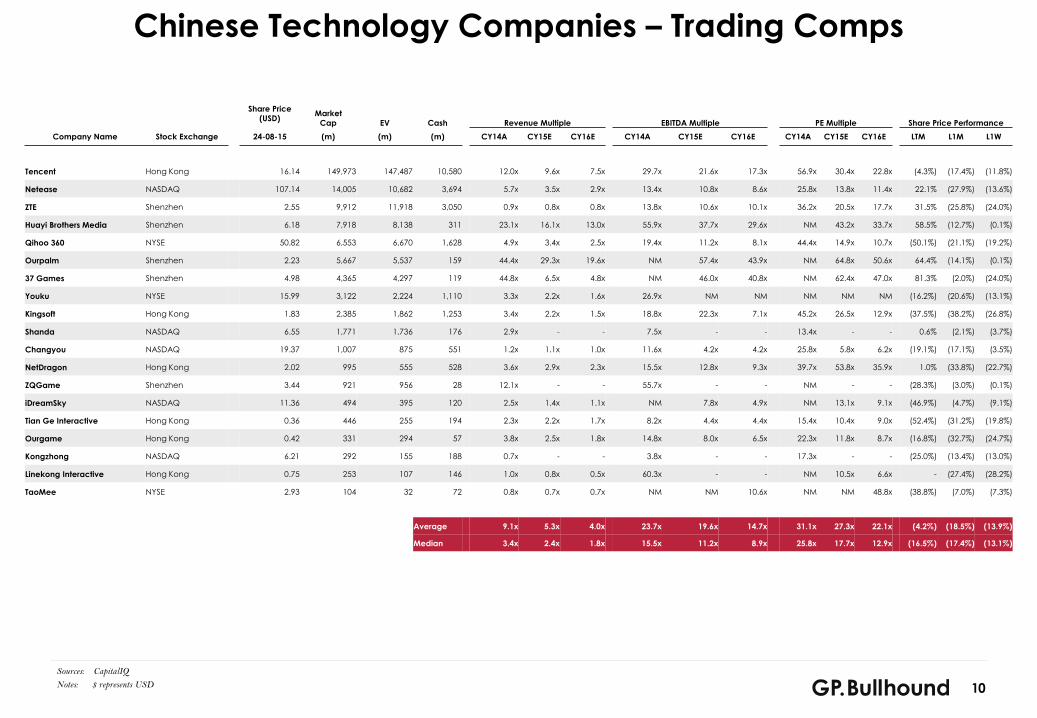
Chinese Technology Companies – Trading Comps
Sources: CapitalIQ
Notes: $ represents USD
Share Price
(USD)Market
Cap EV Cash Revenue Multiple EBITDA Multiple PE Multiple Share Price Performance
Company Name Stock Exchange 24-08-15 (m) (m) (m) CY14A CY15E CY16E CY14A CY15E CY16E CY14A CY15E CY16E LTM L1M L1W
Tencent Hong Kong 16.14 149,973 147,487 10,580 12.0x 9.6x 7.5x 29.7x 21.6x 17.3x 56.9x 30.4x 22.8x (4.3%) (17.4%) (11.8%)
Netease NASDAQ 107.14 14,005 10,682 3,694 5.7x 3.5x 2.9x 13.4x 10.8x 8.6x 25.8x 13.8x 11.4x 22.1% (27.9%) (13.6%)
ZTE Shenzhen 2.55 9,912 11,918 3,050 0.9x 0.8x 0.8x 13.8x 10.6x 10.1x 36.2x 20.5x 17.7x 31.5% (25.8%) (24.0%)
Huayi Brothers Media Shenzhen 6.18 7,918 8,138 311 23.1x 16.1x 13.0x 55.9x 37.7x 29.6x NM 43.2x 33.7x 58.5% (12.7%) (0.1%)
Qihoo 360 NYSE 50.82 6,553 6,670 1,628 4.9x 3.4x 2.5x 19.4x 11.2x 8.1x 44.4x 14.9x 10.7x (50.1%) (21.1%) (19.2%)
Ourpalm Shenzhen 2.23 5,667 5,537 159 44.4x 29.3x 19.6x NM 57.4x 43.9x NM 64.8x 50.6x 64.4% (14.1%) (0.1%)
37 Games Shenzhen 4.98 4,365 4,297 119 44.8x 6.5x 4.8x NM 46.0x 40.8x NM 62.4x 47.0x 81.3% (2.0%) (24.0%)
Youku NYSE 15.99 3,122 2,224 1,110 3.3x 2.2x 1.6x 26.9x NM NM NM NM NM (16.2%) (20.6%) (13.1%)
Kingsoft Hong Kong 1.83 2,385 1,862 1,253 3.4x 2.2x 1.5x 18.8x 22.3x 7.1x 45.2x 26.5x 12.9x (37.5%) (38.2%) (26.8%)
Shanda NASDAQ 6.55 1,771 1,736 176 2.9x - - 7.5x - - 13.4x - - 0.6% (2.1%) (3.7%)
Changyou NASDAQ 19.37 1,007 875 551 1.2x 1.1x 1.0x 11.6x 4.2x 4.2x 25.8x 5.8x 6.2x (19.1%) (17.1%) (3.5%)
NetDragon Hong Kong 2.02 995 555 528 3.6x 2.9x 2.3x 15.5x 12.8x 9.3x 39.7x 53.8x 35.9x 1.0% (33.8%) (22.7%)
ZQGame Shenzhen 3.44 921 956 28 12.1x - - 55.7x - - NM - - (28.3%) (3.0%) (0.1%)
iDreamSky NASDAQ 11.36 494 395 120 2.5x 1.4x 1.1x NM 7.8x 4.9x NM 13.1x 9.1x (46.9%) (4.7%) (9.1%)
Tian Ge Interactive Hong Kong 0.36 446 255 194 2.3x 2.2x 1.7x 8.2x 4.4x 4.4x 15.4x 10.4x 9.0x (52.4%) (31.2%) (19.8%)
Ourgame Hong Kong 0.42 331 294 57 3.8x 2.5x 1.8x 14.8x 8.0x 6.5x 22.3x 11.8x 8.7x (16.8%) (32.7%) (24.7%)
Kongzhong NASDAQ 6.21 292 155 188 0.7x - - 3.8x - - 17.3x - - (25.0%) (13.4%) (13.0%)
Linekong Interactive Hong Kong 0.75 253 107 146 1.0x 0.8x 0.5x 60.3x - - NM 10.5x 6.6x - (27.4%) (28.2%)
TaoMee NYSE 2.93 104 32 72 0.8x 0.7x 0.7x NM NM 10.6x NM NM 48.8x (38.8%) (7.0%) (7.3%)
Average 9.1x 5.3x 4.0x 23.7x 19.6x 14.7x 31.1x 27.3x 22.1x (4.2%) (18.5%) (13.9%)
Median 3.4x 2.4x 1.8x 15.5x 11.2x 8.9x 25.8x 17.7x 12.9x (16.5%) (17.4%) (13.1%)
11
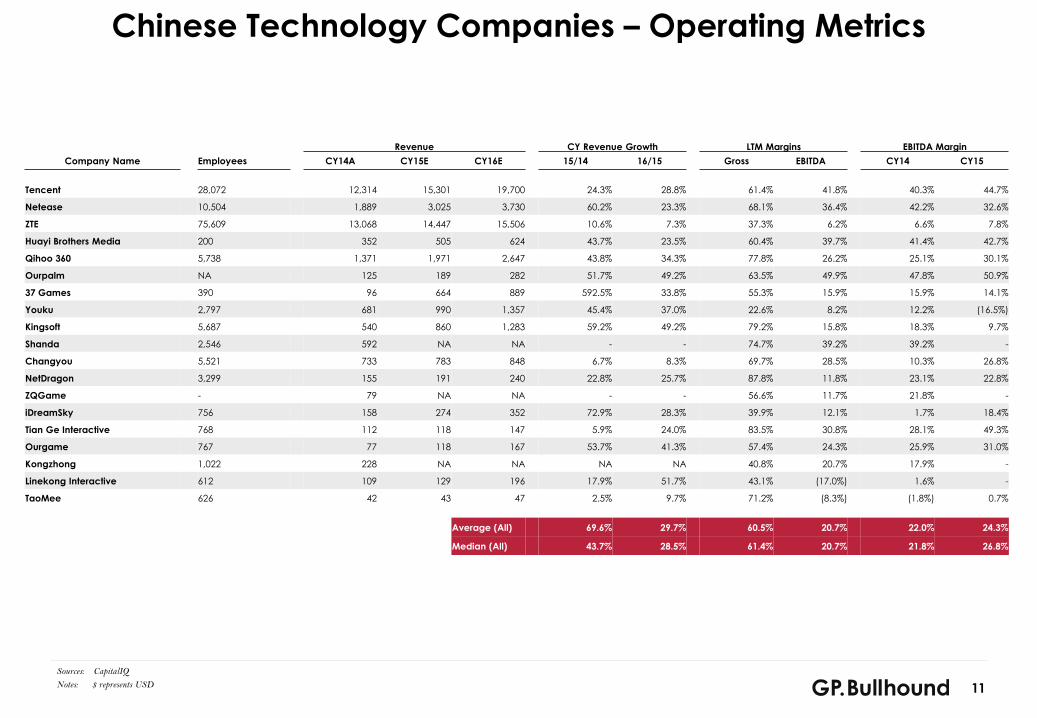
Chinese Technology Companies – Operating Metrics
Sources: CapitalIQ
Notes: $ represents USD
Revenue CY Revenue Growth LTM Margins EBITDA Margin
Company Name Employees CY14A CY15E CY16E 15/14 16/15 Gross EBITDA CY14 CY15
Tencent 28,072 12,314 15,301 19,700 24.3% 28.8% 61.4% 41.8% 40.3% 44.7%
Netease 10,504 1,889 3,025 3,730 60.2% 23.3% 68.1% 36.4% 42.2% 32.6%
ZTE 75,609 13,068 14,447 15,506 10.6% 7.3% 37.3% 6.2% 6.6% 7.8%
Huayi Brothers Media 200 352 505 624 43.7% 23.5% 60.4% 39.7% 41.4% 42.7%
Qihoo 360 5,738 1,371 1,971 2,647 43.8% 34.3% 77.8% 26.2% 25.1% 30.1%
Ourpalm NA 125 189 282 51.7% 49.2% 63.5% 49.9% 47.8% 50.9%
37 Games 390 96 664 889 592.5% 33.8% 55.3% 15.9% 15.9% 14.1%
Youku 2,797 681 990 1,357 45.4% 37.0% 22.6% 8.2% 12.2% (16.5%)
Kingsoft 5,687 540 860 1,283 59.2% 49.2% 79.2% 15.8% 18.3% 9.7%
Shanda 2,546 592 NA NA - - 74.7% 39.2% 39.2% -
Changyou 5,521 733 783 848 6.7% 8.3% 69.7% 28.5% 10.3% 26.8%
NetDragon 3,299 155 191 240 22.8% 25.7% 87.8% 11.8% 23.1% 22.8%
ZQGame - 79 NA NA - - 56.6% 11.7% 21.8% -
iDreamSky 756 158 274 352 72.9% 28.3% 39.9% 12.1% 1.7% 18.4%
Tian Ge Interactive 768 112 118 147 5.9% 24.0% 83.5% 30.8% 28.1% 49.3%
Ourgame 767 77 118 167 53.7% 41.3% 57.4% 24.3% 25.9% 31.0%
Kongzhong 1,022 228 NA NA NA NA 40.8% 20.7% 17.9% -
Linekong Interactive 612 109 129 196 17.9% 51.7% 43.1% (17.0%) 1.6% -
TaoMee 626 42 43 47 2.5% 9.7% 71.2% (8.3%) (1.8%) 0.7%
Average (All) 69.6% 29.7% 60.5% 20.7% 22.0% 24.3%
Median (All) 43.7% 28.5% 61.4% 20.7% 21.8% 26.8%
12
Table of Contents
1 Recent Developments in China’s Stock Markets
2 GP Bullhound Update
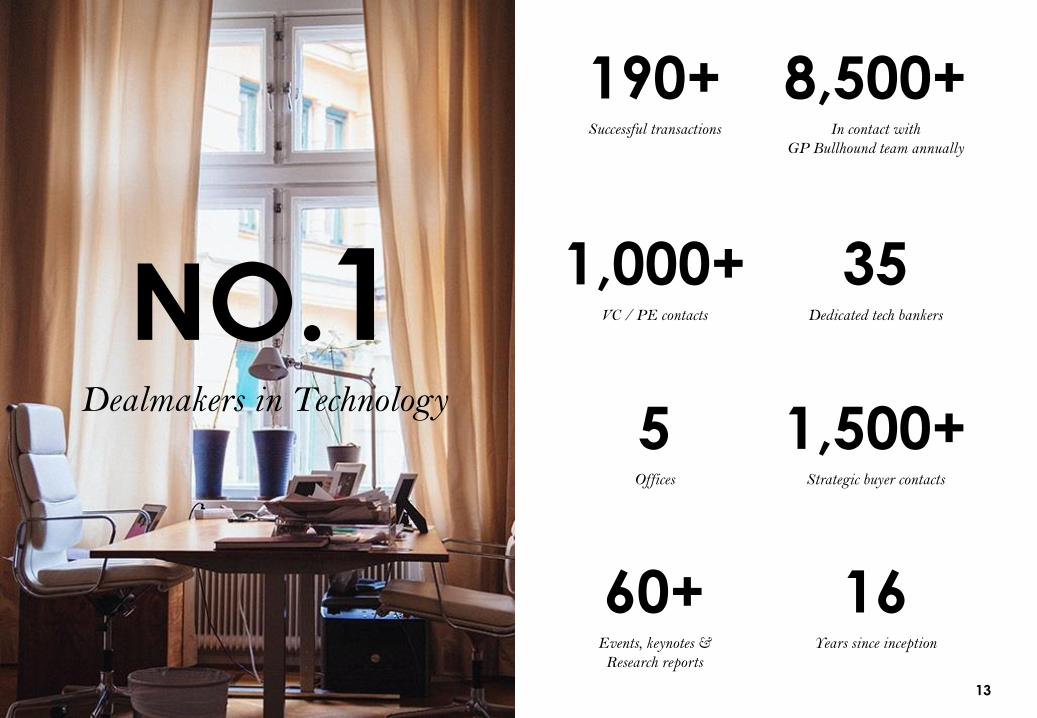
NO.1
190+Successful transactions
8,500+In contact with
GP Bullhound team annually
1,000+VC / PE contacts
35Dedicated tech bankers
5Offices
1,500+Strategic buyer contacts
60+Events, keynotes &
Research reports
16Years since inception
Dealmakers in Technology
13
Our team
HUGH CAMPBELLManaging Partner
MANISH MADHVANIManaging Partner
PER ROMANManaging Partner
SIR MARTIN SMITHChairman
GRAEME BAYLEYPartner & Group CFO
GUILLAUME BONNETONPartner
ALEC DAFFERNERPartner
SIMON NICHOLLSPartner
JULIAN RIEDLBAUERPartner
CLAUDIO ALVAREZDirector
ALI DAGLIPartner
ALEXIS SCORER
Director
ALESSANDRO CASARTELLI
Vice President
PER LINDTORPDirector
ADAM RUDD
Vice President
CARL WESSBERG
Director
RAVI GHEDIAMALCOM HORNER
Vice President
CHRIS PARK
Associate
OLOF RUSTNER
Associate
LORD CLIVE HOLLICK
Senior Advisor
CHRISTIAN LAGERLING
Co-founder &
Senior Advisor
MATT ROGERS
Senior Advisor
CECILIA ROMAN
Senior Advisor
ANDRE SHORTELLPartner
IMAN CRISBY
Business Development Manager
HARRI NEEDHAM
Finance Manager
DAVE NISH
Technology Manager
MATTHEW FINEGOLD
Analyst
OKAN INALTAY
Analyst
MARVIN MAERZ
Analyst Analyst
HARRIET ROSETHORN
CHRIS GRAVESDirector
Vice President
SEBASTIAN MARKOWSKY
ROBERT AHLDINPartner
JOAKIM DAL
Vice President
JOSHUA BURGE
Analyst
MARK SEBBANon-Executive Director
MATHIAS ACKERMANDNon-Executive Director
Associate
ANN GREVELIUSPartner
JOHANNES ÅKERMARK
Associate
ORIANE MILLET
Analyst
Associate
LENKA KOLAROVA
KARL BLOMSTERWALL
Analyst
LUKE BURNS
Analyst
14
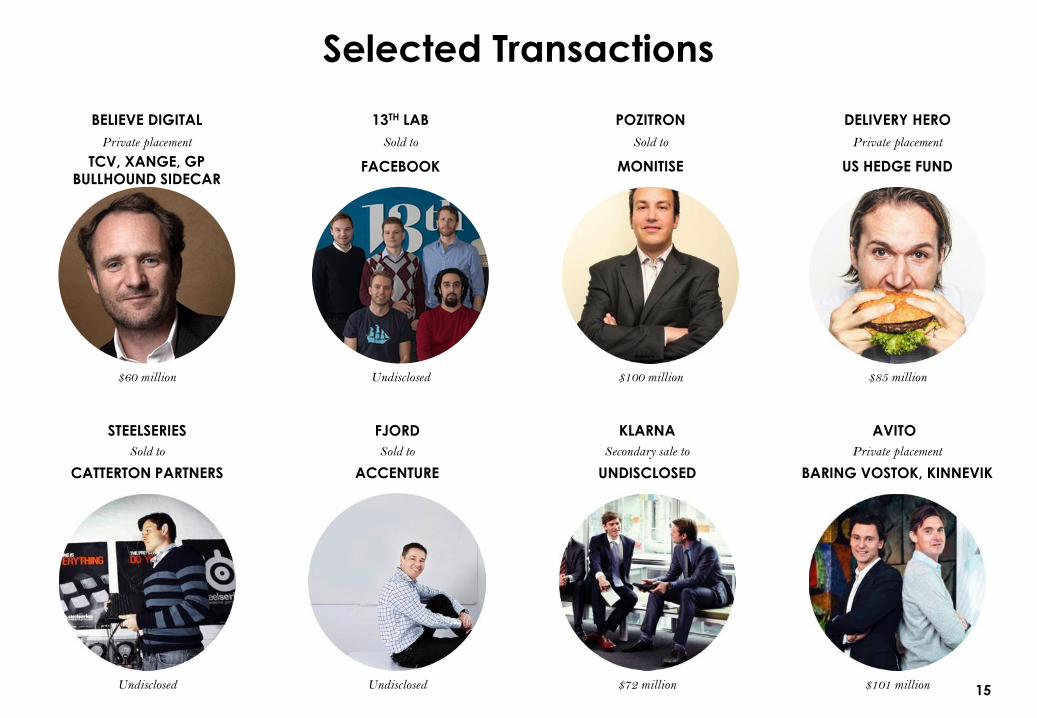
Selected Transactions
STEELSERIES
CATTERTON PARTNERS
Sold to
DELIVERY HERO
US HEDGE FUND
Private placement
BELIEVE DIGITAL
TCV, XANGE, GP BULLHOUND SIDECAR
Private placement
POZITRON
MONITISE
Sold to
Undisclosed
$85 million$60 million $100 million
FJORD
ACCENTURE
Sold to
KLARNA
UNDISCLOSED
Secondary sale to
AVITO
Private placement
Undisclosed $72 million
BARING VOSTOK, KINNEVIK
$101 million
13TH LAB
Sold to
Undisclosed
15

BERLINLONDON MANCHESTERSAN
FRANCISCOSTOCKHOLM
Events &Speaking
Offices
Awards
Latestreports
• GP Bullhound Summit
• Investor Allstars
• Northern Tech Awards
• Extreme Tech Challenge
• Red Herring
• White Bull
• World Internet Conference
• Cebit
• CNN
• CNBC
• BBC
• SIME
THE FUTURE OF ONLINE AND
MOBILE PAYMENTS
THE NEW MOBILE APP
REALITY
CAN EUROPE CREATE BILLION DOLLAR
TECH COMPANIES?
REAL TIME BIDDING IN ONLINE
ADVERTISING
• THE BULLY AWARDS2014 M&A Firm of the year
• THE M&A ADVISOR2013 Dealmaker of the year 40 under 40 award
• A.I. M&A AWARDS2013 Boutique investment bank of the year, UK & Leading adviser of the year
• THE M&A ATLAS AWARDS2010 M&A Boutique Investment Bank of the Year & Green Energy Deal of the Year
2010 Deal of the year & runner-up deal of the year
2010 Corporate finance boutique of the year
• ROSENBLATT SOLICITORS • THE M&A AWARDS
• THE M&A ADVISOR2014 Financial Services Deal of the Year
• INSIDER MEDIA2014 North West 42 under 42
16
TOP TECHNOLOGY PREDICTIONS
2015
• THE M&A ATLAS AWARDS2015 M&A Boutique Investment Bank of the Year & Deal of the Year Small Markets
• ALTERNATIVE INVESTMENT AWARDSBest Technology Focused Investment Banking Firm 2015
EUROPEAN UNICORNS – DO
THEY HAVE LEGS?
LONDON SAN FRANCISCO STOCKHOLM BERLIN MANCHESTERtel. +44 207 101 7560
52 Jermyn Street
London, SW1Y 6LX
United Kingdom
tel. +1 415 986 0191
One Maritime Plaza Suite 1620
San Francisco, CA 94111
USA
tel. +46 8 545 074 14
Birger Jarlsgatan 5
Stockholm, 111 45
Sweden
tel. +49 30 610 80 600
Oberwallstrasse 20
Berlin, 101 17
Germany
tel. +44 161 413 5030
1 New York Street
Manchester, M1 4HD
United Kingdom
The contents of this presentation document ("Presentation") shall not be deemed to be any form of offer or binding commitment on the part of GP
Bullhound LLP. This Presentation is provided for use by the intended recipient for information purposes only. It is prepared on the basis that the
recipients are sophisticated investors with a high degree of financial sophistication and knowledge. No representation or warranty, express or implied, is
or will be made in respect of the information contained in this Presentation and no responsibility or liability is or will be accepted by GP Bullhound LLP
in this regard. In particular, but without prejudice to the generality of the foregoing, no representation or warranty is given as to the accuracy,
completeness or reasonableness of any projections, targets, estimates or forecasts contained in this Presentation or in such other written or oral
information that may be provided by GP Bullhound LLP. All liability is expressly excluded to the fullest extent permitted by law. This Presentation may
contain forward-looking statements, which involve risks and uncertainties. Actual results may differ significantly from the results described in such
forward-looking statements. Any past performance information contained in this Presentation is provided for illustrative purposes only and is not
necessarily a guide to future performance and the value of securities may fall as well as rise. In particular, investments in the technology sector can
involve a high degree of risk and investors may not get back the full amount invested. This Presentation should not be construed in any circumstances as
a solicitation or offer, or recommendation, to acquire or dispose of any investment or to engage in any other transaction, or to provide any investment
advice or service and you should not act or refrain from acting upon any information contained on it without seeking appropriate professional advice. In
the event that you should wish to engage GP Bullhound LLP, separate documentation, including an engagement letter, will be provided to you. For the
purposes of the rules and guidance issued by the Financial Conduct Authority ("the FCA"), this Presentation has been communicated by GP Bullhound
LLP, which is authorised and regulated by the FCA in the United Kingdom under number 527314.
This Presentation is only directed at persons who fall within the category of “Professional Clients” as defined in the rules and guidance issued by the FCA
from time to time and any investment or investment activity to which this Presentation relates is available only to such persons and will be engaged in
only with such persons. The information contained in this Presentation must not be relied upon by persons who are not Professional Clients and any
person who is not a Professional Client should return it immediately to GP Bullhound LLP at the address below. This Presentation and any other
information or opinions supplied or given to you by GP Bullhound LLP constitute confidential information. Neither the whole nor any part of the
information contained in this Presentation may be duplicated in any form or by any means. Neither should the information contained in this Presentation,
or any part thereof, be redistributed or disclosed to anyone without the prior written consent of GP Bullhound LLP. GP Bullhound LLP is a limited
liability partnership registered in England and Wales, registered number OC352636, and is authorised and regulated by the FCA. Any reference to a
partner in relation to GP Bullhound LLP is to a member of GP Bullhound LLP or an employee with equivalent standing and qualifications. A list of the
members of GP Bullhound LLP is available for inspection at its registered office: 52 Jermyn Street, London SW1Y 6LX.
For US Persons: This presentation report is distributed to U.S. persons by GP Bullhound Inc. a broker-dealer registered with the SEC and a member of
the FINRA. GP Bullhound Inc. is an affiliate of GP Bullhound LLP. This presentation does not provide personalized advice or recommendations of any
kind. All investments bear certain material risks that should be considered in consultation with an investors financial, legal and tax advisors. Ali Dagli
and Okan Inaltay are employees and Frank Wu is a summer intern of GP Bullhound Inc. that engages in private placement and mergers and acquisitions
advisory activities with clients and counterparties in the Technology sectors.

![[Master Class Programmatic Trading May 2014] Keynote by Simon Nicholls Partner at GP Bullhound](https://img.pdfslide.us/doc/110x75/558e21031a28ab93398b4673/master-class-programmatic-trading-may-2014-keynote-by-simon-nicholls-partner-at-gp-bullhound.jpg)