Embed Size (px)
Citation preview
Q3 EARNINGS RELEASE – October 19, 2004 Slide 1
Motorola Q3 2004 Earnings Release Conference Call
October 19, 2004
Q3 EARNINGS RELEASE – October 19, 2004 Slide 2
Ed GamsSenior Vice President
of Investor Relations
Motorola Inc.
3Q3 EARNINGS RELEASE – October 19, 2004 Slide
Safe Harbor StatementA number of forward-looking statements will be made during this conference call. Forward-looking statements are any statements that are not historical facts. These forward-looking statements are based on the current expectations of Motorola and there can be no assurance that such expectations will prove to be correct. Because forward-looking statements involve risks and uncertainties, Motorola’s actual results could differ materially from these statements. Information about factors that could cause, and in some cases have caused, such differences can be found in this afternoon’s earnings press release, on pages 76 through 85 of Motorola’s 2003 Annual Report on Form 10-K.
This presentation is being made on the afternoon of October 19, 2004. The content of this presentation contains time-sensitive information that is accurate only as of the time hereof. If any portion of this presentation is rebroadcast, retransmitted or redistributed at a later date, Motorola will not be reviewing or updating the material that is contained herein.
MOTOROLA and the Stylized M Logo are registered in the US Patent & Trademark Office. All other product or service names are the property of their respective owners. © Motorola, Inc. 2004
Q3 EARNINGS RELEASE – October 19, 2004 Slide 4
Ed ZanderChief Executive Officer
Chairman of the Board of Directors
Motorola Inc.
Q3 EARNINGS RELEASE – October 19, 2004 Slide 5
David DevonshireChief Financial Officer
Executive Vice PresidentMotorola Inc.
6Q3 EARNINGS RELEASE – October 19, 2004 Slide
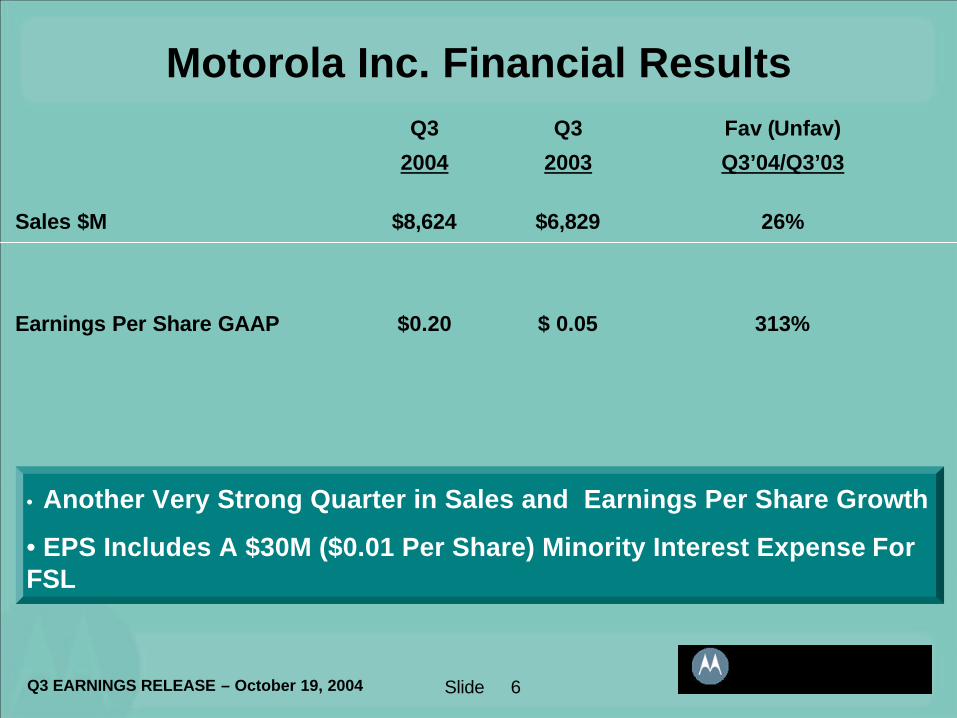
Motorola Inc. Financial Results
313%$ 0.05$0.20Earnings Per Share GAAP
26%$6,829$8,624Sales $M
Fav (Unfav)
Q3’04/Q3’03
Q3
2003
Q3
2004
• Another Very Strong Quarter in Sales and Earnings Per Share Growth
• EPS Includes A $30M ($0.01 Per Share) Minority Interest Expense For FSL
7Q3 EARNINGS RELEASE – October 19, 2004 Slide
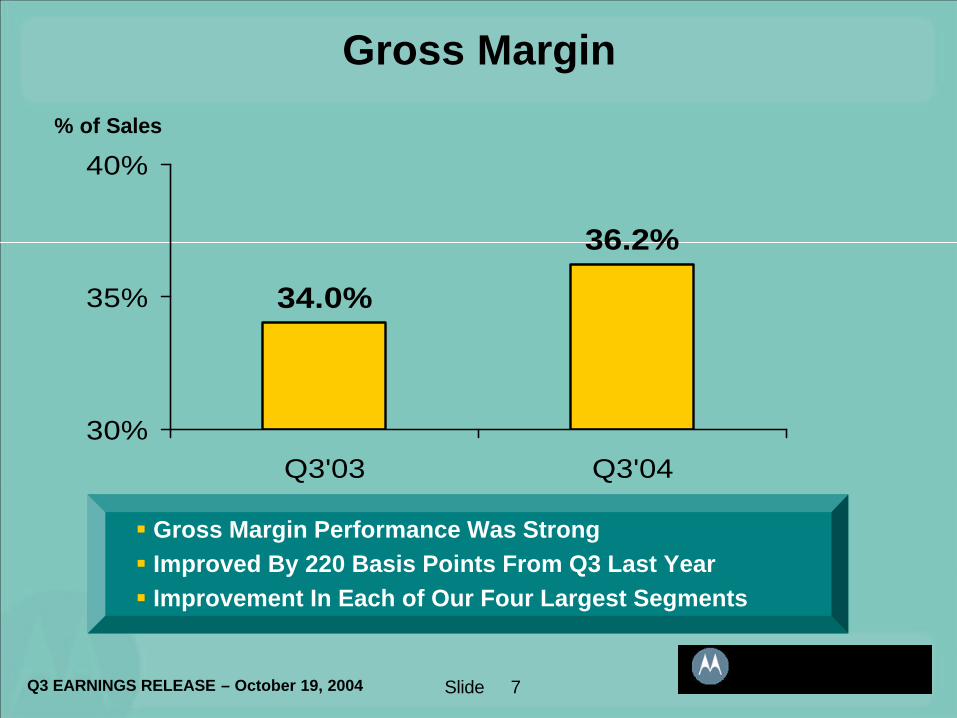
Gross Margin
% of Sales
34.0%
36.2%
30%
35%
40%
Q3'03 Q3'04
§ Gross Margin Performance Was Strong§ Improved By 220 Basis Points From Q3 Last Year § Improvement In Each of Our Four Largest Segments
8Q3 EARNINGS RELEASE – October 19, 2004 Slide
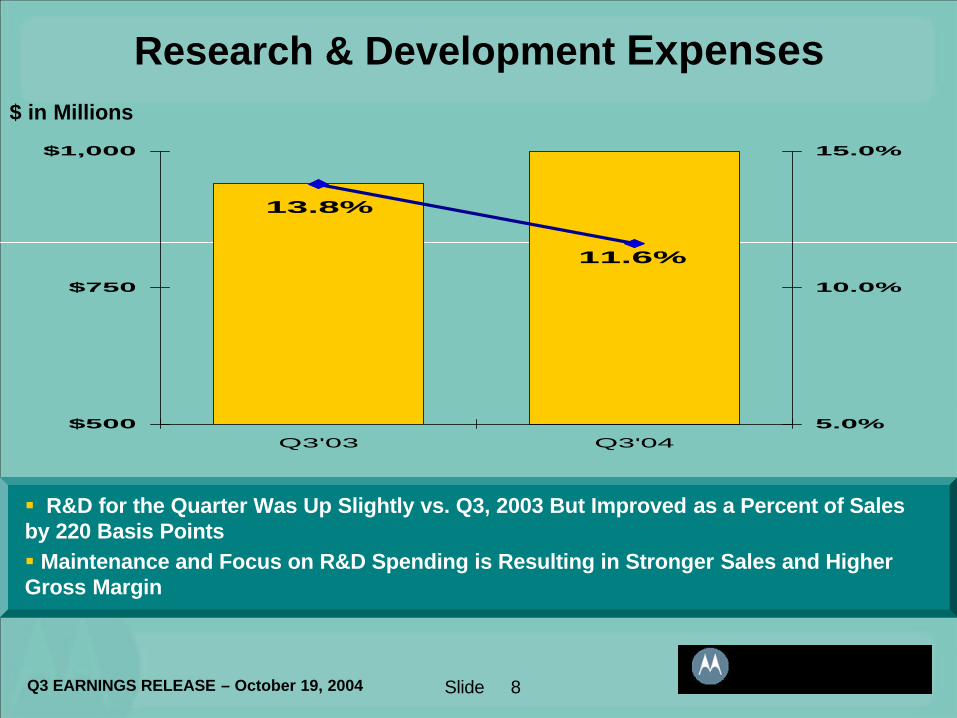
Research & Development Expenses$ in Millions
13.8%
11.6%
$500
$750
$1,000
Q3'03 Q3'045.0%
10.0%
15.0%
§ R&D for the Quarter Was Up Slightly vs. Q3, 2003 But Improved as a Percent of Sales by 220 Basis Points§ Maintenance and Focus on R&D Spending is Resulting in Stronger Sales and Higher Gross Margin
9Q3 EARNINGS RELEASE – October 19, 2004 Slide
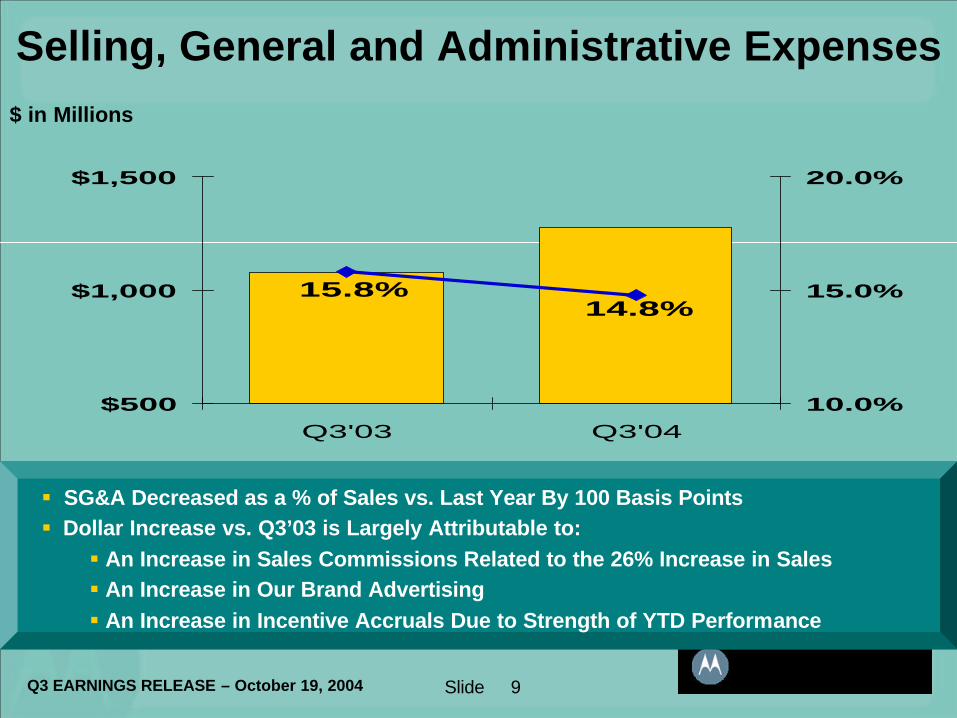
Selling, General and Administrative Expenses$ in Millions
15.8%14.8%
$500
$1,000
$1,500
Q3'03 Q3'0410.0%
15.0%
20.0%
§ SG&A Decreased as a % of Sales vs. Last Year By 100 Basis Points§ Dollar Increase vs. Q3’03 is Largely Attributable to:
§ An Increase in Sales Commissions Related to the 26% Increase in Sales§ An Increase in Our Brand Advertising§ An Increase in Incentive Accruals Due to Strength of YTD Performance
10Q3 EARNINGS RELEASE – October 19, 2004 Slide
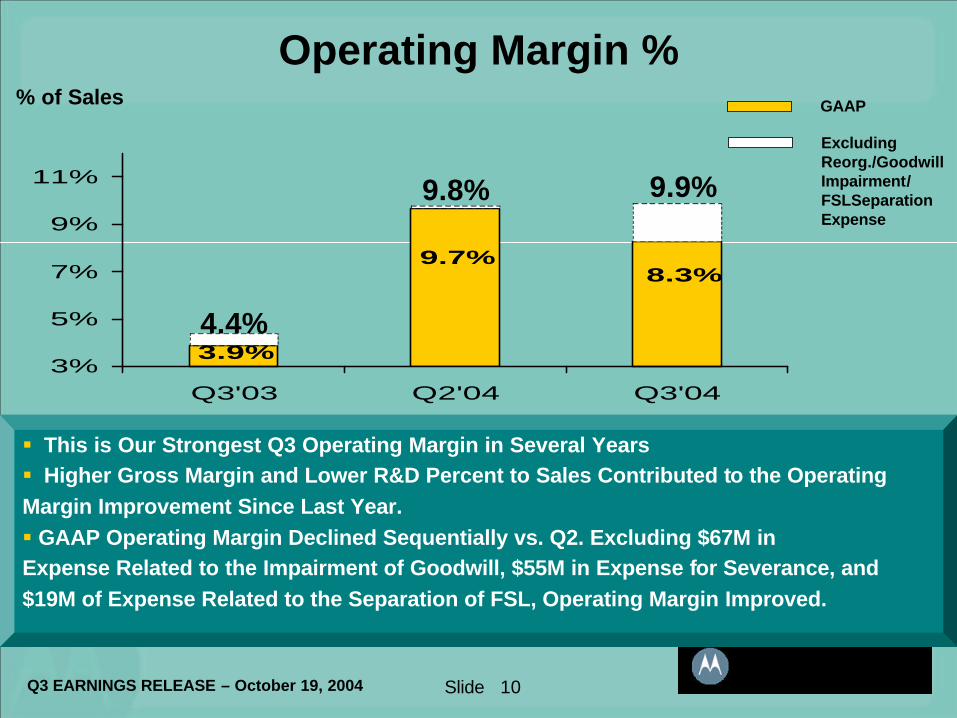
Operating Margin %% of Sales
3.9%
9.7%8.3%
3%
5%
7%
9%
11%
Q3'03 Q2'04 Q3'04
§ This is Our Strongest Q3 Operating Margin in Several Years§ Higher Gross Margin and Lower R&D Percent to Sales Contributed to the Operating Margin Improvement Since Last Year.§ GAAP Operating Margin Declined Sequentially vs. Q2. Excluding $67M in Expense Related to the Impairment of Goodwill, $55M in Expense for Severance, and $19M of Expense Related to the Separation of FSL, Operating Margin Improved.
9.9%
4.4%
GAAP
Excluding Reorg./GoodwillImpairment/ FSLSeparationExpense
9.8%
11Q3 EARNINGS RELEASE – October 19, 2004 Slide
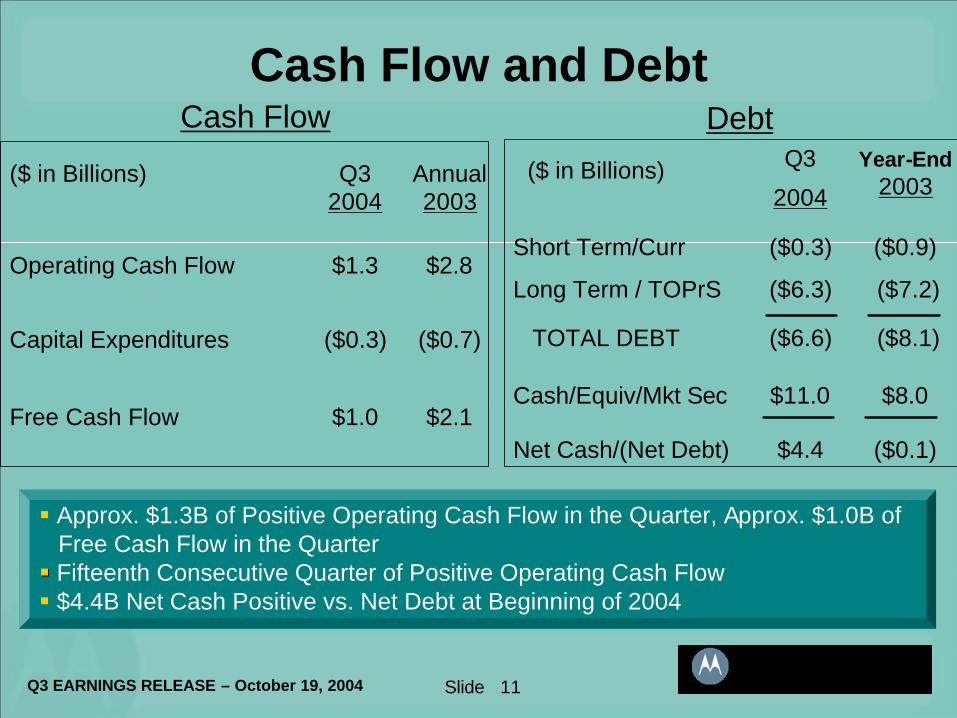
Cash Flow and Debt
$1.0
($0.3)
$1.3
Q3 2004
$2.1
($0.7)
$2.8
Annual 2003
($ in Billions)
Free Cash Flow
Capital Expenditures
Operating Cash Flow
§ Approx. $1.3B of Positive Operating Cash Flow in the Quarter, Approx. $1.0B of Free Cash Flow in the Quarter§§ Fifteenth Consecutive Quarter of Positive Operating Cash Flow§ $4.4B Net Cash Positive vs. Net Debt at Beginning of 2004
$4.4
$11.0
($6.6)
($6.3)
($0.3)
Q3
2004
($0.1)Net Cash/(Net Debt)
$8.0Cash/Equiv/Mkt Sec
($8.1)TOTAL DEBT
($7.2)Long Term / TOPrS
($0.9)Short Term/Curr
Year-End2003
Cash Flow Debt
($ in Billions)
12Q3 EARNINGS RELEASE – October 19, 2004 Slide
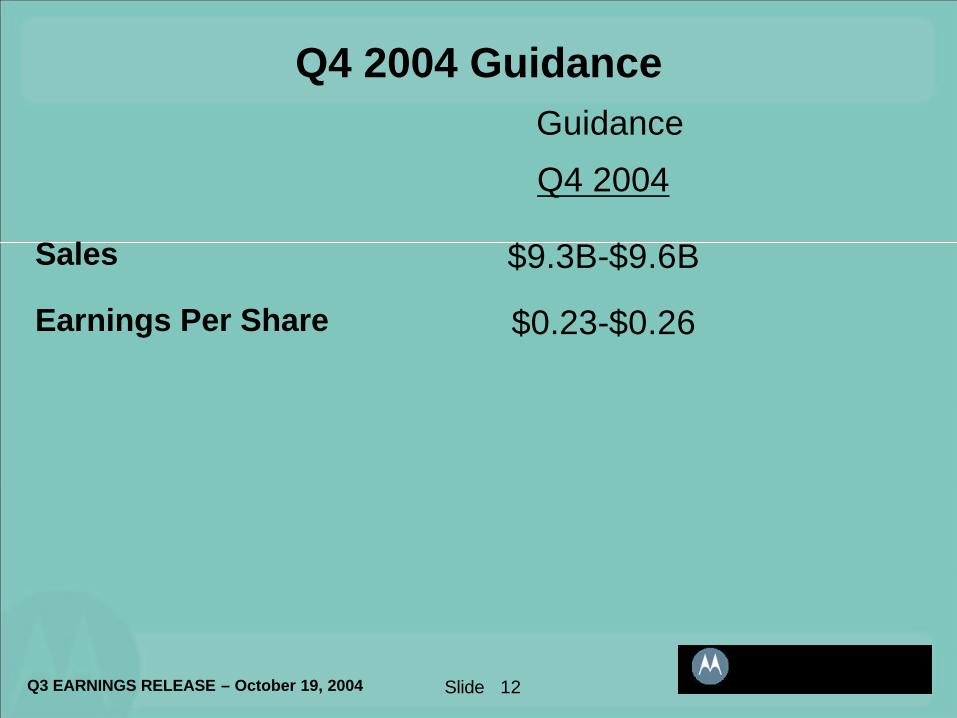
Q4 2004 Guidance
$0.23-$0.26Earnings Per Share
Guidance
$9.3B-$9.6B
Q4 2004
Sales
Q3 EARNINGS RELEASE – October 19, 2004 Slide 13
Mike ZafirovskiPresident and
Chief Operating Officer
Motorola Inc.
14Q3 EARNINGS RELEASE – October 19, 2004 Slide
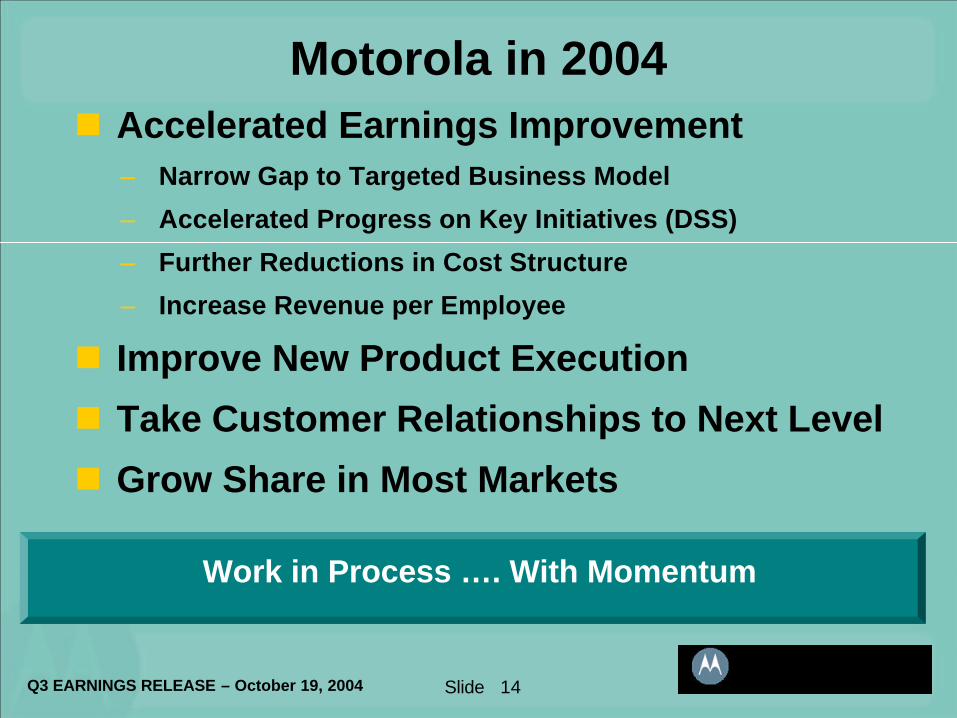
Motorola in 2004n Accelerated Earnings Improvement
– Narrow Gap to Targeted Business Model
– Accelerated Progress on Key Initiatives (DSS)
– Further Reductions in Cost Structure
– Increase Revenue per Employee
n Improve New Product Execution
n Take Customer Relationships to Next Level
n Grow Share in Most Markets
Work in Process …. With Momentum
15Q3 EARNINGS RELEASE – October 19, 2004 Slide
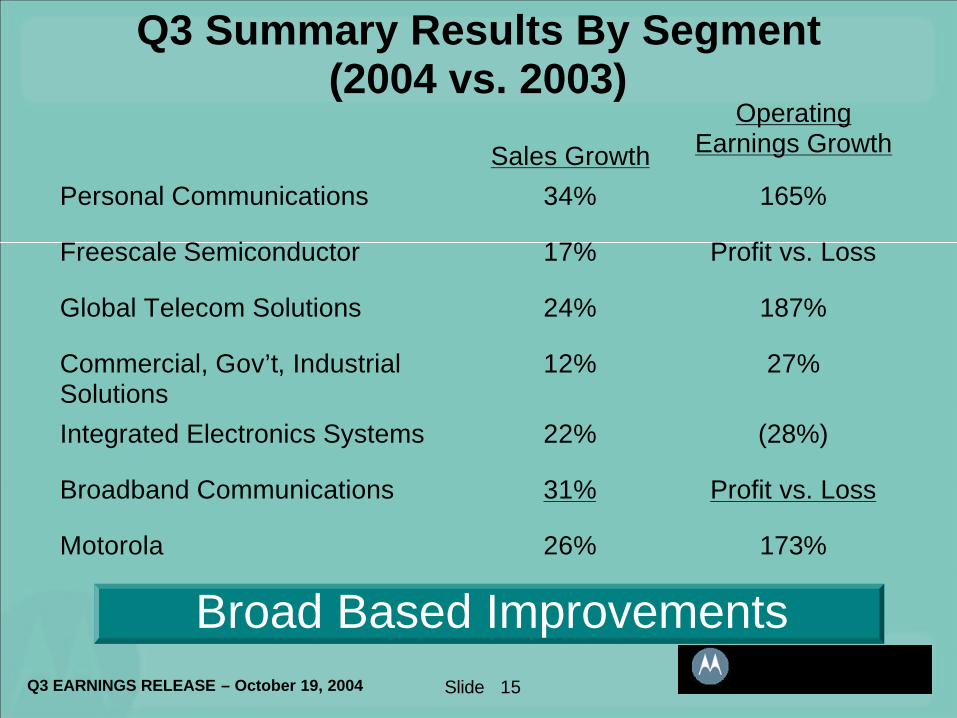
Q3 Summary Results By Segment (2004 vs. 2003)
173%26%Motorola
Profit vs. Loss31%Broadband Communications
(28%)22%Integrated Electronics Systems
27%12%Commercial, Gov’t, Industrial Solutions
187%24%Global Telecom Solutions
Profit vs. Loss17%Freescale Semiconductor
165%34%Personal Communications
Operating Earnings GrowthSales Growth
Broad Based Improvements
16Q3 EARNINGS RELEASE – October 19, 2004 Slide
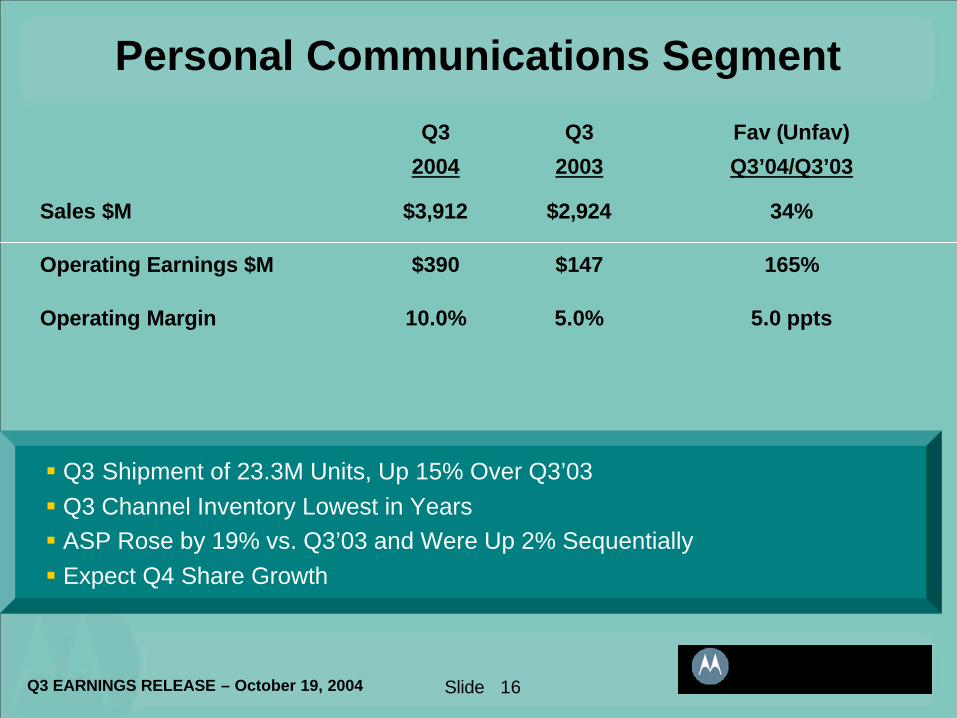
Personal Communications Segment
§ Q3 Shipment of 23.3M Units, Up 15% Over Q3’03 § Q3 Channel Inventory Lowest in Years§ ASP Rose by 19% vs. Q3’03 and Were Up 2% Sequentially§ Expect Q4 Share Growth
5.0 ppts5.0%10.0%Operating Margin
165%$147$390Operating Earnings $M
34%$2,924$3,912Sales $M
Fav (Unfav)
Q3’04/Q3’03
Q3
2003
Q3
2004
17Q3 EARNINGS RELEASE – October 19, 2004 Slide
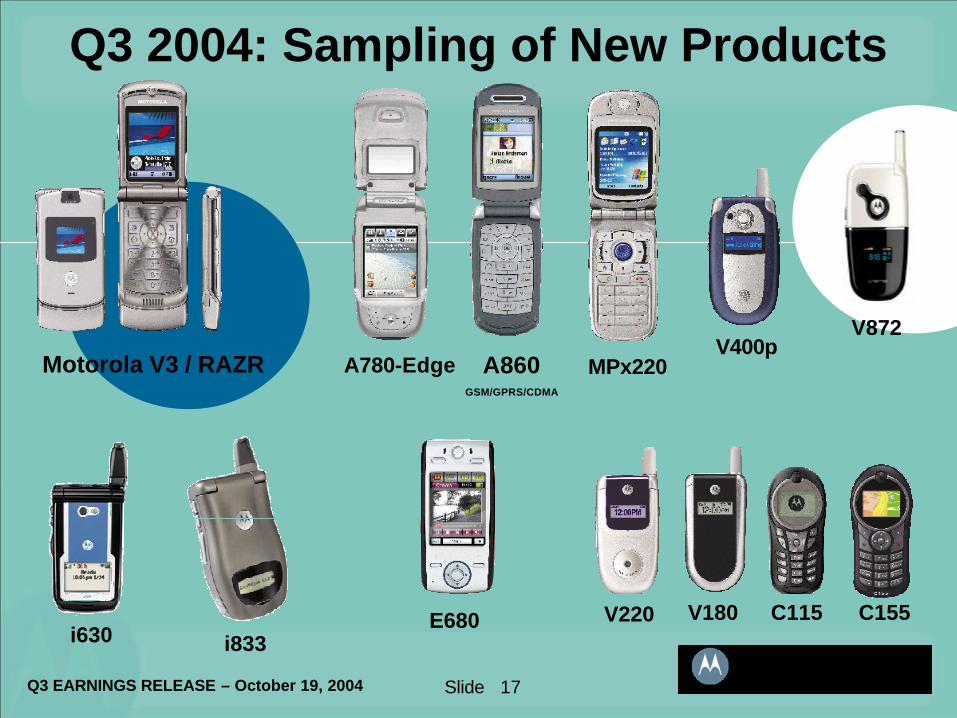
Q3 2004: Sampling of New Products
V400p
V180 C115
Motorola V3 / RAZR MPx220
E680
A780-Edge
i630 i833
A860GSM/GPRS/CDMA
C155
V872
V220
18Q3 EARNINGS RELEASE – October 19, 2004 Slide
PCS Q3’04 – Other Developments
n Appointed a New Sector President
n Began Shipping 17 New Handsets In Q3
n Almost 50% of Q3 Unit Shipments Had Integrated Cameras
n Surpassed 500,000 Open System, JAVA Linux-Based Handset Shipments YTD
n Enhanced CDMA Capabilities By Purchasing Balance of Appeal Telecom in Korea
19Q3 EARNINGS RELEASE – October 19, 2004 Slide
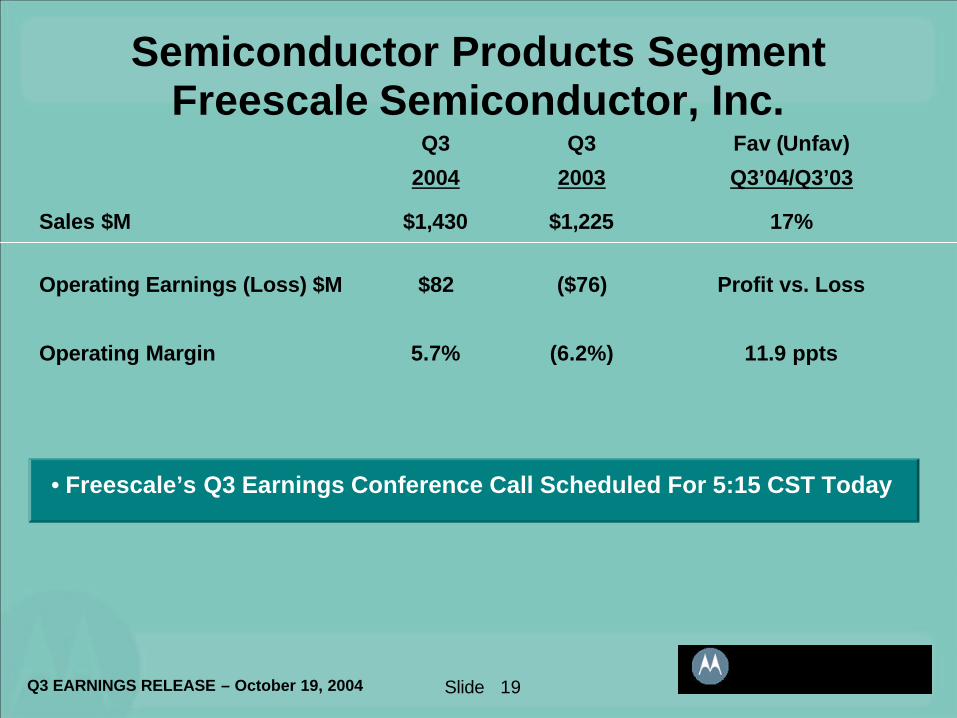
Semiconductor Products SegmentFreescale Semiconductor, Inc.
11.9 ppts(6.2%)5.7%Operating Margin
Profit vs. Loss($76)$82Operating Earnings (Loss) $M
17%$1,225$1,430Sales $M
Fav (Unfav)
Q3’04/Q3’03
Q3
2003
Q3
2004
• Freescale’s Q3 Earnings Conference Call Scheduled For 5:15 CST Today
20Q3 EARNINGS RELEASE – October 19, 2004 Slide
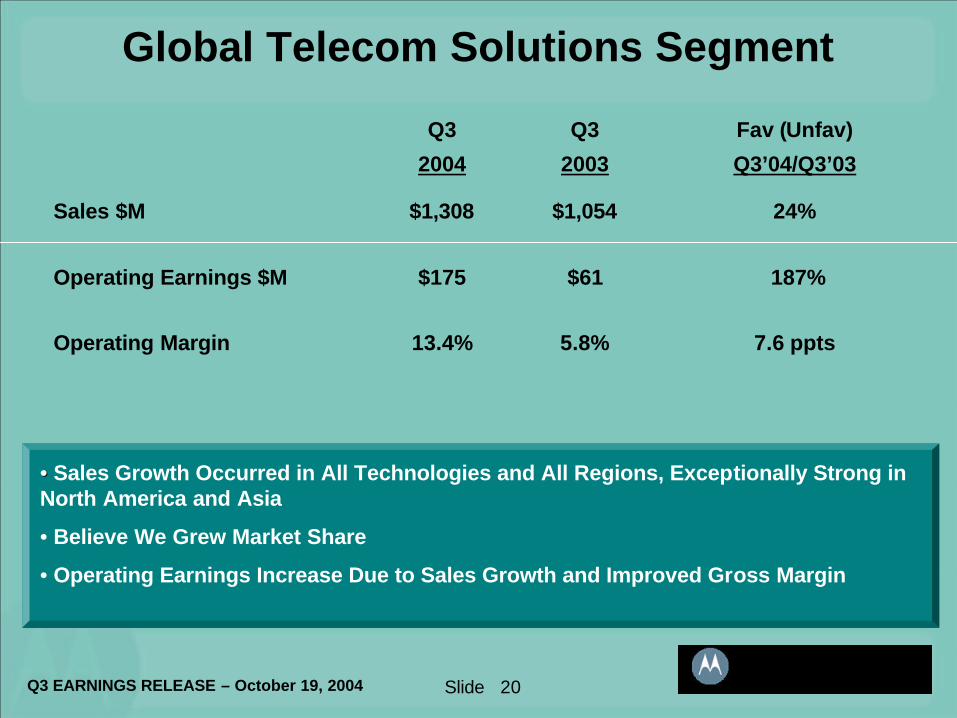
Global Telecom Solutions Segment
7.6 ppts5.8%13.4%Operating Margin
187%$61$175Operating Earnings $M
24%$1,054$1,308Sales $M
Fav (Unfav)
Q3’04/Q3’03
Q3
2003
Q3
2004
•• Sales Growth Occurred in All Technologies and All Regions, Exceptionally Strong in North America and Asia
• Believe We Grew Market Share
• Operating Earnings Increase Due to Sales Growth and Improved Gross Margin
Q3 EARNINGS RELEASE – October 19, 2004 Slide 21
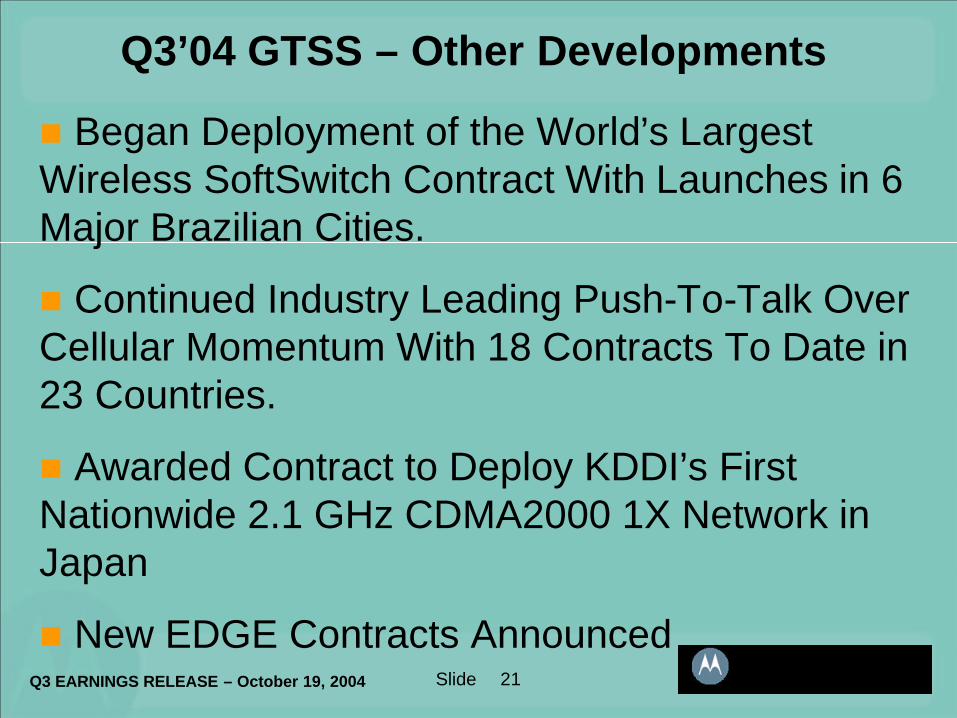
n Began Deployment of the World’s Largest Wireless SoftSwitch Contract With Launches in 6 Major Brazilian Cities.
n Continued Industry Leading Push-To-Talk Over Cellular Momentum With 18 Contracts To Date in 23 Countries.
n Awarded Contract to Deploy KDDI’s First Nationwide 2.1 GHz CDMA2000 1X Network in Japan
n New EDGE Contracts Announced
Q3’04 GTSS – Other Developments
22Q3 EARNINGS RELEASE – October 19, 2004 Slide
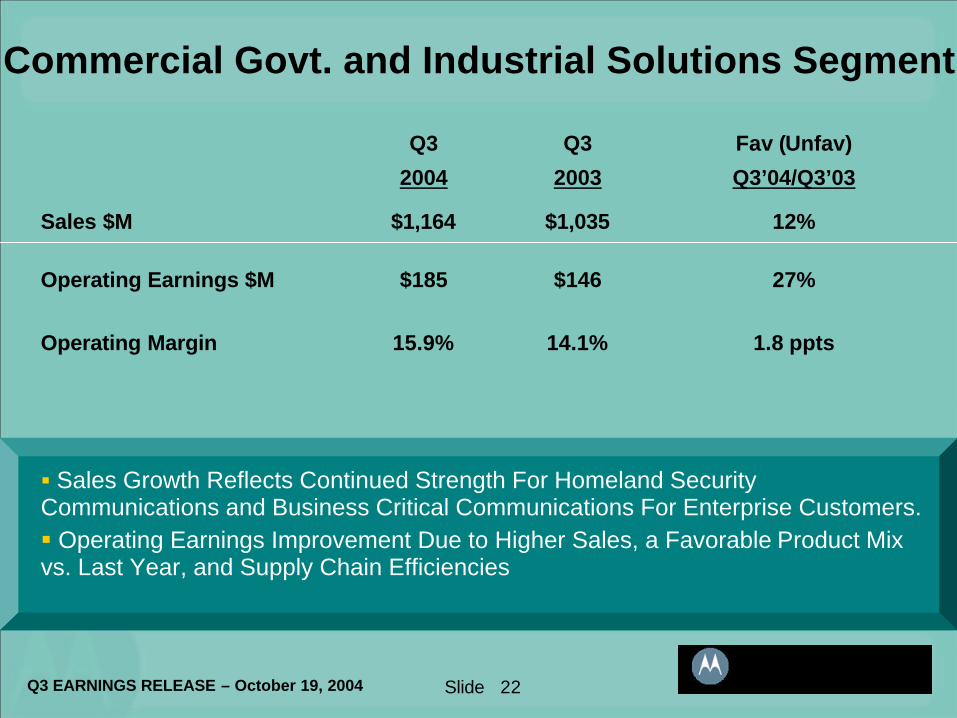
Commercial Govt. and Industrial Solutions Segment
§ Sales Growth Reflects Continued Strength For Homeland Security Communications and Business Critical Communications For Enterprise Customers.§ Operating Earnings Improvement Due to Higher Sales, a Favorable Product Mix vs. Last Year, and Supply Chain Efficiencies
1.8 ppts14.1%15.9%Operating Margin
27%$146$185Operating Earnings $M
12%$1,035$1,164Sales $M
Fav (Unfav)
Q3’04/Q3’03
Q3
2003
Q3
2004
Q3 EARNINGS RELEASE – October 19, 2004 Slide 23
Q3’04 CGISS – Other Developments
• Commonwealth of Virginia Awarded Motorola $329M Multi-Year Contract
• State of Arkansas Expanded Its Existing Statewide Network Contract
• The Netherlands Awarded Motorola a Contract For More Than 20,000 TETRA Radios
24Q3 EARNINGS RELEASE – October 19, 2004 Slide
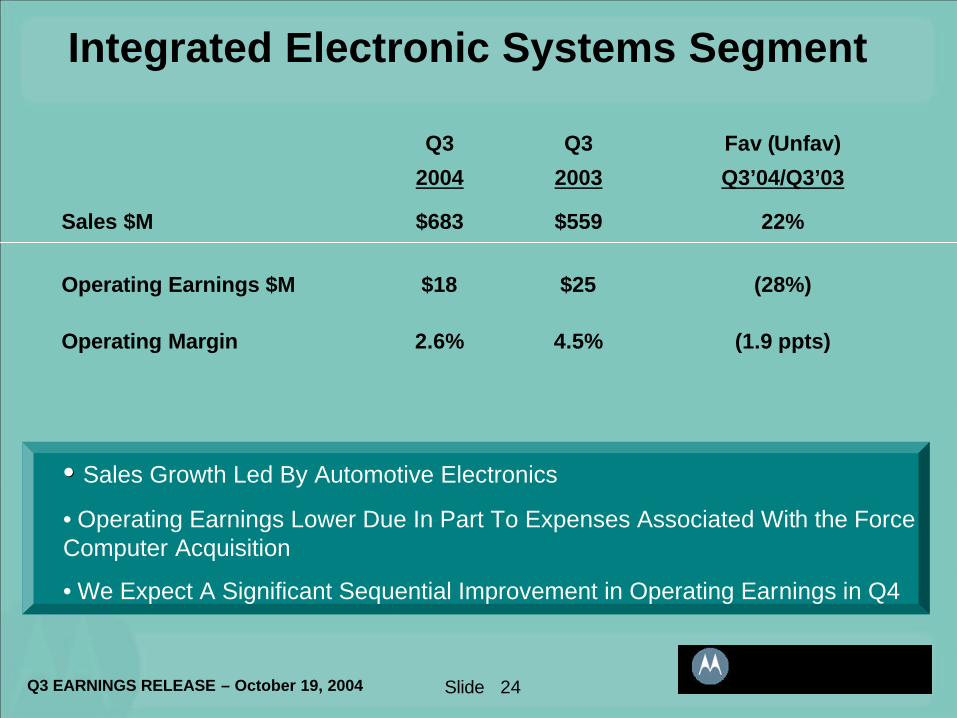
Integrated Electronic Systems Segment
(1.9 ppts)4.5%2.6%Operating Margin
(28%)$25$18Operating Earnings $M
22%$559$683Sales $M
Fav (Unfav)
Q3’04/Q3’03
Q3
2003
Q3
2004
•• Sales Growth Led By Automotive Electronics
• Operating Earnings Lower Due In Part To Expenses Associated With the Force Computer Acquisition
• We Expect A Significant Sequential Improvement in Operating Earnings in Q4
25Q3 EARNINGS RELEASE – October 19, 2004 Slide
Q3’04 IESS – Other Developments
n Automotive Electronics Awarded $700M In New And Replacement Multi-Year Contracts.
n Completed the Acquisition of Force Computers.
26Q3 EARNINGS RELEASE – October 19, 2004 Slide
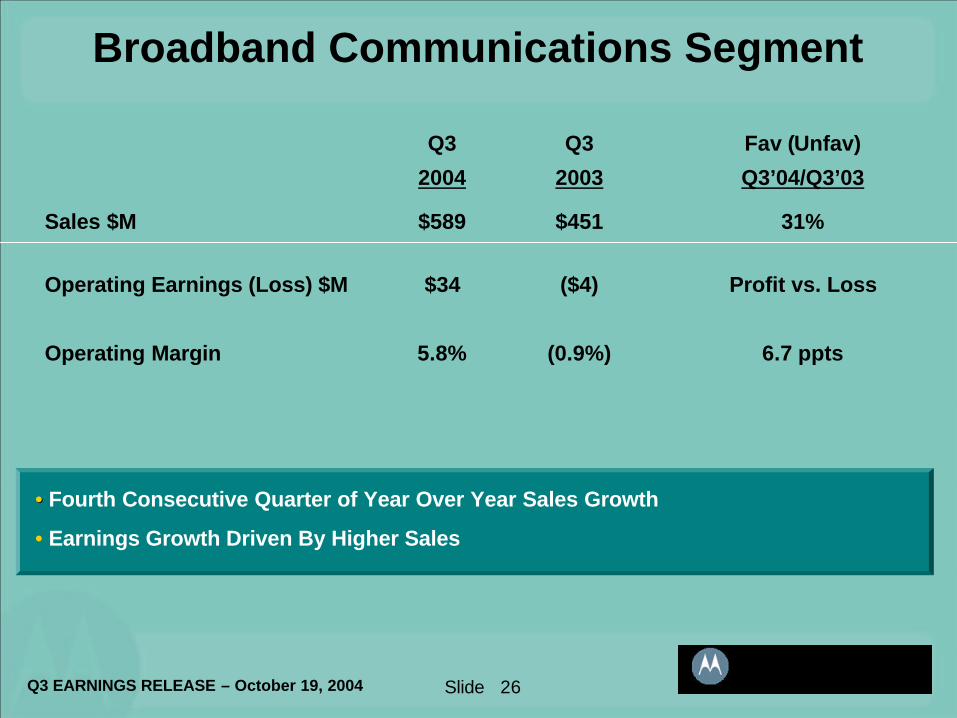
Broadband Communications Segment
6.7 ppts(0.9%)5.8%Operating Margin
Profit vs. Loss($4)$34Operating Earnings (Loss) $M
31%$451$589Sales $M
Fav (Unfav)
Q3’04/Q3’03
Q3
2003
Q3
2004
•• Fourth Consecutive Quarter of Year Over Year Sales Growth
• Earnings Growth Driven By Higher Sales
27Q3 EARNINGS RELEASE – October 19, 2004 Slide
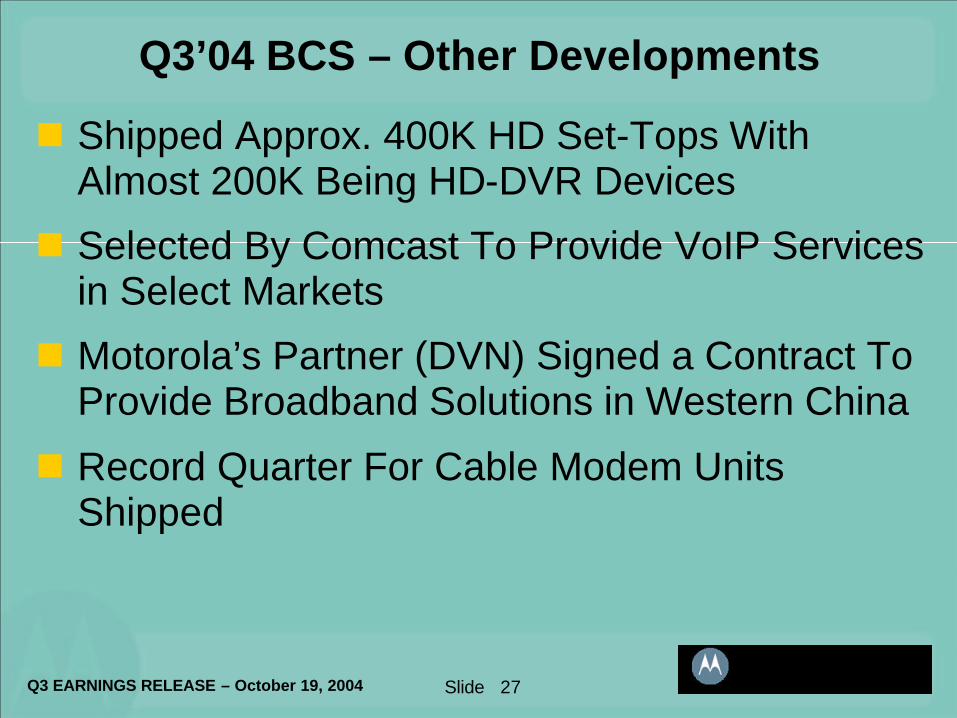
Q3’04 BCS – Other Developments
n Shipped Approx. 400K HD Set-Tops With Almost 200K Being HD-DVR Devices
n Selected By Comcast To Provide VoIP Services in Select Markets
n Motorola’s Partner (DVN) Signed a Contract To Provide Broadband Solutions in Western China
n Record Quarter For Cable Modem Units Shipped
28Q3 EARNINGS RELEASE – October 19, 2004 Slide
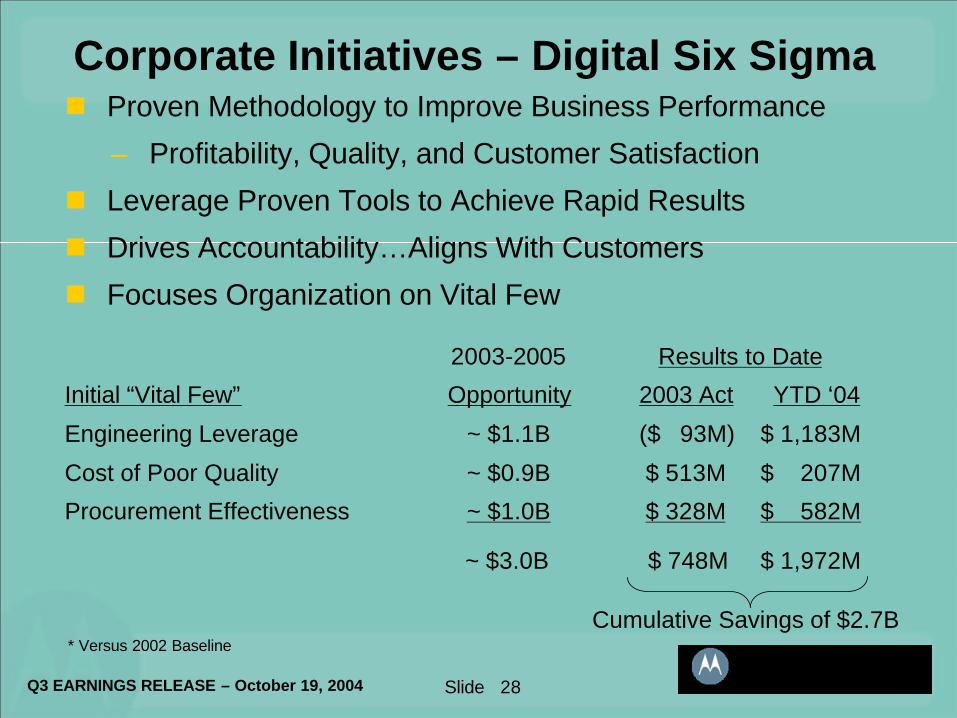
Corporate Initiatives – Digital Six Sigman Proven Methodology to Improve Business Performance
– Profitability, Quality, and Customer Satisfaction
n Leverage Proven Tools to Achieve Rapid Results
n Drives Accountability…Aligns With Customers
n Focuses Organization on Vital Few
2003-2005 Results to Date
Initial “Vital Few” Opportunity 2003 Act YTD ‘04
Engineering Leverage ~ $1.1B ($ 93M) $ 1,183M
Cost of Poor Quality ~ $0.9B $ 513M $ 207M
Procurement Effectiveness ~ $1.0B $ 328M $ 582M
~ $3.0B $ 748M $ 1,972M
* Versus 2002 BaselineCumulative Savings of $2.7B
29Q3 EARNINGS RELEASE – October 19, 2004 Slide
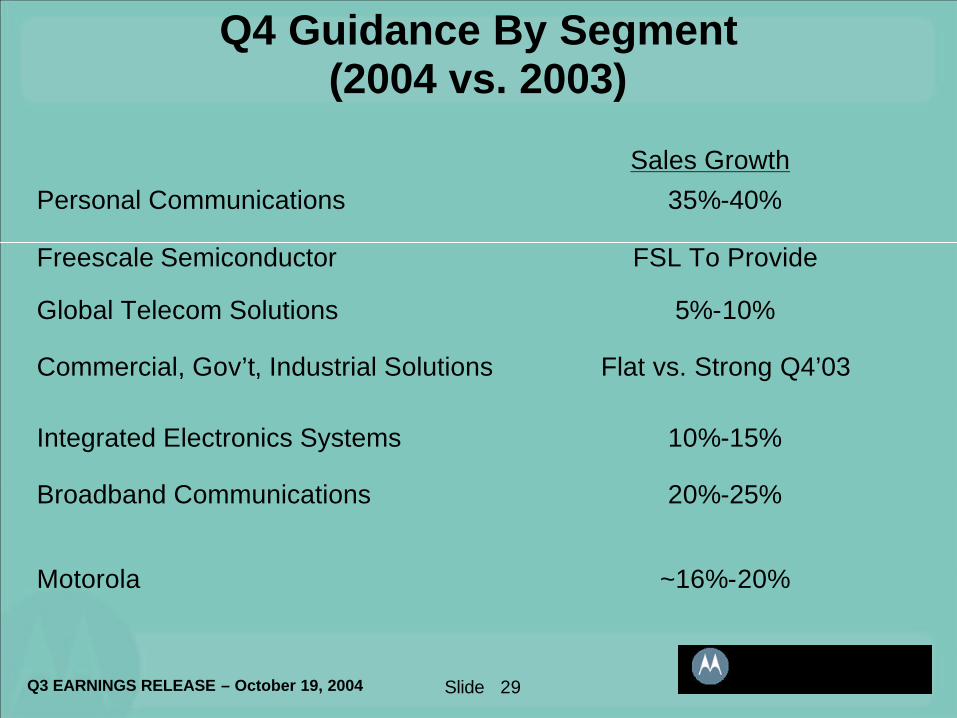
Q4 Guidance By Segment (2004 vs. 2003)
~16%-20%Motorola
20%-25%Broadband Communications
10%-15%Integrated Electronics Systems
Flat vs. Strong Q4’03Commercial, Gov’t, Industrial Solutions
5%-10%Global Telecom Solutions
FSL To ProvideFreescale Semiconductor
35%-40%Personal Communications
Sales Growth
30Q3 EARNINGS RELEASE – October 19, 2004 Slide
Chief Executive OfficerChairman of the Board of Directors
Ed Ed ZanderZander
Motorola Q&A Participants
Mike ZafirovskiMike Zafirovski
Ed GamsEd Gams
President Chief Operating Officer
Senior Vice PresidentDirector of Investor Relations
David DevonshireDavid DevonshireExecutive Vice President
Chief Financial Officer
31Q3 EARNINGS RELEASE – October 19, 2004 Slide
Use of Non-GAAP MeasurementsIn addition to the GAAP results provided during this conference call, non-GAAP measurements,
which present operating earnings on a basis excluding charges relating to the separation of FreescaleSemiconductor, Inc, goodwill impairment, and severance charges have been provided.
Motorola has provided these non-GAAP measurements as a measure to help investors better understand its core operating performance, enhance comparisons of Motorola’s core operating performance from period to period and to allow better comparisons of Motorola’s operating performance to that of its competitors. Among other things, the Company’s management uses these operating results, excluding the identified items, to evaluate the performance of its businesses and to evaluate results relative to incentive compensation targets. Management uses operating results excluding these items because they believe this measure enables them to make better period-to-period evaluations of the financial performance of its core business operations. There are inherent limitations in the use of operating results excluding these items because the company's GAAP results do include the impact of these items. The non-GAAP measures are intended only as a supplement to the comparable GAAP measures and the company compensates for the limitations inherent in the use of non-GAAP measures by using GAAP measures in conjunction with the non-GAAP measures. As a result, investors should consider these non-GAAP measures in addition to, and not in substitution for, or as superior to, measures of financial performance prepared in accordance with GAAP.
Details of the these items and reconciliations of the non-GAAP measurements provided during this call to GAAP measurements can be found: (i) in the Form 8-K filed by Motorola on October 19, 2004 (which attached this afternoon’s earnings press release, and (ii) within the text of the slides that accompany this webcast. Each of these items can be found on Motorola’s website at www.motorola.com/investor
32Q3 EARNINGS RELEASE – October 19, 2004 Slide
Safe Harbor StatementDuring this call we have made a number of forward-looking statements that are based on current expectations and involve risks and uncertainties. Such forward-looking statements include, but are not limited to, our comments and answers relating to the following topics: (1) expectations for Motorola sales and earnings per share for Q4 2004; (2) expectations for sales, profitability, operating earnings, operating margin and market share for each of Motorola’s segments; (3) the timing, sales impact and pricing of new products; (4) potential benefits from Motorola’s process optimization activities; (5) Motorola’s ability to successfully distribute its remaining ownership of FSL in a timely manner and (6) the impact of the distribution of the remaining interest in FSL and Motorola’s future plans with respect to its other businesses..
Motorola’s actual results could differ materially from those stated in the forward looking statements and information about factors that could cause such differences can be found in this afternoon's press release, on pages 76 through 85 in Motorola’s 2003 Annual Report on Form 10-K.
33Q3 EARNINGS RELEASE – October 19, 2004 Slide
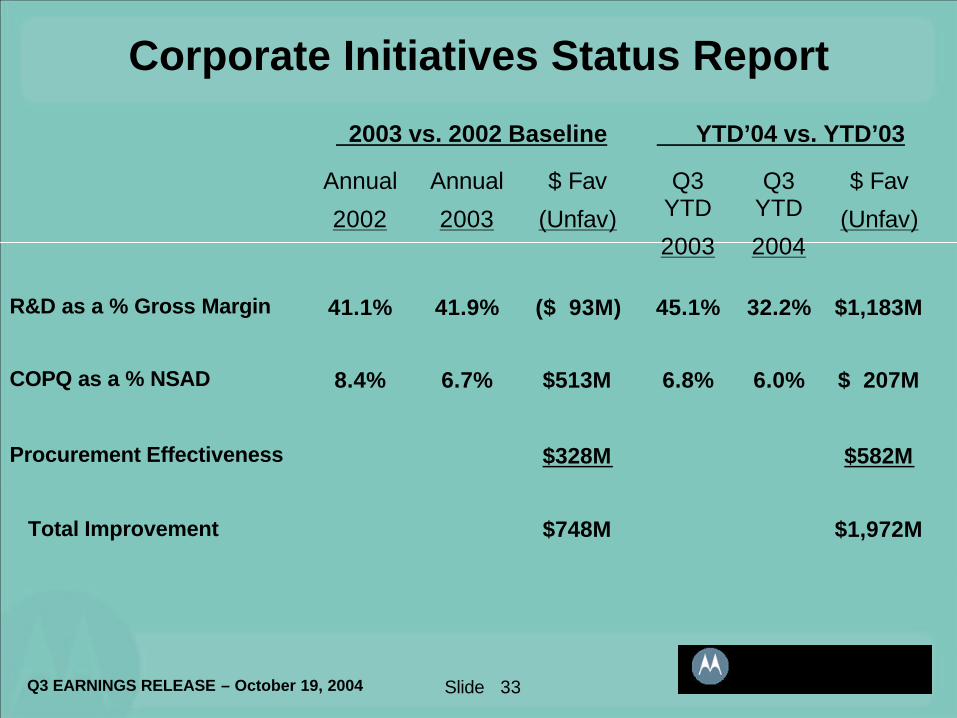
Corporate Initiatives Status Report
6.8%
45.1%
Q3 YTD
2003
$1,972M$748MTotal Improvement
$582M$328MProcurement Effectiveness
$ 207M6.0%$513M6.7%8.4%COPQ as a % NSAD
$1,183M32.2%($ 93M)41.9%41.1%R&D as a % Gross Margin
$ Fav
(Unfav)
Q3 YTD
2004
$ Fav
(Unfav)
Annual
2003
Annual
2002
2003 vs. 2002 Baseline YTD’04 vs. YTD’03
34Q3 EARNINGS RELEASE – October 19, 2004 Slide
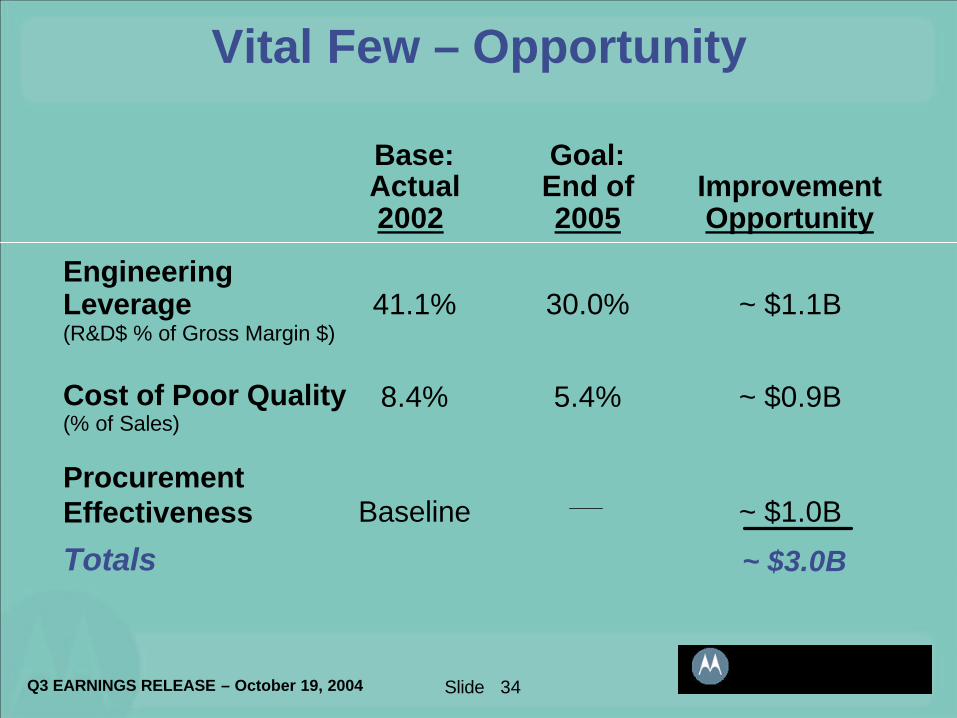
Vital Few – Opportunity
Engineering Leverage(R&D$ % of Gross Margin $)
Cost of Poor Quality(% of Sales)
Procurement Effectiveness
Base:Actual2002
Goal:End of2005
Improvement Opportunity
41.1%
8.4%
Baseline
30.0% ~ $1.1B
5.4% ~ $0.9B
~ $1.0B
Totals ~ $3.0B
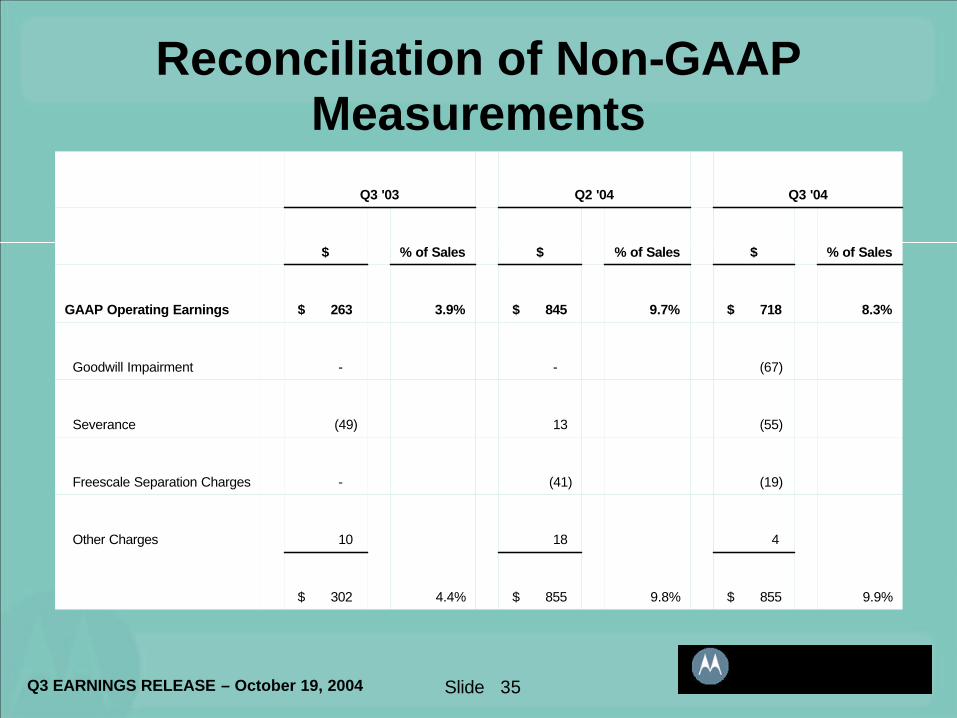
35Q3 EARNINGS RELEASE – October 19, 2004 Slide
9.9%$ 855 9.8%$ 855 4.4%$ 302
4 18 10 Other Charges
(19)(41)-Freescale Separation Charges
(55)13 (49)Severance
(67)--Goodwill Impairment
8.3%$ 718 9.7%$ 845 3.9%$ 263 GAAP Operating Earnings
% of Sales$% of Sales$% of Sales$
Q3 '04Q2 '04Q3 '03
Reconciliation of Non-GAAP Measurements